When do host–parasite interactions drive the evolution of ...
25
LETTER When do host–parasite interactions drive the evolution of non-random mating? Scott L. Nuismer, 1 * Sarah P. Otto 2 and Franc ¸ ois Blanquart 1,3 1 Department of Biological Sciences, University of Idaho, Moscow, ID 83844, USA 2 Department of Zoology, University of British Columbia, Vancouver, BC, Canada, V6T 1Z4 3 E ´ cole Normale Supe ´ rieure, 45 rue dÕUlm, Paris, 75005, France *Correspondence: E-mail: [email protected] Abstract Interactions with parasites may promote the evolution of disassortative mating in host populations as a mechanism through which genetically diverse offspring can be produced. This possibility has been confirmed through simulation studies and suggested for some empirical systems in which disassortative mating by disease resistance genotype has been documented. The generality of this phenomenon is unclear, however, because existing theory has considered only a subset of possible genetic and mating scenarios. Here we present results from analytical models that consider a broader range of genetic and mating scenarios and allow the evolution of non-random mating in the parasite as well. Our results confirm results of previous simulation studies, demonstrating that coevolutionary interactions with parasites can indeed lead to the evolution of host disassortative mating. However, our results also show that the conditions under which this occurs are significantly more fickle than previously thought, requiring specific forms of infection genetics and modes of non-random mating that do not generate substantial sexual selection. In cases where such conditions are not met, hosts may evolve random or assortative mating. Our analyses also reveal that coevolutionary interactions with hosts cause the evolution of non-random mating in parasites as well. In some cases, particularly those where mating occurs within groups, we find that assortative mating evolves sufficiently to catalyze sympatric speciation in the interacting species. Keywords Assortative mating, coevolution, disassortative mating, major histocompatibility complex, sympatric speciation. Ecology Letters (2008) 11: 937–946 INTRODUCTION Parasites have frequently been invoked as a source of selection favouring host individuals that generate genetically diverse offspring. For instance, the Red Queen hypothesis posits that interactions with parasites favour host individuals that reproduce sexually. This hypothesis has been extensively explored both theoretically (e.g. Hamilton 1980; Howard & Lively 1998; Peters & Lively 1999; Agrawal 2006; Gandon & Otto 2007) and empirically (e.g. Dybdahl & Lively 1998; Lively et al. 2004) and shown to work within a narrow range of conditions. Specifically, for interactions with parasites to favour sexual reproduction in hosts, selection must be very strong, and resistance to infection must be mediated by only a few genetic loci (Otto & Nuismer 2004). Host individuals could also produce genetically diverse and potentially more resistant offspring by mating prefer- entially with genetically dissimilar individuals (e.g. Potts et al. 1994; Penn & Potts 1999; Hedrick 2002; Howard & Lively 2004; Milinski 2006). Much of the empirical evidence for this possibility comes from studies of mate preference in vertebrates with respect to major histocompatibility com- plex (MHC) genotypes. Specifically, studies of mate prefer- ence in multiple vertebrate species have demonstrated that females prefer to mate with males whose MHC genotype is different from their own (Penn & Potts 1999; Landry et al. 2001; Schwensow et al. 2008). Because heterozygosity at MHC loci has been shown to be associated with resistance to parasites and pathogens (e.g., Penn et al. 2002; Froeschke & Sommer 2005; Westerdahl et al. 2005), these studies suggest a potential role for parasites in observed patterns of disassortative mating in host populations. Unlike the Red Queen hypothesis, the conditions under which coevolution with parasites drives the evolution of Ecology Letters, (2008) 11: 937–946 doi: 10.1111/j.1461-0248.2008.01207.x Ó 2008 Blackwell Publishing Ltd/CNRS
Transcript of When do host–parasite interactions drive the evolution of ...

L E T T E RWhen do host–parasite interactions drive the
evolution of non-random mating?
Scott L. Nuismer,1* Sarah P.
Otto2 and Francois Blanquart1,3
1Department of Biological
Sciences, University of Idaho,
Moscow, ID 83844, USA2Department of Zoology,
University of British Columbia,
Vancouver, BC, Canada, V6T 1Z43Ecole Normale Superieure, 45
rue d�Ulm, Paris, 75005, France
*Correspondence: E-mail:
Abstract
Interactions with parasites may promote the evolution of disassortative mating in host
populations as a mechanism through which genetically diverse offspring can be
produced. This possibility has been confirmed through simulation studies and suggested
for some empirical systems in which disassortative mating by disease resistance genotype
has been documented. The generality of this phenomenon is unclear, however, because
existing theory has considered only a subset of possible genetic and mating scenarios.
Here we present results from analytical models that consider a broader range of genetic
and mating scenarios and allow the evolution of non-random mating in the parasite as
well. Our results confirm results of previous simulation studies, demonstrating that
coevolutionary interactions with parasites can indeed lead to the evolution of host
disassortative mating. However, our results also show that the conditions under which
this occurs are significantly more fickle than previously thought, requiring specific forms
of infection genetics and modes of non-random mating that do not generate substantial
sexual selection. In cases where such conditions are not met, hosts may evolve random
or assortative mating. Our analyses also reveal that coevolutionary interactions with
hosts cause the evolution of non-random mating in parasites as well. In some cases,
particularly those where mating occurs within groups, we find that assortative mating
evolves sufficiently to catalyze sympatric speciation in the interacting species.
Keywords
Assortative mating, coevolution, disassortative mating, major histocompatibility
complex, sympatric speciation.
Ecology Letters (2008) 11: 937–946
I N T R O D U C T I O N
Parasites have frequently been invoked as a source of
selection favouring host individuals that generate genetically
diverse offspring. For instance, the Red Queen hypothesis
posits that interactions with parasites favour host individuals
that reproduce sexually. This hypothesis has been extensively
explored both theoretically (e.g. Hamilton 1980; Howard &
Lively 1998; Peters & Lively 1999; Agrawal 2006; Gandon &
Otto 2007) and empirically (e.g. Dybdahl & Lively 1998;
Lively et al. 2004) and shown to work within a narrow range
of conditions. Specifically, for interactions with parasites to
favour sexual reproduction in hosts, selection must be very
strong, and resistance to infection must be mediated by only
a few genetic loci (Otto & Nuismer 2004).
Host individuals could also produce genetically diverse
and potentially more resistant offspring by mating prefer-
entially with genetically dissimilar individuals (e.g. Potts et al.
1994; Penn & Potts 1999; Hedrick 2002; Howard & Lively
2004; Milinski 2006). Much of the empirical evidence for
this possibility comes from studies of mate preference in
vertebrates with respect to major histocompatibility com-
plex (MHC) genotypes. Specifically, studies of mate prefer-
ence in multiple vertebrate species have demonstrated that
females prefer to mate with males whose MHC genotype is
different from their own (Penn & Potts 1999; Landry et al.
2001; Schwensow et al. 2008). Because heterozygosity at
MHC loci has been shown to be associated with resistance
to parasites and pathogens (e.g., Penn et al. 2002; Froeschke
& Sommer 2005; Westerdahl et al. 2005), these studies
suggest a potential role for parasites in observed patterns of
disassortative mating in host populations.
Unlike the Red Queen hypothesis, the conditions under
which coevolution with parasites drives the evolution of
Ecology Letters, (2008) 11: 937–946 doi: 10.1111/j.1461-0248.2008.01207.x
� 2008 Blackwell Publishing Ltd/CNRS
disassortative mating in host populations have been subject
to only limited theoretical investigation. Specifically, How-
ard & Lively (2003) used simulation models to study the
evolution of disassortative mating in coevolving populations
of hosts and parasites. Their results showed that alleles
increasing female preference for genetically dissimilar males
spread when rare in host populations. Because their
simulations assumed that coevolution and mate choice are
mediated by haploid loci and that all females are guaranteed
to mate, the generality of their result remains unclear.
Virtually no effort has been spent evaluating whether
coevolution with hosts drives the evolution of assortative
mating in parasites. Previous studies have demonstrated
host–parasite interactions favour parasites that reduce the
number of allelic copies they express, either by reducing
their ploidy (Nuismer & Otto 2004) or by expressing only a
single gene copy (Nuismer & Otto 2005), which suggests
that interactions with hosts may favour parasites that mate
assortatively. Specifically, assortative mating is an additional
mechanism through which parasites could conceivably
decrease the number of allelic copies expressed, albeit
indirectly through the formation of homozygous offspring.
Our goal here is to develop and analyse a set of
mathematical models to study the evolution of non-random
mating in coevolving populations of hosts and parasites. By
considering multiple genetic systems of pathogen resistance,
diverse mating ecologies and multiple genetic mechanisms
of mate recognition, we hope to generalize previous
theoretical studies suggesting that parasites can drive the
evolution of disassortative mating in host populations.
Because our models allow non-random mating to evolve in
the parasite as well as in the host, we expect our models to
yield novel predictions for the conditions under which
coevolution with a host population promotes assortative
mating and potentially sympatric speciation in parasite
populations.
M O D E L D E S C R I P T I O N
We tracked evolutionary change in host and parasite
genotype frequencies over a life cycle where species
interactions were followed by mating and formation of
the next generation through recombination and segrega-
tion. Both host and parasite were assumed to be
hermaphroditic organisms characterized by two diallelic
diploid loci and population sizes sufficiently large for the
effects of genetic drift to be ignored. The first locus �M�was assumed to modify the intensity of non-random
mating and to have two alleles M and m. The second locus
�B� was assumed to mediate species interactions and mating
preferences and to have two alleles B and b. Because the
loci involved in mate choice and host–parasite interactions
are one and the same (so that associations between these
two processes cannot be broken apart by recombination),
our modelling framework focuses on a scenario that is
particularly conducive to the evolution of non-random
mating (Gavrilets 2004). There is evidence, however, that
this may be the case for some loci involved in pathogen
recognition and mate choice, such as vertebrate MHC loci
(e.g. Penn & Potts 1999). Our analyses rely heavily on the
work of Kirkpatrick et al. (2002), and we have attempted to
maintain consistency with their notation. Table 1 summa-
rizes the key parameters and variables and their biological
interpretation; a companion Mathematica notebook is
available upon request.
Species interactions
Host and parasite were assumed to encounter one another
at random, with the outcome of encounters (either infection
or resistance) depending on the diploid genotypes of host
and parasite at the �B� locus. We assume that B locus
genotypes of host and parasite interact following one of the
three commonly used models of host resistance to parasites
(Table 2). The inverse matching-alleles (IMA) model is
predicated on hosts having a suite of recognition molecules
capable of binding to a particular suite of pathogen antigens,
in a manner similar to the vertebrate MHC system (Frank
2002). The gene-for-gene (GFG) model has been shown to
be common in interactions between plants and pathogens,
and is based on a system where avirulent parasites produce
an elicitor that can be recognized by resistant hosts but not
by susceptible hosts and where virulent parasites do not
produce the elicitor (Burdon 1997). The matching-alleles
(MA) model is based on self ⁄ non-self recognition, where
parasites characterized by surface proteins different from
those of the host are recognized as non-self and an immune
response is mounted. The MA model has been suggested to
play a role in invertebrate resistance to pathogens and in the
maturation of the adaptive immune response of vertebrates
(Frank 2002).
We assume that each host encounters at most a single
parasite per generation. Encounters leading to infection
reduce host fitness by some amount sH and encounters
leading to resistance reduce parasite fitness by some amount
sP. With these assumptions, the fitness of a host with
genotype XH is:
W ðXHÞ ¼ ð1� sHÞaðXHÞ � sHðEXP½wðXH;XPÞ�Þ; ð1Þ
where sH is the cost of resistance in the GFG model; a(XH)
is equal to 1 if genotype XH is heterozygous or homozygous
for the resistant B allele and 0 otherwise, making the
empirically motivated assumption that the B resistance allele
is dominant for both resistance and costs (Burdon 1997);
EXP[Æ] denotes an expectation taken over the frequency
938 S. L. Nuismer, S. P. Otto and F. Blanquart Letter
� 2008 Blackwell Publishing Ltd/CNRS

distribution of parasite genotypes and w(XH, XP) is the
probability that parasite genotype XP successfully infects
host genotype XH (Table 2). Similarly, the fitness of a
parasite with genotype XP is:
W ðXPÞ ¼ ð1� sPÞbðXPÞ � sPðEXH½1� wðXH;XPÞ�Þ; ð2Þ
where sP is the cost of virulence in the GFG model; b(XP) is
equal to 1 if genotype XP is homozygous for the virulent B
allele and 0 otherwise, making the empirically motivated
assumption that the B virulence allele is recessive for both
virulence and costs (Burdon 1997) and EXH[Æ] denotes an
expectation taken over the frequency distribution of host
genotypes.
Equations 1 and 2 can be used to calculate the mean
fitness of host and parasite populations:
�WH ¼ EXH½W ðXHÞ� ð3aÞ
�WP ¼ EXP½W ðXPÞ�: ð3bÞ
The first section of the Supporting Information (eqns S1–
S11) shows how eqns 1–3 can be used to calculate the
changes in allele frequencies and statistical associations
within and between loci that result from species interactions.
Mating
Following interactions between species, mating occurs. We
assume that the phenotypic effects of the modifier locus, M,
are restricted to individuals acting as females. Modifiers of
assortative mating cause females to mate with males
genetically similar at the �B� locus more frequently than
expected by chance, whereas modifiers of disassortative
mating cause females to mate with males genetically
Table 1 Summary of model notation
Symbol Meaning
X A genotype vector
Xj Allele carried by an individual at position j
f (X) The frequency of genotype vector X
W(X) The fitness of genotype vector X�W Population mean fitness
Ez[p] The expectation of p taken over the frequency distribution of z
W The set of positions in genotype X contributing to fitness W
U A set of positions in genotype vector X
pi, j The frequency of the �1� or �capital� allele in species i, locus j
fU ¼Qj2U
ðXj � pjÞ A measure of an individual�s deviation from population expectation for set U
Di,U = EX[fU] A measure of the statistical association among alleles in set U for species i
ai,U The �selection coefficient� acting on set U in species i
si The fitness cost of being infected (i = H) or failing to infect (i = P)
si The fitness cost of carrying one or two resistance alleles (i = H) or carrying two virulence
alleles (i = P)
�qi ¼ p2M qMM þ 2pM qM qMm þ q2
M qmm The average level of non-random mating in species i
dq,i ¼ pM(qMM ) qMm) + qM(qMm ) qmm) The effect of the modifier allele M in species i
ri The recombination rate in species i
w(XH, XP) The probability that host genotype XH is infected in an encounter with parasite genotype XP,
given by Table 2
Pi(Xi,m, Xi,f) In the plant and animal models, the probability that male genotype Xi,m is mated in an
encounter with female genotype Xi,f in species i, given by Table 3
Gi,k(Xi,m, Xi,f) The probability that male genotype Xi,m and female genotype Xi,f join mating group k in
species i, given by Table 4
k The probability that a randomly selected host is infected by a randomly selected parasite
q(Xi,f) The intensity with which a female of genotype Xi,f discriminates among male genotypes
Table 2 Genetic models of host resistance to pathogens
Pathogen
genotype
Host genotype
BB Bb bb
BB {R,I,I} {R,I,I} {I,I,R}
Bb {R,R,R} {R,R,I} {R,I,R}
bb {I,R,R} {R,R,I} {R,I,I}
Entries indicate whether a particular host genotype is infected by
(I) or resistant to (R) particular pathogen genotypes. The first entry
in each vector is for the inverse matching-alleles model, the second
for the gene-for-gene model and the third for the matching-alleles
model. The pattern of dominance in the gene-for-gene model is
motivated by empirical data (Burdon 1997).
Letter When do host–parasite interactions drive the evolution of non-random mating? 939
� 2008 Blackwell Publishing Ltd/CNRS
dissimilar at the �B� locus more frequently than expected by
chance. Mate recognition based on �B� locus genotypes is
assumed to be perfect; incorporating errors in mate
recognition would reduce the strength of selection acting
on the modifier (Otto et al. in press). We considered three
models of non-random mating, two based on random
encounters and female preferences (�plant model� and
�animal model�) and one based on the formation of mating
groups (�grouping model�).
The plant model
The plant model assumes that individuals encounter one
another at random and mate with a probability determined by
the female�s M locus genotype, the female�s B locus genotype
and the male�s B locus genotype (Table 3). Because the plant
model assumes that females who decline to mate with a non-
preferred male do not have another chance to mate (as might
be the case in a pollen-limited plant), the plant model
generates strong direct selection against choosy females.
Following Kirkpatrick & Nuismer (2004), we first determine
the fitness of a mated pair in species i:
W ðXi;m;Xi;fÞ ¼ PiðXi;m;Xi;f Þ; ð4Þwhich here equals the probability, Pi(Xi,m, Xi,f), that a male
of species i with genotype Xi,m mates with a female of
species i and genotype Xi,f (Table 3). The mean fitness of
mated pairs in species i is then:
�Wi ¼ EXi;m; Xi;f½W ðXi;m;Xi;fÞ�; ð5Þ
where the notation EXi;m;Xi;f[Æ] indicates an expectation taken
over the frequency distribution of male genotypes, f ( Xi,m),
and female genotypes, Xi,f, in species i. The frequency of a
mated pair consisting of male genotype Xi,m and female
genotype Xi,f after non-random mating is then given by:
f ðXi;m;Xi;fÞ ¼f ðXi;mÞf ðXi;f ÞW ðXi;m;Xi;f Þ
�Wi
: ð6Þ
The animal model
The animal model is identical to the plant model with the
exception that all female genotypes are assumed to have
equal mating success (Kirkpatrick & Nuismer 2004).
Consequently, it does not impose direct costs on choosy
females as does the plant model, although it does generate
strong sexual selection on B locus genotypes. Following
Kirkpatrick & Nuismer (2004), we define the fitness of a
mated pair in species i for the animal model as:
W ðXi;m;Xi;f Þ ¼PiðXi;m;Xi;f Þ
EXi;m½PiðXi;m;Xi;f Þ�
; ð7Þ
where the denominator is the average mating success of a
female with genotype Xi,f, and all other terms are as defined
for the plant model. The frequency of a mated pair con-
sisting of male genotype Xi,m and female genotype Xi,f after
non-random mating is then given by:
f ðXi;m;Xi;fÞ ¼ f ðXi;mÞf ðXi;f ÞW ðXi;m;Xi;f Þ: ð8Þ
The grouping model
Instead of being based on female preferences for males
encountered at random, as are the plant and animal models,
the grouping model is based on a female�s decision to mate
either: (i) within a group or (ii) at random among all groups.
The grouping model does not impose strong direct costs on
choosy females nor does it generate strong sexual selection
on B locus genotypes (Otto et al. in press). The probability
that a female decides to mate within a group is assumed to
be determined by her genotype at the modifier locus M and
is denoted by qi(Xi,f). With these assumptions, the
frequency of a mated pair consisting of male genotype
Xi,m and female genotype Xi,f after non-random mating is:
f ðXi;m;Xi;fÞ
¼ f ðXi;mÞ f ðXi;f Þ�
qiðXi;fÞXNk ¼ 1
Gi;kðXi;mÞGi;kðXi;fÞg i;k
:
þ½1� qiðXi;fÞ��;
ð9Þ
where Gi,k(Xi,m) is the probability that male genotype Xi,m
joins group k, which is assumed to equal Gi,k(Xi,f) for
females with the same genotype (Table 4); N is the number
of groups and g i,k is the proportion of males of species i that
join group k:
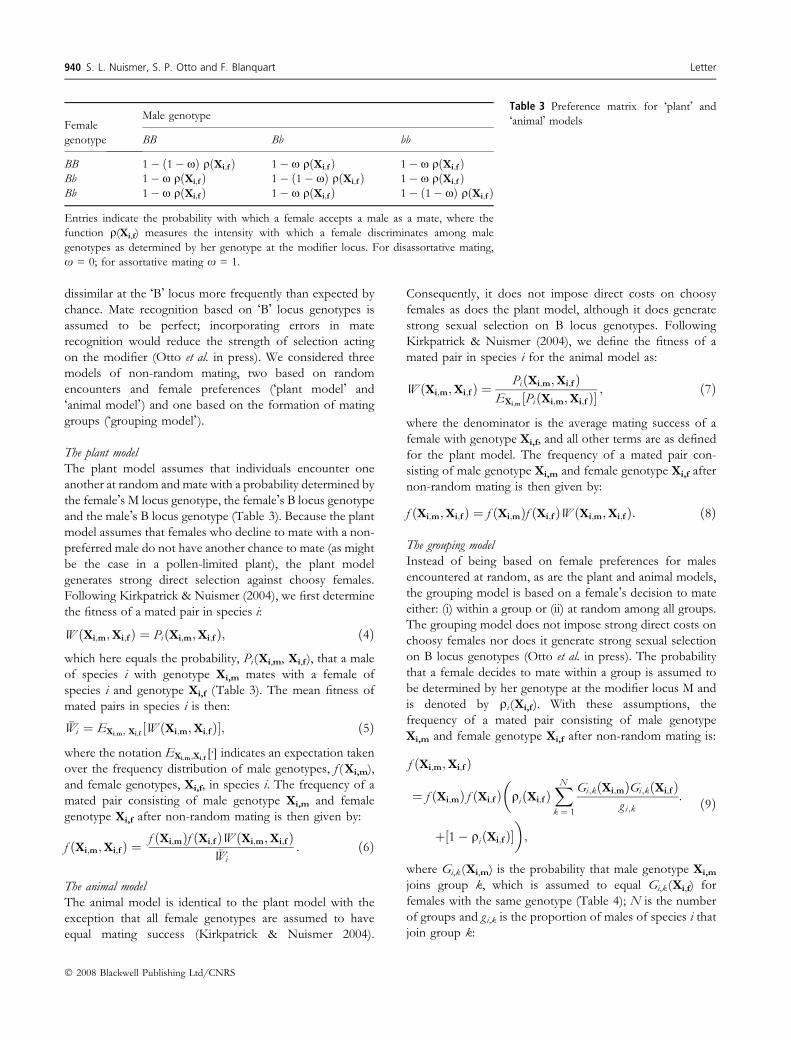
Table 3 Preference matrix for �plant� and
�animal� modelsFemale
genotype
Male genotype
BB Bb bb
BB 1� ð1� xÞ qðXi;f Þ 1� x qðXi;f Þ 1� x qðXi;f ÞBb 1� x qðXi;f Þ 1� ð1� xÞ qðXi;f Þ 1� x qðXi;f ÞBb 1� x qðXi;f Þ 1� x qðXi;f Þ 1� ð1� xÞ qðXi;f Þ
Entries indicate the probability with which a female accepts a male as a mate, where the
function q(Xi,f) measures the intensity with which a female discriminates among male
genotypes as determined by her genotype at the modifier locus. For disassortative mating,
x = 0; for assortative mating x = 1.
940 S. L. Nuismer, S. P. Otto and F. Blanquart Letter
� 2008 Blackwell Publishing Ltd/CNRS

g i;k ¼ EXi;m½Gi;kðXi;mÞ�: ð10Þ
The second section of the Supporting Information (eqn S12)
shows how eqns 6, 8 and 9 can be used to calculate the
changes in allele frequencies and statistical associations
within and between loci that result from non-random
mating.
Recombination and segregation
Following the formation of mated pairs, haploid gametes are
formed via segregation and recombination. Recombination
between the M and B loci is assumed to occur at rate ri in
species i. Gametes then unite at random within each mated
pair to produce diploid offspring. Under these conditions,
segregation and recombination do not change allele fre-
quencies, although they do change the statistical associations
within and between loci. The third section of the Supporting
Information (eqn S13) shows how these statistical associ-
ations change as a consequence of recombination and
segregation.
M O D E L A N A L Y S I S
Quasi-linkage equilibrium approximation
In order to derive analytical solutions for the conditions
leading to the evolution of non-random mating in coevolv-
ing host–parasite interactions, we assumed that coevolu-
tionary selection is relatively weak (s of order e), modifier
alleles have only weak effects (order e) and mating is initially
approximately random. We were then able to use quasi-
linkage equilibrium approximations (Barton & Turelli 1991;
Nagylaki 1993; Kirkpatrick et al. 2002) to derive relatively
simple expressions for the change in the frequency of
modifier alleles in host and parasite (eqns S14–S28). These
results demonstrate that species interactions can, at least
under some conditions, drive the evolution of non-random
mating in both host and parasite. However, our results also
show that the type of mating that evolves (i.e. random,
assortative, disassortative) depends on the mating behaviour
of the species and the genetic mechanism of infection ⁄ resis-
tance mediating interspecific interactions (Table 5).
For both host and parasite, the evolution of non-random
mating is more likely with some mating behaviours than
others. Specifically, our results show that non-random
mating will never evolve in the plant model. The reason
being that the plant model generates strong direct costs of
non-random mating that can never be overcome by any
indirect benefits that accrue through species interactions
(eqn S14). In contrast, the animal model does not generate
direct costs of non-random mating and thus is significantly
more conducive to the evolution of non-random mating.
However, the animal model does induce sexual selection,
which can generate indirect selection on non-random
mating capable of overwhelming indirect selection generated
by species interactions (eqn S15). The last form of mating
behaviour considered, the grouping model, is the most
conducive to the evolution of non-random mating because
it generates no direct costs and only very weak indirect
effects (eqn S22). However, because the grouping model
assumes mating occurs within groups, it can only be used to
gain insight into the evolution of assortative mating, not
disassortative mating.
Although the potential for non-random mating to evolve
is largely determined by mating behaviour, our results
suggest that whether assortative or disassortative mating
evolves in the host and parasite is primarily determined by
the genetic basis of infection ⁄ resistance. Specifically, we find
that the IMA model favours the evolution of disassortative
or random mating in the host, but assortative mating in the
Table 4 Probability of joining mating group j for the grouping
model
Group
Genotype
BB Bb bb
BB 1 0 0
Bb 0 1 0
Bb 0 0 1
Table 5 Evolution of non-random mating in host and parasite
populations
Mechanism of
assortment
Infection genetics
Outcome in hosts Outcome in parasites
IMA GFG* MA IMA GFG* MA
Plant R R R R R R
Animal� D ? A A ? A
Grouping� R ? A A ? A
Entries indicate whether assortative (A), disassortative (D) or
random (R) mating evolves in the host population and parasite
population, based on the analytical results described in the Sup-
porting material.
IMA, inverse matching alleles; GFG, gene-for-gene, MA, matching
alleles.
*For the animal and grouping model, the outcome of the GFG
model depends on the costs of resistance and virulence relative to
selection imposed by species interactions (Supporting material).
�Results for the animal model assume that assortative mating is
weak relative to selection imposed by species interactions (Sup-
porting material).
�Because mating within groups only generates assortative mating,
disassortment was not considered.
?Indicates that analytical predictions are equivocal.
Letter When do host–parasite interactions drive the evolution of non-random mating? 941
� 2008 Blackwell Publishing Ltd/CNRS

parasite (eqns S16, S19, S23 and S26). This result arises
because heterozygous hosts tend to be more resistant than
the average homozygous host but homozygous parasites
tend to be more infectious, on average, than heterozygous
parasites. Although this argument holds for the GFG model
as well, the costs of carrying resistance and virulence alleles
can, in some cases, cause homozygous hosts to have, on
average, greater fitness than heterozygous hosts and
heterozygous parasites to have greater fitness than homo-
zygous parasites, on average. Consequently, whether the
GFG model favours assortative or disassortative mating in
host and parasite depends on the relative magnitudes of
fitness gains accruing through infection ⁄ resistance and
fitness losses accruing through costs of resistance and
virulence, which in turn depend on the allele frequencies in
hosts and parasites (eqns S17, S20, S24 and S27). Finally, our
results show that the MA model favours hosts and parasites
that mate assortatively, because of the increased resistance
of homozygous hosts, which are harder to mimic, and the
increased infectivity of homozygous parasites, which are
harder to recognize, relative to heterozygotes (eqns S18,
S21, S25 and S28).
Numerical simulation and extension to multiple loci
We developed deterministic multi-locus simulations to
evaluate whether our analytical results were robust to strong
selection, modifiers of large effect, and cases where mate
choice and species interactions were mediated by multiple
loci. An additional goal of these simulations was to clarify
the pattern of non-random mating expected to evolve in the
GFG model, for which our analytical results were incon-
clusive. Simulations assumed that both host and parasite had
genomes consisting of a single modifier locus with alleles M
and m, located at the terminus of the chromosome, along
with an additional set of n loci with alleles �0� or �1�, which
mediated interactions with the other species as well as mate
choice. Recombination between adjacent loci was assumed
to occur at a rate of ri in species i, and loci mediating mate
choice and species interactions were assumed to mutate with
probability 5 · 10)6 (mutation at the modifier locus was
ignored). As with our analytical model, the life cycle was: (i)
species interactions, (ii) mating and (iii) offspring produc-
tion. Because simulations were developed using many of the
same assumptions and equations as the analytical model, we
describe in detail only those aspects of the simulations that
differed significantly from our analytical model. Simulation
source code (C++) is available upon request.
The frequency of host genotype XH after interactions
with the parasite is:
f 0ðXHÞ ¼ f ðXHÞW ðXHÞ
�WH
ð11Þ
and the frequency of parasite genotype XP after interactions
with the host is:
f 0ðXPÞ ¼ f ðXPÞW ðXPÞ
�WP
; ð12Þ
where all terms are as defined for the analytical model but
extended to multiple loci with the following assumptions.
First, costs of resistance and virulence in the GFG model
were assumed to be multiplicative such that the a[XH] term
in eqn 1 equals the number of loci heterozygous or
homozygous for the resistant �1� allele and the b[XP] term in
eqn 2 equals the number of loci homozygous for the viru-
lent �1� allele. Second, the probability that parasite genotype
XP infects host genotype XH was determined in the fol-
lowing way. For each locus other than the modifier, the
outcome of the interaction (infection or resistance) was
determined using Table 2. Only if the outcome of the
interaction was infected for all loci did the parasite succeed
in infecting the host. Consequently, the fraction of host
genotypes resistant to any particular parasite genotype
generally increased with increasing numbers of loci. We did
not consider other biologically plausible scenarios such as
the case where each locus contributes only partial resistance
(Sasaki 2000).
Among individuals that have survived host–parasite
selection (eqns 11 and 12), the frequency of mated pairs
was calculated using eqns 6, 8 and 9 by making the following
assumptions regarding multi-locus interactions. First, we
assumed that non-random mating depended on the exact
diploid genotype of potential mates, where individuals
discriminated between their own genotype and all other
genotypes equally, with no distinction made based on
quantitative similarity. That said, we assumed that individ-
uals did not discriminate among differences based solely on
the parent of origin. For example, an individual with
paternal haplotype {0,0} and maternal haplotype {0,1}
would recognize as different a mate consisting of paternal
and maternal haplotypes {1,0} and {0,0} but not a mate
carrying haplotypes {0,1} and {0,0}.
Offspring were produced from mated pairs such that the
frequency of genotype Xi in the offspring generation was
f 000ðXiÞ ¼ EXi;mXi;f½MðXi;Xi;m;Xi;fÞ�; ð13Þ
where EXi;mXi;f[Æ] indicates an expectation taken over the
frequency distribution of mated pairs, and M(Xi, Xi,m, Xi,f)
is the probability that a mating between a male of genotype
Xi,m and a female of genotype Xi,f, produces an offspring
of genotype Xi.
We used these simulations to explore the evolution of
modifiers of non-random mating across a broad range of
parameter conditions, restricting our attention to cases
where non-random mating evolved in only one species at a
time. Specifically, we ran simulations for genomes consisting
942 S. L. Nuismer, S. P. Otto and F. Blanquart Letter
� 2008 Blackwell Publishing Ltd/CNRS

of one or two loci mediating species interactions (plus a
modifier of mating), where parameters were chosen at
random from uniform distributions on the following
intervals: {0 £ sH £ 1.0}, {0 £ sP £ 1.0}, {0.05 sH £ sH £0.45 sH}, {0.05 sP £ sP £ 0.45 sP}, {0 £ rH £ 0.5} and
{0 £ rP £ 0.5}. In all cases, we assumed modifiers of non-
random mating had additive effects, such that genotype mm
mated at random, genotype MM mated non-randomly and
genotype Mm exhibited exactly intermediate levels of non-
random mating. For the plant and animal models, we
considered modifiers with effects drawn from uniform
distributions on {)0.10 £ qH, MM £ 0.10} and {)0.10 £qP, MM £ 0.10}. For the grouping model, we considered
only modifiers of assortative mating, and thus the effects of
the modifier were drawn from uniform distributions on:
{0.0 £ qH, MM £ 0.10} and {0.0 £ qP, MM £ 0.10}.
At the beginning of each simulation, the frequency of the
modifier allele was set to 0.01, and allele frequencies at loci
involved in species interactions and mate recognition were
chosen at random from the interval {0,1}. The frequency of
the modifier allele was then tracked over 10 000 genera-
tions. If the average modifier frequency over the final 1500
generations was > 0.011, the modifier was considered to
have increased in frequency or spread. For each of the nine
models (three models of infection genetics and three models
of non-random mating), we ran 300 simulations. Thus the
results reported in Table 6 for the two locus case are based
on a total of 2700 simulation runs. Because the results for
the case of three loci are quite similar, we report the results
from these additional simulations in the Supporting
Information (Table S1).
Results of simulations are in broad qualitative agreement
with our analytical predictions for the IMA and MA models
(Table 6), and generate predictions for the GFG model
(Table 6). However, simulations also reveal that our analyt-
ical predictions are not perfect, with non-random mating
failing to evolve in some simulation runs (compare Table 5
with Table 6). This discrepancy is most notable for the MA
and IMA models of resistance when non-random mating is
mediated by the animal model. There are at least two
explanations for this discrepancy. First, the MA model
generates underdominant selection in both species and does
not efficiently maintain genetic polymorphism at the
mating ⁄ interaction loci in diploid models (eqns S6b and
S7b and Nuismer 2006). Consequently, in many cases,
polymorphism may be eroded before any significant modifier
evolution occurs. Second, the summary provided in Table 5
assumes that mating is nearly random (i.e. sexual selection is
weak, so that eqn S15 is small relative to eqns S16–S21). In
the animal model, modifier alleles causing substantial levels
of non-random mating can induce sufficient sexual selection
to violate this assumption, in which case the more detailed
results in the Supporting Information should be used.
We next used simulations to evaluate the potential for
very strong assortative mating, and thus incipient sympatric
speciation, to evolve in the host and parasite. We restricted
these simulations to the animal and grouping models as
non-random mating never evolves in the plant model. For
each combination of infection genetics and mating behav-
iour, we ran 75 simulations with modifiers inducing very
strong host assortment {0.96 £ qH, MM £ 1.00} and an
additional 75 simulations with modifiers inducing very
strong parasite assortment {0.96 £ qP, MM £ 1.00}. In each
simulation, we evaluated whether the modifier approached
fixation (average modifier frequency >0.99 over the final
500 generations) by generation 10 000. In all other respects,
these simulations were identical to those previously
described.
The results of our speciation simulations are reported in
Table 7, and demonstrate that interactions between hosts
and parasites can promote sympatric speciation. This is
particularly likely when assortative mating occurs through a
mechanism of group formation. In this case, parasite
speciation occurs for all models of infection ⁄ resistance,
Table 6 Percentage of two-locus simulations in which assortative
mating (top entry) and disassortative mating (bottom entry)
evolved in the host and parasite
Mechanism
of assortment
Infection genetics (%)
Outcome in hosts Outcome in parasites
IMA GFG MA IMA GFG MA
Plant 0.0 0.0 0.0 0.0 0.0 0.0
0.0 0.0 0.0 0.0 0.0 0.0
Animal 0.0 0.0 15.1 59.0 0.0 18.6
64.4 24.4 0.0 0.0 29.3 0.0
Grouping 0.0 41.3 80.7 96.0 46.7 82.7
NA NA NA NA NA NA
IMA, inverse matching alleles; GFG, gene-for-gene; MA, matching
alleles.
Table 7 The evolution of high levels of assortment
Mechanism of
assortment
Infection genetics (%)
Outcome in hosts Outcome in parasites
IMA GFG MA IMA GFG MA
Animal 0.0 0.0 0.0 24.0 0.0 1.3
Grouping 0.0 77.3 92.0 98.7 60.0 85.3
Entries give the percentage of two-locus simulations that led to
incipient speciation for the host and the parasite.
IMA, inverse matching alleles; GFG, gene-for-gene; MA, matching
alleles.
Letter When do host–parasite interactions drive the evolution of non-random mating? 943
� 2008 Blackwell Publishing Ltd/CNRS

and host speciation occurs readily for the GFG and MA
models. If, in contrast, assortative mating is mediated by the
animal model, speciation occurs with significant frequency
only in the parasite when infection ⁄ resistance follows an
IMA model. The reason the grouping model is so
permissive of sympatric speciation is that it does not
impose direct costs of assortative mating and leads to only
very weak sexual selection (S22). Consequently, any genetic
mechanism of infection ⁄ resistance that causes heterozygotes
to be consistently less fit than the average homozygote,
and maintains genetic polymorphism, will ultimately cause
speciation.
D I S C U S S I O N
Overall, the results of our models show that coevolution
between hosts and parasites can promote the evolution of
non-random mating. However, our results also reveal that
significant levels of non-random mating are likely to
evolve only in those species where mating does not
impose strong direct costs or frequency-dependent effects.
In addition, our results demonstrate that whether assor-
tative or disassortative mating evolves depend primarily on
the genetic mechanism of resistance. As a gross general-
ization, disassortative mating is more likely to evolve in
hosts than in parasites, and assortative mating is more
likely to evolve in parasites than in hosts. Where mating
imposes no direct costs and only very weak frequency
dependence, as when non-random mating arises from
mating within groups of similar genotypes, we find that
assortative mating can evolve to high enough levels to
cause sympatric speciation.
Whether a particular type of infection genetics favours
the evolution of assortative or disassortative mating depends
on its consequences for the expected fitness of heterozyg-
otes relative to homozygotes. For the IMA model,
heterozygous hosts tend to be more resistant than homo-
zygous hosts, but homozygous parasites tend to be more
infectious than heterozygous parasites. Consequently, the
IMA model favours disassortative mating in the host
population but assortative mating in the parasite population.
Although this argument also holds for the GFG model
when constitutive costs of resistance ⁄ virulence are absent,
incorporating such costs causes increased resistance ⁄ infec-
tivity to become negatively associated with fitness under
some conditions. When this occurs, the fitness of homo-
zygous hosts may exceed that of heterozygous hosts, and
the fitness of heterozygous parasites may exceed that of
homozygous parasites. Consequently, whether the GFG
model favours assortative or disassortative mating depends
on the magnitude of fitness costs of resistance ⁄ infectivity
relative to the magnitude of fitness gains accrued through
increased resistance ⁄ infectivity. In contrast to the IMA and
GFG models, the MA model causes homozygous hosts to
be more resistant than heterozygous hosts (because homo-
zygotes carry fewer alleles to mimic), and thus favours the
evolution of assortative mating in both host and parasite.
Our results for the MA model conflict with those of
Howard & Lively (2003, 2004) who found that coevolution
in an MA model commonly favoured the evolution of
disassortative mating in host populations. This discrepancy
likely arises because the model of Howard & Lively (2003,
2004) assumes selection acts on haploids whereas our
models assume selection acts on diploids. Consequently,
non-random mating evolves in response to epistatic
interactions in the model of Howard & Lively (2003,
2004), but in response to dominance interactions in our
two-locus analytical model and two-locus simulations.
Because our three-locus simulations yield qualitatively
similar results to our two-locus simulations, however, it
seems that – at least for modest numbers of loci – it is
dominance interactions that determine the type of non-
random mating that evolves.
In addition to demonstrating the importance of the
genetic basis of resistance and infection, our results show
that the mating behaviour of the interacting species
determines if, and to what extent, non-random mating
evolves. Specifically, our results show that non-random
mating never evolves in the plant model, evolves with
modest frequency in the animal model and readily evolves in
the grouping model (Table 6). The primary difference
between these models is the extent to which they generate
costs and impose sexual selection, with the plant model
generating the strongest costs and the grouping model the
weakest. Sexual selection can inhibit the evolution of non-
random mating by reversing the fitness difference between
heterozygotes and homozygotes or by eliminating polymor-
phism at mating trait loci (as in the animal model) (Otto
et al. in press). That mating behaviour plays an important
role in determining the fate of modifiers of disassortative
mating may explain why some studies of mate preference
based on disease-resistance genotype have found evidence
for disassortative mating (Penn & Potts 1999; Milinski 2006)
whereas others have not (Ekblom et al. 2004; Milinski 2006).
Our results also suggest that host–parasite interactions
promote sympatric speciation in some cases. Specifically, we
find that incipient sympatric speciation evolves readily in
both host and parasite when assortative mating is mediated
by the grouping model. These results provide further
evidence that ecological interactions between individuals
and species may be important catalysts for sympatric
speciation (e.g. Doebeli 1996; Dieckmann & Doebeli
1999; Doebeli & Dieckmann 2000, 2003; Dieckmann et al.
2004) but also that direct fitness costs and frequency-
dependent selection caused by sexual selection can inhibit
sympatric speciation (e.g. Otto et al. in press; Gavrilets 2004;
944 S. L. Nuismer, S. P. Otto and F. Blanquart Letter
� 2008 Blackwell Publishing Ltd/CNRS

Kirkpatrick & Nuismer 2004; Waxman & Gavrilets 2005). It
may thus be little surprise that some of the best studied
cases of putative sympatric speciation in parasitic taxa occur
in insect parasites of plants that follow a grouping model
where mating occurs on the host plant, minimizing the
importance of sexual selection (Craig et al. 1993; Bush 1994;
Via 1999).
Together, the results of our models demonstrate that
coevolution between hosts and parasites can be an
important force driving the evolution of non-random
mating. In addition to this very broad prediction, our
models generate several more specific and empirically
testable predictions. One of the most interesting is that
plant species which are not pollen limited should frequently
mate disassortatively with respect to disease-resistance loci if
such loci operate through a GFG or IMA mechanism. In a
similar vein, our results suggest that diploid parasites should
frequently mate assortatively at those loci involved in
immune recognition, at least when such immunity is based
on an MA or IMA mechanism and costs of assortative
mating are not strong. Testing these and other predictions
of our models should help to clarify the role coevolution
plays in shaping patterns of non-random mating in hosts
and parasites and may also provide valuable insights into the
genetic basis of infection and resistance.
A C K N O W L E D G E M E N T S
We thank Ben Ridenhour, Peter Thrall and three anony-
mous referees for their helpful comments. Funding was
provided by NSF grants DEB 0343023 and DMS 0540392
to SLN, by the Natural Sciences and Engineering Research
Council of Canada (SPO) and by the National Evolutionary
Synthesis Center (NSF #EF-0423641; SPO).
R E F E R E N C E S
Agrawal, A.F. (2006). Similarity selection and the evolution of sex:
revisiting the red queen. PLOS Biol., 4, 1364–1371.
Barton, N.H. & Turelli, M. (1991). Natural and sexual selection on
many loci. Genetics, 127, 229–255.
Burdon, J.J. (1997). The evolution of gene-for-gene interactions in
natural pathosystems. In: The Gene-for-Gene Relationship in Plant-
Parasite Interactions (eds Crute, I.R., Holub, E.B. & Burdon, J.J.).
CAB International, Wallingford, UK, pp. 245–262.
Bush, G.L. (1994). Sympatric speciation in animals: new wine in old
bottles. TREE, 9, 285–288.
Craig, T.P., Itami, J.K., Abrahamson, W.G. & Horner, J.D. (1993).
Behavioral evidence for host-race formation in Eurosta solidaginis.
Evolution, 47, 1696–1710.
Dieckmann, U. & Doebeli, M. (1999). On the origin of species by
sympatric speciation. Nature, 400, 354–357.
Dieckmann, U., Doebeli, M., Metz, J.A.J. & Tautz, D. (2004).
Adaptive Speciation. Cambridge University Press, Cambridge,
UK.
Doebeli, M. (1996). A quantitative genetic competition model for
sympatric speciation. J. Evol. Biol., 9, 893–909.
Doebeli, M. & Dieckmann, U. (2000). Evolutionary branching and
sympatric speciation caused by different types of ecological
interactions. Am. Nat., 156, S77–S101.
Doebeli, M. & Dieckmann, U. (2003). Speciation along environ-
mental gradients. Nature, 421, 259–264.
Dybdahl, M.F. & Lively, C.M. (1998). Host-parasite coevolution:
evidence for rare advantage and time-lagged selection in a nat-
ural population. Evolution, 52, 1057–1066.
Ekblom, R., Saether, S.A., Grahn, M., Fiske, P., Kalas, J.A. &
Hoglund, J. (2004). Major histocompatibility complex variation
and mate choice in a lekking bird, the great snipe (Gallinago
media). Mol. Ecol., 13, 3821–3828.
Frank, S.A. (2002). Immunology and the Evolution of Infectious Disease.
Princeton University Press, Princeton.
Froeschke, G. & Sommer, S. (2005). MHC class II DRB vari-
ability and parasite load in the striped mouse (Rhabdomys
pumilio) in the southern Kalahari. Mol. Biol. Evol., 22, 1254–
1259.
Gandon, S. & Otto, S.P. (2007). The Evolution of Sex and
Recombination in Response to Abiotic or Coevolutionary
Fluctuations in Epistasis. Genetics, 175, 1835–1853.
Gavrilets, S. (2004). Fitness landscapes and the origin of species.
Princeton University Press, Princeton.
Hamilton, W.D. (1980). Sex vs. non-sex vs. parasite. Oikos, 35,
282–290.
Hedrick, P.W. (2002). Pathogen resistance and genetic variation at
MHC loci. Evolution, 56, 1902–1908.
Howard, R.S. & Lively, C.M. (1998). The maintenance of sex by
parasitism and mutation accumulation under epistatic fitness
functions. Evolution, 52, 604–610.
Howard, R.S. & Lively, C.M. (2003). Opposites attract? Mate
choice for parasite evasion and the evolutionary stability of sex.
J. Evol. Biol., 16, 681–689.
Howard, R.S. & Lively, C.M. (2004). Good vs complementary
genes for parasite resistance and the evolution of mate choice.
BMC Evol. Biol., 4, Article No. 48.
Kirkpatrick, M. & Nuismer, S.L. (2004). Sexual selection can
constrain sympatric speciation. Proc. R. Soc. Lond., B, Biol. Sci.,
271, 687–693.
Kirkpatrick, M., Johnson, T. & Barton, N. (2002). General models
of multilocus evolution. Genetics, 161, 1727–1750.
Landry, C., Garant, D., Duchesne, P. & Bernatchez, L. (2001).
�Good genes as heterozygosity�: the major histocompatibility
complex and mate choice in Atlantic salmon (Salmo salar). Proc.
R. Soc. Lond., B, Biol. Sci., 268, 1279–1285.
Lively, C.M., Dybdahl, M.E., Jokela, J., Osnas, E.E. & Delph, L.E.
(2004). Host sex and local adaptation by parasites in a snail-
trematode interaction. Am. Nat., 164, S6–S18.
Milinski, M. (2006). The major histocompatibility complex, sexual
selection, and mate choice. Ann. Rev. Ecol. Evol. Syst., 37, 159–
186.
Nagylaki, T.J. (1993). The evolution of multilocus systems under
weak selection. Genetics, 134, 627–647.
Nuismer, S.L. (2006). Parasite local adaptation in a geographic
mosaic. Evolution, 60, 83–88.
Nuismer, S.L. & Otto, S.P. (2004). Host-parasite interactions and
the evolution of ploidy. Proc. Natl Acad. Sci. U.S.A., 101, 11036–
11039.
Letter When do host–parasite interactions drive the evolution of non-random mating? 945
� 2008 Blackwell Publishing Ltd/CNRS

Nuismer, S.L. & Otto, S.P. (2005). Host-parasite interactions and
the evolution of gene expression. PLOS Biol., 3, 1283–1288.
Otto, S.P. & Nuismer, S.L. (2004). Species interactions and the
evolution of sex. Science, 304, 1018–1020.
Otto, S.P., Servedio, M.R. & Nuismer, S.L. (2008). Frequency-
dependent selection and the evolution of assortative mating.
Genetics (in press).
Penn, D.J. & Potts, W.K. (1999). The evolution of mating
preferences and major histocompatibility complex genes. Am.
Nat., 153, 145–164.
Penn, D.J., Damjanovich, K. & Potts, W.K. (2002). MHC het-
erozygosity confers a selective advantage against multiple-strain
infections. Proc. Natl Acad. Sci. U.S.A., 99, 11260–11264.
Peters, A.D. & Lively, C.M. (1999). The red queen and fluctuating
epistasis: a population genetic analysis of antagonistic coevolu-
tion. Am. Nat., 154, 393–405.
Potts, W.K., Manning, C.J. & Wakeland, E.K. (1994). The role of
infectious-disease, inbreeding and mating preferences in main-
taining MHC genetic diversity – an experimental test. Philos.
Trans. R. Soc. Lond., B, Biol. Sci., 346, 369–378.
Sasaki, A. (2000). Host-parasite coevolution in a multilocus gene-
for-gene system. Proc. R. Soc. Lond., B, Biol. Sci., 267, 2183–2188.
Schwensow, N., Eberle, M. & Sommer, S. (2008). Compatibility
counts: MHC-associated mate choice in a wild promiscuous
primate. Proc. R. Soc. Lond., B, Biol. Sci., 275, 555–564.
Via, S. (1999). Reproductive isolation between sympatric races of
pea aphids. I. Gene flow restriction and habitat choice. Evolution,
53, 1446–1457.
Waxman, D. & Gavrilets, S. (2005). 20 questions on adaptive
dynamics. J. Evol. Biol., 18, 1139–1154.
Westerdahl, H., Waldenstrom, J., Hansson, B., Hasselquist, D., von
Schantz, T. & Bensch, S. (2005). Associations between malaria
and MHC genes in a migratory songbird. Proc. R. Soc. Lond., B,
Biol. Sci., 272, 1511–1518.
S U P P O R T I N G I N F O R M A T I O N
Additional Supporting Information may be found in the
online version of this article.
Appendix S1 Species interactions, mating, segregation and
recombination, quasi-linkage equilibrium approximation.
Table S1 Percentage of three-locus simulations in which
assortative mating (top entry) and disassortative mating
(bottom entry) evolved in (a) the host and (b) the parasite.
Please note: Blackwell publishing is not responsible for the
content or functionality of any supporting information
supplied by the authors. Any queries (other than missing
material) should be directed to the corresponding author for
the article.
Editor, Peter Thrall
Manuscript received 14 March 2008
First decision made 9 April 2008
Manuscript accepted 23 April 2008
946 S. L. Nuismer, S. P. Otto and F. Blanquart Letter
� 2008 Blackwell Publishing Ltd/CNRS
1
When do host-parasite interactions drive the evolution 1
of non-random mating? 2
3
4
Scott L. Nuismer1 5
Sarah P. Otto2 6
Francois Blanquart1,3 7
8
1 Department of Biological Sciences, University of Idaho, Moscow, ID 83844 9
2Department of Zoology, University of British Columbia, Vancouver, BC 10
3École Normale Supérieure, 45 rue d’Ulm, Paris, France 11
12
13

2
Supplementary Material 13
Appendix S1 14
SPECIES INTERACTIONS 15
Kirkpatrick et. al. (2002) demonstrated that the strength of selection acting on a 16
set of positions U, can be calculated using: 17
(S1) 18
where W(Xi) is the fitness of genotype X in species i, is the population mean fitness 19
of species i, W is the set of positions that contribute to fitness, and ai,U is the "selection 20
coefficient" acting on the set of positions U in species i. Here, we define positions as do 21
Kirkpatrick et al. as a particular locus in a particular context (e.g., the M locus in a 22
female inherited from a male). Because coevolution is mediated only by host and 23
parasite "B" locus genotypes, and because males and females are assumed to be 24
equivalent at this stage in the life cycles, there are only two positions within the fitness 25
set W, which we will denote as Bm and Bf where the subscript indicates whether a "B" 26
locus allele in a particular individual was inherited paternally (m subscript) or 27
maternally (f subscript). We used equations (1-3), in conjunction with the particular 28
values for ψ(XH, XP) from Table 2 of the main text, to calculate selection coefficients in 29
the host ( ) and parasite ( ) to leading order for each of the three models of 30
coevolution. 31
Inverse matching alleles 32
For the inverse matching-alleles model, we find that the selection coefficients favoring 33
the B allele over the b allele in male ( ) and female ( ) hosts are: 34

3
, (S2a) 35
and the selection coefficient favoring homozygotes over heterozygotes is: 36
(S2b) 37
where pi,B is the frequency of the B allele in species i, and qi,B is the frequency of the b 38
allele in species i. Equation (S2b) shows that the sign of is always negative, 39
demonstrating that the IMA model favours increased heterozygosity in the host. 40
For the parasite, we find that the selection coefficients are: 41
(S3a) 42
. (S3b) 43
Equation (S3b) shows that the sign of is always positive, demonstrating that the 44
IMA model favours increased homozygosity in the parasite. 45
Gene-for-gene 46
For the gene-for-gene model, we find that the selection coefficients favoring the B allele 47
over the b allele in the host are: 48
(S4a) 49
and the selection coefficient favoring homozygotes over heterozygotes is: 50
. (S4b) 51
Equation (S4b) shows that the sign of depends on the strength of selection for 52
increased resistance imposed by the parasite relative to the strength of 53
selection for reduced resistance generated by costs . Consequently, whether the 54
GFG model favors heterozygosity or homozygosity in the host depends on the 55
frequency of the parasite virulence allele. 56

4
For the parasite, we find that the selection coefficients are: 57
(S5a) 58
. (S5b) 59
Equation (S5b) shows that the sign of depends on the strength of selection for 60
increased virulence imposed by the host relative to the strength of 61
selection for reduced virulence generated by costs . Consequently, whether the GFG 62
model favors heterozygosity or homozygosity in the parasite depends on the frequency 63
of the parasite virulence allele. 64
Matching alleles 65
For the matching-alleles model, we find that the selection coefficients favoring the B 66
allele over the b allele in the host are: 67
(S6a) 68
and the selection coefficient favoring homozygotes over heterozygotes is: 69
. (S6b) 70
Equation (S6b) shows that the sign of is always positive, demonstrating that the 71
MA model favours increased homozygosity in the host. 72
For the parasite, we find that the selection coefficients are: 73
(S7a) 74
. (S7b) 75
Equation (S7b) shows that the sign of is always positive, demonstrating that the 76
MA model favours increased homozygosity in the parasite. 77
78

5
The selection coefficients (S2-S7) can be used to calculate the change in the 79
frequency of the modifier allele M that occurs in response to coevolutionary selection 80
(before mating has occurred). Specifically, Kirkpatrick et. al. (2002) showed that the 81
change in allele frequency at position j in species i due to selection is given by: 82
(S8) 83
where the notation Di,Uj means the statistical association between positions in the set 84
that includes the set U and additional position j in species i. Because the modifier does 85
not directly influence the coevolutionary interactions ( = 0), equation (S8) along 86
with the selection coefficients (S2-S7) gives the change in the frequency of the modifier 87
allele M in species i: 88
89 . 90
(S9) 91
Equation (S9) demonstrates that coevolutionary selection changes the frequency of the 92
modifier allele only indirectly through its statistical associations with the selected locus 93
B. There are two ways in which this can occur. First, a modifier of non-random mating 94
may change in frequency if it becomes statistically associated with the B locus allele 95
currently favoured or disfavoured by directional coevolutionary selection. This force is 96
reflected in the first two terms of (S9). Second, a modifier of non-random mating may 97
change in frequency if it becomes statistically associated with homozygosity or 98
heterozygosity at the B locus. If a particular coevolutionary model favours increased 99
heterozygosity (e.g., the host in an IMA model), then modifiers that become statistically 100
associated with heterozygous B locus genotypes will increase in frequency. This force is 101
reflected in the third term of (S9). 102

6
In addition to showing how the selection coefficients (e.g., S2-S7) can be used 103
to calculate changes in allele frequency, Kirkpatrick et. al. (2002) showed how they can 104
be used to calculate the change in statistical associations among a set of positions A in 105
species i that occur in response to selection: 106
(S10) 107
where the notation Di,AU indicates the statistical association between the set of positions 108
A in species i after the set of positions in U has been removed. Combined with the 109
selection coefficients (S2-S7), equation (S10) shows that coevolutionary selection 110
generates only a single type of statistical association — deviations from Hardy-111
Weinberg. Specifically, coevolutionary selection leads to the following change in 112
statistical associations within the B locus: 113
(S11) 114
115
MATING 116
Kirkpatrick et. al. (2002) showed that the changes in allele frequencies and 117
statistical associations between positions caused by non-random mating can be 118
calculated once the frequencies of mated pairs are known. As with viability selection, 119
the first step is to calculate the selection coefficients acting on positions in the genome 120
using: 121
(S12) 122
where is the frequency of a mated pair consisting of a male with genotype 123
Xi,m and a female with genotype Xi,f (equations 6, 8, and 9 of the main text) and f(Xi,m) 124
and f(Xi,f ) are the frequencies of male and female genotypes, respectively, prior to non-125
7
random mating. Because the fitness set W is very large for the forms of non-random 126
mating considered here, we do not show the results for the numerous selection 127
coefficients that emerge from (S12), although a Mathematica package which contains 128
these formulae is available upon request. After calculating the selection coefficients 129
using (S12), the changes in allele frequencies and statistical associations between 130
positions can be calculated using equations (S8) and (S10) respectively. These results 131
are quite numerous and complex, so we do not report them here although they are 132
available upon request in the form of a Mathematica package. 133
Non-random mating can itself cause changes in the modifier frequency for three 134
reasons. First, to the extent that there are costs of assortative mating (as in the plant 135
model, where choosier females have lower fitness), selection will act directly on the 136
modifier to reduce mating preferences. Second, non-random mating can cause 137
homozygotes and heterozygotes to differ in mating success, which can favor the 138
evolution of assortment (when homozygotes are better able to find mates) or 139
disassortment (when heterozygotes are better able to find mates). Finally, non-random 140
mating generates associations between alleles that are increasing in frequency and 141
modifiers that prefer that allele (as in models of Fisherian sexual selection); because 142
assortative mating causes a mating advantage to common alleles, this third force favors 143
the evolution of assortative mating when the allele rising in frequency at the B locus is 144
common but hinders it when the allele is rare. More details about how these three 145
forces combine can be found in the one-species model of Otto et al. (submitted). 146
147
148
149

8
SEGREGATION AND RECOMBINATION 150
Kirkpatrick et. al. (2002) showed that the change in statistical associations 151
caused by segregation and recombination in species i is: 152
, (S13) 153
where ti,A←U is the probability that the positions in set U are transmitted into set A in 154
species i, and the notation U:U=A indicates that the sum is taken over all possible sets U 155
which could be transmitted into set A once the context information (e.g., sex of origin, 156
sex of carrier) is stripped from them. Once again, equation (S13) yields numerous 157
complex expressions and so we refrain from writing them out; they are available in a 158
Mathematica notebook upon request. 159
160
QUASI-LINKAGE EQUILIBRIUM APPROXIMATION 161
In order to derive tractable expressions for the change in modifier frequency, we made a 162
quasi-linkage equilibrium approximation. In addition to assuming that selection is 163
relatively weak (order ε), our approximation assumed: 1) non-random mating is not too 164
strong, 2) the effect of the modifier is not too great, and 3) sex and recombination are 165
relatively frequent. With these assumptions, statistical associations between positions 166
should change quickly relative to allele frequencies and approach a quasi-steady state 167
where the values of these associations are small and of order ε. Under these conditions, 168
it is possible to solve for the quasi-linkage equilibrium (QLE) values of the statistical 169
associations between positions. These QLE values can then be used in conjunction with 170
equation (S9) and the selection coefficients imposed by species interactions (S2-S7) and 171
non-random mating (available as Mathematica notebook) to calculate the change in the 172

9
frequency of the modifier allele due to species interactions and non-random mating. 173
Because we have assumed that selection is weak (order ε) and that the system is at QLE, 174
the change in modifier frequency over a single generation is simply the sum of the 175
change due to species interactions and non-random mating. In the following sections, 176
we provide results for the change in modifier frequency caused by non-random mating 177
and for the change in modifier frequency caused by species interactions for each of the 178
three models of non-random mating. 179
QLE results for the plant model 180
Change in modifier frequency due to non-random mating 181
We find that the change in the frequency of a modifier of assortative mating in species i 182
is: 183
(S14a) 184
and a modifier of disassortative mating is: 185
(S14b) 186
where χ is the probability of encountering a mate with a matching genotype 187
( ) and δρ,i is the effect of the modifier in species i. Because 188
species interactions generate only indirect selection of order ε2, but females that mate 189
non-randomly pay a direct cost in terms of reduced mating opportunities, this result 190
shows that non-random mating will never evolve in the plant model. 191
QLE results for the animal model 192
Change in modifier frequency due to non-random mating 193
We find that the change in the frequency of a modifier due to non-random mating in 194
species i is: 195

10
(S15) 196
where is the average level of assortment or disassortment in species i. In contrast to 197
the plant model, this result shows that the animal model generates no direct selection on 198
the modifier locus (of order ε), instead imposing indirect sexual selection of the same 199
order (ε2) as that caused by species interactions. This indirect selection can favor or 200
disfavor a modifier of non-random mating. Specifically, modifiers increasing the degree 201
of non-random mating (either assortment or disassortment) are favored by indirect 202
selection anytime the allele frequency at the mating trait locus lies outside of the 203
interval {0.30, 0.70} but are disfavored by indirect selection anytime the allele 204
frequency at the mating trait locus lies inside this interval. In brief, when allele 205
frequencies are intermediate, the presence of assortative mating increases the relative 206
mating success of heterozygotes compared to the average homozygote (because 207
heterozygotes are common and they prefer other heterozygotes); this heterozygous 208
mating advantage counteracts the evolution of further assortment. Similarly, the 209
presence of disassortative mating increases the relative mating success of homozygotes 210
compared to the heterozygotes (because heterozygotes are common and they prefer not 211
to mate with other heterozygotes); this homozygous mating advantage counteracts the 212
evolution of further disassortment. These arguments apply only when allele frequencies 213
are sufficiently close to 1/2. When the allele frequency at the mating trait locus is far 214
from 1/2, heterozygotes are rare and the above arguments reverse. 215
216
Change in host modifier frequency caused by interactions with parasite 217

11
Inverse matching alleles model We find that IMA interactions with the parasite lead to 218
the following change in the frequency of a modifier of non-random mating: 219
(S16) 220
where θ is an indicator variable which takes the value +1 for a modifier of assortative 221
mating and -1 for a modifier of disassortative mating, and λ is the probability that a 222
randomly selected host is infected by a randomly selected parasite. This result 223
demonstrates that interactions with the parasite favor increased disassortment. 224
Comparing result (S16) with result (S15) shows that disassortative mating is guaranteed 225
to evolve only when the average level of assortment in the population is small relative 226
to the strength of selection exerted by species interactions. 227
Gene-for-gene model We find that the change in the frequency of a modifier of non-228
random mating in the host caused by GFG interactions with the parasite is: 229
230
(S17) 231
This result demonstrates that interactions with the parasite favor increased disassortment 232
any time costs of resistance (τH) are small relative to selection for increased resistance. 233
Comparing result (S17) with result (S15) shows that disassortative mating is then 234
guaranteed to evolve only when the average level of assortment in the population is 235
small relative to the strength of selection exerted by species interactions and when costs 236
of resistance (τH) are small relative to selection for increased resistance. 237
Matching alleles model We find that the change in the frequency of a modifier of non-238
random mating in the host caused by MA interactions with the parasite is: 239
(S18) 240

12
This result demonstrates that interactions with the parasite always favor increased 241
assortment in the host. Comparing result (S18) with result (S15) shows that assortative 242
mating is guaranteed to evolve only when the average level of assortment in the 243
population is small relative to the strength of selection exerted by species interactions. 244
Change in parasite modifier frequency caused by interactions with host 245
Inverse matching alleles model We find that the change in the frequency of a modifier 246
of non-random mating in the parasite caused by IMA interactions with the host is: 247
(S19) 248
This result demonstrates that interactions with the host always favor increased 249
assortment. Comparing result (S19) with result (S15) shows that assortative mating is 250
guaranteed to evolve only when the average level of assortment in the population is 251
small relative to the strength of selection exerted by species interactions. 252
Gene-for-gene model We find that the change in the frequency of a modifier of non-253
random mating in the parasite caused by GFG interactions with the host is: 254
(S20) 255
This result demonstrates that interactions with the host favor increased assortment 256
anytime costs of virulence (τP) are small relative to selection for increased virulence. 257
Comparing result (S20) with result (S15), shows that assortative mating is guaranteed to 258
evolve only when the average level of assortment in the population is small relative to 259
the strength of selection exerted by species interactions and when costs of virulence (τP) 260
are small relative to selection for increased virulence. 261
262
Matching alleles model We find that the change in the frequency of a modifier of non-263
random mating in the parasite caused by MA interactions with the host is: 264

13
(S21) 265
It is possible to show that S21 is always positive, demonstrating that interactions with 266
the host always favor increased assortment. Comparing result (S21) with result (S15), 267
shows that assortative mating is guaranteed to evolve only when the average level of 268
assortment in the population is small relative to the strength of selection exerted by 269
species interactions. 270
QLE results for the grouping model 271
Change due to assortative mating 272
We find that the change in the frequency of a modifier of assortative mating is 273
(S22) 274
showing that selection induced by non-random mating in the grouping model is of lower 275
order than that generated by species interactions. For this reason, the change in the 276
frequency of a modifier of assortative mating in the grouping model is, to leading order, 277
driven only by species interactions. 278
Change in host modifier frequency caused by interactions with parasite 279
Inverse matching alleles model We find that the change in the frequency of a modifier 280
of assortative mating in the host caused by IMA interactions with the parasite is: 281
(S23) 282
This result shows that IMA interactions with the parasite never lead to the evolution of 283
assortative mating in the host. 284
Gene-for-gene model We find that the change in the frequency of a modifier of 285
assortative mating in the host caused by GFG interactions with the parasite is: 286
(S24) 287

14
This result shows that GFG interactions with the parasite lead to the evolution of 288
assortative mating in the host only if costs of resistance (τH) are large relative to 289
selection for increased resistance . 290
Matching alleles model We find that the change in the frequency of a modifier of 291
assortative mating in the host caused by MA interactions with the parasite is: 292
(S25) 293
This result shows that MA interactions with the parasite always lead to the evolution of 294
assortative mating in the host. 295
Change in parasite modifier frequency caused by interactions with host 296
Inverse matching alleles model We find that the change in the frequency of a modifier 297
of assortative mating in the parasite caused by IMA interactions with the host is: 298
(S26) 299
This result shows that IMA interactions with the host always cause the evolution of 300
assortative mating in the parasite. 301
Gene-for-gene model We find that the change in the frequency of a modifier of 302
assortative mating in the parasite caused by GFG interactions with the host is: 303
(S27) 304
This result shows that GFG interactions with the host cause the evolution of assortative 305
mating in the parasite anytime the costs of virulence (τP) are small relative to selection 306
for increased virulence . 307
Matching alleles model We find that the change in the frequency of a modifier of 308
assortative mating in the parasite caused by MA interactions with the host is: 309

15
(S28) 310
This result shows that MA interactions with the host always cause the evolution of 311
assortative mating in the parasite. 312
Table S1. Percentage of three-locus simulations in which assortative mating (top entry) 313
and dissasortative mating (bottom entry) evolved in (a) the host and (b) the parasite. 314
Infection genetics Infection genetics Mechanism of assortment IMA GFG MA IMA GFG MA Plant 0.0%
0.0% 0.0% 0.0%
0.0% 0.0%
0.0% 0.0%
0.0% 0.0%
0.0% 0.0%
Animal 0.0%
39.4%
0.0%
28.0%
22.6%
0.0%
37.2%
0.0%
1.30%
25.0%
32.4%
0.0% Grouping 0.0%
NA
35.3%
NA
85.3%
NA
81.3%
NA
40.7%
NA
81.3%
NA 315