Wheeling and Banking Strategies for Optimal Renewable ... · PDF fileWheeling and Banking...
56
Technical Report NREL/TP-6A20-65660 March 2016 Jenny Heeter, Ravi Vora, and Shivani Mathur National Renewable Energy Laboratory Paola Madrigal Comisión Reguladora de Energía (Energy Regulatory Commission), Mexico Dr. Sushanta K. Chatterjee Central Electricity Regulatory Commission, India Rakesh Shah SunEdison India Wheeling and Banking Strategies for Optimal Renewable Energy Deployment: International Experiences A CLEAN ENERGY REGULATORS INITIATIVE REPORT
Transcript of Wheeling and Banking Strategies for Optimal Renewable ... · PDF fileWheeling and Banking...

Technical Report
NREL/TP-6A20-65660
March 2016
Jenny Heeter, Ravi Vora, and Shivani Mathur National Renewable Energy Laboratory Paola Madrigal Comisión Reguladora de Energía (Energy Regulatory Commission), Mexico Dr. Sushanta K. Chatterjee Central Electricity Regulatory Commission, India Rakesh Shah SunEdison India
Wheeling and Banking Strategies for Optimal Renewable Energy Deployment: International Experiences A CLEAN ENERGY REGULATORS INITIATIVE REPORT

Wheeling and Banking Strategies for Optimal Renewable Energy Deployment: International Experiences
Jenny Heeter, Ravi Vora, and Shivani Mathur National Renewable Energy Laboratory Paola Madrigal Comisión Reguladora de Energía (Energy Regulatory Commission), Mexico Dr. Sushanta K. Chatterjee Central Electricity Regulatory Commission, India Rakesh Shah SunEdison India
Technical Report NREL/TP-6A20-65660 March 2016
NREL is a national laboratory of the U.S. Department of Energy, Office of Energy Efficiency & Renewable Energy, operated by the Alliance for Sustainable Energy, LLC.

NOTICE
This manuscript has been authored by employees of the Alliance for Sustainable Energy, LLC (“Alliance”) under Contract No. DE-AC36-08GO28308 with the U.S. Department of Energy (“DOE”). This report was prepared as an account of work sponsored by an agency of the United States government. Neither the United States government nor any agency thereof, nor any of their employees, makes any warranty, express or implied, or assumes any legal liability or responsibility for the accuracy, completeness, or usefulness of any information, apparatus, product, or process disclosed, or represents that its use would not infringe privately owned rights. Reference herein to any specific commercial product, process, or service by trade name, trademark, manufacturer, or otherwise does not necessarily constitute or imply its endorsement, recommendation, or favoring by the United States government or any agency thereof. The views and opinions of authors expressed herein do not necessarily state or reflect those of the United States government or any agency thereof.
NREL prints on paper that contains recycled content.

iv
Abstract This paper defines the principles of wheeling (i.e., transmission) tariffs and renewable energy (RE) banking provisions and their role in RE deployment in countries with plans for large-scale RE. It reviews experiences to date in the United States, Mexico, and India and discusses key policy and regulatory considerations for devising more effective wheeling and/or banking provisions for countries with ambitious RE deployment targets. The paper addresses the challenges of competing needs of stakeholders, especially those of RE generators, distribution utilities, and transmission network owners and operators. The importance of wheeling and banking and their effectiveness for financial viability of RE deployment is also explored. This paper aims to benefit policymakers and regulators as well as key renewable energy stakeholders. Key lessons for regulators include: creating long-term wheeling and banking policy certainty, considering incentivizing RE through discounted transmission access, and assessing the cost implications of such discounts, as well as expanding access to renewable energy customers.
Acknowledgments The authors wish to thank the Clean Energy Regulators Initiative (CERI) for their support of this work. The CERI was established as a key source of information on clean energy that leverages the resources of existing regulator networks. The CERI serves as a knowledge partner by providing information on current clean energy developments, related regulations and good practices. The initiative also focuses on building capacity among utility regulators regarding energy efficiency, demand side management, smart grids, and renewable energy deployment and integration, all of which influence significant market transformation. The CERI was created and developed as a public-private partnership between the Clean Energy Solutions Center, which serves as a primary resource for regulators and policymakers through interactive expert assistance and training forums; the 21st Century Power Partnerships that aims to enhance the large-scale deployment of energy efficiency and renewable energy through policies and programs that leverage smart grid solutions and clean energy technologies; and the Leonardo Energy initiative that unites professionals from around the world dedicated to promoting a sustainable energy future through education and advocacy. Through their combined portfolio of activities and expertise, these three initiatives offer a broad capacity to support regulators in overcoming emerging clean energy market and integration challenges.
In addition, the authors thank the following individuals for providing insights during our research process and/or providing reviews of the draft: Mannti Cummins, Energia Veleta; Paul J. Kaufman, Chadbourne & Parke LLP; Brendan Kirby, consultant; Fernando Nuño, European Copper Institute; Kevin Porter, Exeter Associates; Oliver Probst, Tecnológico de Monterrey and Frontera Renovable; Stephen Yatsko, JLL; as well as Ron Benioff, Jaquelin Cochran, David Hurlbut, Jeffrey Logan, and David Mooney of the National Renewable Energy Laboratory.

v
Acronyms APC Alabama Power Company (United States) APPC Average Pooled Purchase Cost ARR Annual Revenue Requirement (India) CAISO California Independent System Operator (United States) CEA Central Electricity Authority (India) CENACE Centro Nacional de Control de Energía (Mexico) CERC Central Electricity Regulatory Commission (India) CFE Federal Electricity Commission (Mexico) CGP captive generating plants CRE Energy Regulatory Commission (Mexico) CSS cross subsidy surcharge (India) CTCP Total Short-Term Cost (Mexico) DC direct current DOE U.S. Department of Energy EA Electricity Act of 2003 (India) EPAct Energy Policy Act of 1992 (United States) ERCOT Electric Reliability Council of Texas (United States) FERC Federal Energy Regulatory Commission (United States) FiT feed-in tariff GW gigawatt HVDC high voltage direct current INR Indian rupee IOU investor-owned utility IPP independent power producer ISO independent system operator ISTS Inter State Transmission System (India) ITC investment tax credit MW megawatt MWh megawatt-hour NREL National Renewable Energy Laboratory (United States) OATT Open Access Transmission Tariff (United States) PPA power purchase agreement PTC production tax credit PTO Participating Transmission Owners (United States) PURPA Public Utilities Regulatory Policies Act (United States) RE renewable energy REC renewable energy credit RPO renewables procurement obligation (India) RPS renewable portfolio standard RTO regional transmission organization SENER Ministry of Energy (Mexico) SERC state electricity regulatory commission (India) SPP solar power project (Mexico) SPP Southwest Power Pool (United States) VRE variable renewable energy

vi
Table of Contents Introduction ................................................................................................................................................. 1 United States Case Study........................................................................................................................... 4
Background ............................................................................................................................................ 4 Renewable Energy Policies .................................................................................................................... 6 Wheeling and Banking of Energy .......................................................................................................... 7
Regional and Interregional Transmission and Wheeling Cost Allocation .................................... 8 Banking Policies ............................................................................................................................ 9
Virtual Net Metering and PPAs ............................................................................................................ 10 Conclusions and Lessons Learned for Regulators ................................................................................ 11
Mexico Case Study ................................................................................................................................... 13 Background .......................................................................................................................................... 13
Former Legal Framework ............................................................................................................ 14 Energy Reform in Mexico (2013-2014) ...................................................................................... 15
Wheeling of Renewable Energy ........................................................................................................... 15 Banking of Renewable Energy ............................................................................................................. 16 Other Relevant Provisions .................................................................................................................... 18
Open Season Transmission Development in Mexico .................................................................. 18 Conclusions and Lessons Learned for Regulators ................................................................................ 18
India Case Study ....................................................................................................................................... 20 Background .......................................................................................................................................... 20
Renewable Energy in India: Achievement So Far ...................................................................... 20 Enabling Policies and Regulations: RE Deployment .................................................................. 21
Major Obstacles to Successful Deployment of 175-GW RE Target .................................................... 22 Business Options for an RE Generator to sell RE ................................................................................ 22 Wheeling and Banking and Transmission Access Issues ..................................................................... 24
Inter-state sale of RE Regulatory Framework for RE Wheeling ................................................. 24 Banking-related Provisions of RE Generation ..................................................................................... 25 Stakeholder Perspectives ...................................................................................................................... 29
RE Generator’s Perspective......................................................................................................... 29 Distribution Licensee’s Perspective ............................................................................................ 29 Transmission Licensee’s Perspective .......................................................................................... 30
Conclusions and Lessons Learned for Regulators ................................................................................ 32 Synthesis of Lessons Learned for Regulators ...................................................................................... 34 References ................................................................................................................................................. 36 Appendix. Indian State Details ................................................................................................................ 40
Karnataka ERC ..................................................................................................................................... 40 Rajasthan ERC ..................................................................................................................................... 40
Intra-state Transmission Charges and Losses.............................................................................. 41 Telangana State ERC ............................................................................................................................ 42 Delhi ERC ............................................................................................................................................ 43
Banking of Solar Power Under open Access .............................................................................. 44 Madhya Pradesh ERC .......................................................................................................................... 45
Intra-state Transmission Charges ................................................................................................ 45 Maharashtra ERC ................................................................................................................................. 45
Intra-state Transmission Charges ................................................................................................ 46 CSSs ........................................................................................................................................ 46
Gujarat ERC ......................................................................................................................................... 46 Intra-state Transmission and Wheeling Charges for wind .......................................................... 47 Intra-state Transmission and Wheeling Charges for Solar .......................................................... 47

vii
Kerala SERC ........................................................................................................................................ 48 Jharkhand SERC ................................................................................................................................... 48 Haryana ERC ........................................................................................................................................ 48
Figures and Tables Figure 1. Interconnections of the North American electric grid ................................................................... 4 Figure 2. Regions with organized electricity markets: North America ......................................................... 5 Figure 3. U.S. REC import flows relative to RTOs/ISOs ............................................................................. 7 Figure 4. Annual capacity of new PPAs (MW) by sector ........................................................................... 11 Figure 5. Growth of total installed capacity in Mexico, for the period 2007 to 2015 ................................. 13 Figure 6. Share of capacity based on renewable sources in Mexico by energy source (2015) ................... 14 Figure 7. Online diagram illustrating the transmission postage stamp model (charges corresponding to
August 2015) ........................................................................................................................................ 16 Figure 8. Diagram illustrating the energy compensation in the Energy Banking Model ............................ 17 Figure 9. Overall Capacity Mix in India ..................................................................................................... 20 Figure 10. Impact of various regulatory and policy initiatives in India ...................................................... 22 Table 1. Summary of Wheeling and Banking Definitions ............................................................................ 2 Table 2. Summary of State-Level Balancing Mechanisms for RE Generation .......................................... 26 Table 3. Regulatory Concessions in Solar Energy Open Access Charges .................................................. 27 Table 4. Regulatory Concessions in Wind Energy Open Access Charges ................................................. 28 Table 5. Impact Analysis Distribution Company Retail Customers ........................................................... 31

1
Introduction Wheeling electricity—the process of transmitting electricity from a producer to a user(s) in the same balancing area or from one area to another has historically been used for conventional generation sources. However, as an increasing amount of variable renewable generation is being developed, policymakers and regulators are adopting new or revised wheeling (i.e., transmission) and renewable energy (RE) banking policies that could effectively support renewable development. Often, the highest-quality renewable resources are located far from major electricity load centers; wheeling polices can support transmission to deliver renewable generation to those load centers.
The wheeling concept addressed in this paper typically refers to long-term transmission services that match the purchasing terms of electricity between a producer and a supplier under a power purchase agreement (PPA). RE banking policies and services are separate from wheeling (though they are related), and particularly relevant for variable generation sources. Wheeling and banking policies are complementary polices, often discussed in tandem, which is why this paper reviews both.
When a generator is wheeling electricity, in some markets, it can virtually bank the electricity for consumption by an end customer at a later time. The bank is not a physical energy storage facility but rather, energy is virtually banked through accounting methods. For example, if a solar generator produces during the day but wants to sell to a consumer that needs electricity at night, banking service allows the generator to put all of its generation on the grid during the day and then use banked grid supplied energy to serve the customer’s needs at night. In some countries, “banking” is not a specific policy, but rather, enables the RE generators to provide “firm” power to its customer. This paper focuses on who provides such banking services for RE; the costs, terms and conditions for the service; and who bears the cost of such services, from the perspective of utility scale generation and transmission. The paper does not cover the distribution level services. The definitions and country-specific context of wheeling and banking are summarized in Table 1.

2
Table 1. Summary of Wheeling and Banking Definitions
Wheeling RE Banking
General definition Wheeling is a transmission service that enables the delivery of electricity between a buyer and seller, often under a long-term PPA
Banking is a financial and accounting mechanism under which a service provider earns credit for excess RE supplied to the grid
United States context Transmission services to deliver power from a generator’s dispatch point to where the buyer takes title to the power purchased on the grid; no discounted wheeling rates for RE generators
Banking is not used on the wholesale level
Mexico context Discounted wheeling rates allowed wind generators to serve large commercial and industrial customers with electricity; providing known, flat-rates allowed for reliable planning by wind generators
All variable RE technologies can use banking, as mandated by the Energy Regulatory Commission for no charge.
India context Discounted wheeling rates in some states allow wind and solar generators to supply electricity to customers at competitive rates
Discounted banking provisions for wind and solar generators exist in some states and typically are provided by state utilities
Related to wheeling and banking, the concept of renewable energy certificates (also called Clean Energy Certificates, Renewables Obligations, and other terms) can help utilities demonstrate that they have met renewable power mandates. Unbundling the renewable attribute from the power can allow renewable generators to site facilities where they are most cost effective, rather than where they might be needed to serve an obligated entity’s load. Some countries use renewable energy certificates in conjunction with wheeling and banking policies.
Wheeling and banking polices are evolving around the world. New innovative concepts such as virtual PPAs—which allow consumers to purchase renewable energy that is not physically delivered to them but instead delivered to a wholesale market—have the potential to transform renewable energy markets by accessing “corporate demand” for renewable energy without requiring wheeling. Consumers purchasing through a virtual PPA can hedge their future electricity prices and receive the renewable attributes without receiving physical delivery of electrons from the renewable generator they have contracted with. These mechanisms allow corporate purchasers to support renewable generators by signing a long-term purchasing agreement even though the generator may be located in a different balancing authority.
Wheeling and banking policies can be implemented by policymakers and regulators. These polices can enable increased renewable generation on the grid, depending on how they are structured. Some policymakers and regulators may want to consider wheeling and banking polices as one mechanism for meeting state and national renewable energy mandates. Wheeling and banking provisions that treat renewable generators more favorably than non-renewable generators have been contentious in

3
some cases due to issues about how costs for subsidizing the renewable generators, if any, would be covered.
This paper presents the case examples of wheeling and banking of renewable energy in the United States, Mexico, and India. Policymakers and regulators can use the lessons learned from these three major markets to enable or revise wheeling and banking policies to achieve more cost-effective deployment of renewable energy in their markets. These countries were selected based on their long histories (over 10 years) of diverse perspectives on wheeling and banking policies. After highlighting U.S. market experience in Section 2, Mexico and India case studies are presented in Sections 3 and 4, respectively.
Section 5 provides a synthesis of lessons learned for regulators. Key lessons for regulators include: creating long-term wheeling and banking policy certainty, considering incentivizing RE through discounted transmission access, assessing the cost implications of such discounts, as well as expanding access to renewable energy customers.

4
United States Case Study Authors: Shivani Mathur, Jenny Heeter, Ravi Vora (NREL)
Background The U.S. electric industry is a complex system comprising over 3,000 public, private, and cooperative utilities, more than 1,000 independent power generators, three regional synchronized power grids, eight electric reliability councils, about 150 control-area operators, and thousands of separate energy, economic, environmental, and land-use regulatory authorities. At the highest level, the electric power system of the continental United States consists of three independently synchronized grids: the Eastern Interconnection, the Western Interconnection, and the Electric Reliability Council of Texas (ERCOT) (Figure 1), unlike many countries, which only have one grid or are part of a multi-national grid. They are linked by only a few low-capacity direct current (DC) lines.
Figure 1. Interconnections of the North American electric grid
Source: U.S. Department of Energy (DOE) n.d.
Investor-owned utilities (IOUs) are private companies. They often are vertically integrated, meaning that they generate, transmit, and distribute power to retail, commercial, and industrial customers in their franchised territories. In many cases, they own all or some of their power plants and transmission lines, but they may also buy power through contracts from independent power producers (IPPs) as well as buy and sell real-time in wholesale markets. Consumer-owned utilities serve cities and many large rural areas and include city-owned or municipal utilities (governed by the local city council or another elected commission), public utility districts (utility-only government agencies), co-operatives (private non-profits in rural areas, “co-ops”), and others; and some are often distribution-only entities.
The U.S. Federal Energy Regulatory Commission (FERC) has jurisdiction over wholesale electricity sales and transmission rates and the use of transmission infrastructure between states. Since 47 states (excluding ERCOT, Hawaii, and Alaska) have interconnected transmission networks, FERC sets the rates and service standards for most bulk power transmission between states; entities not subject to direct regulation by FERC generally consider FERC policy and adhere to similar standards. The nation’s electricity transmission system is governed by a patchwork of local, state, and federal regulations. In general, states have jurisdiction over the siting of transmission while the federal

5
government usually has jurisdiction over transmission rates and other commercial aspects that cross state boundaries.
In the 1990s there was a wave of legislative restructuring activity. Many states restructured their retail electric utilities from vertically integrated utilities to separate generation, transmission, and distribution businesses. Some states enabled competitive retail service, particularly for larger commercial and industrial customers. This interest in retail restructuring coincided with restructuring of wholesale electricity markets and the formation of Independent System Operators (ISOs) and Regional Transmission Operators (RTOs). FERC Order 2000, issued in December 1999, encouraged transmission-owning utilities to form RTOs/ISOs, though this was not mandatory. FERC gave these regional organizations the task of developing regional transmission plans and pricing structures that would promote competition in wholesale power markets, using the transmission system as a highway for wholesale markets. Seven competitive wholesale markets subsequently arose; 3 are state-specific in California, New York, and Texas. The remaining four (New England ISO, PJM Interconnection, Southwest Power Pool, and Midcontinent ISO (MISO) span multiple states. The Southeast has a dominant vertically integrated utility model, while the West, particularly the Pacific Northwest, stresses federal, municipally owned, and cooperative enterprises. Thus, it can be seen that, while some parts of the country are served by RTOs/ISOs, others are not served by either (shown in Figure 2).
Figure 2. Regions with organized electricity markets: North America
Source: ISO/RTO Council (2014).

6
Wheeling of energy from renewable generators in the United States occurs within an RTO/ISO, between RTOs/ISOs, and between RTOs/ISOs and regions with no RTO/ISO. Therefore, wheeling can take place within the same state or involve more than one state depending upon the locations of the IPP and buyer’s point of delivery defined in their PPA. As a part of restructuring of the electricity industry, FERC mandated open access to transmission facilities. The FERC action specified that transmission charges were to be equitable and economically based; thus, renewable energy generators pay the same rates as non-renewable generators for inter-state transmission and wheeling.
While open access has made transmission and wheeling synonymous in the United States, several unique approaches have been used by renewable energy generators for transmission of energy across long distances. In the recent past, there was an emphasis on transmission planning to connect remote locations with high renewable energy potential to heavy load centers. This has been encouraged by RTOs and ISOs in different states through initiatives such as the Renewable Energy Transmission Initiative in California and Competitive Renewable Energy Zones in Texas.
Another example is Clean Line Energy’s proposed High Voltage Direct Current (HVDC) projects to take wind energy from central, wind-rich states (Kansas, Oklahoma, Texas, Iowa) to large electricity load centers. One of Clean Line Energy’s proposed lines, the Grain Belt Express, has state regulatory approval in Illinois, Kansas, and Indiana, and is awaiting regulatory action in Missouri (Clean Line Energy 2015). One of the drivers behind such initiatives is that the wind power levelized cost of energy (LCOE) in wind-rich states has not only achieved grid parity but is considerably lower than the wholesale electricity prices in states like California and many RE resource-poor states in the Northeast, Central Atlantic, and Southeast United States.
Renewable Energy Policies U.S. federal and state policies have supported renewable energy deployment in recent years. The recent Clean Power Plan (August 2015) aims to reduce carbon dioxide emissions from power plants, allowing renewable energy but also fuel switching and other measures to contribute to carbon reductions. Historically, the federal production tax credit (PTC) and investment tax credit (ITC) have been key financial incentives. The PTC provides 2.3 ¢/kWh to qualifying renewable generators for the first 10 years of their production; this is typically used by wind generators. Solar generators typically take advantage of the ITC, which is equal to 30% of the total solar investment.
State policies such as renewable portfolio standards (RPSs), which typically require a percentage of electricity sales to come from renewable resources, have driven renewable deployment. State-level RPSs, which vary by state, exist in 29 states and Washington, D.C. and resulted in 98 terawatt-hours of renewable electricity, or 3.6% of electricity generation in 2013 (Wiser et al. 2016). Voluntary “green power” purchases and net metering policies have also enabled renewable deployment (O’Shaughnessy et al. 2015; Heeter et al. 2014).
State-driven RPS policy has an influence on inter-state and inter-regional wheeling of renewable energy (Figure 3). While these policies vary, most states allow inter-state trading as long as the renewable power generated is within the state’s region (typically defined as the RTO/ISO). It is unusual for a state to allow the import of renewable energy credits (RECs) from another region (outside its RTO/ISO) or for it to allow all RECs to be unbundled. A few RPS states have no or minimal geographic limitations or energy delivery requirements; these are Colorado, Illinois (if there are insufficient cost-effective resources in-state or in adjoining states), Montana, North Carolina (up to 25% compliance), North Dakota, and South Dakota (Holt 2014).

7
Figure 3. U.S. REC import flows relative to RTOs/ISOs Source: Emerging Energy Research (2010)
Wheeling and Banking of Energy In 1978, the Public Utility Regulatory Policies Act (PURPA) required regulated electric utilities to buy power from non-utility generators using cogeneration, renewable, or other sources at the utilities’ avoided cost of generation. But because of transmission challenges and other factors, renewable generators sold power to the nearest utility instead of selling it to the most favorable market.1 The Energy Policy Act of 1992 (EPAct) further removed barriers to the market entry of IPPs by requiring well-established competitive generators to be given rates and terms comparable to non-IPPs.
To carry out these goals, FERC issued Order 888 in 1996, requiring transmission owners to mitigate undue discrimination in transmission networks and to provide open access of their systems to wholesale customers under a regulated Open Access Transmission Tariff (OATT).2 The order required public utilities to file a single wholesale open access tariff for point-to-point3 and network services4. This order was critical in promoting competitive wholesale electricity markets as a part of a larger restructuring effort. With larger wholesale electricity markets, generators need to rely less on wheeling from one balancing area to another, thereby minimizing traditional wheeling transactions.
1 Many projects developed under PURPA were developed within California, where avoided costs were high. 2 Order 888 required “all public utilities that own, control or operate facilities used for transmitting electric energy in interstate commerce to file open access non-discriminatory transmission tariffs that contain minimum terms and conditions of non-discriminatory service.” 3 FERC defines firm flexible point-to-point service in Order 888 as a service that “defines rights and sets prices based on transmission capacity reservations. The transmission user designates points of delivery (PODs) and points of receipt (PORs) and makes a capacity reservation for each POD and for each POR.” 4 Network transmission is where a transmission customer, often a load serving entity, can integrate resources and loads over a certain area, without individual firm transmission arrangements.

8
Regional and Interregional Transmission and Wheeling Cost Allocation FERC Order 1000, issued in 2011, allowed each region to develop its own proposed cost allocation measure for allocating costs of transmission facilities. It was not prescriptive, but mandated that cost allocation follow these key principles:
• Costs allocated are “roughly commensurate” with estimated benefits
• Those who do not benefit from transmission do not have to pay for it
• Benefit-to-cost thresholds must not exclude projects with significant net benefits
• No allocation of costs outside a region unless the other concerned region agrees
• Cost allocation methods and identification of beneficiaries must be transparent
• Different allocation methods could apply to different types of transmission facilities.
Some commonly used rates and cost allocation methods used by the wholesale electricity market are:
• Pancaked rates come into play when power under contract involves more than one power system and each system charges its full rate to provide transmission service. Regional power pools, RTOs, and ISOs have developed joint pricing for transmission services, eliminating the need for pancaked rates within their respective boundaries.
• Under postage stamp pricing, the per-unit fee to use the transmission system within a single zone is the same, i.e., transmission costs are recovered uniformly from all loads in a defined market area (e.g., RTO-wide in ERCOT and California Independent System Operator [CAISO]).
• License Plate (LP) pricing means that companies that use the transmission grid pay different prices based on the costs from the point at which the power is delivered to their area and therefore, each utility recovers the costs of its own transmission investments. In some cases (e.g., SPP, MISO, PJM), the cost of certain project types are allocated uniformly to transmission operators, who then recover these allocated costs in their LP tariffs.
• Distance-sensitive pricing bases the price for using the transmission system on the number of miles of the system for which users contract the line.
FERC Order 1000 does not proscribe discounted rates for RE generators; however, some rates may be more advantageous to them. For example, postage stamp rates favor generators that are far from load, which is common with wind generators.
Wheeling Charges Wheeling access charges are assessed whenever energy leaves or enters the ISO- or RTO-controlled grid. These charges are rent-for-wholesale transactions on the transmission system owned by the Participating Transmission Owners (PTOs). They are settled by the ISOs/RTOs, which act as grid managers on behalf of the PTOs. The PTOs use these wheeling charges to pay all operating and capital costs for the transmission system, including a fair return on its investment. In this section we present examples of wheeling charges in the United States. Text Box 1 provides a case study of wheeling wind energy in the southern United States.

9
CAISO uses a postage stamp rate method of cost allocation for transmission facilities. It defines three Transmission Access Charge (TAC) areas based on original control areas of existing IOUs—Pacific Gas & Electric, San Diego Gas & Electric and Southern California Edison. It has a single, uniform transmission access charge rate for the entire ISO. Each TAC area has its own high and low voltage access charge. In CAISO, the wheeling access charge is determined at the point the energy leaves the ISO for three cases: (1) Wheel-through energy is imported into the region, across the control area, and then exported out of the ISO control area; (2) wheel-out-energy is produced or sourced in the ISO control area and exported out of the control area; and (3) non-PTO-load energy generated within an ISO control area is used to serve a non-PTO load, like a municipality within the ISO control area.
In NYISO, substantial wheeling takes place through the New York City area, including from Canada and PJM. There are seven transmission owners in the ISO with varying tariffs (since they are based on cost recovery of particular transmission assets). The transmission pricing in NYISO is usually implemented using the postage stamp rate method. Transmission congestion pricing is implemented through location marginal price (LMP). For firm point-to-point transmission, a customer pays congestion charges while for a non-firm point-to-point transmission, a customer pays no congestion charge.
Since cost allocation methodologies differ regionally and for interregional transmission, the transmission/wheeling costs incurred also vary. Brattle Group (2014) estimates costs of wheeling wind energy generated from SPP to MISO or WECC as approximately at least $2 to $3 per megawatt-hour (MWh) and through MISO to regions other than PJM as approximately $8 to $11 per MWh, though the transmission capacity is currently constrained, which increases barriers to this export. Since network upgrade costs are often borne by the transmission customer, these prices are likely to increase as transmission capacity grows.
Banking Policies Because the majority of PPAs have historically been signed with utility companies that manage the variability of the offtake from renewable generators in the United States, there are no explicit banking policies for wholesale generation. This alleviates the need for wholesale banking policies. In the United States, banking is used in the context of behind-the-meter generation, which falls under a
Text Box 1. Case Study Alabama Power Company (APC) purchased power from Chisholm View, a 202-megawatt wind farm located in Grant and Garfield Counties Oklahoma. Their PPA used an OATT. Trade Wind was the developer for the project, who was also responsible for transmission of electricity from the wind farm to the load site. Chisholm View wind farm was connected with Oklahoma Gas & Electric, which is a part of SPP, and therefore power needed to be wheeled through SPP, Entergy, and eventually through the Southern System balancing authority, which APC was a part of. Trade Wind was responsible for undertaking studies and implementing firm transmission services from Oklahoma to Alabama, and obtaining firm transmission rights from SPP, Entergy, and Southern System balancing authorities. In case this clause was not met, the contract would be terminated without any liability to the customer. These firm transmission rights would be transferred to APC after the facility was set up. Interconnection charges were paid by Trade Wind. Once the project was up and running, APC was responsible for the transmission costs, which were capped, to protect customers. In case the contract was terminated, the transmission rights could be returned to Trade Winds or kept with APC. The contract allowed APC to buy and sell power in Oklahoma or along the way and gain additional value or perhaps even sell the transmission rights.

10
net metering policy. Under net metering, customers with behind-the-meter generation can typically bank their unused energy forward to the next month with an annual true-up.
Instead of using banking policies, U.S. generators supplying non-utility customers rely on wholesale power markets, providing firmed electricity products to their customers if needed.
Virtual Net Metering and PPAs In the United States, several options are available for non-utility purchasers to buy renewable energy from a facility that delivers power to the grid rather than directly to their facilities. Metering and shared solar policies allow multiple customers to receive the financial benefits of a single renewable project while PPAs (both virtual and physical) allow customers to procure energy from multi-megawatt RE projects.
Aggregated net metering, virtual net metering, and shared solar policies enable a generation source (typically a distributed resource) to serve multiple off-takers. Energy is delivered to the grid and then credited to the purchaser’s bill rather than being physically delivered to the purchaser.
Aggregated net metering is authorized in 17 states, and allows a generator to serve a customer who has multiple adjacent meters (Barnes 2013). For example, a university complex that has multiple, individually metered buildings could contract with a renewable generator. Bill credits for the generation would then be applied to individual meters.
Virtual net metering is authorized in five states. It is similar to aggregated net metering, but allows a generator to serve a customer who has multiple meters that are not adjacent to each other. It also allows a generator to serve individual meters that are located adjacent to each other but do not have the same owner (e.g., in an apartment complex).
Shared solar programs allow multiple customers to purchase a share of a single solar array. In some cases, shared solar programs use aggregated metering policies. Thirteen states and Washington, D.C. have policies that specifically support shared solar (Sharedrenewables.org 2015). Programs exist outside of these states as well: 25 states and Washington, D.C. have at least one shared solar program (SEIA 2016). As of September 2015, at least 90 community solar projects totaling more than 80 megawatts (MW) existed in the United States (O’Shaughnessy et al. 2015).
For larger renewable projects, energy and/or renewable attributes can be contracted for using two primary methods: physical delivery or virtual PPAs. As of July 2015, more than 550 PPAs for renewable energy had been signed, representing over 6,400 MW of capacity (Figure 4). PPAs for large (>50 MW) wind are concentrated in Texas and Iowa while small-scale PPAs for solar are concentrated in California and New Jersey (O’Shaughnessy et al. 2015).
Under physical delivery methods, the purchaser works with a competitive electric supplier to ensure generation is delivered to the customer by signing one or more back-to-back sales and/or purchase contracts. This option is only available in states with a competitive retail market like ERCOT.
Under a contract for differences or a virtual PPA or similar methods, the purchaser and generator agree on a set price for the generation over the long-term (e.g., 10–25 years). The purchaser continues to buy electricity from the local grid and the renewable generation is sold into the wholesale market. If the generation is sold into the wholesale market for more than the agreed price, the purchaser may receive the proceeds. For a financial settlement to provide an effective hedge

11
against future electricity price volatility, purchasers look at the correlation between their consumption profile and the production profile of the generator. Theoretically, a purchaser could be located anywhere in the United States and sign a financial settlement with a generator located in a competitive wholesale market; however, in practice, most transactions are happening in ERCOT and PJM.
In recent years, corporate customers, particularly those in the information and communications technology sector, have begun signing large PPAs, typically virtual PPAs, for renewable energy. For example, Google has prioritized signing PPAs rather than buying unbundled RECs to meet its renewable energy goals. The company signed its first PPA with a 114-MW wind facility in Iowa, and has since signed four additional PPAs for renewable energy in the United States.5
Figure 4. Annual capacity of new PPAs (MW) by sector
Data source: BNEF 2015
The National Aquarium in Baltimore, Maryland, is purchasing 100% of the energy from a 4.3-MW solar PV project about 50 miles away under a 25-year agreement. The project owner is retaining the solar renewable energy certificates (SRECs) generated by the project in years 1-15, and the Aquarium is purchasing the SRECs generated in years 16-25.
Conclusions and Lessons Learned for Regulators Experience in the United States has demonstrated that regulators can have considerable impact on the development of renewable energy. While traditionally defined wheeling and banking are not often used in the United States, other mechanisms have evolved to enable transmission of renewable energy from generation to demand source. Because wholesale banking is not used in the U.S., conclusions and lessons learned in this section focus on wheeling and virtual power purchase agreements.
• The U.S. power system contains large RTOs/ISOs including both RE-rich locations and major load centers with low RE resources, which minimize the need for wheeling across separate balancing areas because they have been replaced by an RTO/ISO. When a generator sells into an
5 Google also works with electric utilities in regulated states in which it operates to purchase renewable energy. In 2015, Google announced that it would be the first subscriber under Duke Energy Carolina’s Green Source Rider, purchasing 61 MW from a solar array. Duke Energy Carolina will sign a 15-year PPA with the project developer and Google agrees to subscribe to the Green Source Rider. http://www.utilitydive.com/news/google-is-first-buyer-of-duke-energy-solar-using-utilitys-new-green-source/409812/

12
RTO, it only pays one transmission fee, not pancaked fees. Some RTOs/ISOs have created a single, uniform transmission access charge rate (e.g., CAISO) through the OATT process, which provides market transparency.
• Regional transmission planning processes within the FERC regulatory framework have facilitated efficient wheeling across balancing areas (where needed) and created opportunities to expand balancing area footprints.
• The federal regulator (FERC) has created open access transmission tariffs. These tariffs give equal access to (interstate) transmission lines for renewable and non-renewable generators.
• The federal regulator has provided principles for how transmission cost allocation should be determined.
• State policymakers and regulators can enable the use of PPAs by facilitating that option in their state through statute or regulatory process.
• State and federal regulators, as well as wholesale power markets, can facilitate virtual PPAs by providing greater electricity price transparency and thus be able to sign back-to-back, long-term purchase and sales contracts, thus eliminating the need for physical wheeling between the RE generator and electricity purchaser.

13
Mexico Case Study Author: Paola Madrigal, Comisión Reguladora de Energía (CRE) (Energy Regulatory Commission)
Background One of the main drivers of renewable generation projects in Mexico was the RE Act (2008) and the instruments it established: wheeling, banking, and the open season process. Since then, the development of projects grew significantly in Mexico, especially wind power projects. Figure 5 presents the growth of total installed clean energy capacity for 2007 to 2015.6 As shown, current installed capacity is nearly 2,800 MW, not including large hydroelectric plants. Figure 6 shows the share of capacity based on clean energy sources in Mexico by energy source, including large hydroelectric and nuclear power plants. As can be seen, hydroelectric and wind projects contribute the most, with 86% of the total share. Nevertheless, the new legislation aims to further promote the deployment of other clean sources, such as solar and geothermal.
Figure 5. Growth of total installed capacity in Mexico, for the period 2007 to 2015
Source: Energy Regulatory Commission (2015)
6 In Mexico, the term “clean energy” includes renewable, hydroelectric, and nuclear generation.

14
Figure 6. Share of capacity based on renewable sources in Mexico by energy source (2015)
Source: Ministry of Energy (Secretaría de energía-SENER)
Apart from the RE Act, another important driver in the development of renewable projects in Mexico is the Ministry of Energy’s (SENER by its Spanish acronym) mandate in the National Policy, which sets the target of achieving 35% of the electric energy generated in Mexico using clean energy resources by 2024. Under the new legal framework, the renewable energy certificate mechanism (Clean Energy Certificates, or CELs) is expected to play a major role in reaching the energy target and promoting the deployment of clean energy sources.
Former Legal Framework Prior to energy reform at the end of 2013 in Mexico (discussed in the next section), the legal framework in place called for electric public service to be carried out exclusively by the Federal Electricity Commission (CFE), Mexico’s state-owned utility. However, there were provisions that allowed private investors to participate in the generation of electricity under various mechanisms: self-supply (where the electricity generation and consumption need not be at the same site), cogeneration (electricity and other energy or co-products), independent power production (for sales to the CFE), small captive production, and export and import of energy (Energy Regulatory Commission).
Over the several years leading up to the RE Act, the Energy Regulatory Commission (Comisión Reguladora de Energía (CRE))7 issued a number of regulatory instruments to incentivize private investment in renewable energy projects. These instruments were designed under the assumption that no financial subsidies, such as feed-in tariffs, would be available, thus making it necessary to look for alternative measures to promote renewable energy. The underlying logic was to develop mechanisms that would level the field for these technologies by recognizing the special characteristics of variable sources of renewable energy, such as wind and solar. The instruments have been successful because of their immediate acceptance by all relevant stakeholders: the Ministry of Energy, the CFE, financing entities, developers, permit holders, and investors. In this context, the CRE was responsible for issuing permits for the generation or import and export of electricity, model contracts for backup power, wheeling power from generation to consumer(s), the sale of excess energy to the CFE, and other technical, economic, and legal conditions that regulate the relationship between the CFE and
7 CRE was formed in 1993. CRE is currently responsible for issuing all regulation for generation permits, clean energy certificates, reliability of the NES, and monitoring of the electrical market.

15
permit holders. With the passing of the RE Act, the Congress communicated its desire to lessen Mexico’s dependence on fuel oil and natural gas for electricity generation.
Energy Reform in Mexico (2013-2014) Amidst broad energy reform in December 2013, the new legal framework separated Centro Nacional de Control de Energía (CENACE) (National Center for Energy Control) from the CFE to become an independent national control center (i.e., system operator), owned and controlled by the government. Other relevant modifications included establishing an open wholesale market for electricity, which is in progress, and increasing the use of clean energy sources and significantly limiting CFE’s monopoly as a buyer and supplier of wholesale electricity. Under the legislation, private investors can develop, maintain, and operate transmission lines; however, the transmission assets are owned by the government.
Regarding the impact of the new legislation for the development of clean energy projects, the Electric Industry Act has established CELs as a new support mechanism. CELs are tradable commodities that represent proof that a certain amount of electricity (1 Megawatt-hour) was generated from clean energy sources that comply with the characteristics foreseen within the law. These certificates can be sold and traded to load centers in order for the latter to comply with the specific requirements associated to their consumption. According to the law, the current certificates requirement establishes that 5% of the total electricity consumption has to be generated based on clean energy sources by 2018.
In this context, former support instruments like wheeling and banking will still apply to permit holders whose projects were registered prior to the entry of the new legislation. In addition, CRE continues to analyze the possibility of such instruments remaining under the new competitive market.
Wheeling of Renewable Energy Under the former legislation, the transmission fee applied to renewable generation projects was based on a postage stamp rate. One of the benefits of the wheeling fee for renewable generators is that it is lower than wheeling fees for traditional energy sources. Also, since the fee is only modified on a monthly basis to adjust for inflation, wind developers can be certain about their future costs.
The fees are classified according to voltage levels. For each load point, the transmission fee will be the sum of the corresponding fees for each voltage level required to transport energy from the generation center to the load. The transmission fee will never include twice or more times the fee for each voltage level. Figure 7 shows the wheeling charges applied in Mexico in August 2015. Such fees include costs related to the use of the infrastructure, losses, services related to transmission, and fixed charge for administration of the interconnection contract.

16
Figure 7. Online diagram illustrating the transmission postage stamp model (charges
corresponding to August 2015)
Source: CRE (2014)
Note: One Mexican Peso (MXN) was equivalent to 0.053 U.S. dollars. G = generator, HV = high voltage, MV = medium voltage, LV = low voltage
Under this scheme, renewable generators have the opportunity to wheel energy to their associated load centers, and each renewable project can have several medium to large load center off-takers. This suggests that generators could wheel energy only to the load centers with which it has signed PPAs. The fact that renewable sources are far from the main consumption centers presents a considerable barrier for renewable project development in Mexico; however, wheeling charges partly address this problem since they do not consider the distance of the transmitted energy, but instead uses a fixed rate.
This instrument will remain without changes for permit holders and generation projects that received their permit in the former legal framework. The current legislation does not foresee preferential wheeling arrangements for new RE generation projects, so these will not be able to pursue additional PPAs or off-takers in the new wholesale market if they wish to continue to use the wheeling and banking instruments. However, new projects will benefit from the certificates mechanism.
Banking of Renewable Energy Grid connected, utility scale renewables in Mexico could take advantage of favorable banking provisions.8 In 2010, the CRE issued and approved specific regulations in order to promote the
8 Projects holding a valid generation permit issued before August 2014 are eligible.

17
development of generating projects based on renewable sources; this established the basis for interconnection contracts signed by generators with the CFE. Under the former legal framework, energy banking between a RE generator (permit holder) and the CFE applied in the same manner to all renewable generation projects with an installed capacity of 500 kW or more. This instrument helps reduce the effect of wind generation variability by not requiring energy produced to be used by the off-taker in the same time period.
The energy bank enables generators to virtually bank the excess generated energy (during a certain period) in the utility’s energy bank, and then use that excess energy during periods when the project’s generation is insufficient to supply a specific load.
All energy that is generated but not consumed by the load centers can be virtually stored (i.e., accounted for in billing mechanisms, not physically stored as electricity) by the CFE. The utility stores energy from all time periods and supplies that energy in analog periods or in different periods—even different days or months. When the energy is supplied by the utility, the utility considers the specific period when the energy was stored and the specific period when the energy is being withdrawn in order to make the corresponding compensations. The debit and credit of energy reflects the value of energy at the time the transaction took place, and the generator has 12 months to make use of the banked energy.
According to the interconnection contract, at the end of one year, the generator can sell the accumulated excess energy to the utility at a price equal to 85% of the Total Short-Term Cost, which is the marginal electricity price calculated by the utility.
In this scheme, a bidirectional energy meter records the energy supplied by the utility to the customer and the excess energy delivered by the generator to the grid. Figure 8 illustrates the concept of the energy bank.
Figure 8. Diagram illustrating the energy compensation in the Energy Banking Model

18
Other Relevant Provisions Open Season Transmission Development in Mexico CFE conducted an open season process for transmission development when the utility encountered insufficient infrastructure and service to new wind generation and efficient-cogeneration. The open season process may be revised but is currently not expected to continue under the new regulatory framework. In this process, the modification or reinforcement of the transmission infrastructure was designed to reserve capacity for participants who have an interest in developing generation projects in a specific region in which the transmission infrastructure is not sufficient to evacuate energy. In order to reserve capacity, developers had to deliver guarantees (e.g., standby letter of credit) to prove they have a serious interest in the development of the infrastructure.
The objective of the open season mechanism was to facilitate coordination in wind transmission infrastructure design, development, and financing. Through this mechanism, private developers worked with the federal government to develop the necessary transmission infrastructure; open season was only used for wind power; solar power was not yet price competitive.
The first open season was carried out in a southern region of Mexico known as The Istmo of Tehuantepec in order to transmit nearly 2,000 MW of wind power from private developers and the utility (CFE). Private developers reserved capacity in the transmission infrastructure and paid for the development of new transmission. The success of the process led to a second open season process (under way in February 2016) and to the implementation of similar mechanisms in other Mexican states, such as Tamaulipas, in the north.
Considering the reserved capacity for the second open season and the current installed capacity in Mexico, the total wind power installed capacity once all projects are completed is expected to be nearly 6,500 MW from the current 2,800 MW of capacity.
This mechanism was implemented under the former legal framework; however, the new legislation does not foresee continued application to the open season process. Under the new legislation, the required transmission from a specific location (e.g., Oaxaca) can be included in the expansion programs for the National System and paid through the electricity rates if the benefits of the transmission project are greater than their costs. Private companies are allowed to participate in the expansion of the grid.
Conclusions and Lessons Learned for Regulators In Mexico, the CRE has established a regulatory strategy based on instruments that aim to promote renewable generation projects. Beyond establishing preferential terms for renewable projects, the strategy recognizes their special features and tries to reduce the impact of intermittent RE.
Wheeling and banking instruments played a fundamental part in the deployment of renewable generation projects in Mexico.
• The main strength of these methods is that they enable renewables to compete against conventional generation without involving additional costs to consumers.
• In the case of wheeling, postage stamp rates provide the developer certainty regarding the costs associated with the use of transmission for the entire life of the project (since the rates no doubt change significantly over time). Banking, on the other hand, allows renewable

19
projects to address the barrier associated with the variable nature of the sources and to maximize the use of energy resources.
• The RE Act established the basis for the deployment of future renewable projects in Mexico. In this context, wheeling and banking instruments played a key role in the integration of more renewable generation capacity. The CRE considers the instruments successful, as seen by their immediate acceptance by all relevant players (i.e., the Ministry of Energy, the CFE, financing entities, developers, and permit holders and investors) and attributed to the fact that neither of the instruments imposes additional burdens to consumers.
• Further, these instruments promote competition among renewable and conventional project developers, facilitate access to the national transmission network, and help mitigate impacts related to renewable sources, such as the distances from generation to load centers and the issue regarding the variability of the source.
The CRE holds that the combined implementation of the instruments, along with the open season process, was a driver for the successful development of renewables in Mexico. As the new energy market unfolds, it remains to be seen how much renewable energy will be deployed. As of early 2016, renewable developers are focusing on bidding into CFE’s new auction mechanisms rather than the bilateral market.

20
India Case Study Authors: Sushanta K. Chatterjee (Central Electricity Regulatory Commission, India), Rakesh Shah (SunEdison India)
Background India’s power sector has observed substantial progress in terms of power generation in the past decades and especially the rapidly increasing role for renewable energy in the last 10 years. The installed generation capacity has increased to about 280 gigawatts (GW) at the end of October 2015 (Central Electricity Authority 2015), as reflected in Figure 9.
Figure 9. Overall Capacity Mix in India
Source: Central Electricity Authority (CEA) 2015
Figure 9 shows that Indian power sector is largely coal-based, with the total installed capacity comprising 170 GW (61%) coal, 24.5 GW (9%) gas, 1.0 GW (1%) diesel generation, 42.5 GW (15%) hydro, 5.8 GW (2%) nuclear, and 36.5 GW (13%) from renewable energy sources.
Renewable Energy in India: Achievement So Far According to the Central Electricity Authority, as of October 2015, the total share of grid-connected renewable energy was just over 36 GW, which represents approximately 13% of India’s total installed electric generating capacity, the bulk of which is wind (24 GW). India has around 896 GW of RE potential from wind, small hydro, and biomass sources (MNRE 2015). The highest potential is solar (749 GW), followed by wind (102 GW), biomass (agricultural residues and cogeneration totaling 24 GW), and Small Hydro Power (SHP) (20 GW).
India has vast renewable energy potential that remains unharnessed. The Indian government has set ambitious energy growth targets: to deliver electricity to all Indian citizens by 2020 and to deploy 175 GW of renewable energy (41% of total power generation capacity) by 2021-22, which includes 100 GW of solar and 60 GW of wind energy (Bloomberg 2015). The Indian government has historically been instrumental in renewable energy development by passing policy and regulatory interventions that have made renewable energy projects possible.

21
Enabling Policies and Regulations: RE Deployment India has experimented with various policy measures to promote the development of renewable energy sources—fiscal incentives like capital subsidy (i.e., subsidy provided in the capital cost of a project), accelerated depreciation benefits (i.e., benefits in the form of higher depreciation in initial years leading to tax savings), tax exemption in some cases, among other policies—with marginal success (Engelmeier 2016). While these executive initiatives did result in investments, the policymakers felt the need for a greater impetus to RE development through legislative measures. Thus, the Electricity Act of 2003 contained several regulatory interventions for RE promotion.
Electricity Act of 2003 The Electricity Act (EA) (Ministry of Law and Justice 2003) was enacted to bring about fundamental changes in institutional and market structures in the power sector. The entire power sector has gone through a massive transition since then: older institutions like state electricity boards have been unbundled and new institutions like power pools and power exchanges have come to play an important role.
Renewable Purchase Obligation Section 86 (1)(e) of the EA 2003 mandates the state electricity regulatory commissions (SERCs) to promote cogeneration and generation of electricity from renewable sources by providing suitable measures for grid connectivity and sale of electricity to any entity; it also specifies that, for purchase of electricity from such sources, a percentage of the total consumption of electricity in the area should be from a distribution licensee. Accordingly, all SERCs required that a certain percentage of the total electricity consumed by the Obligated Entities in their states have to procure renewable energy (Soonee et al. 2012). This is known as the renewable purchase obligation (RPO). As per the act, the obligated entities include distribution licensees, open access customers (those who purchase power from someone other than a distribution licensee), and captive customer (those who are self-generating).
In order to promote solar energy, the 2006 Tariff Policy was amended in January 2011 (Ministry of Power 2011), wherein SERCs were mandated to carve out minimum solar-specific purchase obligations (SPOs). Moreover, such SPOs should be at least 0.25% in 2012-13 and it should be increased to 3% by 2022. Accordingly, almost all states have specified an SPO. State targets range from 0.25% to 3%, however, many states do not have interim targets (MNRE 2015). The Tariff Policy was amended again in 2016, increasing the SPO to 8% of total consumption, excluding hydropower generation, by March 2022 (Ministry of Power 2016).
Other relevant policies include the National Electricity Policy, which stipulated several conditions for promotion of RE, and the Tariff Policy, which elaborates on the role of state regulatory commissions. Figure 10 illustrates the evolution of policies and growth in renewable energy in India.

22
Figure 10. Impact of various regulatory and policy initiatives in India
Source: MNRE (2013)
Major Obstacles to Successful Deployment of 175-GW RE Target In order to achieve the 175-GW target, intra-state, in addition to interstate, renewable transmission will be necessary. To date, wheeling and banking policies in some states have enabled renewable deployment, but three major issues remain:
1. Currently, capacity based wheeling charges are used, which is a disadvantage to RE projects, which typically have considerably lower capacity rates than non-RE projects (APTEL 2012).
2. A large number of state-chartered distribution utilities are not credit-worthy, which leads to insufficient and stagnant demand within the REC market (size and customers) and hence, low prices (Shrimali et al. 2012)
3. With the increase in penetration of RE, the balancing costs increase and also the balancing capacity requirement increases (Mercados 2012).
These issues are examined in detail and followed by potential solutions and perspectives of three key stakeholders.
Business Options for an RE Generator to sell RE There are mainly seven types of commercial market models for grid-connected, MW-scale RE projects.
1. Sale of power to the local distribution utility at a tariff determined by the respective SERC or adopted by the respective SERC in case of procurement of RE through competitive bidding for fulfillment of distribution utility’s RPO.

23
2. Sale of power to the obligated entities in other states for fulfillment of their RPOs.
3. Sale of electricity to local distribution licensee at its Average Pooled Purchase Cost (APPC) and RECs issued to RE project developer.
4. Captive use in case of an RE plant not using concessional wheeling and transmission charges and banking and solar RECs issued to the captive generating plant.
5. Captive use in case of an RE plant using concessional wheeling and transmission charges and banking and no RECs issued to the captive generating plant.
6. Sale of electricity to open access user at mutually decided rate and RECs issued to RE project developer.
7. Sale of electricity at day-ahead power market at power exchanges and RECs issued to RE project developer.
In the first case, RE procurement is limited by the RPO levels and the RE resource-rich states. If RE resource-rich have achieved their RPO, they might not be interested in buying more RE.
Business models 3-7 above are off-shoots of a REC mechanism. However, there are huge unsold inventories of non-solar (which include RECs generated from wind, biomass, bagasse-based cogeneration, small hydropower, and others) and solar RECs as of today due to lack of enforcement of RPO by SERCs. RPO target setting and enforcement, especially in RE resource-poor states, is also perceived to be very weak at present and therefore, obligated entities are not coming forward to purchase RECs. RE generators and financial institutions have lost interest in projects under REC mechanisms (Chatterjee 2013).
The main contributing factors leading to poor market liquidity and underutilization of RECs (and hence, low prices) include:
• Poor enforcement of RPOs by SERCs (Niti Aayog 2015)
• Poor financial health (i.e., low or non-existing credit capacity) of state-level distribution companies (Chatterjee 2013)
• Distribution companies’ preference for meeting RPOs through procurement of RE under long-term PPAs (Chatterjee 2013).
Because of these circumstances, the existing REC mechanism to support both intrastate and interstate supply, especially for new RE IPPs, has been hampered. This will continue to be a problem until there is mechanism to create required financially viable demand for new RE generation.
Since many utility companies prefer to procure actual RE and not just the RECs, and most large new RE projects will need to find out-of-state off-takers, there is a need for a viable wheeling arrangement for intra-state and inter-state transmission of solar and wind power.
Thus, the present market models for RE would not adequately support targeted new RE capacity additions. There is insufficient demand for RE from the government distribution licensees that can fulfill new RE capacity targets set by central government. To sustain RE growth in coming years, a new market model that addresses the limitations of the present models—especially the regional resource disparity and the linkage to RPOs—is necessary. Poor financial health of distribution licensees in the resource-rich states restricts the distribution licensees from procuring high-cost
24
variable renewable energy (VRE) generation beyond the RPO targets, and meanwhile, RE resource-deficient states are not coming forward to procure RECs to fulfill their RPOs.
Given the distribution companies’ preference to procure RE rather than buying RECs, and recognizing the fact that the RE resource-rich states would have appetites limited to their RPO targets, most of the future RE generation would have to move out of the state boundaries in terms of contracting. This makes the second business model (i.e., sale of power to the obligated entities outside a state) the most viable option going forward. In order for this model to succeed, a robust and clearly defined policy and regulatory framework is necessary for transmission/wheeling and banking arrangements within and across states. In the next sections, we discuss the prevailing arrangements in the Indian context.
Wheeling and Banking and Transmission Access Issues Large-scale planned RE in India is expected to come from RE resource-rich sites located in areas remote from major load centers. This renewable power is required to be transmitted to the load centers located either in state or in another state. The host state may not be able to consume all the power generated and hence, it may need to be transmitted for long distances to load centers in other states. This will require open access through transmission and distribution systems for transmission and wheeling of the electricity generated.
Section 86 (1)(e) of EA 2003 requires SERCs to develop policies that will promote the sale of electricity to any person. In any open access transaction between an RE generator and its buyer (open access user), which could be an obligated entity or otherwise, regional/state transmission charges and losses are required to be paid depending upon connectivity of the generator and the buyer at the federal or state transmission networks. Further, if the generator and/or the buyer are connected at the distributed voltage level, appropriate wheeling charges and losses are also required to be paid. Importantly, the Capacity Utilization Factors of wind and solar projects as specified in the RE tariff regulations /orders issued by the CERC and various SERCs are in the range of 19-26.5%. This is much lower than that of the baseload generation (generally at the level of 80-90%) (CERC 2014a). Based on the current mechanism for determining wheeling charges on INR (Indian rupee)/kW/day basis from various SERCs (e.g., Gujarat, Rajasthan, Andhra Pradesh), this makes the wheeling charges for RE generators almost four to five times the conventional open access transaction.
Given that inter-state transactions are likely to become more common, another way forward is to connect the generating stations directly to the Inter State Transmission System (ISTS) network. Connectivity and access to the ISTS network could open the solar and wind markets by facilitating more PPAs with larger numbers of potential off-takers (which could include obligated and non-obligated entities).
Next, we examine the wheeling and banking strategies and regulations for optimal RE deployment framed by the CERCs and SERCs in India.
Inter-state sale of RE Regulatory Framework for RE Wheeling The CERC addressed the need for concessional transmission charges for the then-expensive solar PV tariffs to enable inter-state sale of RE PV from the proposed large utility-scale solar PV projects in high solar resource states like Rajasthan and Gujarat. These regulations addressed the sharing of interstate transmission charges and losses. These regulations exempted solar PV projects from

25
payment of transmission charges and losses for inter-state transmission to promote relatively more expensive solar PV in 2010 (See 7(1) (U) & (V) (CERC 2010)).
Further, the CERC came out with amended regulations in 2015 (CERC 2015), and continued such exemption until June 30, 2017. This will facilitate inter-state sale of solar power and in turn, encourage new investment in solar energy. The cost of exempting solar from interstate transmission charges and losses is in the range of 0.04 cents/kWh (2.62 Indian paise) for a solar capacity of 15 GW (CERC 2015). The central government issued the revised Tariff Policy in 2016, extending the exemption of interstate transmission charges and losses to wind generators (Ministry of Power 2016).
Banking-related Provisions of RE Generation Banking is a provision wherein an RE power-generating facility is allowed to bank the electricity it produces that is not used by its off-taker or to borrow the energy it needs to sell to the buyer in the event of its inability to produce for a given duration (from 15 minutes to one year). These deviations are accounted for and the net surplus or short-fall is financially settled on a monthly, quarterly, or annual basis. Banking provisions in India are typically provided at the point of consumption by the distribution licensees.
The mechanism of net settlement of deviation from schedule for large wind and solar, introduced by CERC in 2015 provides a unique banking arrangement without any concessional treatment. As per this mechanism, the excess or under generation vis a vis schedule generation of such (regional level) wind and solar plants is settled at the PPA rate in the regional pool.
Several SERCs have established banking regulations, which include, inter alia, the fee to be paid and the period or timing of withdrawal to be determined by the appropriate commission for intra-state transactions. Similar dispensation is not given to inter-state transfer; the existing banking mechanism is currently not adequate to enable inter-state transfer of wind and solar energy.
Table 2 and Table 3 describe banking and energy accounting treatment given to RE under open access transactions in RE resource-rich states. In addition, several states have provided concession in open access charges to RE at intra-state levels; these are summarized in Table 4 below.

26
Table 2. Summary of State-Level Balancing Mechanisms for RE Generation
State Qualified Participants
Banking Period Energy Settlement Mechanism
1
Karnataka Captive Captive and Third-party
Monthly: Applicable RE projects under REC mechanism Yearly: Applicable to RE projects not under REC mechanism
ESCOM shall pay at APPC rate to the company for the banked energy remaining unutilized at the end of every month (Karnataka 2015). ESCOM shall pay at 85% of the latest feed-in tariff determined by Karnataka Electricity Regulatory Commission for relevant category of RE power to the company for the banked energy remaining unutilized at the end of the FY.
2 Andhra Pradesh
Captive and Third-party
Monthly Banking of 100% of energy permitted for all captive and open access/scheduled Consumers all year. Banking charges shall be adjusted in kind at 2% of the energy delivered at the point of withdrawal. The unutilized banked energy shall be deemed energy purchases by distribution companies at the pooled purchase cost (typically below PPA tariff) determined by Andhra Pradesh Regulatory Commission annually.
3 Telangana Captive and Third-party
Yearly Banking of 100% permitted from January to December. Banking units cannot be consumed or redeemed from February to June, nor during peak hours (i.e., 6:30 PM to 10:30 PM). The energy unutilized by December of that year shall get lapsed (i.e., RE generator loses the value of unused banked energy).
4 Tamil Nadu Captive and Third-party
Monthly After adjustment against respective month’s consumption, balance energy shall be sold at 75% of the respective solar FiT fixed by the commission. (IREDA 2014)
5 Rajasthan Captive Monthly After adjustment against respective month’s consumption, RE power generator is entitled to get payment at 60% of energy charges applicable for large industrial power tariff at 10% of unutilized banked energy. Energy in excess of 10% shall lapse. (RERC 2015)
6 Gujarat Captive only Monthly The wind and solar generators are eligible for one month’s banking for the electricity generated during the same calendar month. However, they are eligible to utilize the same during the month in proportion to the energy during peak and normal hour periods. Any surplus energy of banked units in the given billing cycle available after set-off shall be deemed sales to the concerned distribution licensees at an APPC rate determined by the commission for the relevant year.

27
Table 3. Regulatory Concessions in Solar Energy Open Access Charges
State Wheeling Charge for using Transmission System
Wheeling Loss in Transmission System
Wheeling Charge for Using Distribution System
Wheeling Loss in Distribution System
Cross Subsidy Surcharge (CSS)
Electricity Duty/ Tax on Sale of Electricity
Andhra Pradesh Exempt Applicable Exempt Applicable Exempt Exempt
Rajasthan 50% of rates as applicable to conventional power Applicable Applicable Applicable Exempt Exempt
Maharashtra Concessional rates applicable to conventional Short-term open access transactions
Applicable Applicable
Exempt
25% of normal CSS applicable to conventional power
Applicable
Tamil Nadu
30% of normal charges to solar power. However, for the plants with remaining RECs, 100% of relevant charges will be applicable.
Applicable 40% of normal charges Applicable
50% of the CSS for third-party open access consumer
Exempt
Punjab Exempt Exempt Exempt 2% Applicable Exempt
Karnataka Exempted for non–REC projects
Gujarat
Wheeling with injection at 66 kV or above (applicable to solar plants of capacity greater than 4 MW): no exemption and normal open access charges. Below 66 KV: payment of transmission charges as applicable to normal open access customers.
Wheeling with injection at 66 kV or above No exemption in losses
11 kV or above and below 66 kV (within the area of same distribution licensee) at 3% of the energy fed in to the grid; Otherwise, normal open access charges apply and transmission and distribution loss at 10%.
Transmission and wheeling loss at 7% Wheeling at two or more Locations at INR (Indian rupee) of 0.05 per unit
Exempt Applicable

28
Table 4. Regulatory Concessions in Wind Energy Open Access Charges
State Wheeling Charge for Using Transmission System
Wheeling Loss in Transmission System
Wheeling Charge for using Distribution System
Wheeling Loss in Distribution System
Cross Subsidy Surcharge (CSS)
Electricity Duty/Tax on Sale of Electricity
Andhra Pradesh Exempt Applicable Exempt Applicable Exempt Exempt
Rajasthan Applicable Applicable Applicable Applicable Exempt Exempt
Mahara-shtra
Concessional rates applicable to conventional Short Term Open Access transaction
Applicable Applicable Exempt
25% of normal CSS applicable to conventional power
Applicable
Tamil Nadu
40% of normal charges applicable. However, WEGunder REC Mechanism normal charges will be applicable.
Applicable 40% of normal charges Applicable
50% of the CSS for third-party open access consumer
Exempt
Karnataka 5% of energy wheeled (in kind) Exempt Exempt
Gujarat
For captive consumption: a) 66kV and above, normal open access charges apply. For third-party sales, normal open access charges apply.
For consumption < 66 kV, transmission and wheeling loss of 10% will be applicable for more than 1 WEG and 7% for 1 WEG consumer. Wheeling at more than two locations is permitted with a charge of INR 0.05 per unit on energy fed to the grid.
Exempt Applicable
Punjab Exempt Exempt Exempt 2% Applicable Exempt

29
In accordance with the CERC REC regulations, solar and wind power plants which are captive generating plants (CGP) and which opt for an REC mechanism shall have to pay the normal wheeling, banking, and other charges as specified by the concerned state commission. The CERC has also proposed to disallow RECs to such CGPs and also to open access consumers benefiting from concessional wheeling charges, banking facilities, and waiver/concessional CSSs.
Stakeholder Perspectives This section provides an overview of stakeholder perspectives on wheeling and banking provisions in India. Perspectives include those of the renewable generator, the distribution licensee, and the transmission licensee. Renewable generators are using discounted wheeling rates and banking provisions to sell to large commercial and industrial users instead of the distribution licensee. This creates revenue problems for transmission and distribution licensees.
RE Generator’s Perspective RE IPPs Tend to Prefer PPAs with Credit-worthy Large Commercial/Industrial Users Instead of Distribution Licensees As per the EA 2003, open access is allowed to 1-MW+ consumers to source power from any source other than the local distribution licensee. Some SERCs’ have even allowed open access for generators <1 MW (MERC 2015). For captive consumption of any size, open access is permitted under the act. RE generators are selling power to third parties through open access at mutually decided rates; they are often able to sell power to large commercial and industrial consumers at prices comparable to applicable retail tariffs. Even after deducting the open access charges and the CSS, the generators can earn more by selling to large commercial and industrial customers than to the distribution licensee. Similarly, large industrial and other large consumers install RE-based CGP and wheel the generated power through open access to meet their own electricity needs and selling surplus power generated in their units to third parties. This self-consumption substitutes for the consumption of power by distribution utilities at retail tariffs. The retail cost of RE generation in such cases is usually lower than a utility’s retail tariff, thereby making it a lucrative option for large commercial and industrial customers (CERC 2014b).
Benefits in the form of concessional wheeling or transmission charges, banking facilities, or concession/exemption in levy of CSSs play a major role in promoting such transactions. The cost of RE generation is slightly higher than conventional generation like coal- and lignite-based generation, but with concessional open access charges and banking facilities, such projects become viable.
Distribution Licensee’s Perspective Waiver of CSS and Discounted Wheeling Charges Distribution licensees are concerned with losing high-tariff customers, which would leave largely subsidized customers to serve. Fear of losing a large consumer base has been a major deterrent to granting open access. As per the EA 2003, the open access consumers have to pay open access charges such as wheeling charge and losses, standby charges, and CSSs on top of electricity cost. But the open access charges and CSSs are not sufficient to address the economic loss to the distribution licensee (NPTI 2013).

30
Banking Provisions Result in an Increase in Distribution Licensee’s Power Purchase Costs Wind energy generation is available at its maximum during the monsoon, when distribution licensees’ overall demand is lessened due to low agricultural load as well as lower air-conditioning loads. During this time, distribution licensees have to scale down to lower-cost thermal generation in order to absorb the wind energy, part of which will be treated as banked energy. But during the non-windy season when the system demand is higher and consequently cost of power is also high, use of banked energy by the captive and third-party users results in more costly power purchase by the distribution licensee to service such banked energy. Quite often, in the event of their inability to buy expensive power during such a period, the distribution licensees resort to load shedding. Load management becomes difficult and results in adverse impact to consumers in terms of unreliable power supply (Live Mint 2015).
Switching of cross subsidizing consumers. Distribution licensees face revenue loss due to migration of industrial and commercial consumers as they subsidize consumers paying lower tariffs. This forces distribution companies to seek higher tariffs to offset the loss of cross subsidies from high-paying industrial and commercial consumers.
Concerns of distribution licensee in RE resource-rich states. In the RE resource-rich states, if RE IPPs are allowed the benefit of concessional wheeling, they would prefer to sell under open access if power sales under open access are more than feed-in tariffs (FiTs). This would lead to a situation wherein the distribution licensees in such states would have to purchase RECs from the open market, which will be an additional cost, even after investing huge amounts in infrastructure construction of lines and substations for RE procurement. This also has the potential of increasing the distribution licensees’ RPO compliance cost.
Transmission Licensee’s Perspective In order to promote RE, if procurers’ obligation to pay transmission charges and loss is waived or reduced (as in states like Karnataka, Andhra Pradesh, Telangana, and Madhya Pradesh), any shortfall in the annual revenue requirement (ARR) needs be socialized on distribution licensees and other open access users. Any impact on distribution licensees would have impacts on retail consumers’ tariffs. Recently the Rajasthan Electricity Regulatory Commission (RERC) has decided to reduce the transmission charges for solar projects to be commissioned by March 31, 2018 or 2000 MW, whichever comes first. The impact on the retail consumer tariffs of Rajasthan would be around 5.15 Paise per unit for the entire 25-year period (100 Paise equal one INR). The detailed calculations can be seen in Table 5.

31
Table 5. Impact Analysis Distribution Company Retail Customers
Units 2014-15 2016-17 2017-18
Net Transmission charges to be recovered from distribution companies and Long-Term Open Access Consumers
10 million INR 2044.66
Approved transmission capacity for distribution companies MW 11017 Long-Term Open Access Customers MW 425.42 Total Load on Transmission Capacity 11442.42 Transmission Tariff INR/kW/Day 148.9 Energy Requirements for distribution companies in FY 2013-14 MUs 66894.9 Energy Requirements for Open Access customers in FY 2013-14 MUs 2485 Total Energy requirement of State MUs 69379.9 69379.9 69379.9 Expected capacity addition of Solar Power by 2018 MW 1000 2000 Total Load on Transmission Capacity after addition of Solar MW 12442.42 14442.42
Equivalent Increase in Total Transmission Licensee's ARR 10 million INR 2223.4 2580.7
Additional Trans. Charges due to Solar projects 10 million INR 178.7 357.4
50% of such Additional Trans. Charges to be collected from Solar 10 million INR 89.3 178.7
Net charges to be collected from the distribution companies and other long-term open access users 2134.0 2402.0 Total Energy Requirements of State (assuming same level of consumption) MUs 69379.9 69379.9 Transmission tariff for use of State Transmission System paisa/kWh* 29.47 30.76 34.62 Per Unit impact on retail consumers of distribution companies paisa/kWh* 1.29 5.15
*Note: One INR is equivalent to 100 paisa.

32
Conclusions and Lessons Learned for Regulators India has made much progress to date and has an ambitious national plan to increase RE capacity from 38 GW to 175 GW by 2021-22. The policies and regulations at the national level continue to enhance incentives and promote new RE capacity in India. However, market-driven, credit-worthy demand—as well as policies and regulations—need to evolve to enable export from RE resource-rich states to -deficient states so that they can meet their RPO targets.
The EA 2003 mandates SERCs to promote cogeneration and generation of electricity from renewable sources by providing suitable connectivity to the grid and allowing sale to any person. The regulatory framework of RE wheeling and banking renewable energy is woven around this mandate under the statute.
Depending on whether a state is rich in renewable resources, has power shortages, a surplus in generation, and other factors, the state may be interested in providing discounted wheeling and banking mechanisms for renewable generators. Several southern states facing power shortages have announced concessional wheeling and banking mechanisms at promotional rates to facilitate captive use and sale to third parties of wind and solar power. At the same time, western region wind and solar resource-rich states like Gujarat and Maharashtra, which have surplus generation, are not in favor of extending such benefits in the event of third-party sale of RE power.
To accommodate the unique aspects of variability, low-capacity utilization factor and high cost of RE generation, the CERC has relaxed the standards for connectivity with ISTS for RE projects. The CERC has recognized the importance of concession for inter-state wheeling of solar PV projects in solar resource-rich states. However, wind energy was originally excluded from the same incentives. In 2016, the central government exempted both wind and solar generation from interstate transmission charges and losses.
Similarly, the majority of solar and wind resource-rich states has introduced policies and regulations (including waivers or reduced wheeling charges, and in some states, allowances) for monthly banking of RE for settlements. This inequality needs to be addressed in a timely manner.
The following are some of the lessons learned from wheeling and banking in India:
• While some states have provided discounted wheeling and favorable banking provisions for wind and/or solar generation for intrastate transaction, not all states have done so. The central government has supplemented the intrastate provisions by exempting solar and wind from interstate transmission charges and losses, aimed at encouraging investment in order to reach the 175 GW of RE by 2022.
• While the current cost estimate for exemption of intrastate transmission charges and losses is insignificant at the level of 15 GW of solar, the government may want to consider future impact assessments as wind and solar increase beyond that level.
• Policies may need to evolve over time to support the implementation of different goals. For example, states with favorable provisions for wheeling wind energy may want to consider expanding those provisions to large-scale solar.
• In the renewable resource-rich states, the utilities need to buy RECs for fulfillment of RPO as RE IPPs tend to sell power to third parties with concessional wheeling and banking facilities.

33
This results in an increase in RPO compliance cost for the distribution licensees, which they will need to be able to recover through their respective state regulators.
• Transmission licensees are required to close the gap in the recovery of transmission charges from other open access consumers, and distribution licensees, if concessional transmission charges are given to RE IPPs. Ultimately, the distribution licensees need to recover all this from the total number of retail consumers through state regulatory processes.
• An evaluation of the impact of loss of revenue to the distribution licensees and potential CSSs from higher-paying large customers to retail customers is important for successful implementation of wheeling and banking. Under India’s open access law, large customers are able to leave a distribution licensee and contract with an IPP. This potential loss of revenue to the distribution licensees has made them less willing to support open access implementation.
• Banking RE with an adequate timeline for settlement is critical to broadening and increasing the number of RE off-takers from distribution licensees. Some states have provided banking provisions for solar and wind for intra-state transactions, which make such transactions more feasible.
• India may explore regional balancing of variable RE generation as it continues to move toward unbundling of energy (including) supplies from its delivery (i.e., carriage vs. content) virtual net metering and/or synthetic PPAs between RE developers and credit-worthy buyers of RE attributes (i.e., RPOs) with increasing role of wholesale market for energy and RPOs.

34
Synthesis of Lessons Learned for Regulators Regulators in many countries are considering the mechanisms to achieve national RE targets and the beneficial role of RE to the global power market. Regulators’ roles and potential actions will vary depending on the electric market structure, effectiveness of existing rules and regulations for wheeling and banking of RE, and major gaps or issues faced in achieving national RE generation targets. While a platform for wheeling and banking exists in all countries, its exact form will be tailored to that particular country’s context. For example, the creation of RTOs, as was done in the United States, would not be feasible in all regulatory contexts. In this section, we present a synthesis of lessons learned for regulators—from the U.S., Mexican, and Indian perspectives.
In the U.S., Mexico, and India, regulators have enabled larger markets for renewable energy by creating larger pools of buyers and sellers. In some cases, creating these larger markets has been tied to wheeling and banking provisions specifically. Principles of effective wheeling and banking policies to promote renewable generation include:
• Expanding access to renewable energy consumers. Effective policies have expanded market access for consumers wanting RE. In the United States, virtual PPAs allow customers to purchase RE from facilities not located on their premises. In India, industrial customers are able to use open access to acquire RE at a cost lower than the utility tariff. However, such avenues may create other economic problems of loss of revenue and level of cross-subsidy funding for the local utilities serving such industrial customers.
• Creating long-term wheeling and banking policy certainty. Renewable generators typically finance their projects over a long period (e.g., 20 years). To provide certainty about future revenues, policymakers can create policies that provide long-term certainty to developers. If new policies are implemented, existing generators can be grandfathered in. A case example would be Mexico: although the country is undergoing major market reform, existing generators will be able to use wheeling and banking policies to perform under their existing PPAs, but this will not be available to new generators.
• Incentivizing RE through discounted transmission access. Some regulators may want to incentivize RE through wheeling and banking policies; this can be structured so that renewable generators pay less than traditional generators for transmission access. For example, in Mexico, renewable generators paid a discounted postage stamp transmission rate. In some states in India, renewable generators pay discounted wheeling rates and have favorable banking provisions to help manage variability of RE generation. In 2016, the central government exempted wind and solar from interstate transmission charges and losses.
• Assessing the cost implications of discounted rates. Regulators may want to evaluate the cost implications of providing discounted wheeling rates and favorable banking policies. In India, a assessment found that discounted rates for interstate transmission of 15 GW of solar would have insignificant impact.
• Listening to affected renewable and non-renewable stakeholders. Regulators can create forums to hear from affected stakeholders when they are considering new policies or revisions to existing policies. Creating postage stamp rates, for example, has different impacts on renewable and non-renewable generators. Engaging both groups can provide valuable perspectives to regulators.

35
• Simplifying the transmission rate structures. Simple rate structures and the creation of larger balancing areas have enabled renewable generators to balance and firm power more efficiently. The postage stamp rate used in Mexico and currently in the United States (Texas) have provided a transparent, simple signal to renewable generators about their future costs.
• Allowing banking on an annual basis. Banking policies that provide an annual adjustment allow renewable generators with seasonal production to maximize their production value. In Mexico, banking on an annualized basis allows renewable projects to address the barrier associated with the variable nature of the sources and to maximize the use of energy resources that enables bankable PPAs.
Wheeling and banking policies have been used around the world and exist in many forms. While existing wheeling and banking policies have primarily supported utility-scale wind generation, in the future, there could be a shift towards supporting utility-scale solar and other renewable facilities using both physical transmission of RE and creation of synthetic supply and off-take of RE (provided there is a large, efficient, and transparent wholesale power market with critical mass, as the United States has seen and as Mexico moves in that direction).
In the future, the United States may continue to see an increased emphasis on virtual PPAs, rather than use of physical delivery, as major information and communications technology companies are doing (e.g., Facebook, Yahoo) as a way to expand renewable access to a larger number of customers without limiting the market to franchised distribution utility companies (Miller et al. 2015). Virtual PPAs allow developers to site within regions with the greatest renewable resource and favorable market conditions while creating a larger pool of potential purchasers of their generation. They eliminate the need for wheeling and banking as the developer provides the energy to the wholesale market rather than a specific end-user. Similar initiatives are underway at early stages and with different frameworks in Mexico and India. For instance, the schedule based net settlement of the deviation of large wind and solar, introduced in India in 2015, also facilitates banking without providing discounted rates.
The electric market restructuring in Mexico is transforming the nature of wheeling and banking with the advent of expected fast-growing wholesale power markets. Former support instruments will continue to apply for holders whose projects were registered prior to the entry of the market restructuring legislation. Nevertheless, the CRE continues analyzing the possibility of such instruments remaining under the new competitive market.
In some countries, regulators may want to consider extending exemptions to traditional wheeling and banking rates, after assessing the cost implications.
Regulators are an important bridge between legislative changes and electric market functionality. By considering the needs of all stakeholders, regulators can establish long-term policies and market structures to enable effective RE wheeling and banking.
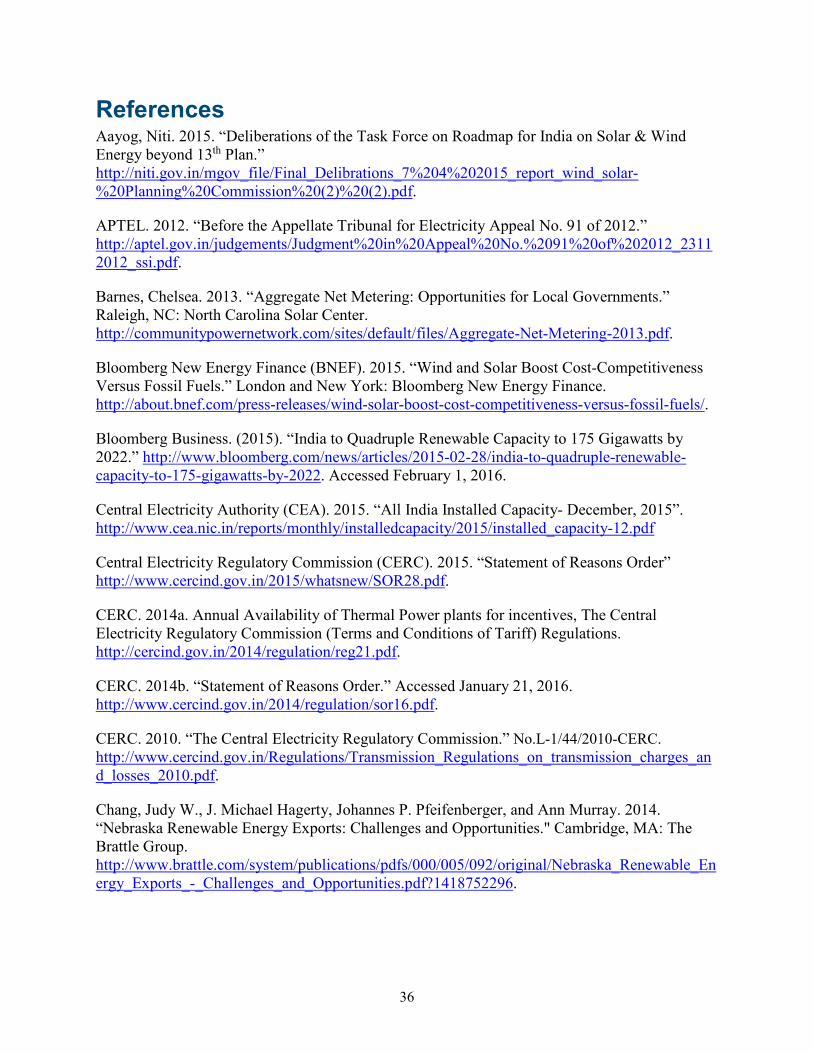
36
References Aayog, Niti. 2015. “Deliberations of the Task Force on Roadmap for India on Solar & Wind Energy beyond 13th Plan.” http://niti.gov.in/mgov_file/Final_Delibrations_7%204%202015_report_wind_solar-%20Planning%20Commission%20(2)%20(2).pdf.
APTEL. 2012. “Before the Appellate Tribunal for Electricity Appeal No. 91 of 2012.” http://aptel.gov.in/judgements/Judgment%20in%20Appeal%20No.%2091%20of%202012_23112012_ssi.pdf.
Barnes, Chelsea. 2013. “Aggregate Net Metering: Opportunities for Local Governments.” Raleigh, NC: North Carolina Solar Center. http://communitypowernetwork.com/sites/default/files/Aggregate-Net-Metering-2013.pdf.
Bloomberg New Energy Finance (BNEF). 2015. “Wind and Solar Boost Cost-Competitiveness Versus Fossil Fuels.” London and New York: Bloomberg New Energy Finance. http://about.bnef.com/press-releases/wind-solar-boost-cost-competitiveness-versus-fossil-fuels/.
Bloomberg Business. (2015). “India to Quadruple Renewable Capacity to 175 Gigawatts by 2022.” http://www.bloomberg.com/news/articles/2015-02-28/india-to-quadruple-renewable-capacity-to-175-gigawatts-by-2022. Accessed February 1, 2016.
Central Electricity Authority (CEA). 2015. “All India Installed Capacity- December, 2015”. http://www.cea.nic.in/reports/monthly/installedcapacity/2015/installed_capacity-12.pdf
Central Electricity Regulatory Commission (CERC). 2015. “Statement of Reasons Order” http://www.cercind.gov.in/2015/whatsnew/SOR28.pdf.
CERC. 2014a. Annual Availability of Thermal Power plants for incentives, The Central Electricity Regulatory Commission (Terms and Conditions of Tariff) Regulations. http://cercind.gov.in/2014/regulation/reg21.pdf.
CERC. 2014b. “Statement of Reasons Order.” Accessed January 21, 2016. http://www.cercind.gov.in/2014/regulation/sor16.pdf.
CERC. 2010. “The Central Electricity Regulatory Commission.” No.L-1/44/2010-CERC. http://www.cercind.gov.in/Regulations/Transmission_Regulations_on_transmission_charges_and_losses_2010.pdf.
Chang, Judy W., J. Michael Hagerty, Johannes P. Pfeifenberger, and Ann Murray. 2014. “Nebraska Renewable Energy Exports: Challenges and Opportunities." Cambridge, MA: The Brattle Group. http://www.brattle.com/system/publications/pdfs/000/005/092/original/Nebraska_Renewable_Energy_Exports_-_Challenges_and_Opportunities.pdf?1418752296.

37
Chatterjee, Sushanta Kumar. “Policy Instruments for Promotion of Renewable Energy Generation: Development of a Suggestive Framework for Indian REC System.” PhD diss., University of Petroleum and Energy Studies, Dehradun, 2013.
Clean Line Energy Partners. 2015. “Illinois Commerce Commission Approves the Grain Belt Express Clean Line Transmission Project.” Houston, TX: Clean Line Energy Partners. http://www.cleanlineenergy.com/sites/cleanline/media/news/Release_GBX_ICC_Decision_2015_11_12_Final.pdf.
Emerging Energy Research. 2010. Cited in Ramping up Renewables: Leveraging State Renewable Portfolio Standards, U.S. Partnership for Renewable Energy Finance. Accessed February 16, 2016. https://www.db.com/cr/en/docs/Ramping_up_Renewables-Leveraging_State_RPS_Programs_amid_Uncertain_Federal_Support.pdf.
Energy Regulatory Commission (Comisión Reguladora de Energía-CRE). 2015. Elaborated by CRE with information from the Federal Electricity Commission (CFE).
CRE. 2014. Metodología para la Determinación de los Cargos correspondientes a los Servicios de Transmisión que preste el Suministrador a los Permisionarios con Centrales de Energía Eléctrica con Fuente de Energía Renovable o Cogeneración Eficiente. http://www.cre.gob.mx/articulo.aspx?id=494.
Engelmeier, T. (2016). “Renewable energy policies in India are getting smarter”. at: http://www.bridgetoindia.com/blog/renewable-energy-policies-in-india-are-getting-smarter/
Gulia, Jyoti. 2015. “The Open Access Solar Market in India: Evolution and Challenges.” Bridge To India, October 8. http://www.bridgetoindia.com/blog/the-open-access-solar-market-in-india-evolution-and-challenges/.
Heeter, J.; Bird, L.; and Gelman, R. Status of Net Metering: Assessing the Potential to Reach Program Caps. NREL TP-6A20-61858. September. http://www.nrel.gov/docs/fy14osti/61858.pdf
Holt, Edward. 2014. “Potential RPS Markets for Renewable Energy Generators.” Montpelier, VT: Clean Energy States Alliance. http://www.cesa.org/assets/2014-Files/Potential-RPS-Markets-Report-Holt-January-2014.pdf.
Indian Renewable Energy Development Agency (IREDA). 2013. Accessed August 27, 2013. http://www.ireda.gov.in/.
ISO/RTO Council. 2014. www.isorto.org
Live Mint. 2015. “India’s Struggle for Power Reforms.” Live Mint, October 13. http://www.livemint.com/Opinion/3a65BJmEtSn1xbjjaqQTrO/Indias-struggle-for-power-reforms.html.
MERC. 2015. “Maharashtra Electricity Regulatory Commission (Distribution Open Access) Regulations, 2015.” Mumbai, India: MERC.

38
http://www.mercindia.org.in/pdf/Order%2058%2042/DOA%20Regulations%202015%20-16092015.pdf.
Mercados. 2012. “Integrating Variable Renewable Energy with the Grid: Lessons from the Southern Region.” http://www.indiaenvironmentportal.org.in/files/file/variable%20renewable%20energy%20grid%20integration.pdf.
Miller, J., L. Bird, J. Heeter, and B. Gorham, 2015. Renewable Electricity Use by the U.S. Information and Communication Technology (ICT) Industry. 31 pp. NREL Report No. TR-6A20-64011. July. http://www.nrel.gov/docs/fy15osti/64011.pdf.
Ministry of Energy (Secretaría de energía-SENER) (2015). Programa de Desarrollo del Sistema Eléctrico Nacional (Program for the expansion of the National Electrical System-PRODESEN) Elaborated by the Ministry of Energy.
Ministry of Law and Justice. 2003. “The Electricity Act.” The Gazette of India. New Delhi, India: Ministry of Law and Justice, Legislative Department.
Ministry of New and Renewable Energy (MNRE). 2016. Amendment in Tariff Policy, Dated 28th January, 2016. Ministry of Power. http://powermin.nic.in/upload/pdf/Tariff_Policy-Resolution_Dated_28012016.pdf
MNRE. 2015. “Scaling Up of Grid Connected Solar power Projects.” Government of India Gazette Notification No. 30/80/2014-15/NSM. New Delhi, India: Ministry of New and Renewable Energy.
Ministry of Power. 2015a. “Amendments Proposed in the Tariff Policy.” New Delhi, India: Ministry of Power, Government of India. http://powermin.nic.in/upload/Amendments_proposed_in_the_Tariff_Policy.pdf.
Ministry of Power. 2015b. Amendment in Electricity Act, 2003, Ministry Of Power. http://powermin.nic.in/upload/pdf/Draft_amendments_in_Electricity_Act_2003.pdf.
Ministry of Power. 2011. “Amendments in the Tariff Policy.” New Delhi, India: Ministry of Power, Government of India owermin.nic.in/upload/pdf/Amendment_to_the_Tariff_Policy_notified_under_section3_of_the_Electricity_Act2003_Resolution.pdf.
National Electricity Policy (NEP). 2005. New Delhi, India: Ministry of Power, Government of India.
National Power Training Institute (NTPI). 2013. “Financial Implications of Grant of Open Access to Industrial Consumers and Cost/Benefit Analysis for MSEDCL Discom Under Different Scenario of Grant of Open Access.” Summer internship report with Mercados.
O'Shaughnessy, E., J. Heeter, C. Liu, and E. Nobler, 2015. Status and Trends in the U.S. Voluntary Green Power Market (2014 Data). NREL Report No. TP-6A20-65252. October.

39
Shared Renewable HQ. 2015. Accessed January 21, 2016. Sharedrenewables.org.
Shrimali, Gireesh, Sumala Tirumalachetty, and David Nelson. 2012. “Falling Short: An Evaluation of the Indian Renewable Certificate Market.” San Francisco: Climate Policy Initiative. http://climatepolicyinitiative.org/wp-content/uploads/2012/12/Falling-Short-An-Evaluation-of-the-Indian-Renewable-Certificate-Market.pdf.
Solar Energy Industries Association (SEIA). Shared Renewables/Community Solar. Accessed February 12, 2016. http://www.seia.org/policy/distributed-solar/shared-renewablescommunity-solar
U.S. Department of Energy (DOE). n.d. Recovery Act Interconnection Transmission Planning. http://energy.gov/oe/services/electricity-policy-coordination-and-implementation/transmission-planning/recovery-act.
Wiser, R., G. Barbose, J. Heeter, T. Mai, L. Bird, M. Bolinger, A. Carpenter, G. Heath, D. Keyser, J. Macknick, A. Mills, and D. Millstein. 2015. A Retrospective Analysis of the Benefits and Impacts of U.S. Renewable Portfolio Standards. Lawrence Berkeley National Laboratory and National Renewable Energy Laboratory. NREL-6A20-65005. http://www.nrel.gov/docs/fy16osti/65005.pdf.

40
Appendix. Indian State Details Because initiatives in Indian states are so varied, this Appendix summarizes relevant state provisions.
Karnataka ERC The Karnataka Electricity Regulatory Commission (KERC) specified that all solar power generators in the state (achieving commercial operation date (CoD) between April 1, 2013 and March 31, 2018) selling power to consumers within the state on open access or wheeling are exempted from payment of wheeling and banking charges and CSS for a period of 10 years from the date of commissioning.
The KERC further specified that the exemption is also applicable for captive solar power plants for self-consumption within the State. However, the captive solar power plants that opt for the availing REC mechanism are required to pay the normal wheeling, banking, and other charges.
In cases where the RE power developer is unable to completely utilize the banked energy, the developer is eligible to receive only the amount against banked energy at 85% of the generic tariff; this provision is applicable to existing projects and new projects commissioned on or before March 31, 2018.
The RE power (wind and small hydro) developers availing banking facility are required to pay 2% energy towards banking charges. The KERC determined that 5% of energy is required to be paid towards wheeling charges through the distribution/transmission network (in kind).
The solar power developers are not required to pay any wheeling charges for utilizing the transmission network. The KERC has also guided the developers through approved wheeling and banking agreement arrangements. The relevant portions of the order issued by KERC on August 18, 2014 states:
1. “All solar power generators in the State achieving commercial operation date (CoD) between 1st April 2013 and 31st March 2018 and selling power to consumers within the State on open access or wheeling shall be exempted from payment of wheeling and banking charges and cross subsidy surcharge for a period of ten years from the date of commissioning. This is also applicable for captive solar power plants for self-consumption within the State.
2. Captive solar power plants opting for Renewable Energy Certificates shall pay the normal wheeling, banking and other charges as specified in the Commission’s Order dated 9th October 2013.”
Rajasthan ERC In Rajasthan, the Electricity Regulatory Commission (RERC) has allowed RE to be banked at consumption end for only captive consumption within the state. There is evidently no banking facility for third-party open access. RERC published RE tariff regulations, dated February 24, 2014, wherein which Regulation 39 provides for banking of RE power, but this is only available for captive users or captive consumption. Regulation 39 (1) states:
“39. Banking
(1) Energy shall be allowed to be banked at consumption end for only captive consumption within the state.”

41
Payment of Excess generation over quantum of energy banked:
The settlement of energy banked and energy accounting for solar power has been provided under Clause (3) of Regulation 39 of the RERC RE tariff regulations, dated February 24, 2014. Clause 3 of Regulation 39 provides for how the settlement of solar power and energy accounting be made on monthly basis. Regulation 39 (3) says:
“39. Banking
…………………………………………………………………………………………………
(2) Period of Banking
The banking shall be on monthly basis.
(3) Energy Accounting
(a) RE Power Generator/Developer shall intimate to SLDC and to the concerned Distribution Licensee on first day of every month, out of available energy for that particular month, the quantum of energy it wishes to bank for captive consumption within the state:
Provided that where no such intimation is received on or before first day of the month, the intimation last received would become applicable for the month.
(b) The banked energy in a month shall not exceed the quantum of energy injected in the grid in the month. In case the energy injected in the month is lower than indicated banked energy, the banked energy would be deemed to get restricted up to the energy injected.
(c) The RE Power Generator/Developer would be entitled to get payment @ 60% of energy charges applicable to large Industrial power tariff, excluding fuel surcharge, if any, in respect of 10% of unutilized banked energy after the end of month of banking. Unutilized banked energy, in excess of 10% shall lapse.”
In view of the above-mentioned clause (c), the solar/wind power generator shall be entitled to receive payment at the rate of 60% of energy charges as applicable to large industrial power tariffs according to charges in the tariff order for that FY. However, such payment by the distribution licensee to the RE generator/ developer shall be made up to 10% of the unutilized banked energy after the end of the month during which such banking is made. In that case, if the total unutilized banked energy exceeds 10% then such excess of banked energy shall lapse and will no longer be paid to such RE generator/developer.
Intra-state Transmission Charges and Losses Regulations 67 and 68 of the RERC Terms and Conditions for Determination of Tariff Regulations, 2014 states:
67. Allocation of annual transmission charges
(1) The Long Term Users of the transmission system shall share the transmission cost in such proportion as their contracted transmission capacity to the total transmission capacity contracted/agreed from the intra-State transmission system:

42
Provided that the charges payable by the Long Term Users may also take into consideration factors such as voltage, distance, direction, quantum of flow and time of use, as may be stipulated by the Commission in its order passed under subsection (3) of Section 64 of the Act:
Provided further that the charges shall be calculated on a daily basis by the Transmission Licensee and shall be billed every month, except where directed otherwise by the Commission for any User or class of such users:
Provided further that charges payable by Open Access consumers (other than Long Term) shall be in accordance with RERC (Terms and Conditions for Open Access) Regulations, 2004 as amended thereto and in the manner as specified by the Commission through Orders to be issued from time to time.
(2) The Annual Transmission Charges (ATC) payable by a Long term User of the transmission system shall be computed in accordance with the following equation:
ATC = TC X [CL / SCL]
Where,
TC = Transmission Cost equivalent to the ARR of RVPN less income from short term open access transactions
CL = Contracted/agreed Transmission Capacity of the User
SCL = Sum of Contracted/agreed Transmission Capacity of all Users.
68. Treatment of losses
Transmission Losses allowed by the Commission will have to be borne by users of the transmission system and energy accounts, to be maintained by SLDC, shall reflect accordingly.”
Accordingly, the RERC determined transmission charges at INR 148.91/kW/month (as per the final tariff approved for FY 14-15 vide order dated October 9, 2014) and transmission losses at 4.2%.
Thus, the charges for long-term and medium-term open access transactions would be on an INR/MW/month basis. As the capacity utilization factor for solar power plants is in the range of 18-20%, the long-term transmission charges in terms of INR/MW, when converted to INR/MWh, become almost five times higher than conventional power. However, the RERC recently reduced the intra-state transmission charges by half of the charges applicable to normal open access consumers for solar energy projects of around 2,000 MW, provided that such projects are commissioned by March 31, 2018.
Telangana State ERC The government of Telangana issued a solar policy for making use of the positive environment in the solar market and the initiatives taken by the Government of India for substantially harnessing the solar potential in Telangana. Paragraph 5 of Clause 11 (e) of Telangana Solar Policy states:

43
“11. (e) Power Scheduling and Energy Banking
All SPPs shall be awarded must-run status that is injection from solar power projects shall be considered as deemed to be scheduled.
Banking of 100% of energy shall be permitted for all Captive and Open Access/ Scheduled consumers during all 12 months of the year. Banking charges shall be adjusted in kind @ 2% of the energy delivered at the point of drawl.
The banking year shall be from April to March. Banked units cannot be consumed/redeemed in the peak months (Feb to June) and in the peak hours (6 pm to 10 pm). The provisions on banking pertaining to [withdrawal] restrictions shall be reviewed based on the power supply position of the State.
For captive/ third party sale, energy injected into the grid from date of synchronization to open access approval date will be considered as deemed energy banked.
The unutilized banked energy shall be considered as deemed purchase by DISCOM(s) [distribution companies] at average pooled power purchase cost as determined by TSERC for the year.
For Sale to DISCOMS, Energy injected into the grid from date of synchronization to Commercial Operation Date (COD) will be purchased by the DISCOMS at the first year tariff of the project, as per the provisions of the PPA with DISCOMS.”
It appears from the above that the banking of 100% of all energy shall be permitted for any captive and open access/scheduled consumers at any time of the year with banking charges at 2% of the energy delivered at the point of withdrawal. Such banked units cannot be consumed or redeemed in the peak months (February to June) or in peak hours (6 p.m. to 10 p.m.). The unutilized banked energy shall be deemed purchased by distribution companies at average pooled power purchase cost as determined by TSERC for the year.
Delhi ERC The Delhi Electricity Regulatory Commission (DERC) passed an order dated December 24, 2013 in determining transmission and wheeling charges, CSSs, additional surcharges, and other applicable charges under open access to which various stakeholders had submitted their comments. Under Clause (xii) of the order, DERC clarified that open access consumers consuming solar power shall not be covered under the UI mechanism. DERC also clarified that no wheeling, transmission, or additional surcharge shall be applicable to open access consumers using energy from all renewable sources of energy as defined by the MNRE in Delhi. Clause (xii) of the order passed by this Honorable Commission says:
“(xii) Renewable Energy Sources
…………………………………………………………………………………………………
Commission’s View:-

44
The Commission is of the view that no UI, wheeling or transmission charges or additional surcharge should be applicable on open access consumers availing energy from all renewable energy sources as defined by MNRE in Delhi. However, open access consumers shall comply with DERC Regulations on RPO and roof top solar.”
The DERC has not provided any clarity on the issue as to whether open access consumers currently using solar power shall be required to pay a CSS. Clause 13.7 of the Draft Solar Policy 2015 issued by the Government of NCT of Delhi on September 10, 2015 states that open access consumers using solar power shall be exempted from paying CSS during the next five years. Clause 13.7 of the Draft Policy states:
“13.7 Cross Subsidy Surcharge
DERC shall exempt payment of cross-subsidy charge and surcharge for solar plants commissioned during the Operative Period of the Policy.”
Settlement of solar power under inter-state open access:
According to Clause 9 (4) of the DERC Net Metering Regulation, 2014 the surplus units (i.e., the difference of the export units and import units injected by the consumer) shall be carried forward to the next billing cycle as energy credit and will be adjusted against the energy consumed in subsequent billing periods within the settlement period. Clause 9 (4) of the Net Metering Regulation 2014 states:
“9. Billing and Energy Accounting
…………………………………………………………………………………………………
(4) If during any billing period, the export of units exceeds the import of units consumed, such surplus units injected by the consumer shall be carried forward to the next billing period as energy credit and shown as energy exported by the consumer for adjustment against the energy consumed in subsequent billing periods within the settlement period. ”
However, nothing is said regarding settlement of solar power and energy accounting for intra-state and inter-state transaction bases.
Banking of Solar Power Under open Access Nothing in the DERC Open Access Regulation addresses banking of solar power or how such banked solar power shall be settled. In accordance with Clause 13.5 of the DERC Draft Solar Policy 2015, banking charges are exempted for solar power plants commissioned within the next five years. Clause 13.5 of this policy states:
“13.5 Exemption on Wheeling and Banking Charges
There shall be no wheeling and banking charges for solar plants commissioned during the Operative period.”

45
Madhya Pradesh ERC The Madhya Pradesh Electricity Regulatory Commission (MPERC) has allowed 100% banking of RE power provided that the banked power will be returned on a per-decision basis taken (on behalf of the MPSEB/distribution company) keeping in view of the harvest season (Nov. to Feb.) and power availability at Peak demand and demand and supply position in the State. In such circumstances, the MPSEB will purchase balance power as per provisions under its own periodically issued orders. The MPERC further specified that the RE power developer is required to pay 2% of the banked energy towards banking charges to the concerned state distribution company/state power trading company.
Intra-state Transmission Charges In the order dated April 2, 2013 in the matter of “Determination of Transmission Tariff for the control period FY 2013-14 to FY 2015-16 based on the tariff application filed by Madhya Pradesh Power Transmission Company Limited (MPPTCL), Jabalpur under Section 62 and 86(1)(a) of the Electricity Act, 2003,” the transmission charges have been calculated as follows:
a. Calculation of Transmission charges for long term beneficiary Total Transmission Charges INR/MW/Day = Total Annual Fixed Cost Total Transmission System Capacity (MW) X 365 b. Calculation of Transmission charges for short term beneficiary
Total Transmission Charges INR/MWh =
Total Annual Fixed Cost X 0.25 Total Units Expected to be transmitted in the year (MU)
c. Calculation of Transmission charges for Non-conventional Energy source based Generating Units connected on 132 kV or above Voltage The Commission determined the Transmission Charges for Non-Conventional Energy Sources on Energy Based Pooled Method (Total Energy Transmitted by Conventional + Non Conventional Energy Source at 20% PLF) and is as follows: Total Transmission Charges INR/Unit = Total Annual Fixed Cost = INR 0.27 for FY 2014-15 Total Units Expected to be transmitted in the year (MU)
Maharashtra ERC The Maharashtra Electricity Regulatory Commission (MERC) allowed wind-generating units to use banking for self-use and third-party wheeling within a period of one year. The commission also allowed for the wind generation units to carry forward unutilized banked energy to get adjusted in subsequent energy bills if they could not be adjusted in the same month (until the end of that FY), but the surplus units, if any, at the end of financial year will not be purchased by MSEDCL.

46
The MERC issued draft MERC Distribution (Open Access) Regulations on September 16, 2015 and invited comments and suggestions October 8, 2015. The draft regulation proposed to reduce the eligibility limit for open access from 1 MW to 0.5MW; it also proposed clear banking provisions for 12 months. Further, it suggested that the credit for banked energy shall not be permitted during the months of October, November, and March, and the credit for energy banked in other months shall be as per the energy injected in respective time of day (ToD) slots determined by the commission in the relevant orders determining the tariffs for distribution licensees. It is likely to result in further development of RE projects under open access transactions.
Intra-state Transmission Charges In the State of Maharashtra, charges are being decided by INR/kWh (energy injected in the grid), assuming 100% utilization instead of INR/MW/day. The approach adopted by the MERC in its Multi Year Tariff Regulations, 2011 follows:
“64.3 Base Transmission Tariff
64.3.1 Base Transmission Tariff for each financial year shall be determined as ratio of approved “TTSC” for intra-State transmission system and approved „Base Transmission Capacity Rights‟ and shall be denominated in terms of “INR/kW/month” (for long term/medium term usage) or in terms of “INR/kWh” (for short term bilateral open access transactions usage, short term collective transactions over power exchange and for Renewable energy transactions)
As per the above MYT regulation the MERC had determined the transmission tariff for Intra-State Transmission System (InSTS) for FY 2013-14 to FY 2015-16 of the second MYT Control Period as under:
Item Description Units FY 2013-14 FY 2014-15 FY 2015-16 TTSC (excluding past period
recovery of FY 2013-14) INR Cr 5352.31 6217.24 7220.28
Average of CPD and NCPD MW 17748 19533 21102 Transmission Tariff
(long term/medium term) INR/kW/month 251.31 265.25 285.13
Transmission Tariff (short term/collective/renewable
energy) INR/kWh 0.34 0.36 0.38
CSSs The MERC, in order to promote third-party sale of RE, specified that open access customers will pay 25% of the applicable CSSs when purchasing power from renewable energy.
Gujarat ERC The Gujarat Electricity Regulatory Commission (GERC) has allowed for plants under captive generating mode and not operating under the REC route or third-party sales shall be eligible for energy banking for a one-month period only.
In cases of third-party sales, wind and solar energy generated shall be adjusted against the consumption in the same block of 15 minutes.
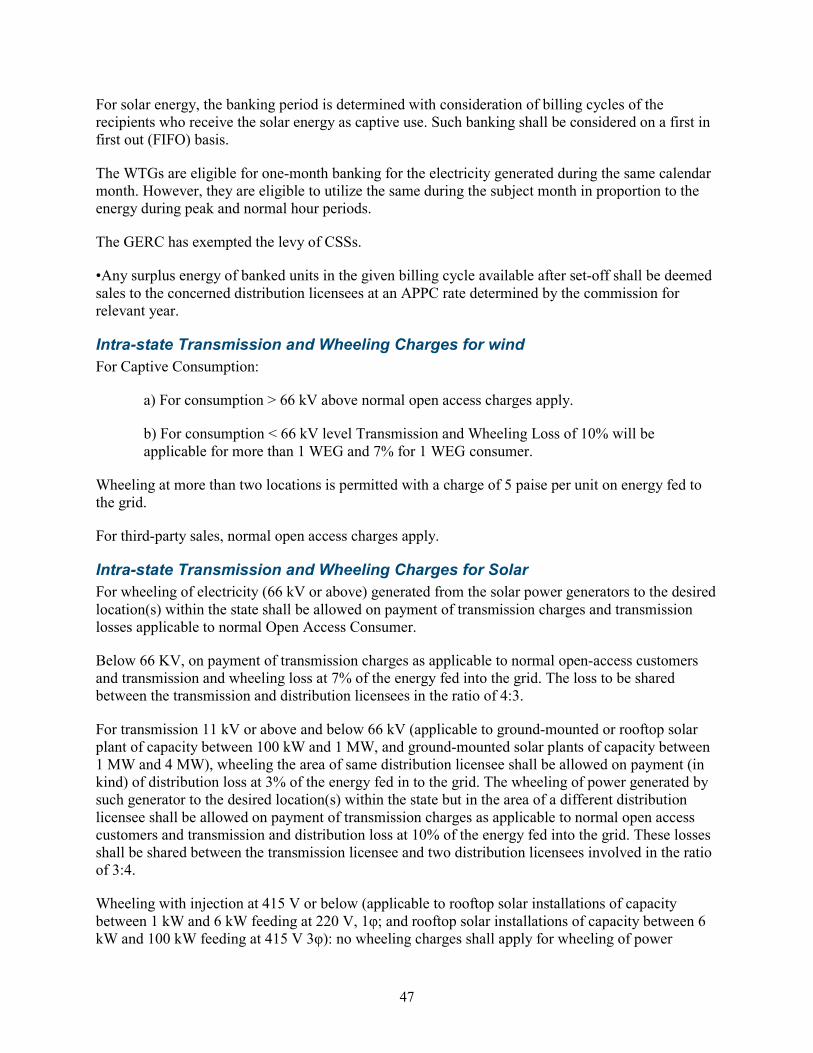
47
For solar energy, the banking period is determined with consideration of billing cycles of the recipients who receive the solar energy as captive use. Such banking shall be considered on a first in first out (FIFO) basis.
The WTGs are eligible for one-month banking for the electricity generated during the same calendar month. However, they are eligible to utilize the same during the subject month in proportion to the energy during peak and normal hour periods.
The GERC has exempted the levy of CSSs.
•Any surplus energy of banked units in the given billing cycle available after set-off shall be deemed sales to the concerned distribution licensees at an APPC rate determined by the commission for relevant year.
Intra-state Transmission and Wheeling Charges for wind For Captive Consumption:
a) For consumption > 66 kV above normal open access charges apply.
b) For consumption < 66 kV level Transmission and Wheeling Loss of 10% will be applicable for more than 1 WEG and 7% for 1 WEG consumer.
Wheeling at more than two locations is permitted with a charge of 5 paise per unit on energy fed to the grid.
For third-party sales, normal open access charges apply.
Intra-state Transmission and Wheeling Charges for Solar For wheeling of electricity (66 kV or above) generated from the solar power generators to the desired location(s) within the state shall be allowed on payment of transmission charges and transmission losses applicable to normal Open Access Consumer.
Below 66 KV, on payment of transmission charges as applicable to normal open-access customers and transmission and wheeling loss at 7% of the energy fed into the grid. The loss to be shared between the transmission and distribution licensees in the ratio of 4:3.
For transmission 11 kV or above and below 66 kV (applicable to ground-mounted or rooftop solar plant of capacity between 100 kW and 1 MW, and ground-mounted solar plants of capacity between 1 MW and 4 MW), wheeling the area of same distribution licensee shall be allowed on payment (in kind) of distribution loss at 3% of the energy fed in to the grid. The wheeling of power generated by such generator to the desired location(s) within the state but in the area of a different distribution licensee shall be allowed on payment of transmission charges as applicable to normal open access customers and transmission and distribution loss at 10% of the energy fed into the grid. These losses shall be shared between the transmission licensee and two distribution licensees involved in the ratio of 3:4.
Wheeling with injection at 415 V or below (applicable to rooftop solar installations of capacity between 1 kW and 6 kW feeding at 220 V, 1φ; and rooftop solar installations of capacity between 6 kW and 100 kW feeding at 415 V 3φ): no wheeling charges shall apply for wheeling of power

48
generated by such projects to the desired location(s) if the solar project and consumption location are located within the area of same distribution licensee, as such projects decrease the transmission and distribution losses for the utility and increase the efficiency of the grid.
Wheeling at two or more locations: if a solar power generator owner desires to wheel electricity to more than two locations, he shall pay INR 0.05 per unit on energy fed to the grid to the area’s distribution company in addition to the above-mentioned transmission charges and losses, as applicable.
Kerala SERC The Kerala State Electricity Regulatory Commission (KSERC) has specified that the distribution licensee may provide adequate facilities for banking of surplus power for the captive RE-generating plants with seasonal generation or non-firm generation, such as small hydro projects or wind.
However, the KSERC has not allowed such banking if such plants sell energy to other persons.
The KSERC specified that 5% of the energy banked is required to be paid as banking charges and the banking period is restricted to a period of 8 months starting June 1 of every year.
The RE generators may withdraw the banked energy on a slot-to-slot basis within a monthly billing cycle. However, such withdrawal is required to match (i) peak hour generation with peak hour consumption, (ii) off peak hour generation with off peak hour consumption, and (iii) normal hour generation with normal hour consumption.
The KSERC further notified that the quantum of bankable energy is restricted to the level up to the target capacity of solar RPO. The RE generation (solar) is further exempted form payment of open access charges for wheeling of solar power within the state and T&D losses.
Jharkhand SERC The Jharkhand State Electricity Regulatory Commission (JSERC) has allowed banking of 100% RE power, subject to the condition that the banked power cannot be withdrawn by more than a fixed quantity at one time. The JSERC further directed the utilities to facilitate banking of RE power though proper arrangements so that power banked during off-peak periods is not drawn during peak seasons.
The RE-based power generation projects in Jharkhand are also exempted from open access charges. Additionally, the Jharkhand State Solar Power Policy 2015 offers exemption from wheeling charges and distribution losses to the RE power generation.
Regarding wind energy generation, a discount of 50% is allowed on wheeling charges.
Haryana ERC The Haryana Electricity Regulatory Commission (HERC) has allowed the banking facility for a period of one year by the licensee/utilities free of cost.
However, it has been specified that withdrawal of banked power can be carried out during non-peak hours only.

49
The HERC further notified that, if the banked energy is not utilized within a period of 12 months from the date of power banked with the concerned power utilities/licensee, such banked energy will automatically lapse and no charges shall be paid in lieu of such power.