Wheatbelt Radars Project: Estimating the economic benefits ......The present study, commissioned by...
46
Wheatbelt Radars Project: Estimating the economic benefits from weather radar investments in the Western Australian wheatbelt Report to the WA Bureau of Meteorology Marit Kragt Thayse Nery Release: Version 4 Date: 25 March 2019
Transcript of Wheatbelt Radars Project: Estimating the economic benefits ......The present study, commissioned by...

Wheatbelt Radars Project:
Estimating the economic benefits from
weather radar investments in the
Western Australian wheatbelt
Report to the WA Bureau of Meteorology
Marit Kragt
Thayse Nery
Release: Version 4
Date: 25 March 2019

This work was commissioned by the Bureau of Meteorology (BoM) of the Australian Government and
the State Government of Western Australia, as part of a larger project to estimate the benefits of Doppler
radar investments in the Western Australian Wheatbelt (research agreement December 2016).
This work was conducted at the University of Western Australia (UWA), UWA School of Agriculture and
Environment, Agricultural and Resource Economics Group, under the supervision of Dr Marit Kragt
(UWA Human Ethics protocol RA/4/1/9051).
For more information, please contact:
UWA researcher Dr Thayse Nery [email protected]
UWA project supervisor Dr Marit Kragt [email protected]
BoM regional director WA: Mike Bergin [email protected]
The author thank all the farmers who contributed their time to this study, and Dr Myrtille Lacoste for her
thoughtful comments and suggestions.
This report can be cited as:
Kragt, M. & Nery, T., 2019. Estimating the economic benefits from weather radar investments in the
Western Australian wheatbelt. Report to the Bureau of Meteorology, UWA School of Agriculture and
Environment, The University of Western Australia: Perth.
Copyright © The University of Western Australia 2019
This report is published under a Creative Commons Attribution 4.0 International Licence
_________________________________________________________________________________
Agricultural and Resource Economics
UWA School of Agriculture and Environment

Table of Contents
Executive Summary iv
1. Background & Purpose 1
2. Material & Methods 4
2.1. Overview and rationale 4
2.2. Qualitative Assessment 4
2.3. Quantitative assessment 5 2.3.1. Potential benefits to farmers 5 2.3.2. Cost-benefit analysis 6
3. Results 9
3.1. The use of weather and forecast information by farmers 9
3.2. Impact of weather and forecast services on main farmers’ activities 10 3.2.1. Impact of Doppler radars on farmers’ main activities 11
3.3. Range of potential benefits generated by Doppler radars 12 3.3.1. Scope for potential economic benefits 16 3.3.2. Economic analysis of enhanced weather and forecast information 17 3.3.3. Sensitivity analysis on the agricultural model 18
3.4. Cost-benefit analysis 23 3.4.1. Sensitivity analysis on different benefits assumptions 26
4. Discussion 28
5. Conclusions 30
References 32
Appendix 1. Parameters used in the agricultural economics model of financial benefits from Doppler radar in wheatbelt region. 34
Appendix 2. Sensitivity analysis results of economic impact of enhanced weather and forecast information on fertiliser top-up costs in the WA wheatbelt 35
Appendix 3. Sensitivity analysis results of economic impact of enhanced weather and forecast information on chemical wasted/misapplied in the WA wheatbelt 36
Appendix 4. Sensitivity analysis results of economic impact of enhanced weather and forecast information on sheep losses in the WA wheatbelt 37
Appendix 5. Sensitivity analysis results of economic impact of enhanced weather and forecast information on wheat yield losses in the WA wheatbelt 38
Appendix 6. Sensitivity analysis results of economic impact of enhanced weather and forecast information on wheat yield losses in the WA wheatbelt 39
Appendix 7. Sensitivity analysis results of economic impact of enhanced weather and forecast information on costs of re-spraying in the WA wheatbelt 40

Economic benefits of Doppler radars iv
Wheatbelt Radars Project: Estimating the economic benefits from
weather radar investments in the Western Australian wheatbelt
Executive Summary
As part of a major technology upgrade to the Bureau of Meteorology's radar network, the
Western Australian State Government committed a $23 million investment in three Doppler
radars across the Western Australia wheatbelt. Although it is assumed that this new
technology will enable farm business to make more accurate and timely on-farm decisions,
there is limited information about the actual potential agricultural gains from the investments.
The present study, commissioned by the Bureau of Meteorology (BoM), is the first to address
this gap.
This report aims to summarise the main findings of the ‘Wheatbelt Radars Project’. We first
provide a general overview of how farmers use weather information (reported in detail in
Lacoste and Kragt, 2018). We then discuss the range of potential benefits generated by timely
and accurate weather information, and the economic value of such benefits for farm
businesses in the wheatbelt. Unlike previous studies, we focus on farmers’ actual behaviour
as evidenced from information collected first-hand through extensive interviews with farmers
in the wheatbelt.
Investment in Doppler radars have the potential to provide significant economic benefits for
the wheatbelt agricultural region. These expected economic returns greatly depend on the
forecast improvements that new weather radars will generate over time, which cannot be
anticipated with certainty. In this study, we assumed that improved weather and forecast
information would generate a 5% marginal benefits (through higher production or lower
losses). Based on (i) this conservative 5% estimate, (ii) the new radars’ coverage (≈80% of the
wheatbelt), and (iii) current farming practices, the economic return in the region were
estimated at $3.36 million/year. These benefits accrue mostly because of reductions in
downgraded wheat or less wheat losses, lower re-spraying or chemical application costs, and
less sheep losses. Reduction of downgraded wheat is the benefit contributing to the highest
economic return.

Economic benefits of Doppler radars v
The sensitivity analysis revealed that the estimated economic benefit is highly sensitive to
changes in the quality of forecasting service. The higher the marginal benefits, the greater
the expected economic return for the wheatbelt region. For instance, the potential
agricultural gain could range from $1.35 million/year to $10.1 million/year, for a 2% and
15% marginal benefits respectively.
A cost-benefit analysis was conducted to assess whether the benefits to the agricultural sector
outweigh the investment in new weather radars in the wheatbelt. This showed that a 5%
marginal improvement in weather forecasting accuracy could increase the region’s
profitability by $9.98 million (7% discount rate) in net present value (NPV) terms over the 17
years of analysis. This represents a benefit-cost ratio (BCR) of $1.54 for each dollar invested.
Even using a higher rate of discount (10%), the investment is identified to be economically
viable ($5.7 million NPV and BCR of 1.33) over the 17 years of analysis. In fact, at a standard
7% discount rate, the project breaks even within 7 years of radars operation.
In addition to the economic gains, farmers highly appreciated the range of non-economic
benefits enabled by the new weather radar infrastructure. For instance, daily revision of
general planning is unlikely to impact greatly farmers’ economic profit, however, it
contributes to their well-being (e.g. lowering stress through easier organisation and logistical
adjustments). Such additional benefits have not been assessed in the current study. If the non-
priced effects (e.g. social and environmental) were quantified, much higher net benefits from
enhanced weather and forecasting information would apply to farmers and other rural
stakeholders in the region.

Economic benefits of Doppler radars 1
Wheatbelt Radars Project: Estimating the economic benefits from
weather radar investments in the Western Australian wheatbelt
1. Background & Purpose
The south-western “wheatbelt” of Western Australia (200,000 km2) is the state’s most
important grain growing area. Grain production is a major industry, covering 8% of Western
Australia’s total area, and valued at almost $5 billion in 2015-16 (accounting for over half of
the state agricultural production value, ABS, 2017). Until recently, most of the wheatbelt
lacked coverage by the Bureau of Meteorology (BoM) weather radar network, which five
radars were located on its periphery (along the coastlines: Esperance, Albany, Perth,
Geraldton; and inland: Kalgoorlie) with limited reach into the grain growing areas.
To remedy this situation, in 2014 the Western Australian State Government provided $23
million funding for the construction and operation of 3 new weather radars in Newdegate,
South Doodlakine, and Watheroo (Figure 1). Modern Doppler capability was included, and the
radars were complemented by a comprehensive network of automated weather stations.
Together, Doppler radars and stations can provide farm businesses with valuable, localised
information about rainfall, wind strength, temperature, and soil moisture. The investment was
justified by the need to facilitate and ensure continued productivity growth of rural
businesses, and improve the well-being of local residents notably through safety
enhancements (AEC, 2014; DAFWA, 2014).
Weather radars with Doppler capability (henceforth referred to as Doppler radars) have been
progressively available in Australia under the Radar Network and Doppler Services Upgrade
Project (RNDSUP) since 2005. Priority has been given to major population centres in the
eastern states (Dickins and Wedd, 2007). In 2014, Doppler radars became available in Western
Australia in Perth (Serpentine), followed by Kalgoorlie. In September 2018, Australia’s weather
radar network, operated by BoM, consisted of 62 weather radars divided into 24 Doppler and
38 conventional radars (BOM, 2018). The Western Australian Departments of Primary
Industries and Regional Development, and Biodiversity, Conservation and Attractions have a
further network of 182 automatic weather stations and radars throughout the state
(https://weather.agric.wa.gov.au/).

Economic benefits of Doppler radars 2
It is commonly assumed that improved weather information yields considerable benefits to
the agricultural sector (e.g., Fox et al., 1999; Roudier et al., 2016; Wilks and Wolfe, 1998),
including for Western Australia (e.g., Asseng et al., 2016, 2012). Therefore, the benefits
expected from the radar investments could be considerable (AEC, 2014; ESS, 2014; GHD,
2013). Accurate and timely weather information can lead to better farmers’ decisions,
resulting in potential savings in fertiliser and pesticides, increased cereal yields, and livestock
protection.
To date, however, it remains unclear what actual economic benefits are generated by
improved weather information to the wheatbelt’s agricultural sector. Most studies on
farmers’ use of weather forecasts address potential needs rather than documenting actual
practices. This project addresses these knowledge gaps by conducting an evidence-based
benefit analysis to estimate the return on investment yielded from the Wheatbelt Radars
Project.
Figure 1. Location of the new weather radars, radar coverage, and study locations near Cunderdin, Pingelly, and Newdegate, in the wheatbelt of Western Australia.

Economic benefits of Doppler radars 3
The project is divided into four specific objectives:
1. To understand the use of weather and forecast information by farmers in the
wheatbelt before and after the new weather radars were operational.
2. To investigate the changes to critical decision making by farmers once the three radars
were operational.
3. To assess and estimate the financial value of potential benefits to farmers, generated
by improved weather prediction and forecasting services.
4. To conduct a cost-benefit analysis of the radar investments against potential
agricultural benefits.
While there has been much interest worldwide in assessing the value or benefit of weather
information, a major limitation of most studies has been in not engaging the stakeholders who
are affected by the information (Moeller et al., 2008; Shafiee-Jood et al., 2014). When studies
fail to engage the intended decision-maker, then a critical attribute is clearly missing
(Leviakangas, 2009). This could be the case in the wheatbelt, where a consultancy report
commissioned by DAFWA in 2014 did not consult with farmers and assumed (in the high case
scenario) that the whole wheatbelt area was used for cropping. In that report, the net present
value returns from radar investments were assumed to be $108 million over a 20 year analysis
(AEC, 2014).
In contrast, here we corroborate expected benefits from the literature with the intended end-
users (i.e. farmers) and document how the weather information is affecting farmer’s practices.
This is a necessary pre-requirement for a sound economic evaluation of the potential benefits
from the newly installed radars. Through the outcomes of this economic evaluation, this
project will provide direct input into future policies and strategies designed to increase
Australia’s investment in weather and forecast technologies.

Economic benefits of Doppler radars 4
2. Material & Methods
2.1. Overview and rationale
The benefit analysis for the Wheatbelt Radars Project consisted of two parts (Figure 2). First,
a qualitative assessment was conducted to gain a thorough understanding of how weather
information is currently used by farmers (Objective 1); and to assess which decisions are
impacted by improved weather prediction and forecasting services (Objective 2). Second, a
quantitative assessment was performed to estimate the financial value of potential benefits
associated with new weather services to farmers (Objective 3); and based on these outcomes
a cost-benefit analysis was conducted (Objective 4).
2.2. Qualitative Assessment
This first part of the project aimed to establish a baseline of farmers’ practices. Primary data
from 51 farmers was collected using in-depth interviews across 3 locations of the Western
Australian wheatbelt (South-West Pingelly, Newdegate, and Cunderdin—Figure 1). The
methodology for the qualitative assessment is explained in detail in Lacoste and Kragt (2018).
3. Cost-benefit analysis (Objective 4)
What are the installation and maintenance costs?
Do the new radar investments yield a positive net present value?
2. Assess and estimate the potential benefits to farmers (Objective 3)
What benefits are generated by the three new weather radars?
Where measurable, what is the financial value of these benefits?
1. The use of weather and forecast information (Objectives 1 & 2)
How is weather information currently used by farmers? (Baseline)
Which decision are impacted by weather and forecasting services?
Qualitative assessment
Quantitative assessment
Figure 2. Key steps in the benefit analysis for the Western Australia Radars Project.

Economic benefits of Doppler radars 5
2.3. Quantitative assessment
2.3.1. Potential benefits to farmers
The information collected during the farmers’ interviews was used to understand which farm
practices are likely to be impacted by improved weather monitoring and forecast (Lacoste and
Kragt, 2018). The potential benefits to farmers were extracted from the sample areas where
there had been no prior radar coverage (Cunderdin and Newdegate, n=27). We asked farmers
which practices had been affected by the information provided by the new radars and how.
From this, we extracted what benefits can be generated by improved weather and forecast
information in the wheatbelt, how much farm practices might change as a result of improved
information, and how many farmers could be impacted by these changes.
Agricultural model
After identifying the types of potential economic benefits, their scope, and the relevant
proportion of population impacted across the major categories of expected benefits, we
developed an agricultural model to estimate the economic added-value associated with
increased accurate and timely weather information. For this economic evaluation we
combined the results extracted from the detailed farmers’ interviews with a literature review.
The estimation of potential economic benefits depends on the relative (marginal)
improvements in weather observations and forecasts. Based on a literature review (Abhilash
et al., 2007; AEC, 2014; Anaman and Lellyett, 1996; Bieringer and Ray, 1996; Nurmi et al.,
2013), we assumed a conservative value for the marginal benefits of 5% improvement. Our
analysis accounts for the actual coverage of the new Doppler radars across the wheatbelt (≈
80%). All prices and costs included in the model are based on observed values of agricultural
production in the WA wheatbelt region (Table 1). Details of all values applied in the
agricultural model is available in Appendix 1.
Table 1. Prices and costs used in the agricultural model
Price/cost Unit Values
Wheat* $/t 318
Spray herbicides $/ha 75
Fertiliser (nitrogen) $/ha 80
Sheep* $/head 110
*Wheat and sheep prices represented the average from 2012 to 2017 (ABARES, 2017). Unless specified, all other values are based on farmer interviews conducted in 2017. Sample values were averaged and rounded up to the nearest multiple of 5.

Economic benefits of Doppler radars 6
Sensitivity analysis
Since many of the model parameters are subject to uncertainty and to changes over time (i.e.
price of wheat, population impacted), we explored the sensitivity of the modelled results by
changing key values one parameter at a time. In this study, the potential gains are affected by
a number of variables, including:
- The proportion of population impacted by changes in different farming practice. For
example, not all farmers in the wheatbelt rear sheep.
- The marginal benefits to farmers from improved weather and forecast information. For
example, variation in higher yields or lower losses (Yates et al., 2016).
- Average wheat and sheep prices, and per hectare costs of herbicide spraying or nitrogen
fertiliser.
The range of parameters varied and values applied in the sensitivity analysis is reported in
Appendix 1. Average wheat yield and wheat yield losses will only be relevant to farmers
cropping wheat; the predominant broadacre crop in this region. Our analysis takes into
account the region’s total area of wheat (≈58% of the total broadacre crops area; ABS 2017).
2.3.2. Cost-benefit analysis
This final part of the project evaluates the costs and benefits of the investment for the three
new Doppler radars. This component comprises two research questions: (1) What are the
economic costs and benefits of this investment? (2) Would the benefits of the Doppler radars
outweigh costs once the three radars are operational?
Key assumptions in the cost-benefit analysis include:
- A discount rate of 7% was applied to obtain present values, with sensitivity testing at
4% and 10% following recommendations of Infrastructure Australia (2018).
- The analysis was undertaken for a 17 year period (2015-2031). This includes two years
for designing and building the three radars and the network of stations
(implementation phase) and 15 years maintenance (operational phase: 2017–2031).
This timeframe was chosen based on data from the BOM (2017) and because weather
radar life is usually 10–20 years (AEC, 2014).

Economic benefits of Doppler radars 7
The net present value (NPV) and the benefit cost ratio (BCR) are reported as measures of
economic efficiency. The discounted NPV is calculated as:
𝑁𝑃𝑉 = ∑𝐵𝑡 − 𝐶𝑡
(1 + 𝑖)𝑡
𝑇
𝑡=0
where T is the lifetime of the project (17 years), Bt are the benefits generated in year t, Ct are
the costs born in year t, and i is the discount rate (7%). Benefit-Cost Ratio is calculated as:
𝐵𝐶𝑅 = ∑
𝐵𝑡
(1 + 𝑖)𝑡𝑡=𝑇𝑡=0
∑𝐶𝑡
(1 + 𝑖)𝑡𝑡=𝑇𝑡=0
⁄
If the NPV >0 and BCR >1 then the project provides a potential Pareto improvement; if the
NPV = 0 and BCR = 1 then a neutral outcome is achieved (breakeven of the project);
conversely, if NPV < 0 and BCR < 1 then the project is not economically efficient and should
not be undertaken.
The potential economic benefits are based on the outcomes of agricultural model (Section
3.3.2). The actual costs of the Wheatbelt Radars Project were extracted from BOM (2017) and
summarised in Table 2.
Table 2. Costs for the installation and maintenance of the three new weather radars in the WA
wheatbelt
Doppler radars - costs Unit price Qty Total price Project commencement1 $433,289 1 $433,289
Radars construction2 $4,733,263 3 $14,199,789
Total implementation phase costs $14,633,078
Annual ongoing operation/maintenance costs $176,893/year
Newdegate (October 2016 onwards) 15 years + 3 months $2,697,616
Doodlakine (from February 2017 onwards) 14 years + 11 months $2,638,652
Watheroo (from May 2017 onwards) 15 years + 8 months $2,594,429
Total operational phase costs $7,930,697
Total cost over 17 years (non-discounted costs) $22,563,775 1 Includes various costs prior to the radar construction such as benefits analysis and feasibility studies, incurred
in 2015. 2 Incurred in 2015 for the Newdegate radar, and in 2016 for the Doodlakine and Watheroo radars.

Economic benefits of Doppler radars 8
The costs were divided into an implementation phase and an operational phase. The
implementation phase was between 2015 and 2017 and had strict design and building criteria.
The first of the three weather radars to be operational was the Newdegate radar in October
2016, followed in 2017 by South Doodlakine (February) and Watheroo (May). The costs of the
first year of operation were calculated as the proportion of annual operational costs from the
start of radar operation (i.e. number of months after the end of implementation phase). For
ease of analysis, maintenance and operational costs were taken as ongoing until the end of
2031 for all three radars. At the end of this cycle, the radars will likely need to be upgraded or
replaced.
Additionally to the base case scenario above, we conducted a sensitivity analysis of the CBA
under different benefits and costs assumptions (Table 3):
- A worst case scenario (what if benefits of the radar are very low).
- A best case scenario (what if benefits of the radar are very high).
- Low prices – low costs scenario (change in market conditions).
Table 3. Parameters changed in the sensitivity analysis
Scenario Base case Low
benefits High
benefits Low prices and costs
Wheat price ($/t) $318 $318 $318 $290 Sheep price ($/hd) $110 $110 $110 $100 Herbicide cost ($/ha) $75 $75 $75 $65 Fertiliser cost ($/ha) $80 $80 $80 $70 Marginal radar benefit (%) 5 2 10 2 Cropping area re-sprayed (%) 5 2 10 5 Lost yield (%) 2 1 4 2 Population affected by sheep losses (%) 80 60 90 80 Chemicals misapplied (%) 10 5 15 10 Range of fertiliser top-up (%) 15 10 20 15 Downgraded wheat (%) 15 5 20 15

Economic benefits of Doppler radars 9
3. Results
The overall aim of this project is to estimate the potential benefits of Doppler radar
investments in the Western Australia wheatbelt. This results section covers the key outcomes,
and is structured around the following themes:
1. The use of weather and forecast information by farmers, including farmers’ views in
relation to weather and forecast services.
2. Impact of weather and forecast information on main farmers’ activities.
3. Potential benefits generated by improved weather prediction and forecasting services
from new radars, including an estimation of potential financial values of such benefits.
4. A cost-benefit analysis of the radar investments against potential agricultural benefits.
3.1. The use of weather and forecast information by farmers
Representative data (51 respondents across 37 farms) was accessed first-hand from farming
businesses in the Western Australian wheatbelt to document the use of available weather and
forecast information by broadacre crop and livestock farmers. This study has been reported
in Lacoste and Kragt (2018), and the major conclusions included:
- Farmers rated highly the competence of the BoM, relied heavily on their outputs, and
acknowledged that forecasts skills have greatly improved along the years. Confidence
in forecast was very high for short-range forecasts (up to 4 days), with levels of trust
decreasing for predictions at longer time horizons.
- The vast majority of farmers accessed multiple weather and forecast products; half
provided by BoM, half by third-parties. Farmers’ choices were mainly based on ease-
of-use and perceived performance (accuracy and reliability) of different products,
requirements for specific features, and the need to build an ‘overall picture’ by
comparing several perspectives.
- Weather and forecast information was considered extremely useful by the majority of
farmers interviewed, and was also an essential component in the organisation and
functioning of current farming systems.

Economic benefits of Doppler radars 10
- Lack of awareness limited the use of some BoM flagship products. Some key products
such as radar rainfields and Doppler wind were clearly under-used. There is scope for
improving the delivery of information by raising awareness of the products and
features available from the BoM.
- There was no evidence that farmers’ overall access to weather and forecast
information depended on their age, technological level, farm size, mobile coverage or
location. Therefore, there is no need to accommodate products toward particular
segments of the agricultural population.
3.2. Impact of weather and forecast services on main farmers’ activities
Lacoste and Kragt (2018) reported farmers’ reliance on weather conditions and forecasts for
the main sets of practices conducted during the year. These practices included: general
planning (all year); seeding in autumn (March-May); spraying mostly after seeding during the
winter growing season (June-July); fertilising at seeding and during the growing season;
harvest at the start of summer (November-January); and livestock management, mainly sheep
and some cattle (all year).
Weather and forecast information can be divided into 4 broad forecast horizons:
- Near real-time weather conditions = monitoring the weather in real-time and the
related very short-term forecasts (hourly) The practices most impacted by near real-
time monitoring were general planning, spraying, and sheep management. Practices
that were the least affected were seeding and fertilising.
- Short-term forecasts (under a few days) impact general planning the most and, to a
lesser extent, sheep management. The impact on other practices was found to be
overall minor, although impacts on seeding and fertiliser application varied within the
farming populations sampled.
- Longer-term forecasts (a few weeks) impact general planning the most but were of
minor or negligible importance to other practices.
- Seasonal outlooks had, generally, no impact on any practices.
Economic benefits of Doppler radars 11
3.2.1. Impact of Doppler radars on farmers’ main activities
Respondents in Cunderdin and Newdegate were asked which decisions were influenced by
the new information provided by the recently installed radars. Although the radars capture
information that will contribute to improving all forecast horizons, the primary horizon for
which usefulness could be assessed by farmers was the near real-time imagery used to
monitor current weather conditions and, to a lesser extent, very short-term forecasts i.e.
hourly.
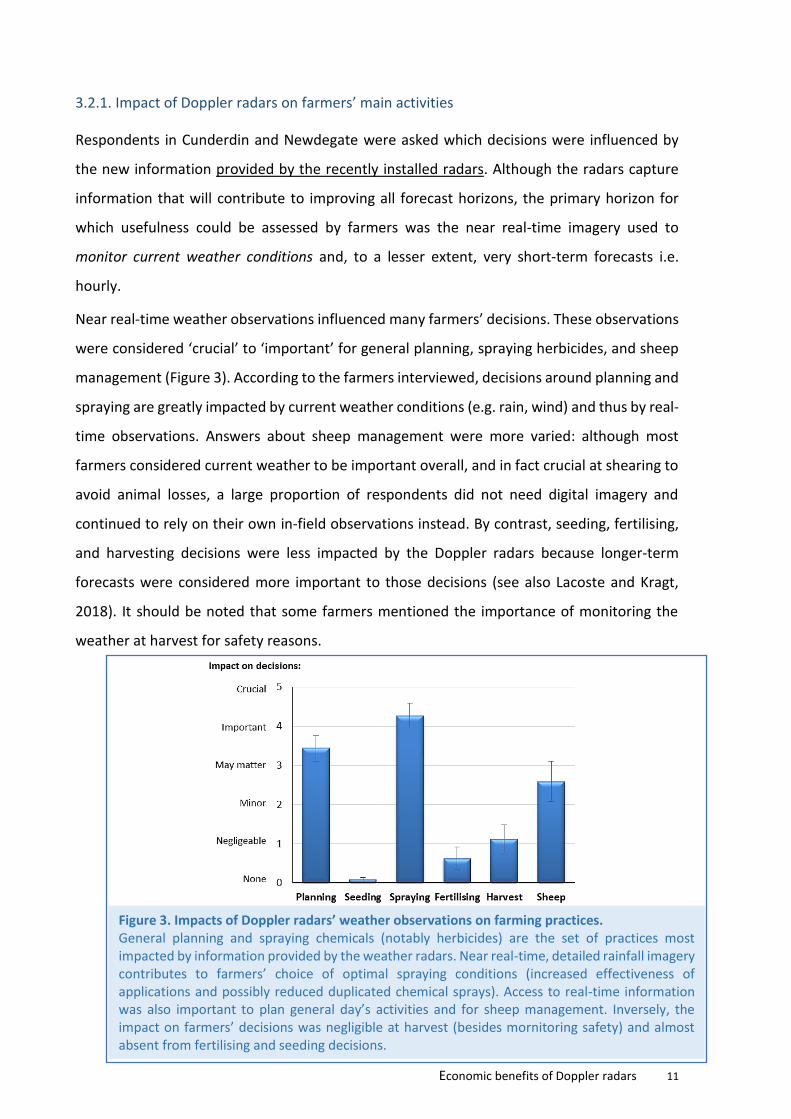
Near real-time weather observations influenced many farmers’ decisions. These observations
were considered ‘crucial’ to ‘important’ for general planning, spraying herbicides, and sheep
management (Figure 3). According to the farmers interviewed, decisions around planning and
spraying are greatly impacted by current weather conditions (e.g. rain, wind) and thus by real-
time observations. Answers about sheep management were more varied: although most
farmers considered current weather to be important overall, and in fact crucial at shearing to
avoid animal losses, a large proportion of respondents did not need digital imagery and
continued to rely on their own in-field observations instead. By contrast, seeding, fertilising,
and harvesting decisions were less impacted by the Doppler radars because longer-term
forecasts were considered more important to those decisions (see also Lacoste and Kragt,
2018). It should be noted that some farmers mentioned the importance of monitoring the
weather at harvest for safety reasons.
Figure 3. Impacts of Doppler radars’ weather observations on farming practices. General planning and spraying chemicals (notably herbicides) are the set of practices most impacted by information provided by the weather radars. Near real-time, detailed rainfall imagery contributes to farmers’ choice of optimal spraying conditions (increased effectiveness of applications and possibly reduced duplicated chemical sprays). Access to real-time information was also important to plan general day’s activities and for sheep management. Inversely, the impact on farmers’ decisions was negligible at harvest (besides mornitoring safety) and almost absent from fertilising and seeding decisions.
Economic benefits of Doppler radars 12
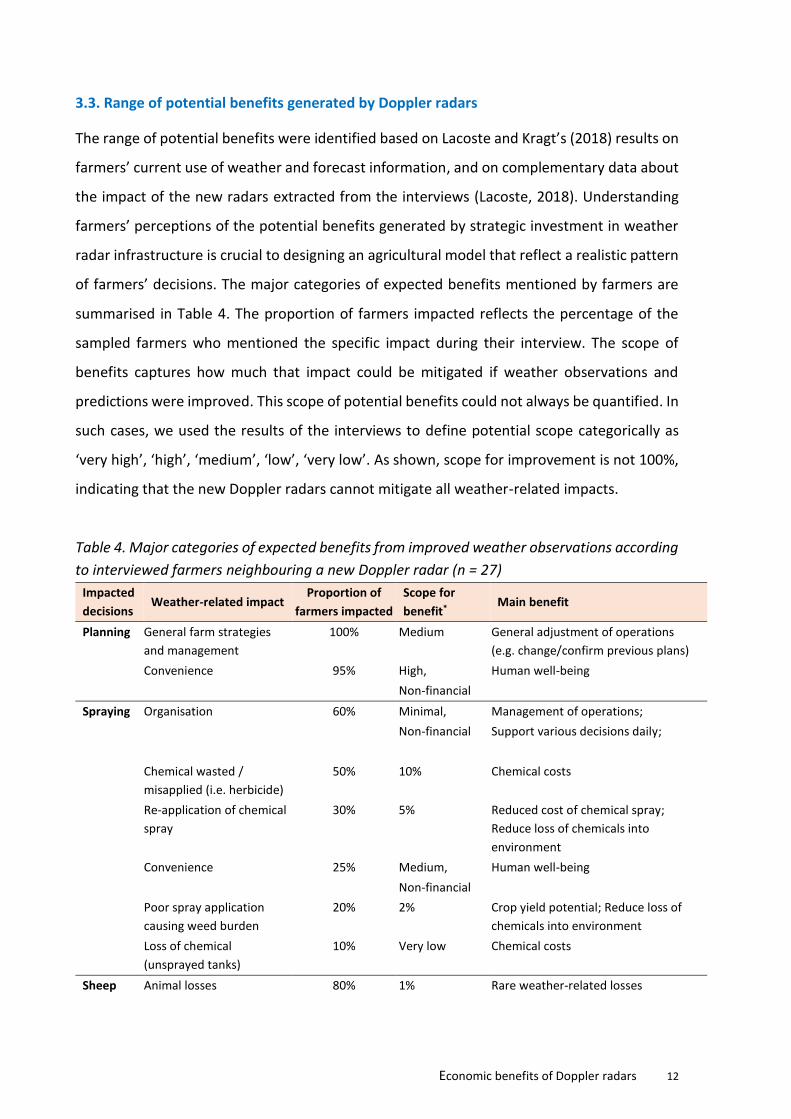
3.3. Range of potential benefits generated by Doppler radars
The range of potential benefits were identified based on Lacoste and Kragt’s (2018) results on
farmers’ current use of weather and forecast information, and on complementary data about
the impact of the new radars extracted from the interviews (Lacoste, 2018). Understanding
farmers’ perceptions of the potential benefits generated by strategic investment in weather
radar infrastructure is crucial to designing an agricultural model that reflect a realistic pattern
of farmers’ decisions. The major categories of expected benefits mentioned by farmers are
summarised in Table 4. The proportion of farmers impacted reflects the percentage of the
sampled farmers who mentioned the specific impact during their interview. The scope of
benefits captures how much that impact could be mitigated if weather observations and
predictions were improved. This scope of potential benefits could not always be quantified. In
such cases, we used the results of the interviews to define potential scope categorically as
‘very high’, ‘high’, ‘medium’, ‘low’, ‘very low’. As shown, scope for improvement is not 100%,
indicating that the new Doppler radars cannot mitigate all weather-related impacts.
Table 4. Major categories of expected benefits from improved weather observations according
to interviewed farmers neighbouring a new Doppler radar (n = 27)
Impacted
decisions Weather-related impact
Proportion of
farmers impacted
Scope for
benefit* Main benefit
Planning General farm strategies
and management
100% Medium General adjustment of operations
(e.g. change/confirm previous plans) Convenience 95% High,
Non-financial
Human well-being
Spraying Organisation 60% Minimal,
Non-financial
Management of operations;
Support various decisions daily;
Chemical wasted /
misapplied (i.e. herbicide)
50% 10% Chemical costs
Re-application of chemical
spray
30% 5% Reduced cost of chemical spray;
Reduce loss of chemicals into
environment
Convenience 25% Medium,
Non-financial
Human well-being
Poor spray application
causing weed burden
20% 2% Crop yield potential; Reduce loss of
chemicals into environment Loss of chemical
(unsprayed tanks)
10% Very low Chemical costs
Sheep Animal losses 80% 1% Rare weather-related losses

Economic benefits of Doppler radars 13
Impacted
decisions Weather-related impact
Proportion of
farmers impacted
Scope for
benefit* Main benefit
Sheep
(cont.)
Organisation and
management of activities
80% Medium,
Non-financial
Effective time management; Ensure
better decision
Marketing 10% Medium Aid marketing decisions
Harvest Crop losses (e.g. hail, frost) 100% Very low Generally considered unavoidable
Misallocation of labour 20% Low Potential to improve management of
harvest speed and operations (e.g.,
prioritise vulnerable varieties) is low:
logistic override potential impact.
Organization 20% Low,
Non-financial
Revise decisions to suit changing
weather conditions; Farm constraints
override potential benefits
Thunderstorms, fires 20% High,
Non-financial
Safety (e.g., operating machinery)
Production downgraded 10% 15% Farm profits due to crop losses
Fertilising Overall Fertilizing program 50% Low Limited room for additional impact
(e.g., logistic override potential
impact, mainly based on past rainfall)
Nitrogen top-up 50% 15% Crop yield potential
Inadequate incorporation
of nitrogen
10% 10% Crop yield potential; More targeted
nitrogen application and reduced
wash-off Convenience 5% Medium,
Non-financial
Make informed decisions on an hourly
basis
Seeding Seeding program 20% Low-Medium Improved management of seeding
start and speed; Critical decision, but
often limited scope for change (e.g.,
logistic override potential impact)
Storms Farm damage 100% Low Unavoidable and/or insured
* Scope for benefit in terms of losses prevented, higher production achieved, or reduced costs. Information sourced from farmer interviews.
Planning
All respondents mentioned the use of weather information to refine their day-to-day
planning. Farmers believed that access to this information is unlikely to impact economic
profits greatly as activities are switched around rather than replaced – working calendars are
full anyway. However, simply having the option to plan better constitutes a benefit: all
respondents emphasised the convenience of readily accessible weather information. In other
words, the new radar investments contribute to farmers’ well-being - an important but less
tangible benefit improving their working conditions (e.g. decreased stress, greater agility,
increased reactivity).

Economic benefits of Doppler radars 14
Spraying
Doppler radars impacted farmers’ spraying decisions in a variety of ways (Table 4). For most
farmers (60%), improved weather information played a significant role in the management of
herbicides. However, this importance was mostly related to non-economic benefits (e.g.
‘supporting daily decisions’) and the convenience of being able to make adjustments to their
daily plans rather than related to expected economic returns. As with planning, spraying task
would be re-organised more conveniently rather than lost or replaced. The scope for reducing
chemical losses was found to be small as farmers were already very careful with expensive
spraying inputs, For example, about half of respondents believed they could reduce the
amount of chemicals wasted or misapplied (e.g., spray applied too late because of rain or high
winds), but only by about an average 10% (the estimated proportion of chemicals that are
currently misapplied due to weather related events = taken as the ‘scope for improvement’ in
Table 4). Some 30% of farmers identified some scope for reducing re-spraying efforts because
of weather-related events but, on average, re-spray only concerned 5% of all sprayed areas to
start with. Similarly, 20% of farmers said they lost some yield (2%) to weeds from inadequate
herbicide usage. Only 10% of farmers reported losses of chemicals (unused herbicide tanks)
as an issue and identified very low scope for improvement.
Sheep management
The Doppler radar information mattered for almost all respondents’ sheep management
decisions. The vast majority (80%) of farmers with sheep appreciated the convenience of
assessing weather information, and, if needed, the ability to re-schedule critical activities
(notably shearing). Important sheep losses are rare events. Yearly, farmers in the wheatbelt
experience about 1% weather-related sheep losses reflecting the limited scope for
improvement. Nevertheless, in the case of isolated events, when farmers need to act quickly
and decisively, Doppler radar technology can play a role by providing real-time critical
information. Some farmers emphasised that exposure of livestock to severe unexpected
weather can be reduced by monitoring radar information, essentially enabling accurate and
rapid emergency response to protect livestock from, for example, heavy rainfall events.

Economic benefits of Doppler radars 15
Harvest, fertilising and seeding
Limited impact of radar information on harvest, fertilising, and seeding was found from a
production point of view. As reported by Lacoste and Kragt (2018), those practices require
longer-term horizon forecasts (e.g. 2+ weeks). Overall, farmers associated Doppler radar
technologies pre-dominantly with real-time information.
No farmer mentioned the importance of Doppler radar capability in providing higher quality
data even though this can translate into better estimates of longer-term weather forecast and
warning services. Although farmers understood that past and forecasted rainfall mattered, for
example, to fertilising decisions, the new Doppler radar capability was not associated with
improved long-term accuracy of rainfall forecasting.
Overall, except for safety matters, a low impact of weather forecast was identified for harvest
activities. All farmers said that crop losses due to weather-related impacts are unavoidable at
harvest. However, scope for improvement was identified by some 10% of farmers, who
recognised that, on average, 15%1 (area-equivalent) of their wheat2 harvest gets downgraded
due to weather-related events each year. This was incorporated in the model as a yield loss
that could not be harvested. This reduced profitability can potentially be prevented by
accessing Doppler radar information.
For about half of the farmers, weather observations and short-term forecasts mattered for
applying top-up fertiliser, and a 15% scope for improving in this practice was identified. The
other half pre-defined their fertilising programs with little to no room for adjustments.
Fertiliser is a large investment, and thus farmers aim to reduce fertiliser top-up without
production penalties. Only a minority of farmers (10%) mentioned the scope for improving
the adequate incorporation of nitrogen, which would reduce wheat yield.
1 In line with reported grain losses in other media, e.g. http://www.abc.net.au/news/rural/2016-11-07/wa-frost-giwa-report-downgrades-tonnage/8001558 2 The focus in this report is on wheat, which is the predominant crop in the region. By including only loss in wheat yield, our results can be considered as more conservative estimates of weather radar benefits.

Economic benefits of Doppler radars 16
3.3.1. Scope for potential economic benefits
After analysing the potential benefits identified by farmers, we selected seven aspects of
practices to include in the further agricultural model (Table 5). These activities were selected
based on the quantifiable potential economic benefits that could be gained from the
enhanced weather information provided by the new radars. The potential economic benefits
are mostly related to tactical decisions associated with severe weather events or unreliable
weather forecasts, which might present financial risks to farmers.
Table 5. Selected farmers’ activities with scope for potential economic gain thanks to improved
weather observations and forecasts (source: farmer interviews)
Population affected
Scope for improvement
1. Reduce proportion of downgraded wheat at harvest● 10% 15%
2. Adjust unnecessary Nitrogen fertiliser top-up costs due to better targeting^
50% 15%
3. Decrease of herbicide spray wasted/misapplied* 50% 10%
4. Reduction of sheep losses# 80% 1%
5. Reduction of wheat losses from inefficient herbicide application*
20% 2%
6. Reduction of wheat losses due to inadequate incorporation of fertiliser^
10% 10%
7. Less area re-sprayed* 30% 5%
Major categories of expected benefits in Table 4: ●harvest, ^fertilising, *spraying, #sheep management
Not all farmers will be affected by the losses reported in Table 5 to the same extent. About
10% of farmers stated that better meteorological information would decrease the proportion
of downgraded wheat and yield losses. For half of the farmers, enhanced weather and forecast
information might lead to reduction of fertiliser and spray losses. Most of the farmers
interviewed reported the importance of monitoring current conditions to avoid weather-
related losses in sheep (despite sheep losses being reported as very rare; 1%). In the economic
model, we account for this potential proportion of farmers impacted by changes in each
practice.

Economic benefits of Doppler radars 17
3.3.2. Economic analysis of enhanced weather and forecast information
After identifying the proportion of the farmer population impacted across the major
categories of expected benefits (Table 4), we developed an agricultural model to estimate the
potential economic benefits associated with accurate and timely weather information for the
Western Australia wheatbelt. The model was based on the current proportion (80%) of radar
coverage across the study area. In this model (included as an online Appendix to this report),
we calculate the benefits of improved weather predictions associated with the new radar
investments on the seven selected agricultural activities (Table 5). We do not blanketly say
that improved weather information will resolve any weather-related losses for all farmers in
the wheatbelt. Instead, we assumed that the new Doppler radars would result in a 5%
improvement of weather forecasting accuracy and weather monitoring—and thus a 5%
marginal economic benefit on the selected practices. The analysis multiplies this marginal
benefit from the radar with the potential for improvement (= percentage scope of benefits in
Table 5) and the affected farmer population across the wheatbelt (Table 5).
The economic analysis was first conducted at ‘base case’ values for agricultural prices and
population impacted. These base case values are reported in Appendix 1.
In the base case scenario, economic benefits of Doppler radars were estimated at
$3.36 million/year (Table 6). These benefits accrue because of reduced re-spraying or
chemical application costs, reduced downgraded wheat area or wheat losses, and reduced
sheep losses. Reduction of downgraded wheat area is the benefit contributing to the highest
economic return ($1.14 million/year). A decrease in fertiliser top-up costs can contribute
regional benefits of about $756,000/year. Over a 15 year life-time of the radars, and at a 7%
discount rate, the overall benefits could yield a present value of $28.5 million. We will show
in Section 3.4 that these benefits greatly outweigh the costs of installing and maintaining the
Doppler radars.
Using the information collected from interviewed farmers (rather than Wheatbelt averages),
a cropping farmer in our sample with 2,000 hectares of wheat could save nearly $9,000/year
by reducing the area of downgraded wheat. Likewise, a decrease in fertiliser top-up costs
could reduce those costs for a sampled farm by just over $1,100/year.

Economic benefits of Doppler radars 18
If the Doppler radars have a higher marginal benefit through improved weather monitoring or
forecasting information, the economic benefits to farmers in the wheatbelt can increase.
For example, if we were to assume a 15% marginal benefits from the new weather radars,
total benefits to the region could be $10.1 million/year; while a lower 2% marginal benefits
from enhanced meteorological information would yield around $1.35 million/year (Table 6).
Table 6. Potential economic benefits of Doppler radars for farmers in the WA wheatbelt region
(in ‘000 $/year)
Marginal benefits (%) of Doppler radars to
farmer’s management practices
Base case
Lower / higher marginal benefits
Source of benefits 5% 2% 10% 15%
Reduce proportion of downgraded wheat● $1,142 $457 $2,283 $3,425
Adjust N-fertiliser top-up ^ $756 $302 $1,512 $2,268
Decrease spray wasted/misapplied* $472 $189 $945 $1,417
Reduction of sheep losses# $395 $158 $790 $1,185
Reduction of wheat losses from inefficient herbicide application*
$304 $122 $609 $913
Reduction of wheat losses from adjusted fertiliser regime^
$152 $61 $304 $457
Cost of re-spraying* $142 $57 $283 $425
Total economic benefits ($/year) $3,363 $1,345 $6,727 $10,090
Major categories of expected benefits in Table 5: ●harvest, ^fertilising, *spraying, #sheep management
3.3.3. Sensitivity analysis on the agricultural model
Sensitivity analysis was performed on the key model parameters by changing values one
parameter at a time (Table 7). We conducted the sensitivity analysis for all seven potential
activities reported in Table 5. Figure 4 presents the results of one of the sensitivity analyses;
for a reduction in downgraded wheat area lost at harvest. Detailed sensitivity analysis results
for the other activities are presented in Appendices 2–7.
Accurate and timely weather information can assist farmers to make more informed decisions
and decrease the chance of harvesting a downgraded wheat crop. Downgraded wheat impacts
are not very sensitive to changes in wheat price, but highly sensitive to the marginal benefits
provided by the Doppler radars and to the proportion of the farmer population impacted by
the event (Figure 4). Even if Doppler radars only provide a 2% marginal benefit and 15% of
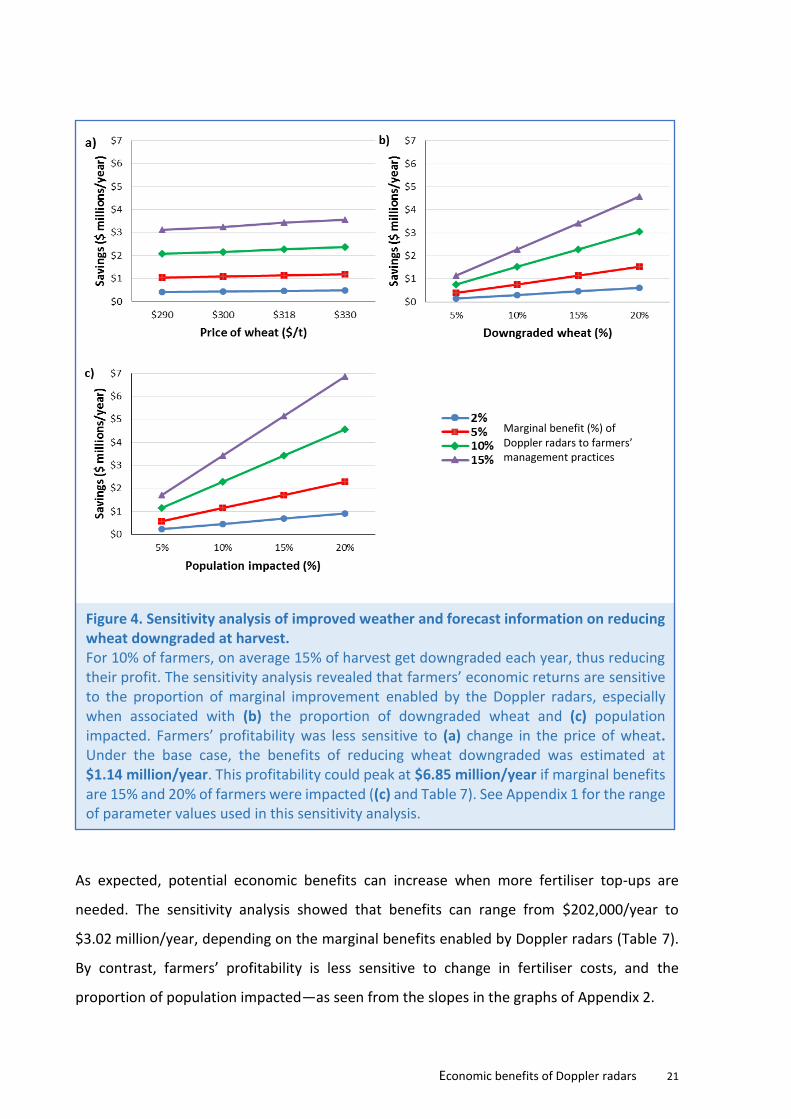
Economic benefits of Doppler radars 19
wheat is downgraded (in our base case), if 10% of farmer population can improve harvest
timing and reduce downgraded grain losses, we estimate potential savings of $457,000/year
(Table 6).
The sensitivity analysis showed that, even if the marginal benefit owning to improved
weather and forecast information is only 2%, a positive impact on the wheatbelt’s economy
is expected for the range in values tested.

Economic benefits of Doppler radars 20
Table 7. Results of sensitivity analysis on key model parameters (benefits per category, rounded to nearest ‘000 $/year). Marginal Benefits from enhanced information
Variables Value 2% 5% 10% 15%
Red
uct
ion
of
do
wn
grad
ed
wh
eat●
Price of wheat ($/t) $290 416 1,041 2,082 3,124 (base value $318) $300 431 1,077 2,154 3,231 $330 474 1,185 2,370 3,554 Proportion downgraded 5% 152 381 761 1,142 (base value 15%) 10% 304 761 1,522 2,283 20% 609 1,522 3,045 4,567 Population impacted 5% 228 571 1,142 1,713 (base value 10%) 15% 685 1,713 3,425 5,138 20% 913 2,283 4,567 6,850
Ad
just
ing
fert
ilise
r to
p-u
p ^
Price of fertiliser ($/ha) $60 227 567 1,134 1,701 (base value $80) $70 265 661 1,323 1,984 $90 340 850 1,701 2,551 Range of top-up 10% 202 504 1,008 1,512
(base value 15%) 15% 302 756 1,512 2,268
20% 403 1,008 2,016 3,023 Population impacted 30% 181 454 907 1,361 (base value 50%) 40% 242 605 1,209 1,814 60% 363 907 1,814, 2,721
Dec
reas
e ch
emic
al
was
ted
/mis
app
lied
*
Price of spray ($/ha) $65 164 409 819 1,228 (base value $75) $70 176 441 882 1,323 $80 202 504 1,008 1,512 % wasted/misapplied 5% 94 236 472 709 (base value 10%) 10% 189 472 945 1,417 15% 283 709 1,417 2,126 Population impacted 30% 113 283 567 850, (base value 50%) 40% 151 378 756 1,134 60% 227 567 1,134 1,701
Red
uct
ion
of
shee
p lo
sses
#
Sheep price ($/head) $100 144 359 718 1,077 (base value $110) $120 172 431 862 1,293
$130 187 467 934 1,400 Sheep losses 2% 316 790 1,580 2,370 (base value 1%) 3% 474 1,185 2,370 3,555
4% 632 1,580 3,160 4,739 Population impacted 60% 118 296 592 889 (base value 80%) 70% 138 346 691 1,037 90% 178 444 889 1,333
Marginal Benefits from enhanced information
Variables Value 2% 5% 10% 15%
Red
uct
ion
wh
eat
loss
es
fro
m w
eed
bu
rden
*
Price of wheat ($/t) $290 111 278 555 833 (base value $318) $300 115 287 574 862 $330 126 316 632 948 Yield losses 1% 61 152 304 457 (base value 2%) 3% 183 457 913 1,370 4% 244 609 1,218 1,827 Population impacted 15% 91 228 457 685 (base value 20%) 25% 152 381 761 1,142
30% 183 457 913 1,370
Red
uct
ion
of
wh
eat
loss
es
fro
m a
dju
sted
fer
tilis
er ^
Price of wheat ($/t) $290 56 139 278 416 (base value $318) $300 57 144 287 431 $330 63 158 316 474 Yield losses 1% 30 76 152 228 (base value 2%) 3% 91 228 457 685 4% 122 304 609 913 Population impacted 5% 30 76 152 228 (base value 10%) 15% 91 228 457 685 20% 122 304 609 913
Co
st o
f re
-sp
rayi
ng*
Price of spray ($/ha) $65 49 123 246 368 (base value $75) $70 53 132 265 397 $80 60 151 302 454 Area re-sprayed 2% 23 57 113 170 (base value 5%) 5% 57 142 283 426
10% 113 283 567 850 Population impacted 25% 47 118 236 354 (base value 30%) 35% 66 165 331 496 40% 76 189 378 567
Major categories of expected benefits: *Spraying herbicide, ●harvest, ^nitrogen fertilising, #sheep management
Economic benefits of Doppler radars 21
As expected, potential economic benefits can increase when more fertiliser top-ups are
needed. The sensitivity analysis showed that benefits can range from $202,000/year to
$3.02 million/year, depending on the marginal benefits enabled by Doppler radars (Table 7).
By contrast, farmers’ profitability is less sensitive to change in fertiliser costs, and the
proportion of population impacted—as seen from the slopes in the graphs of Appendix 2.
Figure 4. Sensitivity analysis of improved weather and forecast information on reducing wheat downgraded at harvest. For 10% of farmers, on average 15% of harvest get downgraded each year, thus reducing their profit. The sensitivity analysis revealed that farmers’ economic returns are sensitive to the proportion of marginal improvement enabled by the Doppler radars, especially when associated with (b) the proportion of downgraded wheat and (c) population impacted. Farmers’ profitability was less sensitive to (a) change in the price of wheat. Under the base case, the benefits of reducing wheat downgraded was estimated at $1.14 million/year. This profitability could peak at $6.85 million/year if marginal benefits are 15% and 20% of farmers were impacted ((c) and Table 7). See Appendix 1 for the range of parameter values used in this sensitivity analysis.
Marginal benefit (%) of Doppler radars to farmers’ management practices

Economic benefits of Doppler radars 22
Meteorological information is further critical to manage chemical application (i.e. herbicide).
This study identified scope for improvement related to proportion of chemical
wasted/misapplied. The benefits of reducing chemical misuse (10% under the base case
scenario) was calculated at $472,000/year (Table 6). However, the region can gain up to
$2.13 million/year in benefits if the proportion of chemical wasted/misapplied is actually
higher (15%) and marginal benefits of enhanced meteorological information were 15%
(Table 7 and Appendix 3). Even in an analysis of 2% marginal benefits and 5% chemical misuse,
the region could benefit by $94,000/year (Table 7). In addition to these economic returns,
reducing the amount of chemicals being wasted or misapplied will have significant
environmental advantages (e.g. reduce unnecessary chemical runoff into rivers).
Improved weather information can also reduce sheep losses (Appendix 4). Although farmers
usually expected low potential improvements (currently there is on average only 1% sheep
losses related to weather events), this study identified a potential increase in the region’s
profitability by $395,000/year under a scenario of 5% improved weather information
(Table 6).
Another economic benefits of enhanced weather information is a reduction of wheat yield
losses due to poor spray (herbicide) application or inadequate incorporation of fertiliser.
Sensitivity analyses revealed that farmers’ revenue is highly sensitive to poor spray
application, especially when associated with proportion of wheat yield losses and population
impacted (Appendix 5). The region could benefit $457,000/year from more efficient herbicide
spraying as well as fertiliser application (under a scenario of 5% improved weather
information). In an analysis of 4% yield losses and 10% marginal benefits, the economic impact
can be even higher ($1.83 million/year). In addition to economic benefits (Tables 6 and 7;
Appendix 6), timely and accurate weather information can reduce risk of inefficient herbicide
and nitrogen use, contributing not only to financial benefits but also to environmental
protection.
Improved weather information thanks to the Doppler radars was identified as relevant for
reducing the cost of re-spraying herbicides. A 5% scope for benefit of reducing herbicide usage
was estimated, which amounts to about $142,000/year. These gains can increase up to
$425,000/year when there is a need to re-spray a larger crop area of 15% (Appendix 7). The
gains are less sensitive to variations in spray costs (Table 7 and Appendix 7).

Economic benefits of Doppler radars 23
Figure 5. Annual present value of costs at different discount rates. The reported costs were allocated to approximately two years of implementation (i.e., designing and building the three radars) and about 15 years of an operational phase until the end of 2031. The highest investment costs is during the implementation phase
3.4. Cost-benefit analysis
In earlier sections of this report we identified the capital costs (Table 2) and potential
economic benefits (Table 6) associated with the Wheatbelt Radars Project, as a pre-
requirement to conduct the cost-benefit analysis. In this section, we determine whether the
new radars investments can yield a positive net present value (NPV) for farmers across the
Wheatbelt. First, we calculated the annual present value (PV) of capital costs of radar
investments over a 17 year project life cycle (2015–2031; Figure 5). In the base-case scenario,
we assumed that the discount rate was 7%, with sensitivity testing at 4% and 10%. The total
PV of costs at 7% discount rate was $18.5 million, and ranged from $19.9 million to
$17.4 million at 4% and 10% discount rates respectively.
Second, we calculated the PV of the benefits generated by the new weather radars. It is
assumed that the benefits start directly after construction of the first radar (Newdegate) in
2016. In this year, the potential economic benefits were valued at $280k since only one radar
was operational during October to December. In 2017, following the launch of two new radars
at South Doodlakine (February) and Watheroo (May), the economic benefits could accrue to

Economic benefits of Doppler radars 24
$2.9 million. From 2018 onwards, the benefits was estimated at $3.36 million/year (Table 5)
since all three radars are then fully operational and integrated into the Bureau’s radar
network. Figure 6 summarises the annual cashflow of potential benefits at different discount
rates. At a 7% discount rate, the total PV of benefits was estimated at $28.5 million.
A cost-benefit analysis conducted in Excel demonstrated that significant net economic gains
can be achieved through improved weather and forecast information (Figure 7). When the
costs and potential economic benefits are projected across the whole Wheatbelt agricultural
area for the next 17 years, we estimate a total net present value to farm businesses of
$9.98 million (7% discount rate) and a benefit cost ratio (BCR) of 1.54 (i.e., $1.54 return for
every dollar invested). If we discount future benefits at a higher rate of 10%, NPV is still
estimated to be positive at $5.70 million (BCR of 1.33). Figure 8 show how the estimated NPV
of the Wheatbelt Radars Project changes over time at different discount rates. Because costs
are incurred at the start, NPV is initially negative, but turns positive as soon as all three radars
are fully operational.
Figure 6. Annual present value of potential benefits at different discount rates. Under the base-case, the total PV of benefits was estimated at $28.5 million (7% discount rate). The total PV of benefits ranges from $35.8 million to 23.1 million for 4% and 10% discount rates respectively. The potential benefits are related to reduced downgraded wheat or wheat losses, reduced re-spraying or chemical application costs, and reduced sheep losses as explained in Section 3.3

Economic benefits of Doppler radars 25
Figure 8. Annual net present value (NPV) of the Wheatbelt Radars Project at different discount rates. Annual variation in NPV can be observed over the project life cycle, with major costs (i.e. negative NPV) incurred at the start of the project (2015–16)
Figure 7. Total present value (PV) of costs and potential benefits, and Net Present Value (NPV) of the Wheatbelt Radar Project. At all three discount rate assumptions, the potential benefits of the Doppler radars to farms outweigh the costs.

Economic benefits of Doppler radars 26
3.4.1. Sensitivity analysis on different benefits assumptions
So far, we evaluated the NPV for the Wheatbelt Radars Project based on a fixed time frame
for the operational phase (i.e., 15 years), and based on the base-case estimates of potential
benefits (Table 6). In this section, we explore the sensitivity of the NPV by firstly evaluating
the potential economic benefits in the events of a shorter (10 years) or longer (20 years)
radars’ operational life3; and secondly testing different potential benefits assumptions: a
worst case scenario (what if benefits are very low), best case scenario (what if benefits are
very high) and a low agricultural prices scenario (changes in market conditions) (Table 3). The
values used in this latter analysis was extracted from Table 7.
The analysis revealed that the project is economically efficient (i.e. NPV > 0 and BCR > 1) even
if the radars are operational for only 10 years and a 10% discount rate is applied (NPV
$1.94 million and BCR 1.12; Table 8). In our most favourable analysis (20 years radars’
operational life and 4% discount rate), the radars could increase the region’s economic
efficiency by $23.8 million, which represents a BCR of $2.11 for each dollar invested (Table 8).
A further analysis revealed that the three new radars need to be operational for only 7 years
to achieve the break-even point of the project (i.e. total revenue equals total costs) at a 7%
discount rate.
Table 8. NPV and BCR for the Wheatbelt radar project at different assumptions about discount
rates and radars’ operational life time (2017–..) Discount rate
4% 7% 10%
Op
erat
ion
al li
fe t
ime
10 years NPV $7.69 million $4.46 million $1.94 million
BCR 1.42 1.26 1.12
15 years
(base)
NPV $15.9 million $9.98 million $5.70 million
BCR 1.80 1.54 1.33
20 years NPV $23.8 million $14.6 million $8.39 million
BCR 2.11 1.75 1.47
3 Base case assumption was 15 years operational phase

Economic benefits of Doppler radars 27
Further sensitivity analysis scenarios of different benefits and price scenarios showed that the
“lowest benefits” and “lowest prices” scenarios yielded a NPV<0 and BCR<1. In these
conditions, the investment in radars infrastructure appears to be not economically viable
based on benefits for the agricultural sector (Table 9).
It is important to note that estimation of expected economic returns greatly depends on the
marginal benefits of weather forecast improvements over time, which cannot be anticipated
with certainty. In this assessment, a 5% marginal benefit was assumed. However, any decision
should take into account the results of a thorough sensitivity analysis similar to the one
described in this report. In the case of government investment into new weather radars in the
Wheatbelt, it appears that—under current estimated benefits and price scenarios—the
benefits are well worth the investment costs.
Table 9. Net Present Value (NPV) and Benefit-Cost Ratio (BCR) for the Wheatbelt radar project
at different assumptions about potential benefits achieved Discount rate
4% 7% 10%
Ben
efit
s sc
en
ario
s
1. Lowest
benefits
NPV -$12.7 million -$12.7 million -$12.7 million
BCR 0.36 0.31 0.27
2. Lowest
prices
NPV -$7.1 million -$8.3 million -$9.1 million
BCR 0.64 0.55 0.48
3. Base case NPV $15.9 million $9.98 million $5.7 million
BCR 1.80 1.54 1.33
4. Highest
benefits
NPV $84.0 million $64.1 million $49.7 million
BCR 5.22 4.47 3.85

Economic benefits of Doppler radars 28
4. Discussion
The accessibility and use of forecast by farmers remains little documented (Changnon, 2007;
Yates et al., 2016). This project was the first to address these knowledge gaps for the
wheatbelt region in Western Australia (WA). Lacoste and Kragt (2018) showed that there is a
high degree of respect for the Bureau of Meteorology’s capability, which is reflected by the
high overall importance of forecast and weather information to broadacre crop and livestock
farmers.
In terms of potential agricultural gains from improved weather observations, the magnitude
of the estimates presented in this report differs considerably from a previous study. According
to AEC (2014), radar benefits to a single agricultural activity (reducing herbicide costs) would
yield a NPV of around $108 million over a 20 year analysis (or $8.68 for every dollar invested).
Our model estimated a much lower potential agricultural gain ($14.6 million NPV; Table 8) for
a 20 years radars’ operational phase, with benefits arising mainly from seven different
agricultural activities. We believe that expected return reported by AEC (2014) might not
reflect current farmers’ practices since their analysis was driven by assumptions rather than
first-hand data. In contrast, our results were obtained based on in-depth interviews with
farmers that accounts not only for the diversity of farmers but also their actual practices.
Gathering information from three regions of the wheatbelt, this study showed that farmers
are very careful with expensive inputs, which means that the potential benefits of improved
meteorological information may be lower than expected with regards to spraying and
fertilising practices. In our sample, only 30% of respondents stated that they may need to re-
spray land because of weather-related impacts. For that proportion of farmers, standard
practices for re-spraying amount to around 5% of the area, rather than huge areas every year
(as assumed in, for example, GHD, 2013). A cropping farmer with 2,000 hectares of wheat,
and thus a potential 100 hectares to re-spray, could benefit at maximum $7,500/year by
reducing costs of herbicide inputs (at spray costs $75/ha). Consequently, a 5% improvement
in spraying practice (the marginal benefit generated by improved weather observations
thanks to the new radars) would accrue around $375/year per impacted farm. Nevertheless,
given the large total area of wheat in the wheatbelt (3,149,646ha; ABS, 2017), any
improvement for 30% of farmers on 5% of their land can still lead to large economic benefits
for the region as a whole.
Economic benefits of Doppler radars 29
These results concur with concerns over unrealistic estimates of weather and forecast value
expressed by Kusunose and Mahmood (2016), who argued that expected benefits tend to be
over-estimated, showing discrepancies between farmers’ actual profit and values.
With the installation of the three Doppler radars in the wheatbelt, the farmers and rural
communities are now receiving more precise weather information than before. However,
farmers’ awareness of some products generated by the new radars (i.e., Doppler wind) is still
limited, showing scope for improvements in terms of delivery of information (Lacoste and
Kragt, 2018). Forecast information should be easily accessible and understood by farmers,
while not overtaxing their time (Crane et al., 2010). In this sense, how farmers interact with
the weather information available will play a key role in determining the agricultural benefits
generated by Doppler radars.
Enhanced performance of weather forecasts (i.e., specially long-term forecast) is expected to
be a gradual process not only involving the new Doppler technology bit also increased
forecaster experiences, faster computer systems, and long-term integration of historical
higher resolution data captured by from the Doppler radars. Past studies have shown weather
and forecast information to improve thanks to the assimilation of Doppler radar data (Abhilash
et al., 2007; Bieringer and Ray, 1996; Polger et al., 1994; Rihan and Collier, 2010; Serafin and
Wilson, 2000; Tahanout et al., 2015; Zhao and Xue, 2009). To date, however, the magnitude
of the marginal benefits attributed to Doppler radars (in terms of enhanced performance of
weather forecasting) is unknown for the wheatbelt region. To avoid an overestimation of the
benefits, we therefore assumed that only 5% of the impact size could be avoided. Given that
the investments in the WA Doppler radars are a relatively recent development, it is not
possible to give a precise observation of this impact size with certainty. Nevertheless, even at
this 5% marginal benefit, the investments are worth the potential benefits to the agricultural
sector.
The analysis focused on wheat and sheep and does not include other grain crops such as
barley, oats, and canola, which will also benefit from improved decision making. A benefit that
was not mentioned by farmers and hence not modelled was the most effective application of
fungicide. The Doppler system could improve fungicide application by indicating the spraying
window whilst avoiding a rainfall event, ensuring effective control of fungal diseases.

Economic benefits of Doppler radars 30
In addition to benefits to the agricultural sector, enhanced weather information can
contribute to a wide range of services and support a variety of stakeholders (e.g. emergency
services, aviation sector, transport, and rural communities) across the wheatbelt (AEC, 2014;
DAFWA, 2014; ESS, 2014; GHD, 2013). Additionally, improved efficiency in the use of
agrochemicals (thanks to improved weather observations), contribute not only to farms’
profitability but also promise environmental benefits (i.e., minimise runoff or spray drift from
over- or misapplication). Such additional benefits have not been assessed in the current study.
For a more accurate estimate of the total benefits provided by the WA radar investment, one
would need to consider the full range of financial plus direct and indirect non-financial benefits
generated for farmers and other rural stakeholders in the region.
5. Conclusions
The Western Australian Government has committed a $23 million investment in Doppler
radars across key locations in the WA wheatbelt. As part of a larger project to estimate the
benefits of Doppler radar investments, we assessed the potential financial gains to farmers in
the region associated with this strategic investment. Our economic analysis was based on
observed farmers’ behaviour, avoiding unrealistic and over-estimation of expected returns.
There are several farming practices to which strategic investment in improved weather
prediction capability can enable more informed decisions (i.e., fertiliser and herbicide
application), ensuring farm inputs are applied more efficiently and effectively. Enhanced
weather and forecast information could deliver, on average, $3.36 million/year in benefits to
farmers in the wheatbelt (with access to the improved information). In net present value
terms, the economic gain was estimated at $9.98 million (7% discount rate) over the 17 years
analysis, which represents a BCR of $1.54 for each dollar invested. The break-even point of
the investment in three Doppler radars can be achieved after 7 years of the radars’ operation.
The above results were estimated based on a 5% marginal benefits of improved weather
services, thus potential economic gains could be even higher if the Doppler radars improved
weather forecasting even further.
This is the first study to quantify the expected returns of Doppler radar investments for
Western Australia’s most important grain growing area. Showing positive economic benefits
of the investment is critical for justifying future investments in Doppler radar infrastructure

Economic benefits of Doppler radars 31
across Australia. Beyond the identified benefits generated by enhanced weather and forecast
information, there are a range of potential non-priced effects (e.g., social and environmental)
that were not quantified in the present study (e.g., minimize nitrogen leaching from
agricultural soils). Economic assessment of those non-marked benefits would increase the
estimated economic return for the region even further.

Economic benefits of Doppler radars 32
References
ABARES - Australian Bureau of Agricultural and Resource Economics and Sciences, 2017. Agricultural Commodity Statistics 2017- CC BY 4.0., Agricultural Commodity Statistics. Canberra ACT.
Abhilash, S., Das, S., Kalsi, S.R., Das Gupta, M., Mohankumar, K., George, J.P., Banerjee, S.K., Thampi, S.B., Pradhan, D., 2007. Assimilation of Doppler weather radar observations in a mesoscale model for the prediction of rainfall associated with mesoscale convective systems, Journal of Earth System Science. https://doi.org/10.1007/s12040-007-0026-2
ABS - Australian Bureau of Statistics, 2017. Agricultural Commodities, Australia, 2015-16. Canberra. AEC, 2014. Technology in Agriculture. AECgroup Ltd., Perth. Anaman, K.A., Lellyett, S.C., 1996. Assessment of the benefits of an enhanced weather information
service for the cotton industry in Australia. Meteorological Applications 3, 127–135. https://doi.org/10.1002/met.5060030202
Asseng, S., McIntosh, P.C., Thomas, G., Ebert, E.E., Khimashia, N., 2016. Is a 10-day rainfall forecast of value in dry-land wheat cropping? Agricultural and Forest Meteorology 216, 170–176. https://doi.org/10.1016/j.agrformet.2015.10.012
Asseng, S., Thomas, D., McIntosh, P., Alves, O., Khimashia, N., 2012. Managing mixed wheat-sheep farms with a seasonal forecast. Agricultural Systems 113, 50–56. https://doi.org/10.1016/j.agsy.2012.08.001
Bieringer, P., Ray, P.S., 1996. A Comparison of Tornado Warning Lead Times with and without NEXRAD Doppler Radar. Weather and Forecasting 11, 47–52. https://doi.org/10.1175/1520-0434(1996)011<0047:ACOTWL>2.0.CO;2
BOM - Bureau of Meteorology, 2018. Radar images [WWW Document]. URL http://www.bom.gov.au/australia/radar/ (accessed 7.1.18).
BOM - Bureau of Meteorology, 2017. Wheatbelt Radars Project: End Project Report. Changnon, S.A., 2007. The Past and Future of Climate-Related Services in the United States 1, 1–7. Crane, T.A., Roncoli, C., Paz, J., Breuer, N., Broad, K., Ingram, K.T., Hoogenboom, G., 2010. Forecast
Skill and Farmers’ Skills: Seasonal Climate Forecasts and Agricultural Risk Management in the Southeastern United States. Weather, Climate, and Society 2, 44–59. https://doi.org/10.1175/2009WCAS1006.1
DAFWA - Department of Agriculture and Food Western Australia, 2014. DAFWA ’ s Doppler radar technology - Infosheet [WWW Document]. URL https://www.agric.wa.gov.au/sites/gateway/files/Doppler radar project infosheet.pdf (accessed 2.4.18).
Dickins, J., Wedd, T., 2007. The impact of RNDSUP Doppler radars on forecast operations in Adelaide and Brisbane. 33rd AMS Conf. Radar Meteorology (Cairns, Australia).
ESS - Environmental Systems & Services, 2014. Western Australia Radar Network Costs & Benefits. ESS Weather Tech Pty Ltd.
Fox, G., Turner, J., Gillespie, T., 1999. The value of precipitation forecast information in winter wheat production. Agricultural and Forest Meteorology 95, 99–111. https://doi.org/10.1016/S0168-1923(99)00022-2
GHD, 2013. Report for Orana Region Organisation of Councils - Weather Radar Project. Final Report. Dubbo NSW.
Infrastructure Australia, 2018. Assessment Framework: For initiatives and projects to be included in the Infrastructure Priority List, Cervical artery dysfunction. Australian Government, Sydney NSW.
Kusunose, Y., Mahmood, R., 2016. Imperfect forecasts and decision making in agriculture. Agricultural Systems 146, 103–110. https://doi.org/10.1016/j.agsy.2016.04.006
Lacoste, M., 2018. Farmers’ use of weather and forecast information in the Western Australian wheatbelt: dataset of 51 respondents, 37 farms. Department of Agricultural and Resource Economics, The University of Western Australia: Perth. DOI: 10.4225/23/5afd07e459ea3.
Lacoste, M., Kragt, M., 2018. Farmers’ use of weather & forecast information in the Western

Economic benefits of Doppler radars 33
Australian wheatbelt. Report to the Bureau of Meteorology. Perth. Leviakangas, P., 2009. Understanding and enhancing the public ’ s behavioural response to flood
warning information. Meteorological Applications 16, 315–323. https://doi.org/10.1002/met Moeller, C., Smith, I., Asseng, S., Ludwig, F., Telcik, N., 2008. The potential value of seasonal forecasts
of rainfall categories-Case studies from the wheatbelt in Western Australia’s Mediterranean region. Agricultural and Forest Meteorology 148, 606–618. https://doi.org/10.1016/j.agrformet.2007.11.004
Nurmi, P., Perrels, A., Nurmi, V., 2013. Expected impacts and value of improvements in weather forecasting ontheroad transport sector. Meteorological Applications 20, 217–223. https://doi.org/10.1002/met.1399
Polger, P.D., Goldsmith, B.S., Przywarty, R.C., Bocchieri, J.R., 1994. National Weather Service Warning Performance Based on the WSR-88D. Bulletin of the American Meteorological Society 75, 203–214. https://doi.org/10.1175/1520-0477(1994)075<0203:NWSWPB>2.0.CO;2
Rihan, F., Collier, C., 2010. A Basis for Improving Numerical Forecasting in the Gulf Area by Assimilating Doppler Radar Radial Winds. International Journal of Geosciences 1, 70–78. https://doi.org/10.4236/ijg.2010.12010
Roudier, P., Alhassane, A., Baron, C., Louvet, S., Sultan, B., 2016. Assessing the benefits of weather and seasonal forecasts to millet growers in Niger. Agricultural and Forest Meteorology 223, 168–180. https://doi.org/10.1016/j.agrformet.2016.04.010
Serafin, R.J., Wilson, J.W., 2000. Operational weather radar in the United States: Progress and Opportunity. Bulletin of the American Meteorological Society 81, 501–518. https://doi.org/10.1175/1520-0477(2000)081<0501:OWRITU>2.3.CO;2
Shafiee-Jood, M., Cai, X., Chen, L., Liang, X.Z., Kumar, P., 2014. Assessing the value of seasonal climate forecast information through an end-to-end forecasting framework: Application to U.S. 2012 drought in central Illinois. Water Resources Research 50, 6592–6609. https://doi.org/10.1002/2014WR015822
Tahanout, M., El Hamid Adane, A., Du Chatelet, J.P., 2015. An Improved M-PRT Technique for Spectral Analysis of Weather Radar Observations. IEEE Transactions on Geoscience and Remote Sensing 53, 5572–5582. https://doi.org/10.1109/TGRS.2015.2425549
Wilks, D.S., Wolfe, D.W., 1998. Optimal use and economic value of weather forecasts for lettuce irrigation in a humid climate. Agricultural and Forest Meteorology 89, 115–129. https://doi.org/10.1016/S0168-1923(97)00066-X
Yates, D., Vervoort, R.W., Minasny, B., McBratney, A., 2016. The history of using rainfall data to improve production in the grain industry in Australia - From Goyder to ENSO. Crop and Pasture Science 67, 467–479. https://doi.org/10.1071/CP15053
Zhao, K., Xue, M., 2009. Assimilation of coastal Doppler radar data with the ARPS 3DVAR and cloud analysis for the prediction of Hurricane Ike (2008). Geophysical Research Letters 36, 1–6. https://doi.org/10.1029/2009GL038658

Economic benefits of Doppler radars 34
Appendix 1. Parameters used in the agricultural economics model of financial benefits from Doppler radar in wheatbelt region. C
om
mo
n V
aria
ble
s
Variable Base case
values
Range for Sensitivity Analysis
Downgrade● Top-up^
Sheep losses#
Wasted/mis-applied*
Yield losses*
Yield losses^
Re-spraying*
Price of wheat1 ($/t) 318 290 300 330 ✓ ✓ ✓
Spray herbicide ($/ha) 75 65 70 80
✓
✓
Lost wheat yield 2% 1% 3% 4%
✓ ✓
Marginal benefit from Doppler radars2 5% 2% 10% 15% ✓ ✓ ✓ ✓ ✓ ✓ ✓
Un
iqu
e V
aria
ble
Population impacted 10% 5% 15% 20% ✓
Downgraded wheat 15% 5% 10% 20% ✓
Population impacted 50% 30% 40% 60%
✓
Range of Nitrogen top-up 15% 10% 20% 25%
✓
Nitrogen fertiliser ($/ha) 80 60 70 90
✓
Population impacted 80% 60% 70% 90%
✓
Sheep losses 1% 2% 3% 4%
✓
Sheep price ($/head)1 110 100 120 130
✓
Population impacted 50% 30% 40% 60%
✓
Chemical wasted/misapplied 10% 5% 15% 20%
✓
Population impacted 20% 15% 25% 30%
✓
Population impacted 10% 5% 15% 20%
✓
Population impacted 30% 25% 35% 40%
✓
Proportion of areas re-sprayed 5% 2% 10% 15% ✓
Major categories of expected benefits in Table 4: *Spraying herbicide, ●harvest, ^nitrogen fertilising, #sheep management
1Wheat and sheep prices based on average values from 2012-2017 (ABARES, 2017). Wheat yield was kept constant at 1.9 t/ha (average from 2012-2016 (ABARES, 2017)) 2Expected improvement in farmers’ practices based on literature review. All other values were based on the farmers’ interviewed. The true sample values were averaged and rounded up to the nearest multiple of 5. All values are expressed in 2018 Australian Dollar.

Economic benefits of Doppler radars 35
Appendix 2. Sensitivity analysis results of economic impact of enhanced weather and forecast information on fertiliser top-up costs in the WA wheatbelt
Variable Base case values Sensitivity values range
Fertiliser 80 $/ha 60 $/ha – 90 $/ha
Proportion of nitrogen top-up 15% 10% – 25%
Population impacted 50% 30% – 60%
Marginal benefit (%) of Doppler radars to farmers’ management practices
Figure 5. Sensitivity analysis of impact on nitrogen fertiliser top-up costs. The higher the additional benefits of Doppler radar technology, the greater the potential for savings in costs of nitrogen top-up. The economic benefits of reducing fertiliser usage were estimated at $756,000/year (or $50/100ha.year). Higher savings can be achieved if marginal benefits and top-up rates were higher (up to $3.78 million/year; Table 7) (b). The potential returns were less sensitive to variation in herbicide costs (a), and population impacted (c), unless they are combined with higher additional benefits.

Economic benefits of Doppler radars 36
Appendix 3. Sensitivity analysis results of economic impact of enhanced weather and forecast information on chemical wasted/misapplied in the WA wheatbelt
Variable Base case values
Sensitivity values range
Cost of spray 75 $/ha 65 $/ha – 80 $/ha
Chemical wasted/misapplied 10% 5% – 20%
Population impacted 50% 30% – 60%
Marginal benefit (%) of Doppler radars to farmers’ management practices
Figure 7. Sensitivity analysis of reducing chemical wasted/misapplied. Benefits are most sensitive to variations in the proportion of chemical misuse (b), followed by the population impacted (c), and rather in-sensitive to changes in the cost of herbicide spray (a). A 5% improvement in chemical misapplication can enhance the region’s economy by approximately $472,000/year (or $30/100ha.year). However, farmers’ profitability could rise if the proportion of chemical misused/wasted were currently 20%. If we could make a 5% improvement to this the region would gain approximately $945,000/yr, which would increase to $2.83 million/year if radar information would yield a 15% benefit (b).

Economic benefits of Doppler radars 37
Appendix 4. Sensitivity analysis results of economic impact of enhanced weather and forecast information on sheep losses in the WA wheatbelt
Variable Base case values
Sensitivity values range
Price of Sheep 110 $/head 100 $/head – 130 $/head
Sheep losses yearly 1% 2% – 4%
Population impacted 80% 60% – 90%
Marginal benefit (%) of Doppler radars to farmers’ management practices
Figure 6. Sensitivity analysis of improved meteorological information on sheep losses. The economic benefits of reducing sheep losses were estimated at $395,000/year. However, expected economic returns for the wheatbelt’ economy would increase proportionally to the number of sheep losses, ranging from aproximately $158,000/year to almost $5 million/year, depending on the marginal benefits provided by improved forecast services (b). Benefits are not very sensitive to changes in sheep prices (a) and impacted populations (c).

Economic benefits of Doppler radars 38
Appendix 5. Sensitivity analysis results of economic impact of enhanced weather and forecast information on wheat yield losses in the WA wheatbelt
Variable Base case values
Sensitivity values range
Price of Wheat 318 $/t 290 $/t – 330 $/t
Wheat yield losses 2% 1% – 4%
Population impacted 20% 15% – 30%
Marginal benefit (%) of Doppler radars to farmers’ management practices
Figure 8. Sensitivity analysis of reduced wheat yield due to poor spray herbicide application. The higher the marginal radar benefit, the greater the expected economic return for the wheatbelt’s region. Benefits were most sensitive to changes in the proportion of wheat yield losses (b), followed by the population impacted (c). The economic benefits were estimated at $304,000/year. However, the wheatbelt’s economy can increase with higher proportion of wheat yield losses (4%) and marginal benefit (15%), reaching $1.83 million/year (b).

Economic benefits of Doppler radars 39
Appendix 6. Sensitivity analysis results of economic impact of enhanced weather and forecast information on wheat yield losses in the WA wheatbelt
Variable Base case values
Sensitivity values range
Price of Wheat 318 $/t 290 $/t – 330 $/t
Wheat yield losses 2% 1% – 4%
Population impacted 10% 5% – 20%
Marginal benefit (%) of Doppler radars to farmers’ management practices
Figure 9. Sensitivity analysis on reduced wheat yield due to inadequate incorporation of nitrogen fertiliser. Enhanced meteorological information can potentially deliver $152,000/year due to more effective and efficient nitrogen incorporation. Farmers’ profitability was less sensitive to change in price of wheat (a). Sensitivity analysis also demontrated that saving are particularly sensitive to the proportion of lost yield (b) and population impacted (c) with the highest potential economic return achieved under a 15% marginal benefits and 4% yield loss scenario ($913,000/year).

Economic benefits of Doppler radars 40
Appendix 7. Sensitivity analysis results of economic impact of enhanced weather and forecast information on costs of re-spraying in the WA wheatbelt
Variable Base case values
Sensitivity values range
Cost of spray 75 $/ha 65 $/ha – 80 $/ha
Proportion of area re-sprayed 5% 2% – 15%
Population impacted 30% 25% – 40%
Marginal benefit (%) of Doppler radars to farmers’ management practices
Figure 10. Sensitivity analysis of improved meteorological information on costs of re-spraying. The economic benefits of reducing herbicide re-spraying was estimated at aproximately $142,000/year (or $15/100ha.year). The expected economic returns can increase porportionaly to the size of re-sprayed areas and additional benefits enabled by Doppler radars, reaching up to $1.28 million/year in the event of re-spraying 15% of the cropped area and 15% marginal benefits (b). The potential economic returns were less sensitive to variation in spray costs (a), and population impacted (c).

Agricultural and Resource Economics
UWA School of Agriculture and Environment