WHEAT STUDIES - AgEcon Searchageconsearch.umn.edu/bitstream/139262/2/wheat-1931-07-07-08.pdf ·...
37
WHEAT STUDIES OF THE FOOD RESEARCH INSTITUTE VOL. VII, NO. 8 (Price $1 .00) JULY 1931 FINANCIAL RESULTS OF SPECULATIVE HOLDING OF WHEAT SPECULATIVE GAINS AND LOSSES ON THE HOLDING OF WHEAT AND FLOUR IN THE UNITED STATES, BY CROP YEARS (Million dollars) • I .0 0 Total G.ins!t I z and LosslS, , IA\ ....•.. \ u lA' • f" , , A A A \ --.. ...... No ; 00 '0 N\ I \V '1 o't;1 1\ ". • ....... I, \ r '\ '. 0 ........... ,Il··· ..... ,,../ ....... J I 3 • 10 0 • 12 lee!) '86 1890 -9l \ ainsand ... , .. \ ... / \ .................... 1895 -96 1900 -01 1905 -06 I 190 -II I 915 -16 I 925 -26 I 1 I .0 2 00 -31 W J < U Total annual gains and losses on approximately all trading in wheat futures, plus speculative gains and losses on the holding of approxi- mately all unhedged wheat and flour in commercial hands in the United States for eighteen years beginning with 1907-08, are shown by the broken line, the scale for which is at the right. For earlier years only incomplete figures can be compiled. Such a series, prepared on a com- parable basis for the period since 1884-85, is shown by the solid line, the scale for which is at the left. The correspondence between the par- tial series and the total gains and losses since 1907-08 indicates that the partial series may be regarded as representative. The curve of cumu- lative gains and losses is shown only for the partial series and is plotted to the scale (at the left) used for that series. The cumulation is continuous from 1884-85 alid is recommenced with 1921-22. STANFORD UNIVERSITY, CALIFORNIA July 1931 •
-
Upload
truongkhanh -
Category
Documents
-
view
216 -
download
0
Transcript of WHEAT STUDIES - AgEcon Searchageconsearch.umn.edu/bitstream/139262/2/wheat-1931-07-07-08.pdf ·...

WHEAT STUDIES OF THE
FOOD RESEARCH INSTITUTE VOL. VII, NO. 8 (Price $1 .00) JULY 1931
FINANCIAL RESULTS OF SPECULATIVE HOLDING OF WHEAT
SPECULATIVE GAINS AND LOSSES ON THE HOLDING OF WHEAT AND FLOUR IN THE UNITED STATES, BY CROP YEARS
(Million dollars)
• I .0
0 Total G.ins!t I
z and LosslS, , ~ ~ IA\ ....•.. \ u lA' •
f~' f" , ,
A A A \ --.. ...... No ;
00
'0
~/ N\ I \V '1 o't;1 1\ R(f:i~~~~~t~,:;~ial ". • ....... I,
\ r '\ '. 0
\~mUlatiV'ep8rtlal ........... ,Il··· ..... ,,../ ....... J I oo~
~ ~
3 •
10 0
• 12 lee!)
'86 1890 -9l
\ ainsand Lo~~.e~ ...
, .. \ ... / \ ....................
1895 -96
1900 -01
1905 -06
I 190 -II
I 915 -16
I 925 -26
I 1
I .0
2 00
193~'0 -31
W J < U
Total annual gains and losses on approximately all trading in wheat futures, plus speculative gains and losses on the holding of approximately all unhedged wheat and flour in commercial hands in the United States for eighteen years beginning with 1907-08, are shown by the broken line, the scale for which is at the right. For earlier years only incomplete figures can be compiled. Such a series, prepared on a comparable basis for the period since 1884-85, is shown by the solid line, the scale for which is at the left. The correspondence between the partial series and the total gains and losses since 1907-08 indicates that the partial series may be regarded as representative. The curve of cumulative gains and losses is shown only for the partial series and is plotted to the scale (at the left) used for that series. The cumulation is continuous from 1884-85 alid is recommenced with 1921-22.
STANFORD UNIVERSITY, CALIFORNIA July 1931
•

WHEAT STUDIES OF THE
FOOD RESEARCH INSTITUTE The central feature of the series is a periodic analysis of the world wheat situation, with
special reference to the outlook for supplies, requirements, trade, and prices. Each volume includes a comprehensive review of the preceding crop year, and three surveys of current developments at intervals of about four months. These issues contain a careful selection of relevant statistical material, presented in detail in appendix tables for reference purposes, and in summary form in text tables and charts.
Each volume also includes six special studies bearing on the interpretation of the wheat situation and outlook or upon important problems of national policy. Subjects of issues published in recent volumes are listed inside the back cover.
The series is designed to serve the needs of all serious students of the wheat market, in business, government, and academic circles, by summarizing and interpreting basic facts and presenting current developments in due perspective. The special studies are written not merely for students of the wheat market, but as well for various groups of readers who are especially concerned with the fields discussed.
Volumes I-VI are now available, bound in red buckram, at $10.00 each. The ten issues of Volume VII will be published monthly from November 1930 to September 1931, except in April 1931. The subscription price for the volume, including a temporary binder, is $10.00. Individual issues may also be purchased separately. Orders, subscriptions, and other communications should be addressed to FOOD RESEARCH INSTITUTE, STANFORD UNIVERSITY, CALIFORNIA; for Great Britain, to P. S. King & Son, Ltd., Orchard House, 14, Great Smith Street, Westminster, S.W. 1, London; or, for continental Europe, to Martinus Nijhoff, 9 Lange Voorhout, The Hague, Holland.
Entered as second-class matter February 11, 1925, at the post-office at Palo Alto, Stanford University Branch, California, under the Act of August 24, 1912.
Published by Stanford University for the Food Research Institute.
Copyright 1931, by the Board of Trustees of the Leland Stanford Junior University
FOOD RESEARCH INSTITUTE STANFORD UNIVERSITY, CALIFORNIA
DlREcrORS
CARL LUCAS ALSBERG JOSEPH STANCLIFFE DAVIS
ALONZO ENGLEBERT T A YLOn
The Food Research Institute was established at Stanford University in 1921 jointly by the Carnegie Corporation of New York and the Trustees of Leland Stanford Junior University, for research in the production, distribution, and consumption of food.

FINANCIAL RESULTS OF SPECULATIVE HOLDING OF WHEAT
I. INTRODUCTION
The process of producing, marketing, converting, and placing in the hands of consumers, at the proper time, the vast wheat crops of the United States entails speculative holding of wheat on a large scale. The wheat harvest of the United States is virtually completed in August of each year. Part of the crop starts almost immediately its movement through the mill and thence, as flour, to the baker or to the householder, or its movement into export. Most of the crop, how-
deserving to be distinguished from the carrying of many other price risks. The speculator in futures is not forced to take the price risks assumed, as an incident to some other business, but presumably always takes them solely on account of expectation of direct gain from the risk-taking alone.
The dealer in wheat or flour who refrains from hedging takes avoidable price risks
quite as much as does the speculator in futures.
ever, must be held, to be milled or exported a month later, two months later, three months later, and so on around to the time of the next harvest. Until the beginning of the next August at least, eleven months later, some mills will be dependent for their supplies on wheat from the previous year's harvest. After an unusually large harvest
CONTENTS Carrying of unhedged but hedgable price risks on wheat or on flour is in the same class with the carrying of price risks on wheat futures. Either may be avoided by any one individual, even though someone must carryall the hedgable risks; either may logically be undertaken by any individual only for
PAGE
lntroduction .............. 405 Gains and Losses on the Vis-
ible Supply . . . . . . . . . . . .. 407 Gains and Losses on All
Commercial Stocks . ..... 413 Division of Gains and Losses
among Classes of Dealers and Traders ............ 417
Summary and Conclusions.. 429 Appendix Tables .......... 436
in the United States, especially if it be accompanied by large crops in other countries, it may appear wise to carryover large quantities of wheat from one crop year to the next. This holding of wheat for consumption or export in later months of the harvest year or for consumption or export in a succeeding harvest year requires, under a competitive price system, the taking of risks of price changes. Speculative holding of wheat on a large scale is essential. '
In a general sense, all price risks incurred in connection with the holding of wheat may be regarded as speculative risks. The existence of futures markets makes it possible for any individual, through hedging, !o avoid certain price risks, usually the maJor price risks, connected with the holding o~ Wheat. The hedger transfers this part of Ius price risk to a speculator in wheat fu~ures. The carrying of risks on price changes In futures is speculation in a special sense,
WHEAl' STUDIES, Vol. VII, No.8, July 1931
the sake of expected gain from the risk-taking itself, since the taking of such risks is not a necessary part of any other commercial enterprise.
Numerous questions have arisen in connection with the speculative holding of wheat. It has been alleged that the holding from fall to spring is commonly highly profitable and that the farmer who, owing to limited funds or owing to other factors, is forced to market his wheat shortly after harvest, is deprived of such profits. It has been alleged that wheat prices fluctuate unduly from year to year and that there exist large opportunities for profit through holding wheat from periods of large supplies for sale in subsequent years.
Wide utilization of hedging facilities has rendered the futures market an integral part of the wheat-marketing system in the United States and in some other countries. There has arisen the question. whence come the profits of speculators in futures and the
[ 405 ]

406 FINANCIAL RBSULTS OF SPBCULATIVE HOLDING OF WHEAT
funds for supporting the expensive system of futures markets, with their entourage of commission houses, private wire systems, and information services. It has been alleged that the whole system is parasitic on the producer or on the consumer, or on hoth. On the other hand, it has been claimed that the futures market is advantageous to both producer and consumer: that through hedging, price risks arc shifted to professional speculators who carry them for a smaller charge than would be exacted hy grain traders, millers, and flour dealers. It has even been alleged that, in consequence of futures trading and hedging, the farmers and consumers gain at the expense of futures traders.
Trustworthy information on the gains and losses actually experienced from speculative holding of wheat would go far toward providing an answer to all of these questions. Data now available are capahle, with proper analysis, of providing this information. The character of the information that may be ohtained and the method of development are determined largely by the data available.
DEFINITION OF SPECULATIVE GAIN AND Loss
As a preliminary to discussion and measurement of gains and losses on speculative holding of wheat it is important to have a precise definition of speculative gain and loss. The general idea is perfectly clear. SpeCUlation involves purchase and subsequent sale, or sale and subsequent purchase, in the hope of gain from a favorable difference between the purchase and the sale price. Speculative holding is holding in the hope of such anticipated speculative gain.
Purchase and sale for the sake of price differences is the essence of speculation, hut it is not a sufficient definition of speCUlation. Gains from purchase and subsequent sale may represent purely return for merchandising. The grain merchant stands as intermediary between farmer or country elevator and miller or exporter, or in other stages of the marketing process, performs a marketing service, and, unless he is operating on commission or as a broker, takes his reward for merchandising in the form of a difference between purchase and sale price. Similarly, gains from purchase and subse-
quent sale may arise from processing (cleaning, conditioning, and mixing), from transporting, or from storing.
Two ideas commonly involved in the concept of speculation are particularly helpful in drawing the distinction between speculative gains and losses and other gains and losses. One is the idea that speculative gain arises from the taking of risks of price change. The other, and more important, idea, is that speCUlative gains are derived from price changes anticipated by the specUlator, but not produced by actions which he takes. The idea that speculative gains and losses arise from price changes which the speculator has had no part in bringing about, or no substantial part, serves at once to distinguish, in theory, between pure speCUlative gains and gains arising from merchandising, processing, transporting, or storing. It provides also the basis for distinguishing between gains arising from speculation and gains arising from manipulation.
For the practical segregation of speculative gains and losses from such other items as may enter into the difference between purchase and sale price of wheat, two methods are available. One method is to deduct from the total difference all the items properly ascribable to other than speCUlative activities. From the total may be deducted, for example, an allowance for such merchandising, transporting, processing, and storing as has been done in conjunction with the speculative holding. It is difficult to apply this method in practice, and the accuracy of the results is always questionable because of the difficulty of ascertaining the proper amounts to be deducted.
The other available method of arriving at speculative gains and losses takes advantage of the fact that in the wheat trade of the United States, as in some other COUl1-tries, there has been developed a commercial practice of shifting speculative risks. Through the process of hedging in the f~ltures market, the grain merchant may aV?ld a major part or all of the speculative gams and losses that would otherwise affect, favorably or unf avorahly, the returns fro~n his business. Hedging involves a certaII1 small cost to the hedger in the form of commissions and minor incidental expenses or,

GAINS AND LOSSES ON THE VISIBLE SUPPLY 407
alternatively, in the form of maintaining a membership in the grain exchange and a trader to execute the hedging transactions. The speculator in futures who carries the hedge also incurs similar costs. If these costs be neglected and only gross gains and losses be considered, as they arise from price changes, the speculator carrying the hedge takes the whole speculative gain or loss avoided by the hedger.
Whether or not hedging serves to free the merchant of all speculative gain or loss depends upon the grade and quality of wheat he is handling and upon the market in which he is dealing. If the dealer is handling wheat of such grade and quality and in such location that he is free to deliver it without loss on the futures contract employed as a hedge, it is possible through hedging to obtain a complete transfer of all speculative risk. In the majority of cases hedging frees the merchant of most, but not
all, speculative gain or loss. In some cases hedging provides only very incomplete shifting of speculative risk. In the aggregate, for all wheat dealt in in the United States, properly selected hedges would result in shifting to speculators in futures the greater part of the speculative gains or losses on all wheat hedged. In consequence, the gains and losses shifted through hedging represent approximately the total speculative gains or losses on hedged wheat. Similarly, speculative gains or losses on unhedged wheat may be taken to be represented with substantial accuracy by the amounts of gain or loss that might have been shifted by hedging. For practical purposes, therefore, speculative gains or losses on the holding of wheat may be defined as the gains and losses shifted or capable of being shifted through hedging, or, more concisely, gains or losses on hedgable price risks involved in holding.
II. GAINS AND LOSSES ON THE VISIBLE SUPPLY
Gains and losses on hedgable price risks may be taken as the best available measure of gains and losses from speculative holding. Following this line, the calculation of the approximate totals of speculative gains and losses on the holding of the visible supply during past years becomes a relatively simple matter. It is necessary merely to calculate what gains and losses would have been transferred to the carriers of hedges had all the wheat in the visible supply been hedged at existing prices at the time it entered the visible supply, and the hedges removed at then existing prices when the wheat left the visible supply.
The meaning of the computation may be visualized more clearly by adopting, for the time being, the interpretation that holders of unhedged wheat in effect hedge their wheat and simultaneously purchase and carry the futures in which they hedge. Holders of unhedged wheat do in fact play such a dual role of merchant and speculator. On this interpretation, hedges are carried on all wheat stocks, either by a speculator to whom a future is sold or by the owner of the wheat.
The gains and losses on the carrying of
hedges depend to some extent on the particular market and delivery month in which the hedge is carried (either actually or hypothetically). For convenience in calculation it is necessary to adopt a somewhat arbitrary set of assumptions as to the futures in which the hedges are placed, as to the times at which transfers of hedges are made, prior to the expiration of a future, and as to the futures into which hedges are transferred. To the extent that the arbitrary assumptions diverge from the choices that were actually made by hedgers, or may reasonably be supposed to have been made, for the purpose of calculating speculative gains and losses of those who did not hedge, the divergence will tend to result in showing less advantage or possible advantage from hedging. The losses calculated to have been shifted or shiftable to the carriers of hedges will tend to be somewhat too small; the gains calculated to have been shifted or shiftable to the carriers of hedges will tend to be somewhat too large.
The particular assumptions made are (1) that all wheat entering the visible supply in any week was hedged, either actually or hypothetically, in the Chicago market and

408 FINANCIAL RESULTS OF SPECULATIVE HOLDING OF WHEAT
in the future of the nearest delivery month on which deliveries could not be made during the week in question; and (2) that hedges on all wheat remaining in the visible supply at the end of a week immediately preceding the beginning of a delivery month had been transferred to the next delivery month at a uniform rate during that and the preceding three weeks.
The visible supply figures to be used in the present connection are United States stocks as reported weekly by the- Secretary of the Chicago Board of Trade. During many years the reports of the Secretary of the Chicago Board of Trade included statements of quantities of wheat at certain Canadian points, but the data here used include only quantities reported for United States points. The movement of wheat into and out of the visible supply is recorded in these figures only in terms of weekly net movement. The assumption is made that a net movement into the visible supply during a week was hedged (either actually or hypothetically) at the average price for the week of the particular future in which the hedges are assumed to have been placed;
that a net movement out of the visible supply was accompanied by removal of hedges in the same amount at the average price for the week. The fact that the recorded movements are net movements in or out makes no difference, of course, in the results: the results would be identical whether figured in terms of net movement in or out, or iii terms of the total movement in and the smaller or larger total movement out during each week. The assumption that the price at which the hedges were placed or taken off was the average price for the week is equivalent to the assumption that the weighted average price at which hedges would have been placed or taken off was identical with the simple average price for the week. In individual weeks this assumption may involve appreciable error, but the errors appear as likely to be in one direction as in the other and their effect on the results for a year must be negligible.
DETAILS FOR 1924-25
The necessary computations for one crop year, 1924-1925, are shown in Table 1. The
TABLE 1.-COMPUTATION OF FINANCIAL RESULTS ON CARRYING OF ACTUAL AND HYPOTHETICAL HEDGES AGAINST WHEAT IN 'rHE UNITED STATES VISIBLE SUPPLY IN 1924-25* (QU11nlilies in thousand bushels or thousand dollars; prices ill dollars per busIwl)
Lin" Visible Change in Prle<> Invest- HoturnB O'umulntlve Number Dnte BUPI>ly visible (or spread) mllnt realized Investment --- - -----
OV .June 28 .................. 34,901 ..... 1.157 40,380 ..... 40,380
1 .July 5 .................. 34,519 - 382 1.167 ..... 446 ...... 2 12 .................. 34,338 - 181 1.149 ..... 208 ...... 3 19 .................. 34,175 - 163 1.246 ..... 203 ...... 4 26 .................. 3G,436 + 2,2G1 1.286 2,908 ..... ......
Al ......................... ...... + 1,535 . .... 2,051 . .... 42,481
I} Aug. 2 .................. 41,734 + 5,298 1.324 7,015 ..... ...... (j 9 .................. 49,4GO + 7,726 1.295 10,005 ..... ., .... 7 16 ................ ,. 58.,106 + 8,M6 1.290 11.153 .... . ...... 8 23 .................. G5.7G6 + 7,GGO 1.278 9,789 . , ... ...... 9 30 .................. 69.119 + 3,353 1.227 4,114 ..... ......
A2 ......................... ...... +32,683 ..... 42,07G . .... 84,507 Bl ......................... 69,119 ..... + .0442 3,055 . ... , 87,562
10 Sept. 6 .................. 73,278 + 4,159 1.284 5,340 ..... ...... 11 13 .................. 76,939 + 3,GBI 1.300 4,759 ..... ...... 12 20 .................. 80>,819 + 8,880 1.330 5,IGO ..... ...... 1 ,> . ,) 27 .................. 81,559 + 740 1.35G 1,003 ..... ......
A3 ......................... ...... +12,440 . .... 16,262 . .... 103,824
•. Dutu on visible supply und prices complied from Chicago iJaily Trade Bulletill. For detailed explanation of tuble see accompunylng text.

TARLE l-{COntillued) (Qlwnlilie.~ ilt thousand bushels or thousand dollars; prices ill doll(lrs per bu"hei)
J,lno Visible
I Ohangoln I Price Inve~b- R"turnF<
I Oumulatlvo
Number nate 8UppLy visible (or sprend)_ ment reall",.! Investment -- - - . I 14 Oct. 4 .................. 81,897 + 338 1.436 48.5 ..... . .....
15 11 .................. 8:],571 + 1.674 1.485 2,486 ..... . ..... 16 18 ............... " . 85,358 + 1,787 1.492 2, (}6(-; ..... . ..... 17 25 .................. 87,767
I + 2,409 1.450 3,4!J3 ..... . .....
A4 ......................... ...... + 6,208 ..... 9,130 . .... 1l2,fJ54
Nov. 1 .................. 89,902 !
+ 2,135 1.425 3,042 18 I ..... . .....
I!) 8 .................. 94,707 I + 4,805 1.45.5 6,991 ..... . ..... 20 15 ................... 98,160 I + 3,453 1.533 5,2!J3 '0 ••• . ..... 21 22 ... , .............. 96,926 I - 1.234 1.519 ••• 0. 1,874 . ..... 22 29 .................. 100,3G3 I + 3,437 1.543 5,30il ..... . .....
I I
A5 ......................... I +12,596 ..... 18,7.55 ..... 131,709 ...... I B2 ......................... 100,363 ..... + .0705 7,076 . .... 138,785
23 Dec. 6 .................. 99,461 - 902 1.609 ..... 1,451 ...... '24 13 .................. 98,079 - 1,382 1.659 ..... 2,293 . ..... 25 20 ..... '" .......... 96,823 - 1,2.56 1.719 ..... 2,159 . ..... 26 27 ..... '" .......... 94,491 - 2,332 1.764 ..... 4,114 . ..... A6 ......................... . ..... - 5,872 ..... . .... 10,017 128,768
27 Jan. 3 ............... '" 91,492 - 2,999 1.777 ..... 5,329 ...... 28 10 .................. 86,833 - 4,659 1.778 eo, ., 8,284 ...... 2S 17 .................. 83,Hil - 3,672 1.852 ..... 6,801 ...... 30 24 .................. 80,572 - 2,589 1.915 ..... 4,958 ...... 31 31 .................. 77,510 - 3,062 2.010 ..... 6,155 ...... A7 ......................... ...... -16,981 ..... . .... 31,527 !)7,241
32 Feb. 7 .................. 75,709 - 1,801 1.949 .....
I 3,510 . .....
33 14 .................. 75,768 + 59 1.852 109 ..... . ..... 34 21 .................. 72,592 - 3,176 1.848 ..... 5,869 . ..... 35 28 .................. 70,677 - 1,915 1.952 ..... ! 3,686 ...... AS ......................... . ..... - 6,833 ..... . .... 12,956 84,285
36 Mar. 7 .................. 69,605 - 1,072 i.918 ..... 2,056 . ..... 37 14 .................. 66,083 - 3,522 1.791 ..... 6,308 . ..... 38 21 .................. 62,076 - 4,007 1.636 ..... 6,555 . ..... 39 28 .............. '" . 60,007 - 2,069 1.646 ..... 3,406 . ..... A9 ......................... ...... -10,670 ..... . .... 18,325 65,960
40 Apr. 4 .................. 57,434 - 2,573 1.450 ..... 3,731 . ..... 41 11 .................. 55,244 - 2,190 1.514 ..... 3,316 . ..... 42 18 .................. 53,203 - 2,041 1.530 ..... 3,123 . ..... 43 25 .................. 49,089 - 4,114 1.508 ..... 6,204 . ..... AlO ......................... ...... -10,918 . .... . .... 16,374 49,586 B3 ......................... 49,089 ..... - .1120 . .... 5,498 44,088
44 May 2 .................. 45,681 - 3,408 1.422 ..... 4,846 . ..... 45 9 .................. 43,464 - 2,217 1.529 ..... 3,390 ...... 46 16 ........ '" ....... 4(},604 - 2,860 1.508 ..... 4,313 . ..... 47 23 .................. 37,173 - 3,431 1.541 ..... 5,287 . ..... 48 30 .................. 34,968 - 2,205 1.624 ..... 3,581 . ..... All ......................... ...... -14,121 . .... . .... 21.417 22,671
49 June 6 .................. 34,514 - 454 1.646 ..... 747 ...... 50 13 .................. 32,931 - 1,583 1.G37 ..... 2,591 ...... 51 20 .................. 31, 144 - 1,787 1.544 ..... 2,759 . ..... 52 27 ........... '" .... 29,146 - 1,998 1.532 ..... 3,061 . ..... A12 ......................... ...... - 5,822 ..... . .... 9,158 13,513 B4 ......................... 29,146 ..... - .0250 ..... 729 12,784
OV June 27 .................. 29,146 ..... 1.462 42,611 ..... . ..... -[4091

410 FINANCIAL RESULTS OF SPECULATIVE llOLDING OF WIlE/iT
first line, OV, has to do with the market value of the futures supposed to have been held as hedges against the wheat in the visihle supply at the beginning of the crop year. On the last Saturday of June 1924, there were 34,U01,000 bushels of wheat reported in the visihle supply. The Chicago Septemher future closed on that day at )fl1.157 (cents and fractions are expressed as decimals of a dollar for convenience in computation, and prices expressed in even tenths of a cent are regarded as sufliciently accurate). Assuming all the wheat in the visible supply to have been hedged, either actually or hypothetically, in the Chicago September future, the futures supposed to have been held as hedges against the visible supply on the last Saturday of June had a market value, as of the close on that day, of )fl40,380,000. This is the initial figure in the final column. The numbered lines following have to do with the results of actual and hypothetical purchase and sale of futures in connection with the actual and supposed placing and removal of hedges on wheat entering and leaving the visible supply in successive weeks. The first numbered line shows a visible supply on the first Saturday of July amounting to 34,519,000 bushels, representing a decrease of 382,000 bushels during the week. For the purposes of the calculation it is supposed that the hedges on this quantity of wheat were removed, or, what amounts to the same thing, that hedges removed exceeded new hedges placed, by this amount, and that in consequence holders of futures representing hedges on the visible supply sold, net, futures representing 382,000 bushels. At the average price of the September future during the week, $1.167, the sales would have netted $446,000 to the holders of the futures. The next two weeks show similar, though smaller, reductions in the visible supply and corresponding realization by carriers of hedges. The last week ending in July shows an increase of 2,261,000 bushels in the visible supply, implying the placing of that amount of additional hedges. At the average price of $1.286, carriers of the hedges increased their investment by $2,908,000. The following line, designated as A1, shows the total change in the visible supply during the four weeks ending in July; the net increase in investment by
carriers of hedges during those weeks, $2,051,000; and, in the final column, the cumulative investment to date, represented hy the $40,:380,000 market value of hedges carried at the beginning of the crop year, plus the $2,051,000 net additional investment.
Lines 5 to 9 in Table 1 show the results of actual and hypothetical purchase and sale of futures in connection with changes in the visible supply during the five weeks ending in August. During each of these weeks the visible supply increased and there was a net addition to the hypothetical holdings of September futures representing hedges on the visible supply. The increase in investment implied was $42,076,000 for the five weeks, hringing the total investment in futures standing against the visible supply to $84,507,000.
The next line, B1, deals with the transfer of hedges from the September to the Decemher future. It is supposed that by the close on the last Saturday of August, hedges on the 69,119,000 bushels then in the visible supply would have been transferred to the December future. The transfer would have involved, on the part of hedgers, the repurchase of September futures and the sale of an equal amount of December futures, and on the part of the carriers of the hedges, the sale of September futures and the purchase of an equal amount of December futures. The December future, purchased by carriers of hedges, was at all times at a premium of more than four cents above the September future, which was being sold. The transfer therefore involved an increase in the investment of carriers of hedges. The transfer being supposed to have occurred uniformly during the last four weeks ending in August, the additional investment per bushel by carriers of hedges was the average difference between the price of the September and the price of the December future during these four weeks, or 4.42 cents. On 69,119,000 bushels, an additional investment of $3,055,000 is implied, bringing the cumulative investment to $87,562,000.
At this point some explanation should he given of the assumption that transfer of hedges from the September to the December future begins early in August and is completed by the last Saturday in August,

GAINS AND LOSSES ON TIlE VISUnE SUPPLY 411
while it is assumed that hedges would continue to be placed in the September future throughout the last week of August. The normal actual course of events is for hedges to be placed less in the September future and more in the December future as the month of August advances, and for the transfer of hedges to start slowly and proceed more rapidly as the month advances. The assumed procedure results in the same calculated investment by holders of hedges as might result from the actual procedure and gets at this result more directly, so far as concerns the process of computation. The assumed procedure, if carried out in practice, would result in more buying and selling of futures, with correspondingly increased costs for commissions, but since no account is being taken of commissions at this stage in the investigation, this objection to the assumption does not hold.
The calculation is continued in this manner week by week. The investment of actual and hypothetical carriers of hedges on the visible supply is found to increase in every subsequent week but one up to and including the last week of November. At the end of that week, after allowing for the transfer of hedges to the May future, the total calculated investment has mounted to *138,785,000. In succeeding weeks there occurs a decline in the visible supply that is continuous from December to the end of .June except for one week of slight increase. Each decrease in the visible supply is accompanied, actually or hypothetically, by removal of hedges and by net sales of futures by carriers of the hedges. By the last Saturday of June, after transfer of all hedges to the September future, the calculated investment of carriers of hedges is reduced to $12,784,000. Regarding the transfers of hedges in April and June, it is to be noted that, unlike the transfers in August and November, the shift is from a higher priced to a lower priced future. The calCUlated investment in hedges is accordingly decreased by these transfers.
The last line of Table 1 shows the computation of the market value of the futures Hupposedly held as hedges on wheat rel~laining in the visible supply on the last Saturday of June 1925, based on the price at the close on that day: 29,146,000 bushels
at $1.462 a bushel are valued at $42,fill,000. This closing valuation for 1!l21-2fi provides also the opening valuation for HJ25-2f>. Crop years are taken to begin and end always on the last Saturday of June.
FINAL RESULTS
The financial results for 1921-25 may now be summarized in terms of gain or loss to the actual and hypothetical carriers of hedges. Starting with a net investment of $40,380,000, subsequent purchases and sales during the crop year reduced the investment by $27,596,000 to a total of $12,784,000 at the end of the crop year. Tbe actual and hypothetical buying and selling, therefore, indicates gross cash gains of $27,596,000. In addition the supposed holdings of futures at the end of the crop year, though 5,755,000 bushels smaller than at the beginning, had a market value $2,231,000 greater. One has the choice of taking as the gains of actual and hypothetical holders of hedges the $27,5%,000 supposedly realized on purchases and sales, and of neglecting changes in size and market value of holdings, or combining supposed realized gains and market-value gain to show a total of $29,822,000 gain. Difference between the two calculations of gains (or losses) will be great in some individual years, but negligible, as a rule, in averages over considerable periods of years. For the purpose of determining the general tendency to gain or loss on speculative holding, it matters little which is chosen; for such interest as may attach to an examination of calculated gains and losses in individual years, the comhined realized and market-value gains and losses are to be preferred.
Table 2 (p. 412) shows for each crop year, 188"1-85 to 1915-16 and 1921-22 to 1D29-:30, the following figures, in successive columns: (1) the market value of hedges actually or hypothetically carried against the United States visible supply as of the close on the last Saturday of June, with which the crop year begins for the purposes of these calculations; (2) the investment as of the end of the year, obtained by adding to the initial market value the additional investments supposed to have been made during

412 FINANCIAL RESULTS OF SPBCULATIVB HOLDING OF WHBAT
TABLE 2.-SPECULATIVE GAINS AND LOSSES ON THE HOLDING OF THE VISIBLE SUPPLY, BY ellOp YEAIlS
1884-85 TO 1915-16 AND 1921-22 TO 1929-30
\ Thousand dollars)
Market vuluo of Aecumuluwd Roulimd 'J'otal
<Jiro'P year SIII'lfOSOO 11Ive"~m"nt gain (+) sIJCculatlve July-.Juno hedges. first at ond of or loss (-) gain (+)
of yeur your or loss (-0) -~-~. -~---
1884-85 ... 13.313 40,066 -26,753 - 2,825 1885-86 ... 37,241 37.fi64 - 423 - 16,025 1886-87 ... 21.638 3:3,912 -12.274 - 5,654 1887-88 ... 28.258 20,522 + 7,735 - 1,999 1888-89· ... 18,523 12.229 + 6,294 - 5!J8 1889-90 ... 11,631 16,548 - 4,917 + 855
1890-91 ... 17,403 12,151 + 5,252 - 834 18iJHJ2 ... 11,317 27,339 -16,022 - 8,665 1892-93 ... 18.674 54,872 -36,198 - 11,660 1893--94 ... 43,212 51.165 - 7,953 - 18,847 1894-95 ... 32.318 30,779 + 1,539 + 1,452
1895--96 ... 32,231 36,914 - 4,683 - 10,482 1896--97 ... 26,432 7,488 +18,944 + 4,646 1897-98 ... 12,134 1,829 +10,305 + 9,496 1898-99 ... 11,325 18,919 - 7,594 + 2,288 1899-1900. 21,207 37,810 -1(),603 - 1,108
1900-01 '" 36,702 29,002 + 7,700 - 9,490 1901--02 ... 19,512 14,022 + 5,490 - 806 1902-03 ... 13,216 8,559 + 4,657 + 3,141 1903-04 ... 11,700 4,897 + 6,803 + 4,859 1904-05 ... 9,756 6,630 + 3,126 + 3,294
1905-06 ... 9,924 21,332 -11,408 - 2,595 1!J06-07 ... 18,737 33,672 -14,935 + 2,797 1907-08 ... 36,469 1.5,580 +20,889 - 5,389 1908-09 ... 10,191 1,340 + 8,851 + 11,209 1909-10 ... 12,549 11,610 + 939 + 1,360
1910-11 ... 12,970 28,364 -15,394 - 6,643 1911-12 ... 21,721 17,668 + 4,053 + 7,106 1912-13 ... 24,774 32,868 - 8,094 - 5,540 1913-14 ... 27,328 15,821 +11,507 - 4,084 1914-15 ... 11,737 -20,681 +32,418 + 31,069
1915-16 ... 10,388 45,077 -34,689 - 831 1916-17 ... 44,245 ...... I •••••• • .........
1921-22 ... 12,635 26,788 -14,153 - 1,552 1922-23 ... 25,236 26,172 - 936 + 1,088 1923-24 ... 27,260 40,852 -13,592 - 472 1924-25 ... 40,380 12,784 +27,595 + 2!J,827
1925-26 ... 42,611 6,180 +36,431 + 8,329 1926-27 ... 14,509 31,799 -17,290 - 2,435 1!J27-28 ... 29,363 58,636 -29,273 - 3,774 1928-29 •.. 54,862 141, 722 -86,860 - 29,917 1929-30 .... 111,805 203,743 -91,938 -102,395
1930-31 ... 101,348 ...... . ....... .........
the year and subtracting amounts supposed to have been realized on sales; (3) the supposedly realized gains or losses (the latter preceded by a minus sign) on purchases
and sales alone-neglecting market value of amounts held at the beginning and the end of each year; and (4) the total apparent gains or losses on the carrying of the hedges against the visible supply during the year, including both gains and losses realized through supposed purchases and sales, and gains and losses on the difference in market value of the supposed holdings of futures at the beginning and at the end of the crop year. The data for each year are based on a calculation like that discussed in detail for 1924-25.
The total speculative gains and losses shown in Table 2 are represented graphically by the solid line in Chart 9, page 4i~O. In the accompanying text they are commented on in some detail and their significance discussed.
In the foregoing discussion, repeated reference has been made to the hypothetical character of the computations. It should now be noted again, as was observed in the preliminary discussion, that the results are hypothetical only' when viewed as gains and losses on actual futures bought, carried, and sold in the process of carrying hedges on the visible supply. Viewed as totals of speculative gains and losses taken on the holding of wheat in the visible supply, whether taken by carriers of hedges or by owners of wheat carried unhedged, they are by no means hypothetical. The figures may not be supposed precisely accurate, for it is impossible to obtain a precise segregation of speCUlative gains and losses from other gains and losses incurred in the handling of wheat. Within the limits of accuracy practically obtainable in such a segregation, these figures may be taken as an approximately exact statement of actual speculative gains and losses taken on the holding of the United States visible supply of wheat. For reasons discussed above (p. 407), minor improvements in accuracy which might be theoretically possible would tend to show slightly larger total losses and slightly smaller total gains on speCUlative holding than are here indicated, but such possible differences may generally be neglected.
No attempt is made here to determine what part of the total speculative gains and losses on the holding of the visible

GAINS AND LOSSES ON ALL COMMRRCIAL STOCKS 413
supply was actually taken by carriers of hedges and what part by owners of the wheat who held it un hedged, nor what part of the gains and losses taken by owners holding wheat unhedged was offset hy losses and gains on forward sales of other wheat, not owned, on forward sales of flour, or otherwise. In the final section
of this fitudy, however, conclusions are reached bearing on total speculative gains and losses of carriers of actual hedges, whether on the visible supply or on other wheat or flour, total gains and losses of all futures traders, and total speculative gains and losses of other groups of traders carrying speCUlative risks on wheat.
III. GAINS AND LOSSES ON ALL COMMERCIAL STOCKS
Tbe method developed in the last section is capable of application to the calculation of speculative gains and losses on any commercial stocks of wheat in the United States, if only the levels of stocks at the heginning and at the end of each year are known and sufIiciently detailed data are available on the increases and decreases during the course of the year. A trustworthy computation of total speculative gains and losses on the holding of all commercial stocks of wheat in the United States would he highly illuminating. The chief prohlem to be dealt with in undertaking such a computation is the assembling of the requisite data on such stocks and their changes during the course of each year. The data which are finally put together and used are not all that might be desired, but the indications are that the results are sufficiently accurate to he highly useful.
SPECULATIVE GAINS AND LOSSES OF FARMERS
Some desire may be felt for a computation of speculative gains and losses on the holding of wheat by farmers. On the theory that speculative gains or losses on the holding of wheat are taken by farmers in the same sense that they are taken by dealers or by the traders in futures to whom they are shifted by hedging, the amounts of such speculative gains and losses might be calculated with an acceptable approach to accuracy. Farmers take many risks, including price risks, but their risks are of a different character from the price risks of ~ trader. A policy of hedging by selling futures as soon as the crop was harvested and buying back the futures as the wheat Was sold would not substantially change the character of the farmer's price risks. If the farmer could know in advance the
amount of wheat to be harvested, his speculative risk would at least be reduced by selling futures at the time he committed himself to raising the crop. For some farmers in some regions this would be at the time of planting, but in the chief wheatgrowing regions the farmer commits himself to the raising of a succession of wheat crops, of unknown size, at the time he undertakes farming in that region. In short the speCUlative risk of the farmer is not on a par with the speculative risk of the dealer or trader and no comparahle calculation of gains and losses on speculative holding is possible.
CHA:'\1GES 1:'\1 TOTAL COMMERCIAL STOCKS
In previous numbers of WHEAT STUDIES we have presented estimates of total stocks of wheat in the United States on the first of July for each year since 1896.1 Subtraction of farm stocks from these totals yields estimates of total commercial stocks as of the first of JUly. For a calculation of speculative gains and losses on the holding of total commercial stocks there is necessary also data on the course of these stocks throughout each year. Such data by months may be built up from statistics on farm marketing of wheat, giving the monthly flow of wheat into commercial stocks, and from statistics and estimates of the flow of wheat out of commercial stocks.
The United States Department of Agriculture has published for each month from
1 The best estimates for pre-war years are those published in WHEAT STUDIES, February 1928, IV, No.4, "The Disposition of American Wheat since 1896," p. 180. For post-war years these estimates have been revised and continued upon the fuller' statistical basis available for those years in recent Reviews of tlle Crop Year, most fully in \VHEAT STUDIES, December 1!J30, VII, No.2, p. 183.
414 FINANCIAL RESULTS OF SPECULATIVE HOLDlNG OF WHEAT
July 1907 to June 1930, estimates of the percentage of total United States farm marketings which occurred in that month. The monthly marketing in bushels may be obtained by applying these percentages to the total farm marketings for the year. Total farm marketings for the year may be arrived at by adding together wheat milled and net exports of wheat and flour and adding further any increase in commercial stocks between the beginning and the end of the year, or deducting any decrease of commercial stocks. This calculation of total farm marketings will omit such small amounts of wheat as may have been marketed by farmers and used by other farmers for seed, used off the farm for feed, or devoted to other special uses. The amounts are in any case very small, no detailed account could be taken of their subsequent movement out of stocks, and they are better left out of the accounting entirely. The calculation omits also, of course, Canadian wheat in transit through the United States or stored in bond-that is, wheat not recorded in the import or export statistics-but includes such wheat on withdrawal for milling in bond.
The monthly movement of wheat out of stocks (making the same minor omissions as in the case of the movement into stocks) consists of net wheat and flour exports and shipments of wheat and flour to possessions,1 and domestic utilization for food. For the first two we have ofllcial statistics. Domestic utilization may be closely estimated at a daily rate of 1/365 of the annual domestic consumption-that is, for 30-day months, at 8.21 per cent of the annual consumption; for 31-day months, at 8.50 per cent of the annual consumption; and for 28-day months, at 7.66 per cent of the annual consumption. These estimates of course approximate the wheat equivalent of the monthly consumption of flour and not the monthly milling of wheat. In consequence, this calculation counts wheat as removed from stocks only when the flour milled from it disappears from stocks; it results
1 Imports might be included with farm marketings to measure movements into stocks, and gross rather than net exports included in movement out of stoc\{s. The same results are reached more conveniently by the method here described.
in including with wheat stocks the wheat equivalent of all flour stocks above the low year-end flour stocks. This is appropriate inasmuch as substantially the same speculative risks are taken on the holding of flour as on the holding of its wheat equivalent.
The calculation of total stocks of wheal (including the wheat equivalent of flour stocks in excess of the low year-end stocks) in the United States at the beginning of each month during 1907-08 is shown for illustration in Table 3. Total commercial stocks on July 1 were estimated at V36,700,000 bushels. Total farm marketings during the year were estimated at £)45,600,000 bushels. The percentages marketed each month, as estimated by the United States Department of Agriculture, are shown in the third column. These percentages, applied to the total, yield the figures for the next column. Monthly exports and shipments to possessions are compiled from the reports of the Bureau of Foreign and .Domestic Commerce. Domestic consumption for the year, estimated at 452,200,000 bushels, is divided among the months in proportion to the number of days in each month.
The first item for the last column is then obtained by adding farm marketings during July to stocks as of the first of July and deducting exports and shipments to possessions and domestic consumption. The stocks as of the end of July, thus calculated, give stocks as of the first of August. This process is repeated for each line in the table.
The detailed calculations are not shown for other years, but the results are shown in Appendix Table III. The estimated monthly farm marketings, not readily available elsewhere, are reproduced in Appendix Table II.
SPECULATIVE GAI:-<S AND LOSSES
The computation of approximate 'speculative gains and losses on the holding of total stocks of wheat in commercial hands is now a matter of simple arithmetic. The results are shown in Table 4, which parallels in form Table 2, p. 412. The computation follows precisely the same lines as the

GAINS AND LOSSES ON ALL COMMERCIAL STOCKS 41!)
'fABLE 3.-CALCULA'fION OF ApPROXIMATE TOTAL COMMERCIAL WI-IEAT AND FLOUn STOCKS MONTHLY, JULY 1, 1907, TO .JULY 1, 1908* (Million bu.,/w/s and percen/ages)
-Fllrm roarketlnl,'1! Net expo,rt.,
----------------- and Hto"ks, Hllfprn(;Iltg to nom(~fl.ti(> Hto('kR,
Month flr><t of (p"r- (million p08~"ieHAionH, commmptlon (~lId of mouth cclltugl;) buslu:L,) WhNlt aIJd IlIon ill
flour ,-------,,-------
.July .................... 136.7 9.0 49.1 G.9 31).4 ]40.5 Aug . ................... . 140.5 14.0 76·4 10.8 38.4 1G7.7 Sept. ................... ](i7.7 16.0 87.3 15.5 :37 .1 202.4 Oct. .................... 202.4 14.0 7G.4 20.0 31).4 :nO.4 Nov . ................... . 220.4 8.0 43.6 21.2 37.1 205· 7 Dec . ................... . 205.7 8.0 4::}.G 23.8 38.4 187·1 Jan . ................... . 187.1 7.0 38.2 19.2 ::l1).4 167.7 Feb . ................... . 167.7 4.1 22.4 13.4 34.6 142.1 Mar . ................... . 142.1 6.0 32.7 9.3 38.4 127.1 Apr . ................... . 127.1 4.1 22.4 8.7 37.1 103.7 May .................... 103.7 4.9 26.7 9.5 38.4 82.5 June .................... 82.5 4.9 2G.7 9.5 37.1 62·3
Total ................ . .... I 100.0 I 545.6 167.8 I 452.2 I . .... • Sources of data and methods of computation as described in the accompanying text; as there indicated only certain
minor elements of commercial stocks are omitted.
previous calculation of gains and losses on the holding of the visible supply, except that the increases and decreases in investment of actual and hypothetical carriers of hedges have to be calculated by months rather than by weeks. It is assumed that the weighted average price at which the hedges are placed and removed is the simple average price of the four or five calendar weeks lying entirely or chiefly within each calendar month. Market values of futures supposedly held as hedges against the total commercial stocks at the beginning and at the end of each year are calculated, as in the case of the visible supply, on the basis of closing prices on the last Saturday in June. It will be seen therefore that the price data employed are precisely the same as those used in the calculation of gains and losses on the visible supply. Differences in the results, therefore, rest entirely on differences in volume of the stocks and differences in their movement during the course of each year. ~or the purpose of comparison of specu
latIve gains and losses on the holding of all c.<ll1l1nercial stocks of wheat with speculah.v~ gains and losses on the holding of the VISible supply, it is desirable to have the figures reduced to cents per bushel per
TABLE 4.-SPECULATIVE GAINS AND LOSSES ON THE HOLDING OF ALL COMMERCIAL STOCKS OF "VI-IEAT IN THE UNITED STATES, BY CROP YEARS 1907-08 TO 1915-16 AND 1921-22 TO 1929-30
(Thousand dollars)
Market value of Accumu[a~d Realized Total
Crop year supposPil investment gain (+) Spe<'ulBtlve July-June hedges, first at end of or loss (-) gain (+)
of year year or l00S (-) -----
1907-08 ... 132,052 80,924 + 51.128 - 27,533 1908-09 ... 53,391 6,971 + 46,420 + 43,537 1909-10 ... 50,508 59,963 - 9,4,55 + 11,792
1910-11 ... 71.755 113,05:3 - 41,298 - 31.630 1911-12 ... 81,423 6,),428 + 15,995 + 20,195 1912-13 ... 85,623 111,078 - 25,455 - 25,008 1913-14 ... 86,070 75,771 + 10,299 - 15,284 1914-15 ... 60,487 -77,282" +137,769 +118,755
1915-16 ... 41.473 151,440 -109,967 + 5,845 1916-17 ... 157,285 ...... ....... . ...... 1921-22 ... 84,5Z9 96,981 - 12,452 + 55 1922-23 ... 97,036 113,027 - 15,991 + 7,253 1923-24 ... 120.,280 137,252 - 16,972 - 4,197 1924-25 ... 133,055 32,597 +100,458 + 95,47-1
1925-26 ... 128,071 59,924 + 68,147 + 43,ID2 1926-27 ... 103,116 128,068 - 2-1,952 - 8,978 1927-28 ... 119,090 163,513 - 44,423 - 16,763 1928-29 ... 146,750 323,431 -176,681 - 80,422 1929-30' ... 243,009 441,526 -198,517 -226,333
1930-31 ... 215,193 ...... ....... . ...... a A negative "investIncllt" Lccausc suppused. sales
amounted to more thnn the valuation of supposed hedges at the beginning of the y,'ar plus the amount of supposed purchnses.

416 FINANCIAL RESULTS OF SPECULATIVE HOLDING OF WllEAT
month. Part of the stocks both in the visihle supply and in the total of commercial stocks was carried for short periods, part for long periods. For the purpose of reducing the figures to a comparable basis, one may assume that the same amount of holding is involved in carrying 20,000,000 bushels of wheat for 5 months as in carrying 10,000,000 bushels of wheat for 10 months, and that both may he described quantitatively as equivalent to the carrying of 100,000,000 bushels for one month. In the following tabulation, the second and third columns express in this way, in million hushels, the sums of the products of the <luantities of wheat carried in each year, multiplied by the number of months and fractions of months that each quantity was carried, for both the visible supply and the total commercial stocks; the fourth and flfth columns show the speculative gain or loss on the carrying of these quantities, expressed in terms of cents per bushel of wheat carried one month; the last column shows the differences between figures in the two previous columns:
I MJlII(}n bUHI",]" Gain or I.ORH per bUHlw]
_j~::":~J VO"""~I~'J'O_t_uI_I __ V_IH_II)]_(\ -':'ot,,~I_])_~~_,~~~ 1U07-08....... 412.G ,1,846.4 -1.:31 -lAf! +0.18 1!J08-0!J ....... 37!J.1IL447.s +2.UG +:3.01 -O.OS 1UOfJ=lO....... ~5S.7 1,489.8 +0.5:3 +0.7!J -0.2G 1U10 11 ....... ,)84.4 1,782.9 -1. 7:} -1.77 +0.04 Hl1H2....... 622.3 1,fm.2 +1.14 +1.02 +0.12 1!J12-]:l....... 5:H.3 2,OlG.7 -1.04 -1.24 +0.2(} Ifm-14 ...... . 578.5 LU88.S -0.71 -0.77 +(}.(JG 1fJl4-15....... 5aO.:3 2,lS0.1 +5.8G +5.52 +().:34 1915-1(;....... 4G5.7 2,IG1.2 -0.18 +0.27 -0.45
fl'-year avo .... 4G2.2 1,873.4 +0.G8 +O.W -0.08
1!J21-22....... 4GO.4 2,068.0 -0.a4 0.00 -(U4 1!J22-2:J....... 4:30.1
1
2,21;3.3. -0.25 +O.g2 -(J.(J7 1!J2:3-24....... G82.G 2,444.3 -(J.07 -0.17 +0.10 1!J24-25....... 7!J7.1 2,5G2.S +8.74 +3.7:3 +0.01 lU25-2G....... 4:31.1 2,1!J6.!J +um +1.f!7 -0.04 1fJ2f}-27 ....... filS.8 2,311.9 -0.40 -(U!J -O.tH IfJ27-28....... 802.8 2,432.1 -0.47 -O.G!J +0.22 I!J28-2fJ ....... 1,:)0(;.5 3,342.3 -2.2D -2.41 +0.12 IH2D-3U ....... 1,875.1 4,246.0 -5.4() -5.38 -0.13
D-yearav. .... 882.4 2,G51.!J -1.37 -0.80 +0.57
IS-year avo ... G42.8 2,262.G -O.G3 -0.22 +0.41
When reduced to comparable terms, as in the tabulation above, speculative gains and losses on the carrying of total commer-
cial stocks closely parallel speculative gains and losses on the carrying of the visihle supply. In ten of the eighteen years for which the comparison is available, speculative gains or losses exceeded one cent per bushel per month and in two years exceeded five cents per bushel per month. In no case did the results as calculated for all commercial stocks differ from the results as calculated for the visible supply hy as much as half a cent per bushel per month. Interestingly enough, the averages for the nine post-war years show a greater difference (0.57 cent) than appears in any individual year, and the eighteen-year averages show a difference of slightly over fourtenths of a cent. Both these large differences result from the fact that the averages, being weighted, are largely affected by the losses on the extraordinarily large amounts of holding in 1928-29 and in 1929-30, and the further fact that in both these years an uncommonly large proportion of the wheat held was in the visible supply.
The largest difference between the financial results of speCUlative holding of all commercial stocks and speculative holding of the visible supply occurred in 1915-l(j. This was largely a consequence of the fact that in that year the visible supply was huilt up much later than other commercial stocks and at a time when prices were higher. The actual and hypothetical investment of holders of hedges on the visihle supply as of the first of January was ~1.0!) per bushel, while the actual and hypothetical investment of holders of hedges on all commercial stocks was only ~1.04 per bushel. Subsequent opportunities for realization on hedges actually or hypothetically held were somewhat beller for those supposedly held against the visible supply (the decreases occurring, on the whole, when prices were higher) than for those supposedly held against other commercial stocks, but the disadvantage of the higher average price during the period of accUmulation was only partly overcome. During the previous year, in which the results of the two computations differed by slightly over one-third of a cent, the weighted average price at which hedges against the visible supply were or would have heen accumulated was also higher than the cor-

DIVISION OF GAINS AND LOSSES 417
responding average for all commercial stocks ()j;1. 00 as compared with )j;. 97) hut a larger proportion of the maximum visible supply was worked off during the months of highest prices, January to May, so that the gain on the holding of the visihle supply was larger per bushel per month held than the gain on commercial stocks in the aggregate.
Despite some differences, it is notable that the speculative gains and losses on the holding of the total commercial stocks show about the same relative fluctuations from year to year as the speculative gains and losses from the holding of the visible supply. The data are shown graphically in Chart 9, page 430. The similarity of the two curves over the period for which both sets of data are available provides a basis for the view, discussed subsequently in Section V, that gains and losses on the holding
of the visible supply are reasonably representative of speculative gains and losses on the holding of all commercial stocks. At the present stage the similarity is particularly interesting as evidence that the necessity of using monthly rather than weekly data on changes in total commercial stocks has not seriously affected the accuracy of the computed gains and losses.
The estimates of speculative gains and losses on the holding of wheat, arrived at in this and in the preceding section, give interesting information on the fluctuations in gains and losses from year to year. Perhaps their chief value lies in the evidence they provide that speculative holding of wheat has, during the past forty-one years, shown more losses than gains. The totals and averages for the entire period and for various sub-periods are discussed in detail in Section V, helow.
IV. DIVISION OF GAINS AND LOSSES AMONG CLASSES OF DEALERS AND TRADERS
SpeCUlative gains and losses on the holding of wheat may fall entirely on the owners of the wheat, or may be shifted, in whole or in part. As noted on earlier pages, the hest practical basis for distinguishing spcculative gains and losses from other gains and losses is provided by the criterion of hedgability of the price risk from which the gain or loss arises. Gains or losses are counted as speculative if, and to the extent that, they have been or might have been shifted by hedging. By definition then, proper hedging results in complete shifting of the speCUlative gains and losses under discussion. Gains or losses may also be shifted by balancing stocks of wheat with forward sales of flour or of other wheat.
HEDGING AND SPECULATIVE PHOFITS
Special interest attaches to the question, what gains and losses have been taken by traders in futures in connection with the carrying of hedges? An answer to this flu.cstion would give likewise the total gross gums and losses of all traders in futures ~)ther than hedgers. It is only on the carrylUg of hedges that speculators in wheat, as u group, can either gain or lose. On all
other transactions in futures, the gain of one speculator is the loss of another, and gross gains and losses balance perfectly.l
To determine accurately what gains and losses have he en taken by traders in futures, it would be necessary to have a record of the changes during each year in the volume of hedges being carried by traders in futures. The only published records of the sort are very incomplete and cover such short periods that only the broadest of generalizations may be deduced therefrom. For the purpose of arriving at some quantitative idea of past gains and losses on the
1 Of COUl'se, in the more specialized use of the term "speculator," on the basis of which distinction is made among speClllat(ll'S, scalpers, and spreaders, speculators as a group may lose and probahly do lose generally to scalpers and spreaders. We arc here using the term in the broader sense, according to which all traders in futures are classed either as hedgers or as speculators. The terms, moreover, arc used in a functional rather than in a personal sense: a single individual or firm may be both hedger and speculator if, as sometimes occurs, cash transactions are hedged as a matter of routine, while some speculating in futures is done on the side by the same individual or firm. The rather common pl'actiee of hedging only when adverse price movements are expected may also be regarded as a combination of hedging and speculating, equivalent in effect to a formal separation of the op<'I'ations through routine hedging and independent speculation in futures.

418 FINANCIAL RESULTS OF SPECULATIVE HOLlJING OF WHEAT
carrying of hedges, it is useful to start with a rough and admittedly inaccurate supposition, obtain the results on that supposition, and then determine in what direction the results would be altered by bringing the supposition more nearly into line with the known facts.
Proceeding along this line, we start with the assumption that at all times most of the visible supply is hedged, that at all times there is enough additional wheat hedged to bring the volume of hedges to a total somewhat in excess of the amount of the visible supply, and that this total follows a course roughly similar to that of the visible supply. These assumptions appear eminently reasonable on the theory, commonly held, that those dealers who practice hedging generally hedge as a matter of routine. It is known that hedging is widely practiced by the principal owners of wheat in the visible supply, namely operators of large elevators and exporters. Hedging is practiced also by a considerable percentage of millers and country elevator operators. Millers usually have their wheat and flour stocks fairly well balanced by flour orders, so that stocks of wheat which one might expect to find hedged in the futures markets by millers are relatively small, but it is probably true that such mill stocks, together with other stocks of wheat outside the visible supply owned by dealers who practice hedging, always exceed such stocks in the visible supply as are owned by dealers who do not hedge. Therefore, if all hedgers or almost all hedgers maintained always full hedging protection, the volume of hedges would always exceed the quantity of wheat in the visible supply.
On this line of reasoning one comes to the conclusion that gains and losses of carriers of hedges must exceed the total speculative gains and losses taken on the holding of the visible supply. Since speculative losses on the visible supply have on the whole exceeded speculative gains, the conclusion is indicated that the carrying of hedges by futures traders has in general been done at a slight loss. In subsequent paragraphs it will be shown that this line of reasoning errs chiefly in assuming that hedging is a routine practice. The evidence is that a large proportion of hedgers em-
ploy the hedge chiefly when they anticipate a decline in prices, and carry wheat unhedged when they anticipate a rise in prices. It is reasonable to suppose that the price judgment of large grain dealers is rather better than the average, and that their expectations of price change prove correct somewhat oftener than they prove incorrect. If so, the fact that in considerable part hedging is employed or omitted according to the discretion of the trader means that gains of carriers of hedges, as a whole, are less than they would be if hedging were employed entirely as a matter of routine and that losses are about as large as they would be under those conditions. In other words, the carriers of hedges have probably taken, over a period of years, considerably larger losses than calculated on the simple assumptions originally outlined.
MILL HEDGING
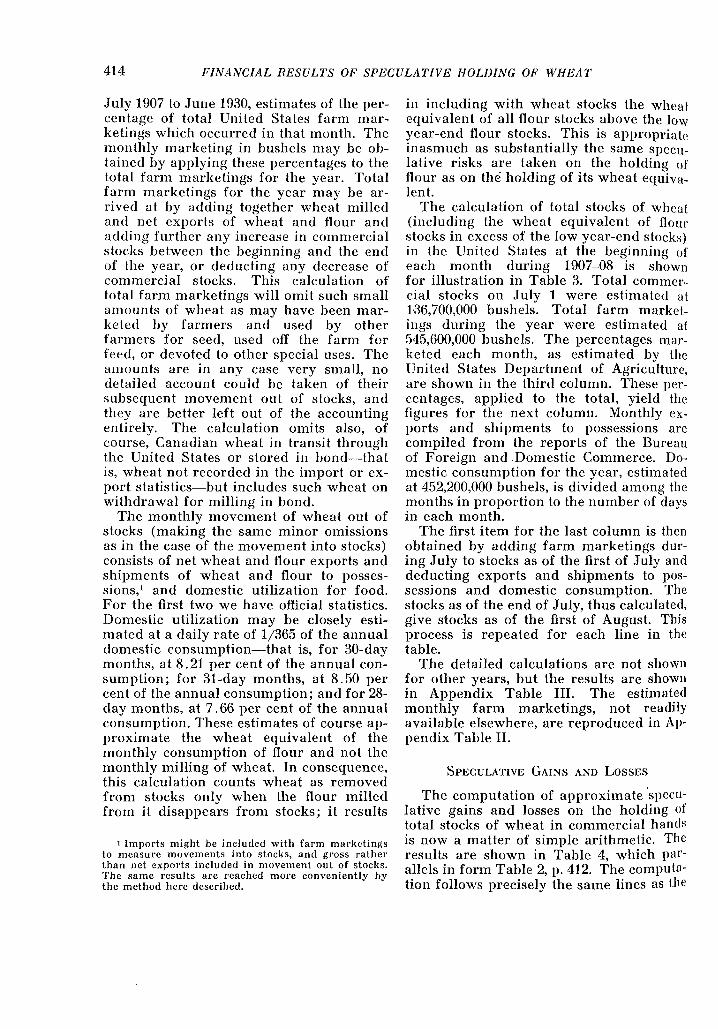
A most important body of data bearing on mill hedging has been collected during the past six years by the Millers' National Federation. The pertinent data are assembled in Table 5. The mills represented in each report accounted for a percentage of the total flour output of the country varying from about 50 per cent in two or three cases to about 70 per cent in the more complete reports. The second section of the table, expressing the data in terms of number of days of capacity operation, provides a basis for comparison unaffected by the varying completeness of the returns. It is possible that the mills reporting are not in all respects strictly representative of the milling industry as a whole. In particular, it may be supposed that the mills represented include chiefly the larger and more progressive concerns and that these concerns practice hedging more generally than the smaller mills. Nevertheless, the data establish certain facts beyond the possibility of reasonable doubt.
Comparison of the data on total stocks of wheat and flour and the data on unfilled flour orders in Table 5 reveals a striking correspondence between the two. On December 31, 1930, stocks exceeded flour orders by an amount that would have been ~hsorbed in twenty-three days of capacIty
DIVISION OF GAINS AND LOSSES 419
TABLE 5.-SUMMARY OF STOCKS, HEDGING POSITION, AND RELATED DATA, Fon MILLS HEI'OHTING TO THE MILLEllS' NATIONAL FEDEIlATION, JANUAIlY 31, 1925, TO MAHCH 31, 1931*
Stocks Unfll1ed I EXe{~H8 Open optioJls flour of Net
Dato Dully r J!"lour I orders stocks I I
TJoH-itlon ""[Hwity Wh,,"t (U8 'rotal (as over Boughti Sold N(·t Jongl)
, wheat) wheat) orders houghtfl ---- ---
A. DATA AS REPORTED (Thousand bushels)
.Tan. 31, 1925 ........... 1,819.2 74,3.56 13,392 87,748 58,277 +2!),471 415 18,684, (l8,26~J) 11,202
.June 30 ............... 1,784.0 2.5,241 9,824 35,065 25 ,46~) + 9,.5()6 679 4,808 ' (4,129) .5,467 Dec. 31 ................ 1,429.9 60,277 9,717 69,994 46,178 +23,816 826 14,635 (13,809) 10,fJ07 June 30, 1926 .......... 1,G45.4 29,947 8,282 38,229 37,489 + 740 11.204 10,.550 i 6.54 1,394 Sept. 30 ............... 1,671.2 83,706 11,550 9.5,2.56 113,882 -18,626 35,]28 9,398 ' 2.5,72.5 7,Of)9 Dec. 31 ............... 1,691.7 79,208 12,868 92,076 D4,167 - 2,091 18,736 9,148 (),588 7,4!)7 Mar. 31, 1927 .......... 1,419.7 51,808 9,402 61,210 56,220 + 4,990 10,891 7,286 3,605 8,W5 . June 30 ............... 1,619.0 33,713 9,133 42,846 33,058 + 9,788 4,528 9,3.37 (4,8Of)) 4,979 Sept. 30 ......... '" ... 1,541.5 67,574 11,014 78,588 97,290 -18,702 23,0&7 6,9.56 16,111 (2,.591) Dcc. 31 ................ 1,758.3 82,437 13,631 96,068 88,874 + 7,194 12,317 1(},.570 1,747 8, ~J41 Mar.31,1928 ........... 1,828.7 60,258 13,152 73,410 &3,988 + 9,422 11,359 11, 199 , 160 9,582 June 30 ............... 1,811.7 33,947 12,268 46,21.5 29,3&6 +16,849 5,00.5 12,140 I (7,la.5) 9,714 Sept. 30 .. , ......... , .. 1,846.4 99,8.59 13,342 113,201 142,013 -28,812 33,73.5 7,468 1 26,2&7 (2,54.5) Dec. 31 ............. , .. 1,840.2 109,441 13,9&3 123,404 11&,073 + 7,331 15,079 13,324 1,755 9,086 Mar. 31, 1929 ........... 1,872.7 82,412 13,294 95,706 8(},219 +1.5,487 7,643 12,2'J3 (4,650) 10,837 .Tune 30 ............... 1, 905. 7 58,098 12,728 70,826 55,797 +15,02!J 12,326 11, 131 1,195 16,224 Sept. 30 ............... 1.781.6 117,400 18,044 13,5,444 111.685 +2.'3,75D 15,038 20,D46 (5,D08) 17,851 Dec. 31 ................ 1,674.4 109,850 14,449 124,299 D7,753 +26,546 11 ,.506 19,042, (7,536) 1!J,010 Mar. 31, 1930 ......... " 1.991.1 73,456 14,6.51 88,107 80,189 + 7,(H8 10,.567 D,609 ~ 958 8,876 June 30 ............... 1,879 ·0 47,541 12,130 59,671 G7,854 - 8,183 14,707 5,847 i 8,860 677 Sept. 30 ............... 1,8Gl.3 114,551 13,634 128,18.5 101. 729 +26,456 21,728 26,8&9 i (,5,141) 21,315 Dec. 31 ................ 2,0.5.5.7 11.5,785 14,554 130,339 83,8231 +46,516 7,02& 28,.595: (21,569) 24,947 Mar. 31, 1931 ........... 2,1.53.2 G9,128 14,057 83,185 4D,421 +33,764 7,982 22,191' (14,209) 19,555
B. DATA EXPRESSED IN NU~tDER OF DAYS OF CAPACITY OPERATION (Days)
--Jan. 31,1925 ........... ...... I 40.9 7.4 48.2 32.0 +lG.2 .2 10 .. 3 (10.0) I 6.2 .June 30 ............... I 14.2 5.5 19.7 14.3 + 5.4 -4 2.7 (2.3) I 3.1 .. 0. o. I Dec. 31 ................ ...... 42.2 6.8 49.0 32.3 +16.7 .6 10.2 (9.7) 7.0 .June 30, 1926 .......... ...... 18.2 5.0 23.2 22.8 + .4 G.8 ().4 .4 .8 Sept. 30 ............... •• 0.0. 50.1 6·9 57.0 68.1 -11-1 21.0 5.6 1.5.4 4.2 Dec. 31 ...... " ........ ...... 46.8 7.6 54.4 .55.7 - 1.2 11.1 5.4 5.7 4.4 Mar. 31, 1927 .......... ..... , 36.5 6.6 43.1 39.6 + 3.5 7.7 .5.1 2-5 6.1 June 30 ............... ...... 20.8 5.6 26.5 20.4 + 6.0 2.8 5·8 (3.0) 3.1 Sept. 30 ............... .0 •••• 43.8 7.1 51.0 &3.1 -12.1 15.0 4-5 10.5 (1-7) Dec. 31. " ........ " ... ...... 46.9 7.8 54.6 50.5 I + 4.1 7.0 G.O 1.0 5.1 Mar. 31, 1928 .......... 32.9 7.2 40.1 35.0 I + 5.2 6.2 6.1 .1 5.2 ...... June 30 ........ '" .... ...... 18.7 G.8 2.5.5 16.2 + 9.3 2.8 G.7 (3. ()) 5.4 Sept. 30 ............... .0 •••• 54.1 7.2 61.3 76.9 -15.6 18.3 4.0 14.2 (1.4) Dec. 31. " ............. .0' •• 0 5g.5 7.6 67.1 63.1 + 4.0 8.2 7-2 1.0 4.~1 Mar. 31, 1929 .......... .0 •• 0' 44.0 7.1 51.1 42.8 + 8.3 4.1 G.6 (2.5) 5.8 June 30 ............... ...... 30.5 6.8 37.2 2!J.3 + 7.9 G.5 5.8 .6 8.5 Sept. 30 ............... ...... 65.9 10.1 76.0 62.7 +13.3 8.4 11.8 (3.3) 10.0 Dec. 31 ................ .0 ..• , 65.6 8.6 74.2 58.4 +15.9 6.9 11.4 (4 .. 5) 11.4 Mar. 31, 1930 .......... ,0' •• , 36.9 7.4 44.3 40.3 + 4.0 5.3 4.8 .5 4·5 .June 30 ............... ...... 25.3 G.5 31.8 3G.1
I - 4.4 7.8 3.1 4.7 .4
Sept. 30 ............... ...... Gl.5 7.3
I G8.8 54.7 +14.2 11.7 14.4 (2.8) 11.5
Dec. 31 ................ ...... 56.3 7·1 63.4 40.8 I
+22.6 3.4 13.9 (10.5) 12.1 Mar. 31, 1931. ......... •• 0.0. 32.1 6.5 38.& 23.0 +15.7 3.7 10.3 I (G.6) 9.1 -
• Data compiled from reports of Millers' National Federation. Capacity is rcported in barrels per 2,j-hour day and :1aS heen converted to bushels of wheat at 4.6 bushels per barrel. Flour stocks have also heen converted to wheat at 4.6 lushels per harrel. For the first four report dates, unfilled flour orders, as reported, have been con.ycrted to wheat at 1.6 bushels per barrel; for subsequent dates, the figures under this heading above are the reported "amount of wheat sold into flour," which represents the unfilled orders converted to wheat, originally at whatever ratio the mills chose to list·, hut subsequently Ilt the uniform ratc of 4.6 bushels per barrel.
a Figures in parentheses Rre net sold options. ~ Figures in parentheses are net position short.

120 F1NANC/AL RESULT.':,' OF SPECULATIVE HOLIJING OF WHEAT
operation. Aside from this case, the greatest excess of slocks represented sixteen days of capacity operalion. These are to he compared with total slocks which only once fell to the equivalent of twen ly days capacily operation, were eleven times in excess of fifty days capacity operation, and reached a maximum of seventy-six days capacity operation. On Septemher :~O, ID28, occurred the greatest excess of flour orders over stocks of wheat and flour, an excess equivalent to sixteen days of capacity operation.
This substantial balancing of wheat and flour stocks with flour orders means, in the first place, that the mills of the country, as a group, have had occasion to place only a moderate hurden of hedging on the futures market. The speculative risks of the mills have been transferred largely to flour buyers rather than, lhrough hedges, to the speculators in futures. To what extent flour buyers may hedge their forward orders is unknown, hut it seems improbable that such hedging is extensively practiced. If so, a very substan tial portion of the carrying of speculative risks on the wheat stocks of the United States has heen done, in recent years at least, by flour huyers.
The correspondence shown by these data between mill stocks and unfilled orders seems to rest chiefly on a disposition of flour buyers (whether with intent or not, one cannot say) to place heavy forward orders when wheat stocks were large and to restrict forward orders when wheat stocks were small. It does not appear that the correspondence rested to a large extent on an adjustment by the mills of stocks to orders, for mill stocks have followed closely, at a lower level, the course of total commercial stocks of wheat in the United States. Further evidence in this direction is furnished by the fact that on most report dates there were recorded substantial volumes of futures both bought and sold as hedges. This reflects the simultaneous existence of large excesses of stocks over flour orders in some mills and large excesses of orders over stocks in other mills, a condition which would scarcely be so conspicuous a-nd common if the close balance between stocks and orders for the reporting group as a whole resulted chiefly
from the adjustment of stocks to orders by individual mills.
A furlher fact of much interest and significance is the tendency for the mills as a group to he net long ill the futures market despite the fact that their holdings of wheal and of flour are usually in excess of their flour orders. One might expect them to he more commonly net short in the futures market. The result is that, taking accounl of hoth excess of wheat and flour stocks over flour orders (or the reverse) and the net hedging position, the mills have been net long at the time of all hut two of the twenty-three report dates for which the data are recorded. It may he noted, however, that on only four of the twenty-three dates did the net long position of all the reporting mills as a group reach the equivalent of ten full days of capacity operation.
In connection with the question to what extent mill hedging influences the gains and losses of futures traders carrying hedges on commercial wheat stocks in the United States, the most significant data in Tahle 5 are those contained in the last two columns. The fact that this group of mills, representing over 50 per cent of the industry, was sometimes net short in total position and sometimes net long, to the extent on one occasion of nearly 25 million hushels, indicates that the mills carry a rather widely varying proportion of the speculative risks involved in holding the wheat stocks of the country.
The net position of the open options held by the mills, as shown in the next to the last column of the tahle, is a resultant of hoth disposition of the mills to stand net long or short, and of the balance hetween wheat and JIour stocks and unfilled flour orders. The balance of mill hedging is heavily on the selling side when mills are unwilling to take risks of speculative holding and when forward orders for flour are small relative to stocks of wheat and flour. That is to say, when mills and flour huyers are afraid to take the risks of a price decline, hedging sales are large; and when mills and flour huyers anticipate rising prices and willingly carry considerable risks, futures traders can obtain few or no hedges to carryon mill stocks. The net position of mill hedges for this group of

IJIVISION OF (JAINS AND LOSSES 121
mills, representing hetween ?O and .1° P?r cent of the industry, has varJCd durJJ1.g ~JX years through a range of near!~ 18 I~IIlJOn lJUshels, from a net short pmntlOn ~)~ over 21 million bushels to a net long posItIOn of over 26 million bushels.
HEDGING IN 1 U27
A most illuminating record of hedging practice is furnished by data compile(! ~)y the United States Grain Futures AdmllllStraLion for ten months in 1H27.1 .Analysis of the data reveals some extraonhnary departures from what might he expected on the theory that hedging is a routine procedure on the part of most of those who practice it. It suggests that the futures market is used by many hedgers, not as .an agency for the carrying of all hedg~blc pr~ce risks, hut as an agency for carrymg pnce risks only when price declines are definitely anticipated. .
The hedging record provld:(~ by .the~e data of the Grain Futures AdmJJ1lstratIOn IS stated to cover all hedgers in Chicago whose accounts showed at any time within the ten-month period either a total open interest or a total volume of trading in any one day of 200,000 bushels or more, and all hedgers in Kansas City, Minneapolis, or Duluth whose accounts showed at any time within the ten-month period either a total open interest or a total volume of trading in anyone day of 100,000 bushels or mo~e. With these limits, the record necessanly omitted many hedgers. The total number included at the four markets was 268, of which 111 hedged in Chicago, 15 in Kansas City, 82 in Minneapolis, and ilO in Duluth. These four markets accounted for over ~)8 per cent of all trading in futures in the United States in 1H27.
Allhough it seems reasonable to suppose that the accounts of many hedgers were omitted from these compilations, especially ut the Chicago market where only those were include~l whose accounts or trading during one day at some time reached 200,000 bushels or more, it is clear that the volume of hedging represented by these
1 [{«porls bu Members of Grain Fll(llre.~ Exchanges, Pori 2 (Senate Document No. 123, 71st Congress, 2d ~e~xi(JlJ, 1930).
smaller accounts was never very large ill Chicago and was relatively small in the other markets, where all accoullts that at any time exceeded 100,000 hushels :we:e included. In the tahulations of the (,ralll Futures Administration, the smaller hedg-
. I I· "('I l~" ing accounts are lIlclu( e( 111 A ass , with the accounts of all other traders whose accounts or volume of trading in Olle day did not reach the 200,OOO-hushel or the 100,OOO-bushel level. In Chicago, the aggregate of all short accounts of the larger hedgers reached a maximum of :H,6(i!},OOO bushels on August 1R. On the same day the aggregate of all short accounts of. the smaller hedgers and speCUlators combll1ed was 41 ,~)27,OOO hushels. By Septemher 21 the aggregate of all short accoun ts of Ll~e larger hedgers had declined nearly 1.1 mIllion bushels to 17,715,000 bushels, while the aggregate of all short accoun ls of smaller hedg~rs and speculators combined declined only ahout ;~ million hushels. Over the whole period covered, changes in the aggregate of short accounts of t~le smaller hedgers and speculators co!nh1l1ed sho.w very little correspondence WIth cha~lges 111
the aggregate of short account.s wluch are purely hedging accounts. Hedgmg ac:ounts must comprise only a small proportIOn of the total in the combined group representing smaller traders, and therefore the aggregate volume of hedging of the smaller hedgers in Chicago must have been small compared with that of the larger l~edgers whose accounts are separately claSSIfied.
In Kansas City, the aggregate of short accounts of the larger hedgers reached a maximum of 15,054,000 bushels on August 31. On the same date the aggregate of all short accounts of the smaller hedgers and speculators combined was only 3,U68,~OO bushels. These figures represent an II1-
crease of over 10 million bushels in the aggregate of short acc~unts of the larger hedgers as compared WIth. the correSl?OIHiing date two months em'lIer, hut a SlIllUItaneous decrease of over half a million bushels in the aggregate of short accounts of smaller hedgers and speculators combined.
In Minneapolis there appears to be a larger volume than in Kansas City of smallscale hedging which is not separately re-
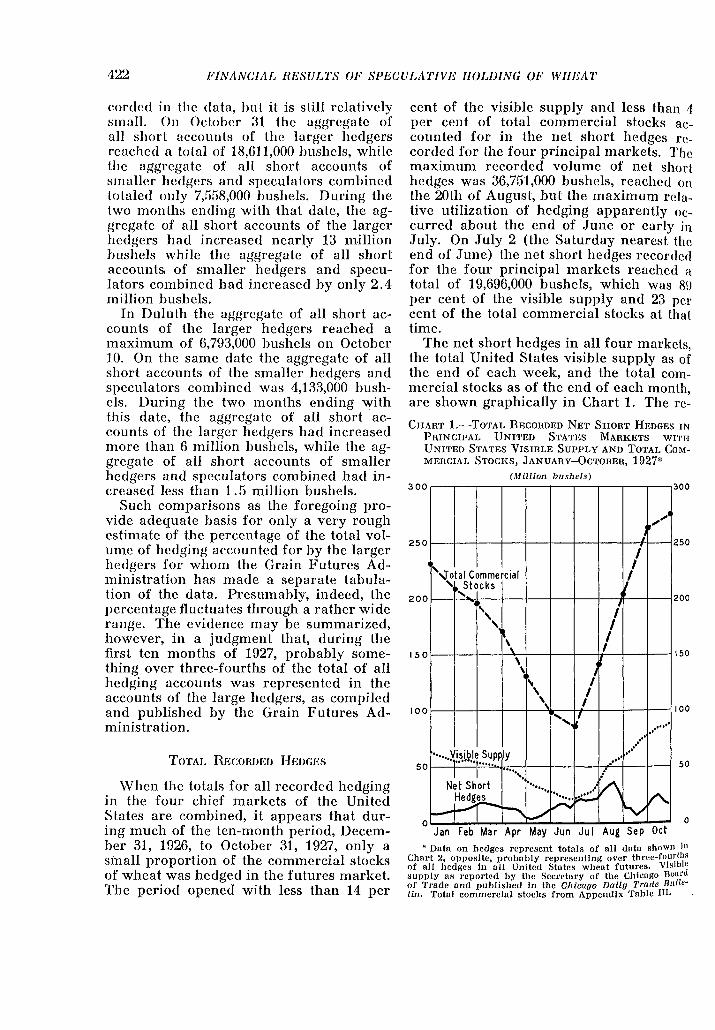
122 FINANCIAL RESULTS OF SPECULATIVE IIOLDING OF WI/EAT
eorded in the data, hut it is slill relatively ~mall. On Oetober 31 the aggregate of all ~hort accounts of the larger hedgers reaehed a total of 18,611,000 bushels, while the aggregate of all short accounts of smaller hedgers and speculators combined totaled only 7,f)58,000 bushels. During the two months ending with that date, the aggregate of all short accounts of the larger hedgers had increased nearly 13 million bushels while the aggregate of all short accounts, of smaller hedgers and speculators combined had increased by only 2.4 million bushels.
In Duluth the aggregate of all short accounts of the larger hedgers reached a maximum of 6,793,000 bushels on October 10. On the same date the aggregate of all short accounts of the smaller hedgers and speculators combined was 4,133,000 bushels. During the two months ending with this date, the aggregate of all short accounts of the larger hedgers had increased more than 6 million bushels, while the aggregate of all short accounts of smaller hedgers and speculators combined had increased less than 1.5 million bushels.
Such comparisons as the foregoing provide adequate basis for only a very rough estimate of the percentage of the total volume of hedging accounted for by the larger hedgers for whom the Grain Futures Administration has made a separate tabulation of the data. Presumably, indeed, the percentage fluctuates through a rather wide range. The evidence may be summarized, however, in a judgment that, during the first ten months of 1927, probably something over three-fourths of the total of all hedging accounts was represented in the accounts of the large hedgers, as compiled and published by the Grain Futures Administration.
TOTAL RECORDED HEDGES
When the totals for all recorded hedging in the four chief markets of the United States are combined, it appears that during much of the ten-month period, December 31, 1926, to October 31, 1927, only a small proportion of the commercial stocks of wheat was hedged in the futures market. The period opened with less than 14 per
cent of the visible supply and less than 1 per cent of total commercial stocks aceounted for in the net short hedges recorded for the four principal markets. The maximum recorded volume of net short hedges was 36,751,000 bushels, reached on the 20th of August, but the maximum relative utilization of hedging apparently occurred about the end of June or early in July. On July 2 (the Saturday nearest the end of June) the net short hedges recorded for the four principal markets reached a total of 19,696,000 bushels, which was 8!J per cent of the visible supply and 23 per cent of the total commercial stocks at that time.
The net short hedges in all four markets, the total United States visible supply as of the end of each week, and the total commercial stocks as of the end of each month, are shown graphically in Chart 1. The re-
CHART l.-TOTAL RECOHDED NET SHORT HEDGES IN PRINCIPAL UNITED STATES MAHKETS WITH UNITED STATES VISIBLE SUPPLY AND TOTAL COMMEHCIAL STOCKS, JANUAHy-OCTOBER, 1927*
(Million bushels) 300 300
",'"
250 i 250
'~otal Commercial /
/ , Stocks .....
" / 200 200
, I
\ I ,
\ 150 150
\ / ...
\ I \ ,
" -' 100 100
.,' ,.,.'
.' .' .'
·· .... ~j~i9.'.t~~?~ Iy ." ..... I I ....
'. /\ Ne t Short ........ "
~ ~...; .. A V
50 SO
~ ~ .../ o 0 Jan Feb Mar Apr May Jun Ju I Aug Sep Oct
• Data on hedges represent totals of all datn shown in Chnrt 2, opposite, probably representing over three-fourths of nil hedges In all United Stntes whent futures. Vislbl~ supply as reported by the Secretary of the Chicago Boar of Trade Ilnd published In the Chica(Jo Daily Trade Bulletill. Totnl commercial stocks from Appendix Table III.

DIVISION OF GAINS AN}) LOSSES
corded net short hedges as of the end of each month represented the following percentages of the visible supply and of the total commercial stocks, respectively:
Month
Dec. .Jan ••••.•.•..•.•••..•••..•• Feb ...................... . Mar ....................... . Apr ....................... . May ...................... . .June ..•..•....••..•.....•• .J uly ....................•.. Aug' ....................... . Sept. ..................... . Oct. ...................... .
Visible ~uppJy
13.9 20.9 28.5 29.6 15.8 38.2 89.1 66.6 22.6 19.9 18.4
All Commercia!
stocks
3.8 5.6 8.0 8.4 4.6
11. 0 23.0 15.8 6.8 5.9 5.9
If the recorded hedges represented something over three-fourths of all hedges in futures markets, as we have supposed, or anything in the neighborhood of that figure, it is clear that during most of these months of 1927 only a. small percentage of commercial stocks was hedged in United States futures markets at any time and the prevalence of hedging varied greatly during the course of the period.
Study of the net position of hedgers in the four markets separately reveals the fact that the largest changes and the changes of most peculiar character occurred in Chicago. The data are shown graphically in Chart 2. The net hedging positions in Kansas City and in Minneapolis followed courses roughly similar to the courses followed by the visible supplies in those cities. In both markets the net position of hedgers was at all times short except for a few days, and in both markets the net short position represented generally about half of the visihle supply recorded for the city. In Duluth the net recorded position of hedgers in the futures markets was never large except during July, August, and September, when the net position was long. Information is not at hand for a definite explanation of this long hedging position in Duluth.
PECULIARITIES IN CHICAGO HEDGING
The most striking feature in the record of the net position of hedgers in the Chicago market is the decline from a net short Position in excess of 27 million bushels just
after the middle of August, to a net short position of less than 2 million bushels by the middle of September. Other notable features were the existence of a net long position during much of January, which changed gradually to a large net short position in March; an d a large increase in the net short position in May and .June, despite the fact that commercial stocks almost everywhere were declining at that time.
CHAHT 2.-NET POSITION OF RECOHDED HEDGES IN Foun UNITED STATES MAHKETS, .JANUAHY
OCTOBER, 1927* (Million bu.,/1eis)
30 30
n c~11
20 20
I-a: 0 J: til
I- A. Kansas uJ z Mmneapolls V • City ....... 1-~ -, . 10 10
....... ;J.~ q , ~ ..... - "'-, ...... " . ./ ...-.... _/ ........... ~ ~ Y _.-:/' .... --~
..... _., /
o 0
r-h z ;. 0 . .., ..J I-uJ z
Tih' I 10 0
Jan Feb Mar Apr May Jun Jul Aug Sep Oct
• Data from a report by the Unit",! States Grain Futures Administration, Ueport" by Member" of Grain Fu(ures Exr/wJlaes. Part 2 (Senate Document No. 123, 71st Congress, 2d Session, 1(30), pp. 160-63, 308-11, 336-3i, and 346-47.
These peculiarities in the net volume of recorded hedges carried in the Chicago market are illuminated by the record by classes of hedgers. The data are shown graphically in Charts 3-7, which are drawn to twice the scale of Chart 2. The great decline in the net short position of Chicago hedgers in August-September is largely explained by the remarkable shift in mill hedges from a large net short position to a large net long position (Chart B, p. 424). A substantial contributing factor was the abrupt decline in net short hedges of terminal elevators (Chart 5, p. 425) about the end of August.
The record of mill hedges in Chicago, as shown in Chart 3, gains greatly in signifi-

424 FINANCIAL RESULTS OF SPECULATIVE HOLDING OF WHEAT
cance when compared with the data of the Millers' National Federation on all hedging of reporting mills. The circles, joined by arrows where necessary with the curves in Chart 3, represen t in each case precisely one-third of the aggregate long, short, and net hedges reported by mills to the Millers'
CHAnT 3.-AGGflEGATE SHOWl', AGGnEGATE LONG, AND NWl' POSITION OF HEconDEI> MILL HEDGES
IN CHICAGO, JANUAHy-OCTOBEH, 1927* (Million bushels)
5
o~~--~--~--~~--~----~~~--~ 0 10 0 I
5
I-
h a: 0 I <f)
1/ I-w z
5
/ ~
V , V
o o
tv! \ " <.:>
~ V ' z 0 ...J
I-w
5 5
Z
10 10 Jan Feb Mar Apr May Jun Jul Aug Sep Oct
* Data from Reports by Members of Grain Flltures R:rch({llges, 1930, p. 155. The chart shows also by means of circles (joined ,vhcre necessary by arrows to the appropriate lines), corresponding data for mills reporting to the :Millcrs' National Federation, as given in Table 5, p. 419, above, but with each figure divided by 3 before plotting. Mill hedges in Chicago as recorded by the Grain Futures Administration represent approximately one-third of all mill hedges reported to the MilicI's' National Federation.
National Federation, as of the dates against which the circles are plotted. Because of the balancing of stocks of wheat against flour orders, the hedging position of even a large mill may over a long period remain below 200,000 bushels, long or short. Only accounts which exceeded 200,000 bushels are included in the Grain Futures Administra,-
tion record of mill hedging shown in Chart 3. It is probable, accordingly, that a large percentage of mill hedges in Chicago a~c omitted from that record. The fact that, even so, the record shows the equivalent of about one-third of all the hedges reported to the Millers' National Federation on dates falling within the period of the record, suggests extensive and possibly dominant usc of Chicago as a hedging market for mills. The uniformity with which the recorded mill hedges in Chicago represent exactly one-third of the total of mill hedges rcported to the Millers' National Federation suggests that the recorded mill hedging in Chicago provides an excellent index of fluctuations in all mill hedging.
The facts developed above, in conjunction with the data in Table 5, page 419, lead to the conclusion that the sharp AugustSeptember decline in net short hedges in Chicago (and in United States futures markets as a whole) was in large part a consequence of the placing of heavy forward orders for flour. The changes in mill hedges clearly may be interpreted as a consequence of heavy flour orders and it may be supposed that these orders occasioned also an increase in mill buying of cash wheat which contributed largely to the decline in net short hedges of terminal elevators.
Similar analysis leads to the conclusion that the January-March rise in net short interest, both for Chicago and for all four markets combined, was related to the decline in unfilled flour Qrders during this period. In this rise, however, a considerable part was played by an expansion in the net short position of exporters. The hedging record for exporters is shown graphically in Chart 4. The suggestion is that the exporters were accumulating and hedging wheat, much of which had been held unhedged by the previous owners. Since exporters are reputed to hedge more consistently than many other dealers, such an explanation appears plausible.
The sharp increase in net short inlerest during later May and early June, despite a concurrent decrease in commercial stocks, was contributed to by terminal elevators, by exporters, and by mills, but especially by terminal elevators. The data on terminal elevator hedging are shown graphi-

DIVISION OF GAINS AND LOSSES 425
cally in Chart 5. It is possible that this May-June increase resulted largely from purchases by hedgers from non-hedgers, so that while total commercial stocks decreased, stocks in the hands of dealers who regularly practiced hedging increased, but we know of little or nothing to support such an explanation of the phenomenon. More weight may be attached to the theory that in consequence of the sharp increase in wheat prices during late April and May, which exceeded twenty cents on Chicago May wheat and twenty-five cents on the new-crop futures, hedgers, especially terminal elevator operators, who had heen holding substantial quantities of wheat un-
CHAHT 4.-AGGHEGATE SHOHT, AGGREGATE LONG, AND NET POSITION OF RECORDED HEDGES OF ExPORTERS IN CHICAGO, JANUAHY-OCTOBER, 1927*
(Million busbels)
10 10
5 5 ......... ..... ! ••• •• •••• ••• ~ggregate . '" i ... Long .' .... .... / .............. ... : •..•.. ......... . .... ....
0 0
10 10
o 0 Jan Feb Mar Apr May Jun Jul Aug Sep Oct
., Data from Reports by Members of Grain Futures E.t'('ilallges, 1930, p. 156.
hedged, became fearful of priee declines and protected themselves more fully by additional short sales of futures. . The record of hedging position of Cana
t~lans, as shown in Chart 6 (p. 426), is partIcularly interesting as evidence of the fact that even as regards the carrying of hedges, the Chicago futures market is in part an international markeU The sharp increase in Canadian hedging in Chicago during April and May was probably related to the fact that in February and March Winnipeg fu-
tures had risen some eigh 1 cents relative to Chicago futures and continued to rise gradually, relative to Chicago, during April and May. Chicago may have become a safer
CHART 5.-AGGHEGATE Snowl', AGGHEGATE LONG, AND NET POSITION OF RECOHDED TERMINAL ELEVATOH HEDGES IN CHICAGO, .JANUAHy-OCTOBER, 1927*
(Million busbels) 15
"f Aggregate Short
lA. V"
10
0
V •••••••••• 'I ... ~ v-... 'L
,./ ~ ..
" \Aggregate
.... Long·l· ." ... "'I' .' ....... ..........
5
15
~ 10
5
l-a:
~ 0 I (j)
l- ) W Z
~ V~
I .., V '-I
~ w Z
vv-
A ".:' .•.•
'N
15
,",\1 o
." ....
i\
5
o 15
I o
5
o
5 5 Jan Feb Mar Apr May Jun Jul Aug Sep Oct • Data from Reports by Members of Grain Fuiures Ex
changes, 1930, p. 15,1.
hedging market than 'Vinnipeg for Canadian exporters, especially those concerned with wheat in store at Buffalo and at other eastern points. It is possible also that some of the transactions recorded as hedges may have been more in the nature of spreads.
1 The Grain Futures Administration has also tabulated hedging records of Europeans' for the first ten months of 1927, not here reproduced, but the totals are small and of no particular interest in the present connection. There are grounds, however, for believing that the hedging operations for foreign account are larger than is commonly supposed.

FINANCIAL RESULTS OF SPECULATIVE HOLDING OF WI/EAT
CHAll'r 6.-AGGIIEGATE SI-IOIIT, AGGIIEGATE LON<l, AND NET POSITION OF HECOIlDED HEDGES OF CANADIANS IN CHICAGO, JANUAIIY-OCTOIJEII, 1927*
(Million bushels) 10
.. JJ, 1
.' .' : ..... '\ Long : ; .... 5
o
5
t .... ~ ~ ~ d-~fegate \ .- .... hort ~ .. ,. .. ' . '"\.
o o
5 I-
5 a: 0 I If)
I-w z_ .A " -" f'... h \. z 0 ...J M I- ~ W Z
o o
U 5 5
Jan Feb Mar Apr May Jun Jul Aug Sep Oct * Data from Reporls by Members of Grain Flllllres Ex
cllanyes, lU30, p. 157.
VARIABILITY OF HEDGING PRACTICE
That it is a very common practice for dealers to hedge wheat stocks when price declines are feared and otherwise to refrain from hedging is indicated by another set of hedging records compiled by the Grain Futures Administration for the period from December 31, 1924, to April 18, 1925.1 The published data show only Chicago hedges in the 1925 May future except that for December 31 and April 18 the volume of Chicago hedges in all futures is given. Hedges in the May future and in all futures combined on these two dates compared as follows, in thousand bushels: 2
In May In all future futures
On Dec. 31, 1924: Aggregate short ............ 40,556 41,146 Aggregate long ............. 1,500 3,031
Net short ................ 39,056 38,115 On April 18, 1925:
Aggregate short ............ 8,153 15,360 Aggregate long ............ 2,581 5,121
Net short ............. " . 5,572 10,239
1 Fluelzwtions in Wheal Futures (Senate Document No. 135, 69th Congress, 1st Session, 1926).
2 Ibid., p. 114. ~ Ibid., p. 23.
A chart of the daily net position of hedgers in the May future and in all futures comhined, published by the Grain Futures Administration,a shows that as regards nel position, at least, the data on the May future reflects closely the hedging position in all Chicago futures. Chart 7 shows graphi-
CHAlIT 7.-AmlllEllATE SnORT, AGGIIEGA'I'E LONG, AND NET POSITION OF ALL HE CORDED HEDGES IN CHICAGO MAY WI-IEAT, DBcEMBBH 31, 1924, TO APHIL 16, 1925*
(Million bllshels)
50r--------.-------r--------,-------~50
40~--~---+----~-+~------~------_440 ~ _!gg~ehgate
-- --..o<.l.l2!.l 30~-------r-------r~""~----T-------~30
20~-------r------~----~~+-------~20
'~ 10~~~~-r------~--------+-~~--~10
Agr:;;te ......... ; ....................................... ~ 0 .. • .. • .. ···.... ........... . o
40 40 r-~ i--t- -~ a:
0 J: <n t- ---.... w Z .......
......... I
30 30
20 20
10 o
o L o Jan Feb Mar Apr
* Data from a report of the U.S. Grain Futures Administration, Fillelull/ions in Wheal Fulul'C .• (Senate Document No. 1'15, GOth Congress, 1st Session, 102(1), pp. 00-101 and 101-106.
cally the aggregate long, aggregate short, and net position of the recorded Chicago hedges in May wheat as of December 31, 1924, and each Saturday thereafter until April 18, 1925.
This hedging record contrasts sharply with that for the period beginning December 31, 1926, discussed above. At the end of December 1926, the net position of recorded hedgers in Chicago was long, whereas on the same date in 1924 it was short nearly 40 million bushels. Throughout the period from December 31, 1924, t(~ early March 1925, the net short position 01 recorded hedgers in Chicago May wheat, remained close to or over 40 per cent of the visible supply of wheat in the Unite? States. This large recorded net short POSI
tion is rendered the more impressive by the

DIVISION OF GAINS AND LOSSES 427
fact that it included accounts of only 62 hedgers, little more than half the number included in the record of 1927, discussed above. Only those were included who had had occasion to buy or to sell as much as 100,000 bushels in a single day.
If it be supposed that the recorded net short position of hedgers in Chicago on January 31, 1925, represented something under half of the net short position of all hedgers in Chicago and one-fourth of the net short position of all hedgers in the United States, the total net short position of all hedgers on that date in all markets was 120 million bushels. The Millers' National Federation received reports as of January 31, 1925, from mills representing slightly over half of the milling output of the country showing unfilled flour orders aggregating 58,277,000 bushels. If the unfilled orders of all mills totaled 110 million bushels, 230 million bushels of wheat may have been covered by net short hedges and unfilled flour orders as of January 31, 1925. The total commercial stocks of wheat and of flour (above minimal flour stocks) in the United States on that date were in the neighborhood of 240 million bushels. With a liberal allowance for error in these esti-
7'01al Reporting "Yes" Source number
reporting i Prrcont-Number age
Elcvators ................... 8,217 3.437 41.83 Warchouse:,; ........ , ........ 354 7 1.98
-------'rotal ..................... 8,571 3.'144 40.18
mates, it remains clear that on January 31, 1!)25, when wheat prices were at their highest post-war levels, virtually all the wheat and flour in commercial hands in the United States was hedged in futures or covered by unfilled flour orders.
A little over a year later, with wheat prices sharply lower, the position of hedgers was radically different. The change lllay be judged roughly from a rrcord of ~he accounts of twenty-two large hedgers III Chicago compiled by the Grain Futures ~dl1linistrfltion for the period from April 20 to December 31, 1926.1 The data, as of the end of each week, are shown graphically
in Chart 8 (p. 428). This series of data is much less inclusive than the data previously discussed, as is clear from the smaller numher of accounts included, representing ahout one-fifth of the number included in the 1!)27 record and one-third of the number in the 1925 record. The twenty-two accounts included in this record for 1926 were those which at some time during the period reached or exceeded a position of 500,000 hushels long or short in anyone future. During most of this period in 1926 the position of these 22 hedgers was net long, in contrast with the heavy net short position of recorded hedges during the weeks of high prices in 1925.
The foregoing data on prevalence of hedging during three separate periods and the evidence therein that to a considerable extent hedges are employed only when adverse price movements are anticipated lends added significance to data collected some years ago by the Federal Trade Commission. In 1918 the Commission addressed a questionnaire to country elevators and warehouses which included the question, "Is it a custom to hedge your grain purchases?" The replies were tabulated as follows :2
Reporting to Reporting only by some extent flour sales Reporting "No"
Pere0nt-Number I Percent-
Number I Porcent-Number ag~ age ugP
810 9.86 9 0.11 3.961
I 48·20
10 2.82 .. . ... 337 95·20
820 I
9.57 9 0.11 I 4,298 I
50.15
Nearly one-fifth of the elevators and warehouses employing hedging qualified their statement in such a way that it was classified under the heading of hedging "to some extent." The question having been framed as it was, it may be supposed that many elevators answered "yes" without qualification even though their hedging custom was not entirely regular.
1 See Major Transactions in the 1926 December Wheat Future (U.S. Department of Agriculture Technical Bulleti n No. 79, Scptembel' 1928), especially pp. 14-16 and 37-42.
"Cul/ntT/! Grain Marketing (Report on lhe Grain Trade, Vol. I. September 1920), p. 213.

128 FINANCIAL RESULTS OF SPECULATIVE lfOLDlNG OF WHEAT
CHAHT 8.-AGGHEGATE SI-IOIIT, AGGHEGATE LONG, AND NET POSITION OF TWENTY-TWO HED(HNG
ACCOUNTS IN CHICAGO, Al'llIL 30 TO DECEMIlEH
31,1926*
20 20 ..... .......... ./ ..•.
r" .... " lO ... .'
~ Ag~regate ....
t. Long ..... .... \
15
10
15
10 /Y" '-' V'----:
5
o 5
o
5
10
.......
~
"' z 0 J
I-w z
,.0' . .., .. ":7
~
'""'
/Ag~regate hart
rt-.. ~ \
\ f ~
----
~ / ~
5
o 5
o
5
10
15 May ,fun Jui Aug Sep Oct Nov Dec 15
• Data from .1. ,V. T. Duvel and G. ,Vright Hoffman, Major Transactions ill the 1926 December Wheal Fulure (U.S. TkpartnH'lIt of' Agriculture Technical Bulletin 79, September 1028), PI'. :J7-42.
Among flour mills a still larger degree of irregularity in hedging practice was indicated in reports received by the Federal Trade Commission. The precise form of the inquiry in this case is not stated. Over half of the companies reporting (126 out of 242) stated that they did not hedge at all, but failure to hedge was more common among small companies, with the result that in terms of milling capacity the percentage not hedging was only 38.3. The results of the inquiry arc tabulated as follows:'
Heuging policy: Not heuging ............. 145,335 I-Ieuging more or less ...... 232,850
Total , ................ . Treatmcnt of flour cOlltracts
by hedging companics: Hedging all ............. . Hedging part ........... . Hedging none, though hcug-
ing wheat ............ .
Total ................. . Treatment of wheat purchased
by hedging companies: Hedging all ............. . Hedging part ........... . Hedging none, though hedg-
ing flour contracts ..... .
378,185
148,525 (i8,175
1(i,150
232,850
140,H25 44,750
47,475
Total .................. 232,850
Pucentage dlstrilJu
tiOIl
38.43 (il.57
100.00
H3.79 29.28
6.93
100.00
fHI. 39 19.22
20.39
100.00
It would be most interesting to have similar data on the hedging practice of terminal elevator companies. So far as we have been able to ascertain, no comprehensive data of the sort have been published.
DIVISION OF GAINS AND LOSSES
If the more or less fragmentary picture of hedging practice in recent years, which has been pieced out from the data discussed above, is representative of general hedging practice in the United States, a large percentage of the speculative losses on the holding of wheat is shifted to traders in futures, while a large percentage of the gains is taken by others than futures traders. It may be that in years of losses on speculative holding, the losses taken by futures traders considerably exceed the total losses on the carrying of the visible supply and it seems highly probable that in years of gains the gains taken by futures traders represent only a fraction of the gains taken on the carrying of the visible supply.
If traders in futures took the equivalent of all of the gains and all of the losses on speculative holding of the visible supply, the results over the forty-one years under review would have shown a net loss, neglecting commissions and other expenses. Over no ten-year or even five-year period within the forty-one years would they have realiz.ed a large average gain per bushel. It is fairly clear that in fact traders in futures must have taken at least a larger percentage of the losses than they did of the gains. In consequence, their losses must have substan tially exceeded their gains over most periods of moderate length.
Others who have participated in gains and losses on the speculative holding of wheat arc grain dealers, millers, and flollr huyers. Millers, though they carry stocks of wheat and of flour which arc usually more than the equivalent of the total visible supply and sometimes more than double the amount in the visible supply, appear USllally to take but a small part of the speculative gains and losses. Their stocks of wheat and of flour have usually been fairly well
1 E/Tec/s of Fu/ure Tmdin(J (Hepol't 011 the Grain Trade, Vol. VII, June HJ2(), p. 45.

SUMMARY AND CONCLUSIONS
halanced by unfilled flour orders. On the few occasions on record when mill 1;iocks have exceeded flour orders or orders have exceeded stocks hy large amounts, the greater part of the excess, as recorded in the reports to the Millers' National Federation, has been hedged.
Most of the speculative gains and losses on the holding of wheat which have not heen shifted to traders in futures have heen taken by grain dealers and by flour huyers who have placed large forward orders for flour. There is a prevalent opinion that the practice of placing heavy forward orders for flour is to a considerable extent a recent development. However this may he, it appears that during the past six years the volume of such orders has represented the equivalent of from around one-third to two-thirds of the total stocks of wheat in commercial hands in the United States. If the unfilled flour orders reported to the Millers' National Federation he raised to 100 per cent (on the basis of the ratio of wheat and flour stocks of reporting mills to the corresponding stocks of mills reporting to the United States Department of Commerce as of the same date, and the ratio of production of the latter to total Uniled States flour production) and com-. pared with the estimated total commercial stocks of wheat and of flour, the following relations are shown, in million bushels and in percentages:
1925
1926
1927
Estimnt<'d unlllied
flour Ol"(i<~rs, as wheut
.June 30 ...... 38 Dec. 31 ...... 90 .June 30 ...... 54 Sept. 30 ...... 189 Dec. 31 ...... 153 Mar. 31 ...... 104 .June 30 ...... 58 Sept. 30 ...... 180 Dec. 31 ...... 135
Total P"rcpntngc commercial 1I 11 1111 "d
stocks of orders to wlu'at llnd lolul stocks
Hour
87.6 44 241.7 37 78.0 69
262.3 72 231.1 (j(j
170.4 (it 85.8 li7
264.0 £i8 252.1 54
1928
1929
1930
EstillHltcd 1I11f1 I J<.cl
floll.' ord{'rs, us wheul
Mar. 31 ...... 97 .June :~O ...... 43 Sej)t. :30 ...... 229 Dee. 31 . ..... 175 Mar. al ...... 11a .June 30 ...... 78 Sept. :10 ...... 171 Dee. al ...... 142 Mar. 31 ...... 112 .June 30 ...... 100
Total P{'rccnlage cOlTuncrcinI untJllc·d
:{tocks of orclPJ's to wlwal alld total stocks
!lour
194.0 50 104.3 41 :~:17. :3 H8 :~37. a 52 27fi.l 41 201.5 3!J 458.7 :17 404.!J :15 :~O(j. 8 :{(j
228.2 44
It appears that, broadly, about half of the speculative risks on the carrying of commercial wheat stocks in the United States during the last six years has fallen on flour buyers. The proportion has varied considerably from time to time and the data are available only for dates so far apart and over such a short period of years that it is impossihle to judge whether the speCUlative gains taken on forward orders of flour exceeded the speculative losses during this period, or the losses exceeded the gains.
Dealers in cash wheat carrying sLocks unhedged appear commonly to stand second in importance as carriers of speculative risks on wheat price changes. At times dealers hedge such a large proportion of their stocks that futures traders, to whom they transfer the risks through hedges, take second place and the dealers take a low third place. The availahle evidence, though very limited in scope, suggests strongly that dealers are fairly successful in choosing when to take price risks and when not. It is probable that dealers have on the whole profited from such speCUlative holding of wheat as they have chosen to undertake. If so, they have profited by taking gains on occasion, when gains were to he had, and shifting a considerable proportion of losses to traders in futures.
V. SUMMARY AND CONCLUSIONS
In summarizing the results reached in the foregoing pages and developing some of the conclusions to which they lead, attention may be directed first to the data showing for each crop year 1907-08 to 1915-16 and 1!121--22 to 1929-30, the total gain or loss on
the speculative holding of all wheat and flour in the United Stales. The results are shown graphically in Chart!) (p. 4:30) hv the broken line with the scale at the right. buriug the nine years 1907-08 to HH5-Hi there were four years in which speculative hold-

FINANCIAL RESULTS OF SPECULATIVE JlOU)ING OF WJlBAT
ing showed a loss. The largest loss was :32 million dollars in 1910-11; the total loss for the four years of loss was 99 million dollars. The largest gain was 119 million dollars in 1914-15 and the total gain in the five years of profitahle holding was 200 million dollars. For the nine years as a whole there was a gain of 101 million dollars. This total gain was realized partly on the
During the nine post-war years, 1921-22 lo 1929-30, there were five years of loss and four of gain. The largest loss was 226 million dollars, in 1929-30. The five years ill which holding was unprofitahle showed a total loss of BB7 million dollars. The largest gain was 95 million dollars, in 1D24-2!i. Gains in the four years of profitable holding tolaled 146 million dollars. The nine
CHART 9.-SPECULATIVE GAINS AND LOSSES ON 'fI-IE HOLDING OF WIIEA'I' AND FLOUH IN THE UNITEIJ STATES, BY Cnop YilAIlS, JULY 1884 TO JUNE 1916 AND JULY 1921 '1'0 .JUNE 1930*
(Million dol/aI''') 75 150
A Total Gains/ \ t\ z and Losses, ,
0( n' '" " 1Al '. [K\ " \
50
25
100
50 A
\ 1\ \ IV ~1\ 6 B 11 ~ A ~ ~ o o
CI) UJ
0: UJ
'" 25 -' 0(
;::: 0: :. 0: ~ 50
~ V " " .............
'0}\ It '\v '1 Representative Partial • Gains and Losses
" .... ...
.... '. ~Cumulative Partial
, j ~'fj ,,'"
f'"
...... ' " .. " .. ".... :
-, ..... \\ ~ ~
\: q I
<I)
'" C< 50~
oJ 0( to to:
OO~
'" oJ UJ -' 0(
VI VI
\ Gains and Lo~~,e', .. , ~ .." ...... ......
I I •• ...... ,,- -": .... Ii « o CIl u 0
'" ..J
75
100
1251885 -86
I -'-1890 -91
~........ ..... -" ........ I, ",
1895 -96
1900 -01
1905 -06
1910 -II
1915 -16
.L 1925 -26
, , ,
" I
I 50
200
250 1930 -31
* Data from Appendix Table I. The seale for the partial gain~ and losses (those on t1w visible supply of whent) Is at the left; the scale for totul gains and losses on all whent and flour in commercial stocks iu tlw United Stutl·s is lit the right. The curve of cumulative gains and losses is shown only for the representatIve pmiial series and Is plotted to tbe scale (at the left) used for that series. The cumulation is continuous from 1884-8G to 1 !!lG-Hj lIud Is recoJ11l1leuC{'" with 1921-22.
holding of some wheat for short periods and partly on the holding of other quantities for longer periods. The total amount of holding was equivalent to carrying 1,686 million bushels of wheat for ten months. The gain therefore represented an average of 0.6 cent per bushel per mon tho
post-war years as a whole showed a total loss of 1n1 million dollars, The holding during the nine years was equivalenl to carrying 2,:~87 million bushels for ten months and the average loss on this holding was 0.8 cent per bushel per month.
The gains and losses given above arc

SUMMARY AND CONCLUSIONS 131
totals for approximately all trading in wheat futures plus total gains and losses on approximately all holding of unhedged wheat or flour in commercial channels, in so far as the latter gains or losses might have been avoided by hedging. Holders of wheat and flour take some price risks which are not hedgable; gains or losses on such risks are not included. Gains or losses incident to the holding of wheat on farms are also omitted. The gains and losses shown are net gains or losses in the sense that in each figure gains of some individuals are set against losses of others. They are gross gains or losses in the sense that no account is taken, at this stage in the calculations, of any costs of carrying the risks, such as commissions paid by traders in futures, interest on funds deposited as margins, or excess interest paid by holders of unhedged wheat or flour in consequence of failure to hedge.
In the nature of the case, the abovementioned figures cannot claim precise accuracy. They have been given only in millions of dollars and each figure may be in error by a million dollars and some of the largest figures may be in error by 3 or 5, or possibly even 10, million dollars. For the principal purpose which these figures may serve, such errors are negligible. The chief source of error is one which tends to result in exaggerating the gains and in minimizing the losses. In so far as the figures are in error, correct figures would show smaller average gains and larger average losses.
Another set of data makes possible the calculation over a much longer period of annual gains and losses on that portion of the speculative holding involved in carrying the visible supply of wheat in the United States. Gains and losses on this porlion of the total appear to be fairly representative of total gains and losses. The results of this calculation for years beginning with 1884-85 are shown graphically in Chart 9, opposite, by the solid line, for which the scale is at the left. Different scales are used for the two curves for convenience in comparison: 20 million dollars of total gain or loss is represented by the same distance on the chart as that which represents 10 million dollars of gain or loss in the repre-
sentative partial series. The dolted line, plotted also to the scale at the left, shows for each year, 1884-8fi to HHfi-lfi, the total calculated loss indicated hy the reprcsentative partial series from 1884-85 to the year in question; and for each year, 1921-22 to 1929-30, the total calculated gain or loss indicated hy the representative partial series from 1921-22 to the year in question.
From this chart it appears that the twelve years from 1884-85 to 189:>-96 as a whole were years of heavy losses from speCUlative holding of wheat. The representative partial series shows losses totaling 75 million dollars for these twelve years. During the eight years 1921-22 to 1928-29 the total gains and losses averaged 3.3 times as large as the gains and losses shown by the partial series. l During the earlier nine-year period, 1907-08 to 1915-16, the total gains and losses averaged 3.~} times as large as the gains and losses shown by the partial series. Applying these ratios to the twelveyear period 1884-85 to 1895-96, the total loss for the period may be estimated at 250 to 300 million dollars.
During the twenty years, 1896-97 to 1915-16, gains were somewhat more frequent than losses. The partial series shows a total gain of 15 million dollars for the eighteen years, 1896-97 to 1913-14, which, with a 30-million-dollar gain in 1914-15, brings the gain for twenty years to 45 million dollars. This, with the 75-million-dollar loss of the first twelve years, gives a loss over thirtytwo years of 30 million dollars. Applying the previous ratios, the loss on all speculative holding of wheat during this 82-year period may be estimated at around 120 million dollars.
In connection with these cumulations of gain and loss over periods of several years it should he especially noted again that the major errors to which the calculations are subject are in the direction of overstating gains and understating losses. Such errors are probably unimportant in individual years but may be relatively important in totals for long periods of years. The actual total loss on all speculative holding of
1 Data for 1929-30 are omitted in calculating this ratio inasmuch as the relation hetween the two series in that year was clearly exceptional and unrepresentative.

432 FINANG/ilL IWSULTS OF SPEGU/"ATIVE HOLDING OF WHEAT
wheat during the thirty-two years 1884-85 to 1ntG-16 can scarcely have heen less than 120 million dollars and may have he en considerably greater. The actual total loss on all speculative holding of wheal during the nine years Hl21-22 to 1929-30 may have been in excess of the un million dollars shown directly hy the series for total gains and losses.
GAINS AND LOSSES BY CLASSES OF SPECULATORS
It is especially interesting to examine the gains and losses of different classes of speculative holders of wheat. The segregation of the totals into their parts cannot he made with entire accuracy, hut certain useful approximations arc possihle.
During at least the six years and more since January 1925, the most important group of carriers of speculative risks on the holding of wheat in the United States has heen a group not commonly thought of as important speculators, nor ordinarily given much consideration in connection with the holding of wheat. During this period something like half of the total gains and losses on speculative holding of wheat has heen shifted to those flour huyers who have made a practice of placing heavy forward orders for flour. It is impossihle to determine with confidence whether these flour huyers have taken a larger proportion of the total speculative losses than they have of the gains or a larger proportion of the gains than they have of the losses. Prohably the best guess is that they have taken ahout one-half each of the gains and of the losses since 1925. If so, they have taken since 1925 much heavier losses than gains, for during this period total speculative losses far exceeded total speculative gains.
Speculative gains and losses not taken by flour huyers have heen divided between wheat dealers and millers who have held wheat unhedged, and traders in futures who have carried the hedges of other wheat dealers and millers. The evidence is clear that many dealers and numerous millers follow a practice of hedging wheat stocks owned only when they anticipate a price decline, and holding unhedged when they have hopes of a price advance. On the
whole dealers and millers appear to have been fairly successful in this policy of selective hedging. In consequence, one may judge that dealers and millers have taken a larger percentage of total speculative gains than they have of total speculative losses. Prohably their speculative gains have, in general and over a long period of years, considerably exceeded their losses, despite the fact that speculative losses on the holding of all wheat have exceeded speculative gains.
Speculators in futures who carry the hedges on hedged wheat are, separately and individually, able to choose when to take speculative risks and when not, but as a group they are left only the choice of the price at which they will assume the risks. The millers and dealers who hedge determine what volume of hedges will be placed with futures traders. Futures traders, therefore, literally take whatever is left. They are the residual claimants. If flour buyers have taken about equal portions of gains and of losses and if millers and dealers have he en successful in taking a larger portion of the gains than they have of the losses, it follows that futures traders carrying hedges have taken a larger proportion of the total losses on speculative holding of wheat than they have of the total gains. Since, during the forty-one years under review, speculative losses have considerably exceeded speculative gains, it appears that, over this period, futures traders carrying hedges must have taken losses greatly in excess of their gains. Probahly their losses have heen of about the magnitude of the losses on the carrying of the visible supply (the representative series of Chart 9) and their gains much less than the gains on the carrying of the visible supply.
RESULTS OF FUTUIms THADING
Except in connection with hedges, every purchase of wheat futures by one speculator is accompanied hy an equal sale of wheat futures by one or more other speculators and every sale of wheat futures by one speculator is accompanied hy an equal purchase by one or more other speculators; every gain by one speculator is accompanied by an equivalent loss on the part of

SUMMARY AND CONCLUSIONS
Olle or more other speculators and every loss by one speculator is accompanied by an equivalent gain on the part of one or more other speculators. All the gains and all the losses taken by speculators as a group are those which are taken on the carrying of hedges. The foregoing conclusion that speculators in wheat futures have lost heavily, over a period of years, on the carrying of hedges, signifies that speculators as a group, and neglecting commissions and ~)ther costs, have lost heavily on all their trading.
The financial results of speculation in futures have been discussed in terms of gains and losses arising solely out of price changes, no account having been taken of the expenses of trading in futures. Gains and losses of futures traders, expressed thus, are directly comparable with the gains and losses on hedgable price risks realized by grain dealers and flour buyers who chose not to hedge their price risks. This comparison has just been made. More important, these gains and losses of futures traders may be traced back to determine at whose expense the gains were made and to whose benefit the losses accrucd.
The fact that, over the forty-onc years under review, speculative holding of wheat was done at a loss indicates that, after allowing for costs of holding, the weighted average Chicago price at the time farmers sold was higher than the weighted average price in the same market at the time consumcrs bought. In so far as the net losses on speculative holding were taken initially by cash wheat dealer~, millers, flour dealcrs, and bakers, it may be that the losses on spcculative holding were absorbed, at lcast partially, by widen cd margins. It is doubtful that they were fully absorbed in that way, for the competition of dealers and millers who hedge and therefore take little or no speculative loss tends to keep margins (00 narrow to cover speculative losses in addition to other costs. In so far as the losses on speculative holding were taken by speculators in futures, they cannot have been absorbed in increased margins, for speculators in futures have no opportunity ~or such r,hifting of losses. Futures trading In the United Statcs, over the forty-one years under review, must therefore have rc-
sultcd in a narrowing of the spread hclween the weighted avcrage price received by producers and the weighted average price paid by consumers.
It is clear, thcn, that there exist no large profits of speculators, as a group, which may bc supposcd to have been made at the cxpensc of cithcr producer or consumer. On thc contrary, speculators in futurcs, as a f,JTOUP, have lost moncy. They have protected hcdging dealers and millers from losses which would otherwisc have fallen on the dealers and millers, and the competition of such dealers and millers has probably held margins of others at a level IITO
viding little or no allowance for losses on speculative holding and no room for a charge for risk-taking or to cover any excess cost incident on failure to hedge.
Over the forty-one years under review, hedging of all the wheat in the visible supply would have saved owners of the wheat losses from price changes averaging close to 0.6 cent per bushel per month on wheat held. In individual years savings in consequence of routine hedging would have been great. In other individual years dealers would have made more by not hedging. During the twelve years 1884-85 to 1895-96 hedging would have resulted in average savings of about 1~ cents per bushel per month on all wheat held in the visible supply. During the next twenty years, holding unhedged would more commonly have proved profitable; hedging would have resuIted in foregoing an average gain of % cent per bushel per month held. The thirtytwo years ending with 1915-16, taken as a whole, would have shown an average gain from hedging of about 0.2 cent per bushel per month held.
The eight years 1921-22 to 1928-29 would have shown neither appreciahle gain nor loss from hedging the wheat in the visible supply, hut in 1929--aO hedging would have saved an average of about 5.5 cents per bushel per month on all wheat held in the visible supply. For the nine years 1921-22 to 1929-30, as a whole, the average gain from hedging would have been about 1.4 cents per bushel per month.
Against the savings resulting from hedging-for example, the 41-year average of 0.6 cent per bushel per month-must be

434 FINANCIAL RESULTS OF SPECULATIVE HOLDING OF WHEAT
set certain costs. The usual commission is now 1;4 cent per bushel for non-members of the grain exchange and VB cent for members. These charges cover both the placing and the removal of the hedges. Over the 41-year period, therefore, the routine hedging of stocks of wheat would have paid for itself except on stocks carried for only a fraction of a month. The hedger in addition enjoyed freedom from substantial risks and may have been able to borrow more freely and on better terms. Selective hedging probably showed somewhat better returns than routine hedging would have shown, but the advantage is more properly ascribable to successful speculation than to hedging.
The general showing of avoidance of losses, on the average, in consequence of hedging of stocks of wheat does not necessarily imply the foregoing of gains, on the average, in consequence of hedging of n~t forward sales. Hedging of all stocks would have resulted in gains because stocks to be hedged have been larger, on the average, in periods of declining prices than in periods of rising prices. Hedging of forward sales, as frequently practiced by exporters and by mills, has resulted in the foregoing of gains only in case forward sales have been larger, on the average, in periods of declining prices than in periods of rising prices. Evidence is lacking to indicate whether this has been the case or not.
NET LOSSES OF FUTURES TRADERS
When account is taken of the costs of trading in wheat futures, the financial results make a very different showing than when no account is taken of such costs. Omitting such costs, speculators in wheat futures, as a group, must have lost heavily between 1884-85 and 1895-96, when total losses on speculative holding of wheat were large, and may have regained some of this loss during the next twenty years, chiefly in one year, 1914-15, when gains were made on the speculative holding of wheat in the United States. During the eight years 1921-22 to 1928-29, speculators in futures may have broken even, or lost moderately, still neglecting costs, and in 1929-30 they must have lost very heavily.
Speculators in futures have lost in addition commissions paid and other expenses of conducting trading which, between 1921-22 and 1928-29, averaged in excess of 15 million dollars a year. During the eight years 1921-22 to 1928-29, trading in wheat futures on all United States markets averaged 13.3 billion bushels a year. Of this average, perhaps 2 billion bushels represented trading by hedgersl and about 11.3 billion bushels, trading by speculators, inchiding scalpers and spreaders.
As noted above, the commission rates on futures trading that have been charged at Chicago and at most, if not all, other markets in the United States since 1920, are 1;4 cent per bushel to non-members and VB cent per bushel to members. Members, however, may perform for themselves all or part of the operations performed by a commission house for its clients: they may pay nothing in the nature of a commission, or they may pay only a brokerage charge of 15 cents per 1,000 bushels,2 only a clearing charge of 25 cents per 1,000 bushels, or both, or they may pay the $1.25 per 1,000 bushels member's commission. On the basis of an investigation of the amounts of trading done in the various ways the Federal Trade Commission estimated that the average commission or other proper charge on all trading in all grains in Chicago, at the rates in force since 1920, was close to the member's commission rate of $1.25 per 1,000 bushels, or lis cent per bushel.:! This calculation included an allowance of 15 cents per 1,000 bushels for costs of members performing for themselves all operations connected with the transactions.
At this rate, the cost of 11.3 billion bushels of trading annually would be about 14 million dollars per year. To this should be added for completeness certain expenses for interest on margins, for telegrams, for
1 A liberal estimate, based on study of records published by the U.S. Grain Futures Administration.
2 This rate applies to lots of 5,000 bushels or mult!pies thereof; on smaller lots the brokerage charge IS
25 cents per 1,000 bushels. 3 More specifically, tbe Commission arrived at !he
figure of $5.96 per 5,000 bushels without allowlllg for the bigher rates on lots of less than 5,000 bushels, for which they made a rough upward adjustment of costs as calculated from the rate of $5.96 per 5,000 bushels. See Effects of Future TradinlJ (Report on the Grain Trade, Vol. VII, February 1926), chap. iv, Sec. 7.

SUMMARY AND CONCLUSIONS 435
rental of tickers, for membership in grain exchanges, and federal taxes. It is not worth while to attempt a close estimate of these expenses, but it is clear that they would bring the post-war average annual direct outlay by speCUlators in futures to a
figure in excess of 15 million dollars. It appears, therefore, that speculators in wheat futures taken as a group have in the past carried the risks of price changes on hedged wheat and have received no reward for the service, but paid heavily for the privilege.
This study has been prepared by Holbrook Working with the assistance of Adelaide M. Hobe and P. Stanley King

APPENDIX
TABLE I.-SPECULATIVE GAINS AND LOSSES ON TI-IE HOLDING OF WHEAT IN TI-IE UNITED STATES, AMOUNT OF HOLDING, AND GAINS AND LOSSES PEH BUSHEL PEn MONTH BY Cnop YEAHS,
1884-85 1'0 1915-16 AND 1921-22 1'0 1929-30*
Number Q.f bushels held GaIn or loss I>er buslH,1 'l"otai gain or 10s,.'3 one month vermonth (millioll dol/aI''') (million bushels) (cents pel' bushel)
Oro]) y~ar ------~--------
JuLy-Juno On aU In al1 Onnll On viAible eommc'rclal In vlslhle commercIal On vIsIble commercIal
"uJlPly stocks supply stocks BUPi>!Y swcks ------------ -------~ ---~--
1884-85 ........... - 2.8 .... 431.9 . ...... -0.65 . ... 1885-8(; ........... - Hi.O .... 556.(; . ...... -2.88 . ... 188(;-87 ........... - 5.7 .... 592.2 . ...... - .95 . ... 1887-88 ........... - 2.0 .... 416.3 . ...... - .48 . ... 1888-89 ........... - . 6 .... 3,16.4 . ...... - .17 . ...
1889-90 ........... + .9 .... 281.2 . ...... + .30 . ... 1890-91 ........... - . 8 .... 245.1 . ...... - .34 . ... 1891-92 ........... - 8.7 .... 339.0 . ...... -2.23 . ... 1892-93 ........... - 11.7 .... 732.8 . ...... -1.59 . ... 1893-94 ........... - 18.8 .... 821.7 . ...... -2.29 . ...
1894-9'5 .... , ...... + 1.5 .... 842.8 . ...... + .17 . ... 1895-96 ........... - 10.5 .... 638.6 . ...... -1.64 . ... 1896-97 ........... + 4.G .... 535.1 . ...... + .87 . ... 1897-98 ........... + 9·5 .... 313.3 . ...... +3.03 . ... 1898-99 ........... + 2.3 .... 253.8 . ...... + .90 . ...
1899--0n ........... - 1.1 .... 551.7 . ...... - .2Or . ... 1900--01 ........... - 9.5 .... 610.2 . ...... -1.56 . ... 1901--02 ........... - . 8 .... 467.3 -. ...... .17 . ... 1902--03 ........... + 3.1 .... 380.5 . ...... + .83 . ... 1903--0'4 .... , ...... + 4.9 .... 277.5 . ...... +1.75 . ...
1904-05 ........... + 3.3 .... 268.4 . ...... +1.23 . ... 1905--06 ....... '" . - 2.6 .... 336.6 . ...... - .77 . ... 190G--07 ........... + 2.8 .... 434.1 . ...... + .64 . ... 1907-08 ........... - 5.4 - 27.5 412.6 1,846.4 -1.31 -1.49 1908-0B ........... + 11.2 + 43.5 379.1 1,447.5 +2.96 +3.01
1909-10 ........... + 1.4 + 11.8 255.7 1,489.8 + .53 + .7!J 1910-11 ........... - 6.6 - 31.G 384.4 1,782.9 -1.73 -1.77 1911-12 ........... + 7.1 + 20.2 -622.3 1,977.2 +1.14 +1.02 1912-1:) ........ " . - 5.5 - 25.Or 531.3 2,016.7 -1.04 -1.24 1913-14 ........... - 4.1 - 15.3 578.5 1,988.5 - .71 - .77
1!J14--15 ........... + 31.1 +118.8 530.3 2,150.1 +5.86 +5.52 1915-16 ........... - .8 + 5.8 4G5.7 2,161.2 - .18 + .27
1921-22 ........... - 1.6 + .1 4GO.4 2,OG8.0 - .34 .00 1922-23 ........... + 1.1 + 7.3 430.1 2,263.3 + .25 + .32 HJ2:3--24 ........... - .5 - 4.2 682.6 2,444.3 - .07 - .17 1924-25 ........... + 2!).8 + 95.5 7B7.1 2,5G2.5 +3.74 +3.73 1925--26 ........... + 8.3 + 43.2 431.1 2,19G.9 +1.93 +1.97
192G-27 ........... - 2.4 - 9.Or 615.8 2,311.9 - .40 - .39 1927-28 ........... - 3.8 - 16.8 802.8 2,432.1 - .47 - .G9 1928--29 ........... - 29.9 - 80.4 1,306.5 3,342.3 -2.29' -2.41 1929--30 ........... -102.4 -226.3 1,875.1 4,246.0 -5.4G -5·33
-h nata computed as dcscrilwd in Sections II and III above. Gains al'e preceded by a plus (+) sign, losses by a minus (-) sign. Dots ( ..•• ) indicate figures not calculated owing to lack of necessary data.
[ 436 ]

APPENDIX 437
TABLE Il.-EsTIMATED UNITED STATES MARKETINGS OF WHEAT BY FARMEllS, MONTHLY, JULY 1907 TO
JUNE 1916 AND JULY 1921 TO .TUNE 1930* (Million bushels)
7tiJ°i~J~~~ .July 1 Aug.l Sept. 11 Oet.l I Nov. 1 Dec. I I.Jan. 1 I Feb. liMaI'. I Apr. 11 May 1 I.Junl' 1 I 'rota I ---------- ---------1--1---- --I--I--i--
](.107-08 .............. 49.1 76.4 87.3 7G.4 43.6 43.(i 1 38.2122.4 I 32.7 22.412(i.712G.7 1 545·G 1!WS-09' .............. 82.8 72.2 89.4 66.7 5fi.1 44.4! 27.8 33.3 27.8 22.8 1fi.1 Hi.1,5.5.5.5 l!JO!HO .............. 58.1 69.1 98.7 92.9 58.1 46.5 I 34.8 28.5 28·5 18.0 I 23.8 I 23.8 '580.7 1910-11.............. 66.2 91.8 79.0 fi3.4 4G.2 44.5 33.4 24·5 2G.7 20.6 I 28.4 i 31.7 .55fi.1 191H2 .............. 85.7 79.7 88.4 G9.0 4.5.3 34.5 I 30·7 2!J.1 19.9 18·3 I!}.!) I 18.3 538.8 1!J12-13.............. 53.7 87.3 103.7 102.4 (i8.3 5446 .. 41 II ·4370·. 9G 31.0 22.1 22.1 i 24.7 1 24.7 fi32.3 1!J13-14 .............. 98.9 81.3 8G.8 77.7 58.8 29.1 25.5 17.(i I 21.2 23.1 60(i.7 1!Jl4-15 .............. 136.9 103.2 121.2 97.8 80.G 58.7: 39.9 44.G 25.8 3G.0 II 21.1 Hi.4 782.1 UJl5-1fi.............. 59.4 92.0 120.6 121.3 103.7 92.0 1 56.9 56.9 31.8 32.6 39·3 30.1 836.5
1!J21-22 ............. . 1!J22-23 ......... " .. . 1923-24 ............. . 1924-25 ............. . 1925-26 .... , ........ . 1926-27 ............. . 1927-28 ............. . 1928-2!J. ........ " .. . 1929-30 ............. .
r
143.0 136.31122.8 79.4 50.9 40.4 j 33.0 36.7 29.2 24.0! 26·2 104.7 122.4 100.4 84.9, 60.8 52.3 I 38.9 36.1 30.4 2(j.2 24.0 81.8 107·5 102.0 83.6 58.0 37.9, 28.1 2!J.3 20.1 17.7 22.6 96.4 140.3 124.0 102.8 61.0 39.7 I 37.6 29.8 17.7 11.3 22.0 84.6 107.8 108.3
1
63.2 49.9 40.6 I 27.3 23.2 17.4 17.4 1G.8 155.0 144.3 93.8 71.1 41.2 3.5.5 I 32.7 32.7 25·6 17.1 22.7 110.4 133.4 140.5 90.3 55.2 40.2! 32.3 29.4 27.2 17.9 17.9 134.0 139.2 127.3 I 86.81 52.4 40.4! 28.4 32.2 25.5 18.7 19.5 182.6 160.1 92.3! 5.5.4 30.8 30.8! 20.5 19.2 15.7 1G.4 17.8
27.0 2G.2 22.0 26.2 23.2 39.1 22.2 44.2 42.4
748.9 707.3 GI0.G 708.8 579·7 710.9 717.0 748.6 684.1
'. Total marketings for each crop year are estimated from the relatively accurate data on disposition. They are taken as equal to wheat requirement for domestic flour consumption, plus net exports and shipments to possessions of wheat and of flour as wheat, plus increases in total commercial stocks of wheat or minus decreases in commercial stocks. This method results in omitting such relatively minor quantities of wheat as are marketed and used as feed or as seed by other farmers, or for commercial purposes other than mi lling. Crop year totals are distributed among the months on the basis of estimates of percentages marketed monthly, as publisbed by the United States Department of Agriculture.
TABLE IlL-ApPROXIMATE TOTAL COMMERCIAL STOCKS OF WHEAT AND OF FLOUR AS WHEAT IN THE
UNITED STATES, MONTHLY, JULY 1907 TO JULY 1916 AND JULY 1921 TO JULY 1930*
Crop year .July-,June
(Million bllshels)
July 1 Aug.1 Sept. 1 I Oct. 1 Nov. 1 Dec. '1 I.ron. 1 I Feb. liMaI'. 1 Apr. 1 May 1 .rnn~ 1
1907-0'8 ..................... 136.7 140.5 167.7 -;~ 220.4 205.7' 187.1 ~;;1142.; 127.1 103.-';-~~ 1908-09........ ...... ....... 62.3 97.8 114.5 147.7 157.8 164.2 158.4 13!).51131.9 115.3 97.0 69.6 1909-10 ..................... 45.4 59.5 SO.1 127.9 1G7.2 173.9 171.5 161.8 1151.2 136.5 111.0 90.3 1910-11 ..................... 72.7 96.0 143.1 177.5 193.6 194.6 l!Jl.2 177.8,161.6 142.9 119.8 102.5 19l1-12.. ........ ........... 91.9 131.3 160.6 199.4 219.5 21!J·G 206·2 190.91178.9 152·9 127.8 103.8 1912-13.. ................... 80.7 91.2 129.2 177.0 218.2 231·1 230.7 214.7 200.1 173.0 145.3 118.4 1913-14 ..................... 95.0 140.2 152.4 182.3 206.3 216.1 210.9 201.8[186.8 164.7 135.7 105.1 1914-15 ..................... 77.3 142.8 177.2 22G.9 257.7 272.5 252.7 219.2· 1!J5·1 151.3 118.1 77.6 1915-1G..................... 41}.7 47.1 77.9 132.5 190.4 2:35.4 2G5.8 260.7 259.5 225·9 19G.1 173.7 HJl(j-17 .................... .
1!J21-22 .................... . 1!J22-23 .................... . HJ23-24 .................... . 1924-25 .................... . 1!l25-26 .................... . 192(j-27 ................... .. 1927-28 .................. " . HI28-29 .................... . 1929-aO .................... . 1930-31 .................... .
151.6
67.3 84.6
116.1 115.0 87.6 78.0 85.8
104.3 201.5 228.2
140.8 133.3 14G·1 164.0 121.9 171.7 141.5 19().0 327.6
170.5 177.8 193.4 242.2 176.3 239.0 20'1.3 273.0 427.0
215.8 208.5 234.5 287.5 232.0 2G2.3 264.0 337.3 458.7
231.1 230.7 261.2 295·9 2'17 .0 268.9 276.5 354.2 455.5
225.G 2:38.3 272.6 282.3 249.8 251.1 26.5.2 351·2 429.3
213.4 23G.G 259.4 257.1 241.7 231.1 252.1 337.3 404.9
UJ5.2 22.3.1 237.2 241.0 222.4 209.4 230.2 315.7 3G8.3
185.5 211.2 221.!) 223.6 203.3 196.2 215·7 301.7 340.0
163.1 191.0 194.3 183.9 171.7 170.4 194.0 27G.1 306.8
138.7 171.0 16G.1 143.2 142.2 131.5 162.8 245.6 274.2
112.3 1-U.4 142.0 111.9 105.8 98.4
130.8 207.3 2:38.9
• Estimated as described In Section III above. The estimates omit the minor elements of wheat in commercial stocks hut destined for use as seed or as feed, 01' for commercial use other than milling, and the wheat <'qui"alcnt of the low .Iuly 1 flour stocks. They omit also Canadian wheat in transit or held in bond-that is, not induded in either import 01' export statistics-but include wheat withdrawll for milling in bond.
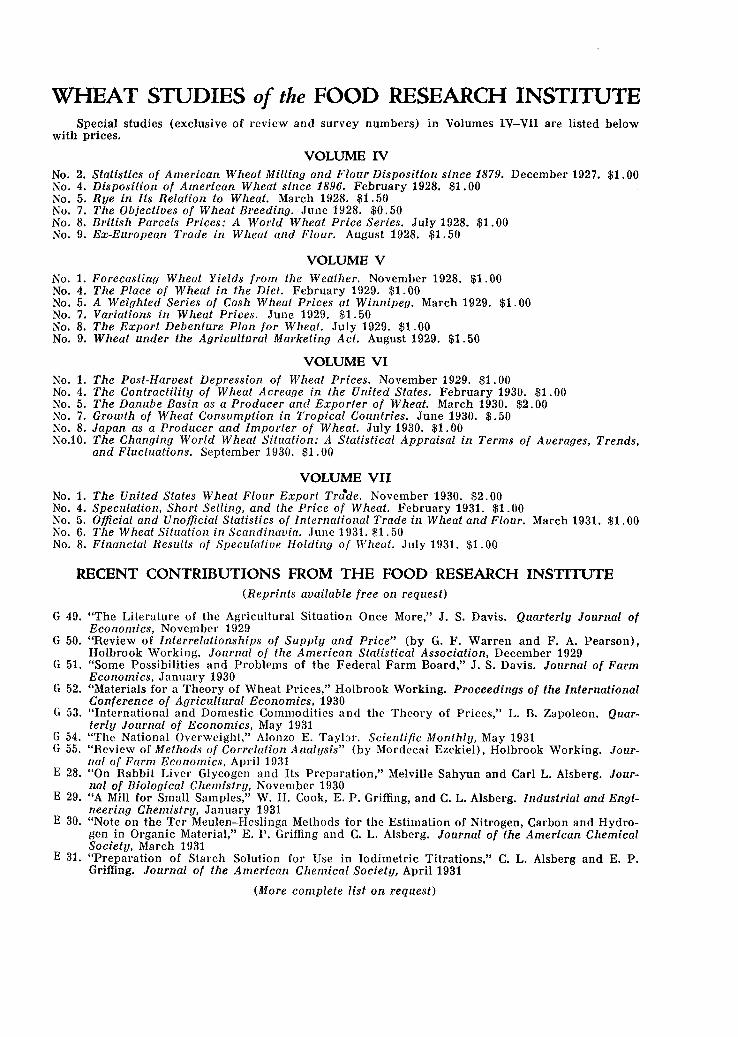
WHEAT STUDIES of the FOOD RESEARCH INSTITUTE Special studies (exclusive of review and survey numbers) in Volumes IV-VII are listed below
with prices.
VOLUME IV No.2. Statistics of American Wheat Milling and Flour Disposition since 1879. December 1927. $1.00 No.4. Disposition of American Wheat since 1896. February 1928. $1. 00 No.5. Rye in Its Relation to Wheat. March 1928. $1.50 No.7. The Objectives of Wheat Breeding. June 1928. $0.50 No.8. BI·itisil Parcels Prices: A World Wileat Price Series. July 1928. $1.00 No.9. Ex-European Trade in Wileat and Flour. August 1928. $1. 50
VOLUME V No. 1. Forecasting Wheat Yields from the Weatiler. November 1928. $1.00 No.4. The Place of Wheat in tile Diet. February 1929. $1.00 No.5. A Weigizted Series of Cash Wheat Prices at Winnipeg. March 1929. $1.00 No.7. Variations in Wileat Prices. June 1929. $1.50 No.8. The Export Debenture Plan for Wheat. July 1929. $1.00 No.9. Wheat under the Agricultural Marketing Act. August 1929. $1.50
VOLUME VI No. 1. The Post-Harvest Depression of Wileat Prices. November 1929. $1.00 No.4. Tile Contractility of W ileat Acreage in tile United States. February 1930. $1. 00 No.5. Tile Danube Basin as a Producer and Exporter of Wheat. March 1930. $2.00 No.7. Growth of Wileat Consumption in Tropical Countries. June 1930. $.50 No.8. Japan as a Producer and Importer of Wheat. July 1930. $1.00 No.10. The Changing World Wheat Situation: A Statistical Appraisal in Terms of Averages, Trends,
and Fluctuations. September 1930. $1.00
VOLUME VII No. 1. Tile United States Wheat Flour Export Tra·de. November 1930. $2.00 No.4. Speculation, Silort Selling, and tile Price of Wheat. February 1931. $1.00 No.5. Official and Unofficial Statistics of International Trade in Wheat and Flour. March 1931. $1.00 No.6. The Wheat Situation in Scandinavia. June 1931. $1.50 No.8. Financial Results of Speculative Holding ot Wheat. July 1931. $1.00
RECENT CONTRIBUTIONS FROM THE FOOD RESEARCH INSTITUTE (Reprints available free on request)
G 49. "The Literature of the Agricultural Situation Once More," J. S. Davis. Quarterly Journal of Economics, November 1929
G 50. "Review of Interrelationships of Supply and Price" (by G. F. Warren and F. A. Pearson), Holbrook Working. Journal of tile American Statistical Association, December 1929
G 51. "Some Possibilities and Problems of the Federal Farm Board," J. S. Davis. Journal of Farm Economics, January 1930
G 52. "Materials for a Theory of Wheat Prices," Holbrook Working. Proceedings of the International Conference of Agricultural Economics, 1930
G 53. "Intel'llational and Domestic Commodities a nd the Theory of Prices," L. B. Zapoleon. Quarterly Journal of Economics, May 1931
G 54. "The National Overweight," Alonzo E. Taylor. Scientific Monthly, May 1931 G 55. "Review of Methods of Correlation Analysis" (by Mordecai Ezekiel), Holbrook Working. Jour
nal of Farm Economics, April 1931 E 28. "On Rabbit Liver Glycogen and Its Preparation," Melville Sahyun and Carl L. Alsberg. Jour
nal of Biological Cilemistry, November 1930 E 29. "A Mill for Small Samples," W. H. Cook, E. P. Griffing, and C. L. Alsberg. Industrial and Engi
neerilzg Chemistry, January 1931 E 30. "Note on the Tel' Meulen-Heslinga Methods for the Estimation of Nitrogen, Carbon and Hydro
gen in Ol'ganic Material," E. P. Griffing and C. L. Alsberg. Journal of the American Cilemical Society, March 1931
E 31. "Preparation of Starch Solution for Use in Iodimetric Titrations," C. L. Alsberg and E. P. Griffing. Journal of the American Chemical Society, April 1931
(More complete list on request)
FOOD RESEARCH INSTITUTE PUBLICATIONS
WHEAT STUDIES Each volume contains a comprehensive review of the world wheat situation during the preceding crop year (price, $2.00), three surveys of current developments (price, $1.00 each), and six special studies (variously priced, see inside back cover).
Vol. I. December 1924-September 1925. 375 pages, bound in red buckram. Price $10.00 Vol. II. November 1925-September 1926. 367 pages, bound in red buckram. Price $10.00 Vol. III. November 1926-September 1927. 467 pages, bound in red buckram. Price $10.00 Vol. IV. November 1927-September 1928. 404 pages, bound in red buckram. Price $10.00 Vol. V. November 1928-September 1929. 481 pages, bound in red buckram. Price $10.00 Vol. VI. November 1929-September 1930. 476 pages, bound in red buckram. Price $10.00 Vol. VII. November 1930-September 1931. Ten issues. Subscription, including temporary binder,
$10.00
FATS AND OILS STUDIES A series of studies in fats and oils of animal and vegetable origin, dealing primarily with economic aspects-production, trade, prices, and utilization-but with due reference to technical knowledge.
No. 1. The Fl1-ts and Oils: A General View. By C. L. Alsberg and A. E. Taylor. February 1928. 103pp., 8vo. Cloth, $1.50; paper, $1.00
No.2. Copra and Coconut Oil. By Katharine Snodgrass. April 1928. 135 pp., 8vo. Cloth, $2.00; paper, $1.50
No.3. Inedible Animal Fats in lhe United Slates.- By L. B. Zapoleon. December 1929. 353 pp., 8vo. Cloth, $4.00
No.4. Margarine as a Butler Substitule. By Katharine Snodgrass. December 1930. 333 pp., 8vo. Cloth, $3.00
MISCELLANEOUS PUBLICATIONS No. 1. Stale Bread Loss as a Problem of the Baking Industry. By J. S. Davis and Wilfred Eldred.
February 1923. 70 pp., 8vo. Paper, $.50
No.2. The American Baking Industry, 1849-1923, as Shown in the Celis us Reporls. By Hazel Kyrk and J. S. Davis. September 1925. 108 pp., 8vo. Cloth, $1.50; paper, $1.00
No.3. Combination in the American Bread-Baking Industru, WitJl Some Observatiom on the Mergers of 1924-25. By C. L. Alsberg .• January 1926. 148 pp., 8vo. Cloth, $2.00; paper, $1.50
No.4. Farm Cost Studies in the United Stales: Their Development, Applications, and Limitations. By M. K. Bennett. June 1928. 289 pp., 8vo. Cloth, $3.50
No.5. The Farm Export Debenture Plan. By J. S. Davis. December 1929. 274 pp., 8vo. Cloth, $3.00
For subscriptions, completed volumes, and individual publications, address
FOOD RESEARCH INSTITUTE STANFORD UNIVERSITY, CALIFORNIA
EUROPEAN SALES AGENTS
GREAT BRITAIN: P. S. KING & SON, LTD., 14, Great Smith Street, Westminster, S.W. 1, London CONTINENTAL EUROPE: MARTINUS NIJHOFF, 9 Lange Voorhout, The Hague, Holland.