Wheat Outlook · Exports. Sources: USDA, National Agricultural Statistics Servic e . Quic kstats...
25
Wheat Outlook Jennifer K. Bond Olga Liefert 0 200 400 600 800 1000 1200 1400 1600 0 500 1,000 1,500 2,000 2,500 3,000 Winter Durum Other Spring Exports Sources: USDA, National Agricultural Statistics Service Quickstats database and the World Agricultural Supply and Demand Estimates. U.S. 2019/20 all-wheat production raised while competitors are cut, boosting U.S. exports This month, USDA-National Agricultural Statistical Service (NASS) released survey-based projections of U.S. wheat by all classes for the 2019/20 marketing year, which resulted in an 18.3 million bushel increase in all-wheat production for USDA’s July 2019 WASDE report (fig. 1). Production gains are offset by reduced carry-in from 2018/19, lowered from June on data contained in the USDA-NASS Grain Stocks report. Despite a net reduction in supplies, month-to-month, exportable U.S. wheat supplies are forecast to remain abundant for 2019/20. U.S. export prospects are further brightened due to reduced production forecasts for several key competitors: the European Union (EU) (-2.5 million metric tons), Ukraine (-1.0 million), Australia (-1.5 million), Canada (-1.0 million), and Russia (-3.8 million). Projected exports were reduced in three of these countries: Australia, Russia, and Ukraine. Figure 1: U.S. exports rise on abundant exportable supplies and reduced competition Mil. bushels Economic Research Service | Situation and Outlook Report Next release is August 14, 2019 WHS-19g | July 15, 2019 In this report: - Domestic Outlook - International Outlook
Transcript of Wheat Outlook · Exports. Sources: USDA, National Agricultural Statistics Servic e . Quic kstats...
Wheat Outlook Jennifer K. Bond Olga Liefert
0
200
400
600
800
1000
1200
1400
1600
0
500
1,000
1,500
2,000
2,500
3,000 Winter Durum Other Spring Exports
Sources: USDA, National Agricultural Statistics Service Quickstats database and the World Agricultural Supply and Demand Estimates.
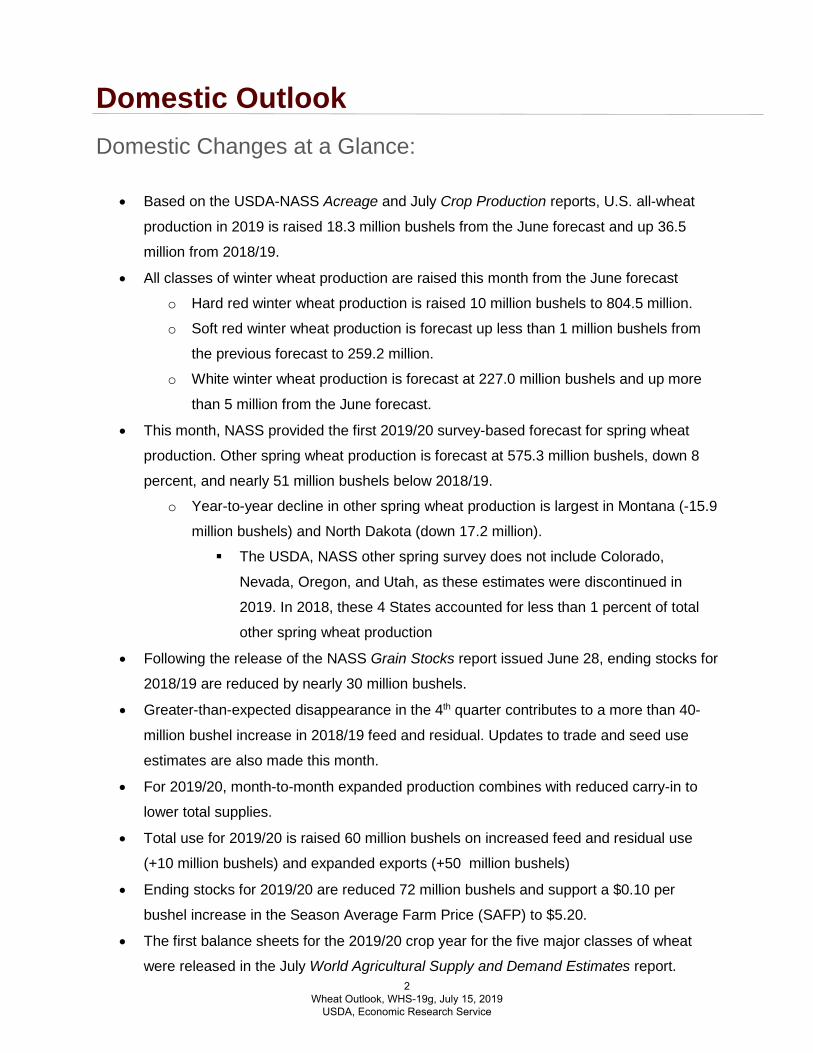
U.S. 2019/20 all-wheat production raised while competitors are cut, boosting U.S. exports
This month, USDA-National Agricultural Statistical Service (NASS) released survey-based projections
of U.S. wheat by all classes for the 2019/20 marketing year, which resulted in an 18.3 million bushel
increase in all-wheat production for USDA’s July 2019 WASDE report (fig. 1). Production gains are
offset by reduced carry-in from 2018/19, lowered from June on data contained in the USDA-NASS
Grain Stocks report. Despite a net reduction in supplies, month-to-month, exportable U.S. wheat
supplies are forecast to remain abundant for 2019/20. U.S. export prospects are further brightened due
to reduced production forecasts for several key competitors: the European Union (EU) (-2.5 million
metric tons), Ukraine (-1.0 million), Australia (-1.5 million), Canada (-1.0 million), and Russia (-3.8
million). Projected exports were reduced in three of these countries: Australia, Russia, and Ukraine.
Figure 1: U.S. exports rise on abundant exportable supplies and reduced competitionMil. bushels
Economic Research Service | Situation and Outlook Report
Next release is August 14, 2019 WHS-19g | July 15, 2019
In this report: - Domestic Outlook- International Outlook
Domestic Outlook Domestic Changes at a Glance:
• Based on the USDA-NASS Acreage and July Crop Production reports, U.S. all-wheat
production in 2019 is raised 18.3 million bushels from the June forecast and up 36.5
million from 2018/19.
• All classes of winter wheat production are raised this month from the June forecast
o Hard red winter wheat production is raised 10 million bushels to 804.5 million.
o Soft red winter wheat production is forecast up less than 1 million bushels from
the previous forecast to 259.2 million.
o White winter wheat production is forecast at 227.0 million bushels and up more
than 5 million from the June forecast.
• This month, NASS provided the first 2019/20 survey-based forecast for spring wheat
production. Other spring wheat production is forecast at 575.3 million bushels, down 8
percent, and nearly 51 million bushels below 2018/19.
o Year-to-year decline in other spring wheat production is largest in Montana (-15.9
million bushels) and North Dakota (down 17.2 million).
The USDA, NASS other spring survey does not include Colorado,
Nevada, Oregon, and Utah, as these estimates were discontinued in
2019. In 2018, these 4 States accounted for less than 1 percent of total
other spring wheat production
• Following the release of the NASS Grain Stocks report issued June 28, ending stocks for
2018/19 are reduced by nearly 30 million bushels.
• Greater-than-expected disappearance in the 4th quarter contributes to a more than 40-
million bushel increase in 2018/19 feed and residual. Updates to trade and seed use
estimates are also made this month.
• For 2019/20, month-to-month expanded production combines with reduced carry-in to
lower total supplies.
• Total use for 2019/20 is raised 60 million bushels on increased feed and residual use
(+10 million bushels) and expanded exports (+50 million bushels)
• Ending stocks for 2019/20 are reduced 72 million bushels and support a $0.10 per
bushel increase in the Season Average Farm Price (SAFP) to $5.20.
• The first balance sheets for the 2019/20 crop year for the five major classes of wheat
were released in the July World Agricultural Supply and Demand Estimates report.2
Wheat Outlook, WHS-19g, July 15, 2019 USDA, Economic Research Service
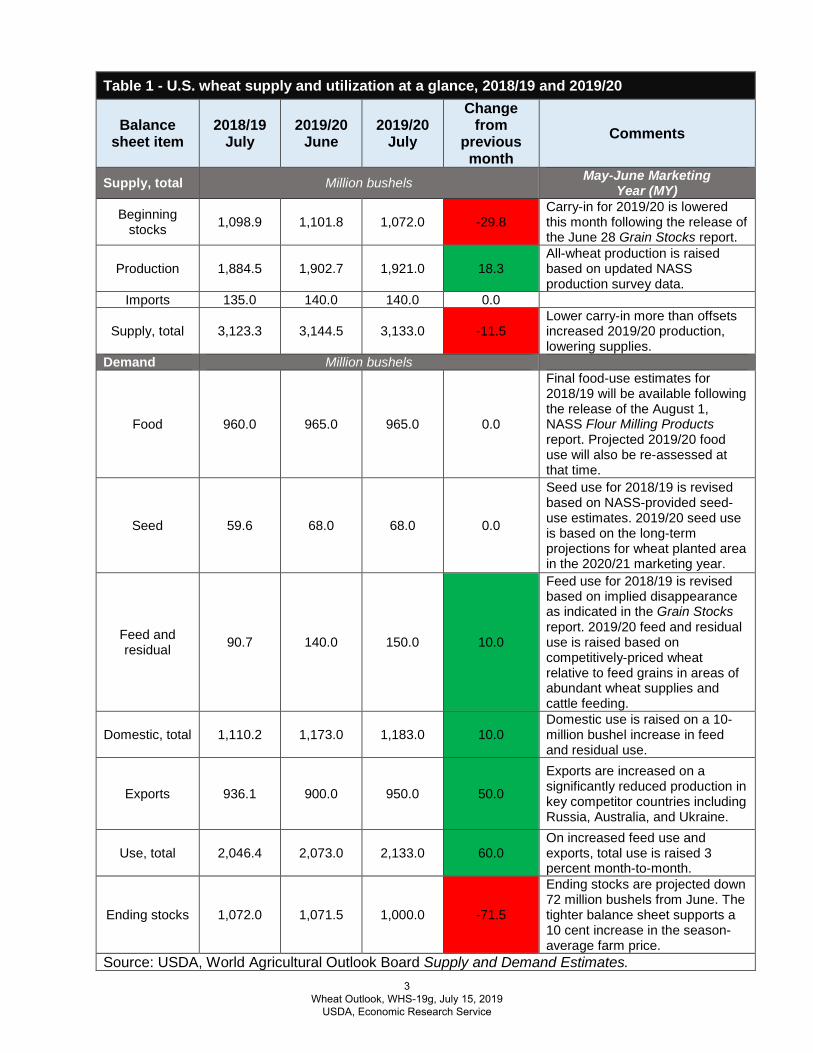
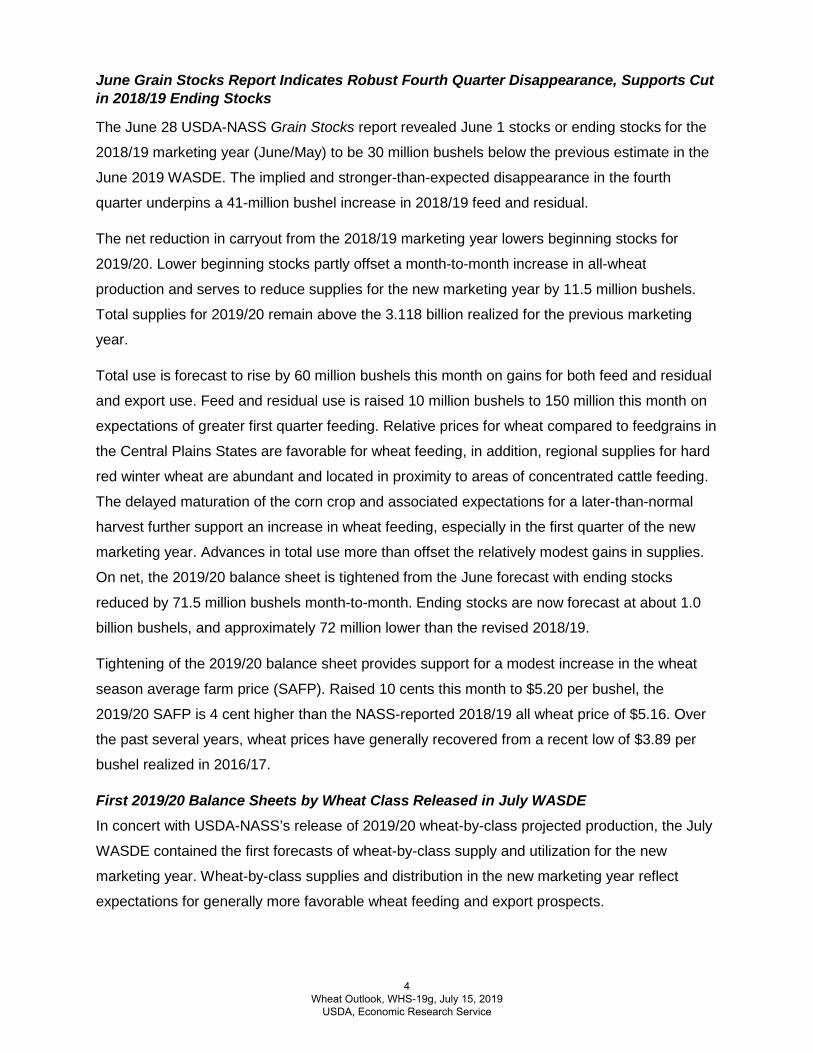
Table 1 - U.S. wheat supply and utilization at a glance, 2018/19 and 2019/20
Balance sheet item
2018/19 July
2019/20 June
2019/20 July
Change from
previous month
Comments
Supply, total Million bushels May-June Marketing Year (MY)
Beginning stocks 1,098.9 1,101.8 1,072.0 -29.8
Carry-in for 2019/20 is lowered this month following the release of the June 28 Grain Stocks report.
Production 1,884.5 1,902.7 1,921.0 18.3 All-wheat production is raised based on updated NASS production survey data.
Imports 135.0 140.0 140.0 0.0
Supply, total 3,123.3 3,144.5 3,133.0 -11.5Lower carry-in more than offsets increased 2019/20 production, lowering supplies.
Demand Million bushels
Food 960.0 965.0 965.0 0.0
Final food-use estimates for 2018/19 will be available following the release of the August 1, NASS Flour Milling Products report. Projected 2019/20 food use will also be re-assessed at that time.
Seed 59.6 68.0 68.0 0.0
Seed use for 2018/19 is revised based on NASS-provided seed-use estimates. 2019/20 seed use is based on the long-term projections for wheat planted area in the 2020/21 marketing year.
Feed and residual 90.7 140.0 150.0 10.0
Feed use for 2018/19 is revised based on implied disappearance as indicated in the Grain Stocks report. 2019/20 feed and residual use is raised based on competitively-priced wheat relative to feed grains in areas of abundant wheat supplies and cattle feeding.
Domestic, total 1,110.2 1,173.0 1,183.0 10.0 Domestic use is raised on a 10-million bushel increase in feed and residual use.
Exports 936.1 900.0 950.0 50.0
Exports are increased on a significantly reduced production in key competitor countries including Russia, Australia, and Ukraine.
Use, total 2,046.4 2,073.0 2,133.0 60.0 On increased feed use and exports, total use is raised 3 percent month-to-month.
Ending stocks 1,072.0 1,071.5 1,000.0 -71.5
Ending stocks are projected down 72 million bushels from June. The tighter balance sheet supports a 10 cent increase in the season-average farm price.
Source: USDA, World Agricultural Outlook Board Supply and Demand Estimates. 3
Wheat Outlook, WHS-19g, July 15, 2019 USDA, Economic Research Service
June Grain Stocks Report Indicates Robust Fourth Quarter Disappearance, Supports Cut in 2018/19 Ending Stocks
The June 28 USDA-NASS Grain Stocks report revealed June 1 stocks or ending stocks for the
2018/19 marketing year (June/May) to be 30 million bushels below the previous estimate in the
June 2019 WASDE. The implied and stronger-than-expected disappearance in the fourth
quarter underpins a 41-million bushel increase in 2018/19 feed and residual.
The net reduction in carryout from the 2018/19 marketing year lowers beginning stocks for
2019/20. Lower beginning stocks partly offset a month-to-month increase in all-wheat
production and serves to reduce supplies for the new marketing year by 11.5 million bushels.
Total supplies for 2019/20 remain above the 3.118 billion realized for the previous marketing
year.
Total use is forecast to rise by 60 million bushels this month on gains for both feed and residual
and export use. Feed and residual use is raised 10 million bushels to 150 million this month on
expectations of greater first quarter feeding. Relative prices for wheat compared to feedgrains in
the Central Plains States are favorable for wheat feeding, in addition, regional supplies for hard
red winter wheat are abundant and located in proximity to areas of concentrated cattle feeding.
The delayed maturation of the corn crop and associated expectations for a later-than-normal
harvest further support an increase in wheat feeding, especially in the first quarter of the new
marketing year. Advances in total use more than offset the relatively modest gains in supplies.
On net, the 2019/20 balance sheet is tightened from the June forecast with ending stocks
reduced by 71.5 million bushels month-to-month. Ending stocks are now forecast at about 1.0
billion bushels, and approximately 72 million lower than the revised 2018/19.
Tightening of the 2019/20 balance sheet provides support for a modest increase in the wheat
season average farm price (SAFP). Raised 10 cents this month to $5.20 per bushel, the
2019/20 SAFP is 4 cent higher than the NASS-reported 2018/19 all wheat price of $5.16. Over
the past several years, wheat prices have generally recovered from a recent low of $3.89 per
bushel realized in 2016/17.
First 2019/20 Balance Sheets by Wheat Class Released in July WASDE In concert with USDA-NASS’s release of 2019/20 wheat-by-class projected production, the July
WASDE contained the first forecasts of wheat-by-class supply and utilization for the new
marketing year. Wheat-by-class supplies and distribution in the new marketing year reflect
expectations for generally more favorable wheat feeding and export prospects.
4 Wheat Outlook, WHS-19g, July 15, 2019
USDA, Economic Research Service
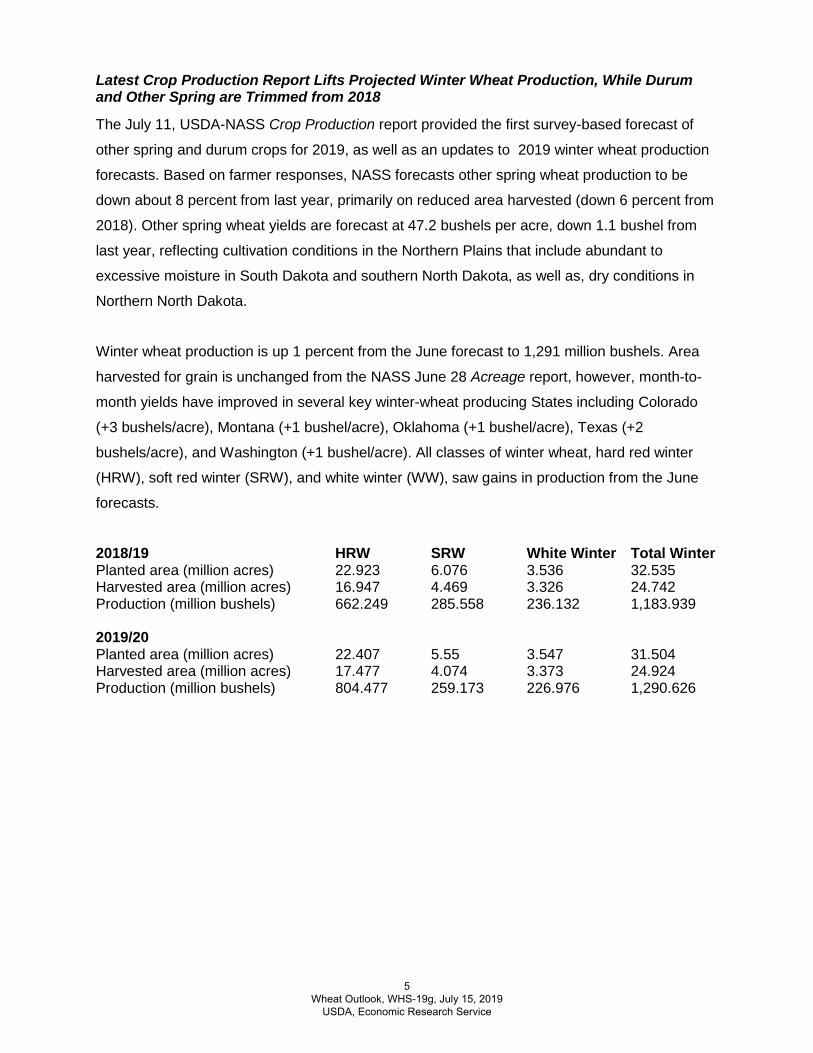
Latest Crop Production Report Lifts Projected Winter Wheat Production, While Durum and Other Spring are Trimmed from 2018
The July 11, USDA-NASS Crop Production report provided the first survey-based forecast of
other spring and durum crops for 2019, as well as an updates to 2019 winter wheat production
forecasts. Based on farmer responses, NASS forecasts other spring wheat production to be
down about 8 percent from last year, primarily on reduced area harvested (down 6 percent from
2018). Other spring wheat yields are forecast at 47.2 bushels per acre, down 1.1 bushel from
last year, reflecting cultivation conditions in the Northern Plains that include abundant to
excessive moisture in South Dakota and southern North Dakota, as well as, dry conditions in
Northern North Dakota.
Winter wheat production is up 1 percent from the June forecast to 1,291 million bushels. Area
harvested for grain is unchanged from the NASS June 28 Acreage report, however, month-to-
month yields have improved in several key winter-wheat producing States including Colorado
(+3 bushels/acre), Montana (+1 bushel/acre), Oklahoma (+1 bushel/acre), Texas (+2
bushels/acre), and Washington (+1 bushel/acre). All classes of winter wheat, hard red winter
(HRW), soft red winter (SRW), and white winter (WW), saw gains in production from the June
forecasts.
2018/19 HRW SRW White Winter Total Winter Planted area (million acres) 22.923 6.076 3.536 32.535 Harvested area (million acres) 16.947 4.469 3.326 24.742 Production (million bushels) 662.249 285.558 236.132 1,183.939
2019/20 Planted area (million acres) 22.407 5.55 3.547 31.504 Harvested area (million acres) 17.477 4.074 3.373 24.924 Production (million bushels) 804.477 259.173 226.976 1,290.626
5 Wheat Outlook, WHS-19g, July 15, 2019
USDA, Economic Research Service
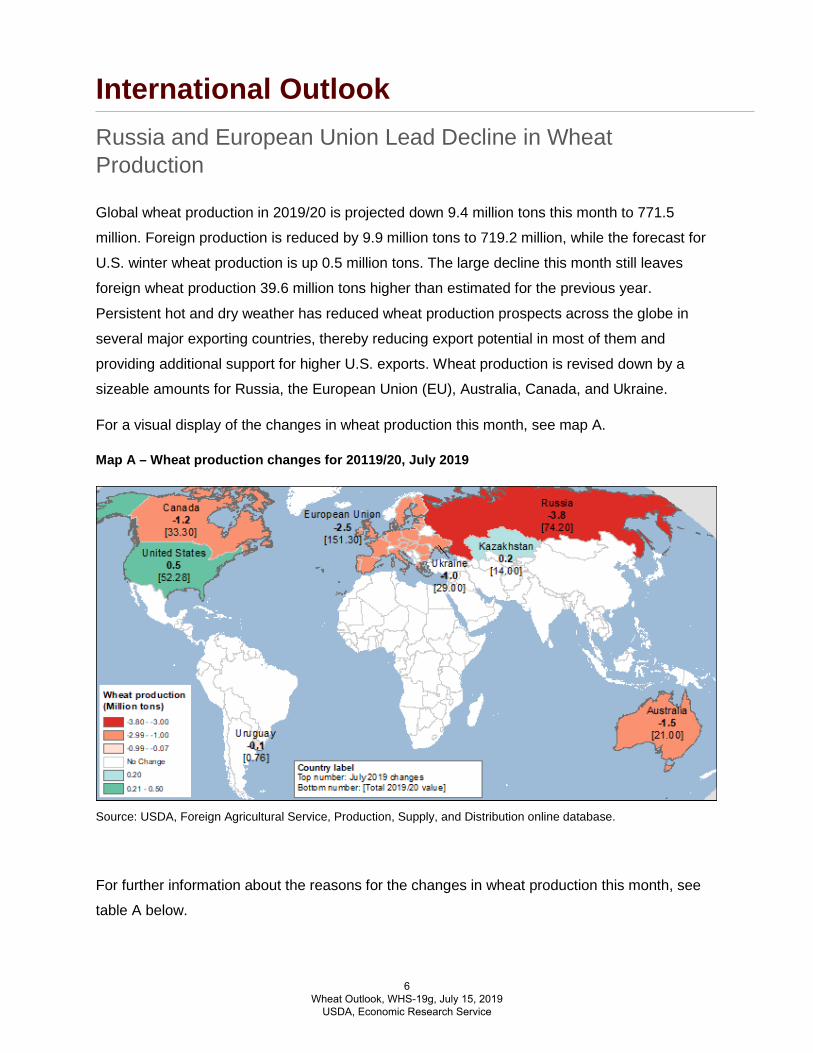
International Outlook Russia and European Union Lead Decline in Wheat Production
Global wheat production in 2019/20 is projected down 9.4 million tons this month to 771.5
million. Foreign production is reduced by 9.9 million tons to 719.2 million, while the forecast for
U.S. winter wheat production is up 0.5 million tons. The large decline this month still leaves
foreign wheat production 39.6 million tons higher than estimated for the previous year.
Persistent hot and dry weather has reduced wheat production prospects across the globe in
several major exporting countries, thereby reducing export potential in most of them and
providing additional support for higher U.S. exports. Wheat production is revised down by a
sizeable amounts for Russia, the European Union (EU), Australia, Canada, and Ukraine.
For a visual display of the changes in wheat production this month, see map A.
Map A – Wheat production changes for 20119/20, July 2019
Source: USDA, Foreign Agricultural Service, Production, Supply, and Distribution online database.
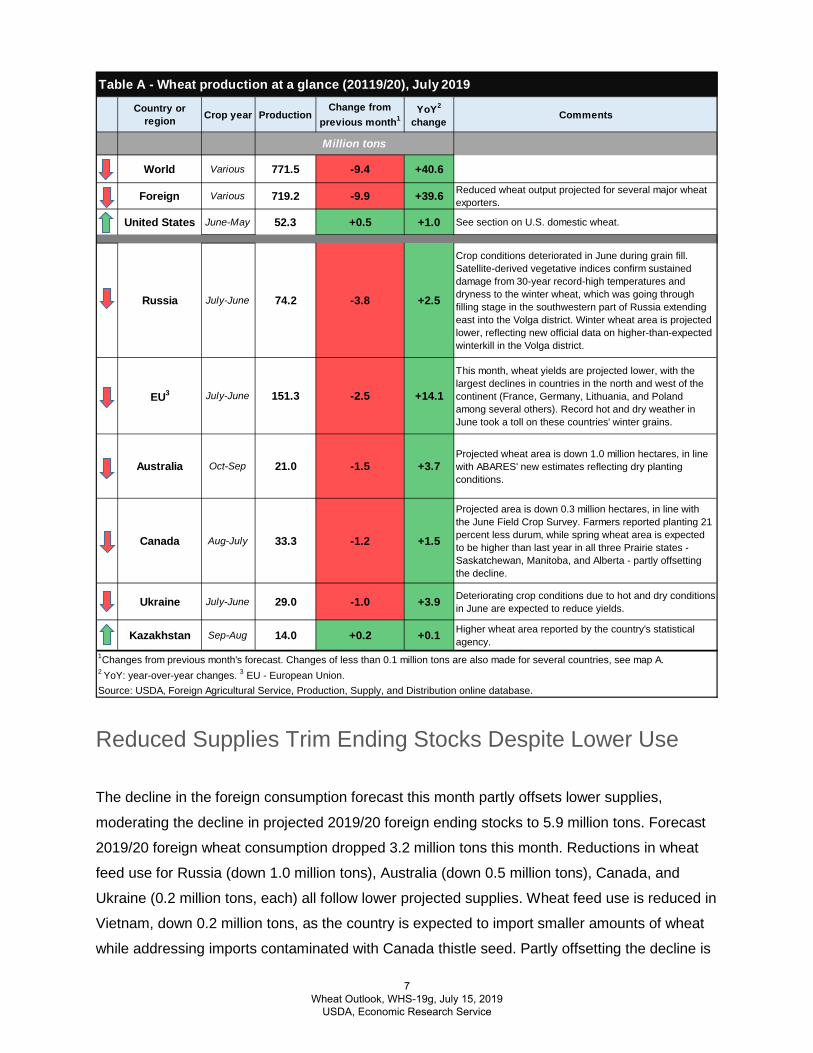
For further information about the reasons for the changes in wheat production this month, see
table A below.
6 Wheat Outlook, WHS-19g, July 15, 2019
USDA, Economic Research Service
Reduced Supplies Trim Ending Stocks Despite Lower Use
The decline in the foreign consumption forecast this month partly offsets lower supplies,
moderating the decline in projected 2019/20 foreign ending stocks to 5.9 million tons. Forecast
2019/20 foreign wheat consumption dropped 3.2 million tons this month. Reductions in wheat
feed use for Russia (down 1.0 million tons), Australia (down 0.5 million tons), Canada, and
Ukraine (0.2 million tons, each) all follow lower projected supplies. Wheat feed use is reduced in
Vietnam, down 0.2 million tons, as the country is expected to import smaller amounts of wheat
while addressing imports contaminated with Canada thistle seed. Partly offsetting the decline is
Country or region Crop year Production
Change from previous month1
YoY2
changeComments
World Various 771.5 -9.4 +40.6
Foreign Various 719.2 -9.9 +39.6 Reduced wheat output projected for several major wheat exporters.
United States June-May 52.3 +0.5 +1.0 See section on U.S. domestic wheat.
Russia July-June 74.2 -3.8 +2.5
Crop conditions deteriorated in June during grain fill. Satellite-derived vegetative indices confirm sustained damage from 30-year record-high temperatures and dryness to the winter wheat, which was going through filling stage in the southwestern part of Russia extending east into the Volga district. Winter wheat area is projected lower, reflecting new official data on higher-than-expected winterkill in the Volga district.
EU3 July-June 151.3 -2.5 +14.1
This month, wheat yields are projected lower, with the largest declines in countries in the north and west of the continent (France, Germany, Lithuania, and Poland among several others). Record hot and dry weather in June took a toll on these countries' winter grains.
Australia Oct-Sep 21.0 -1.5 +3.7Projected wheat area is down 1.0 million hectares, in line with ABARES' new estimates reflecting dry planting conditions.
Canada Aug-July 33.3 -1.2 +1.5
Projected area is down 0.3 million hectares, in line with the June Field Crop Survey. Farmers reported planting 21 percent less durum, while spring wheat area is expected to be higher than last year in all three Prairie states - Saskatchewan, Manitoba, and Alberta - partly offsetting the decline.
Ukraine July-June 29.0 -1.0 +3.9 Deteriorating crop conditions due to hot and dry conditions in June are expected to reduce yields.
Kazakhstan Sep-Aug 14.0 +0.2 +0.1 Higher wheat area reported by the country's statistical agency.
1Changes from previous month's forecast. Changes of less than 0.1 million tons are also made for several countries, see map A.2 YoY: year-over-year changes. 3 EU - European Union.Source: USDA, Foreign Agricultural Service, Production, Supply, and Distribution online database.
Million tons
Table A - Wheat production at a glance (20119/20), July 2019
7 Wheat Outlook, WHS-19g, July 15, 2019
USDA, Economic Research Service
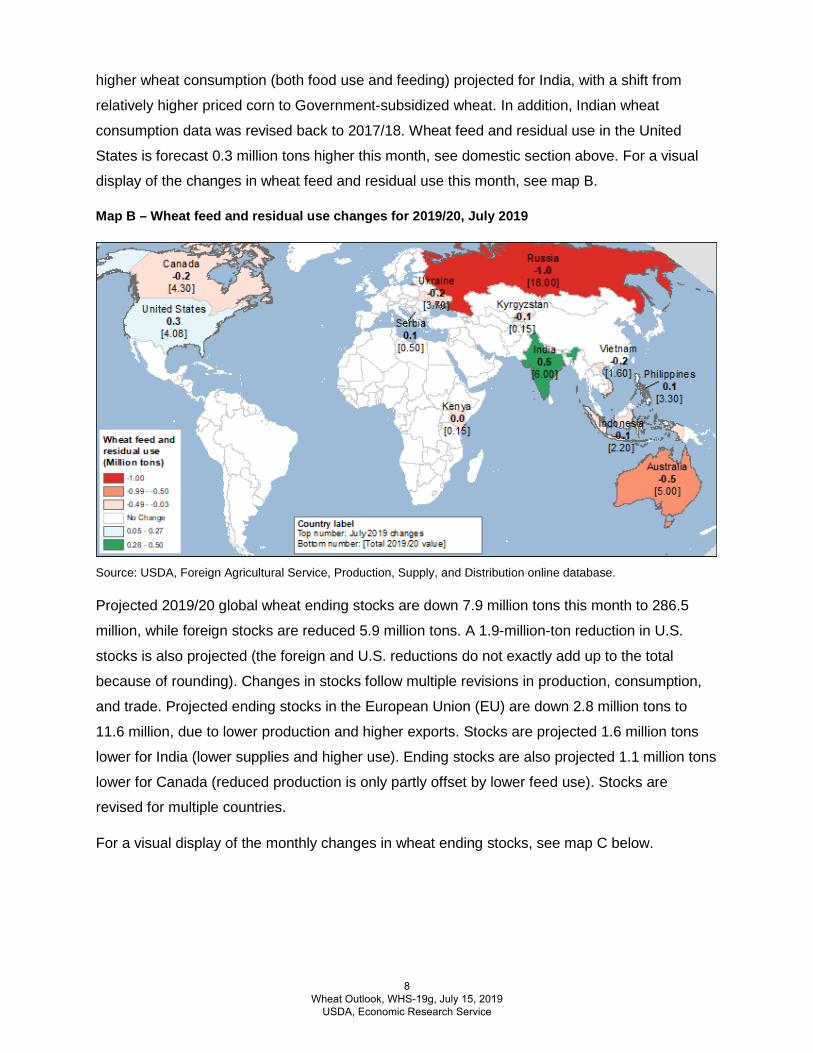
higher wheat consumption (both food use and feeding) projected for India, with a shift from
relatively higher priced corn to Government-subsidized wheat. In addition, Indian wheat
consumption data was revised back to 2017/18. Wheat feed and residual use in the United
States is forecast 0.3 million tons higher this month, see domestic section above. For a visual
display of the changes in wheat feed and residual use this month, see map B.
Map B – Wheat feed and residual use changes for 2019/20, July 2019
Source: USDA, Foreign Agricultural Service, Production, Supply, and Distribution online database.
Projected 2019/20 global wheat ending stocks are down 7.9 million tons this month to 286.5
million, while foreign stocks are reduced 5.9 million tons. A 1.9-million-ton reduction in U.S.
stocks is also projected (the foreign and U.S. reductions do not exactly add up to the total
because of rounding). Changes in stocks follow multiple revisions in production, consumption,
and trade. Projected ending stocks in the European Union (EU) are down 2.8 million tons to
11.6 million, due to lower production and higher exports. Stocks are projected 1.6 million tons
lower for India (lower supplies and higher use). Ending stocks are also projected 1.1 million tons
lower for Canada (reduced production is only partly offset by lower feed use). Stocks are
revised for multiple countries.
For a visual display of the monthly changes in wheat ending stocks, see map C below.
8 Wheat Outlook, WHS-19g, July 15, 2019
USDA, Economic Research Service
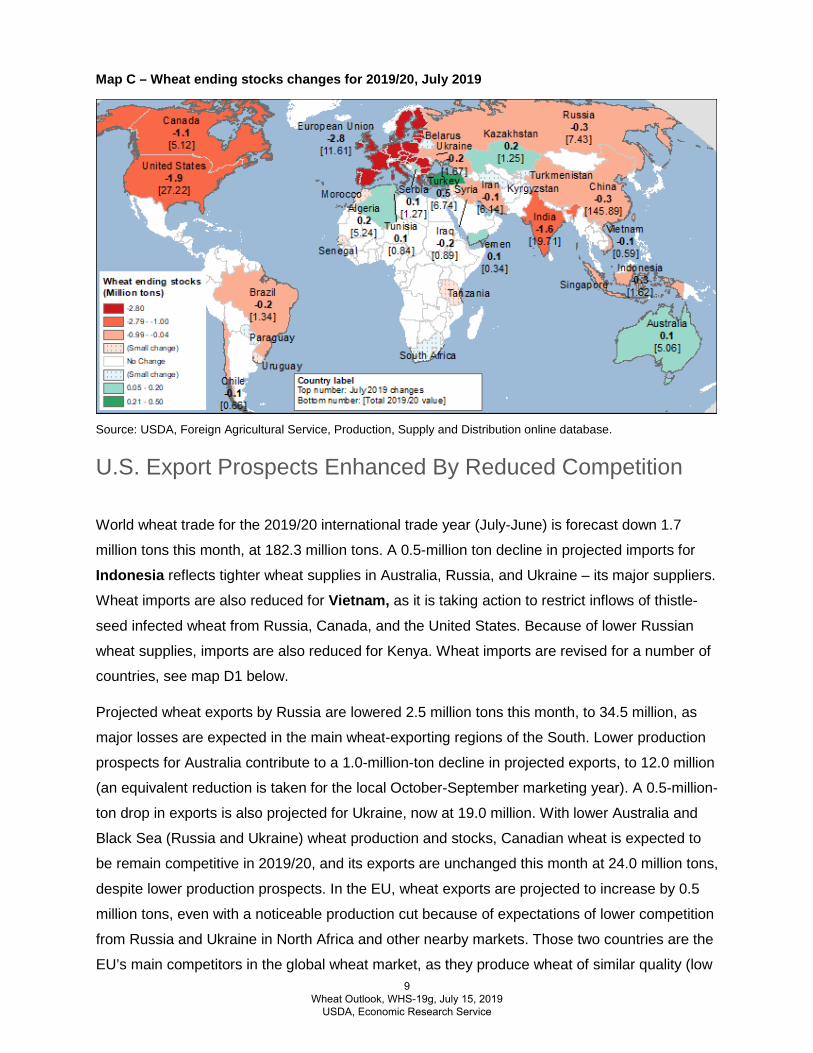
Map C – Wheat ending stocks changes for 2019/20, July 2019
Source: USDA, Foreign Agricultural Service, Production, Supply and Distribution online database.
U.S. Export Prospects Enhanced By Reduced Competition
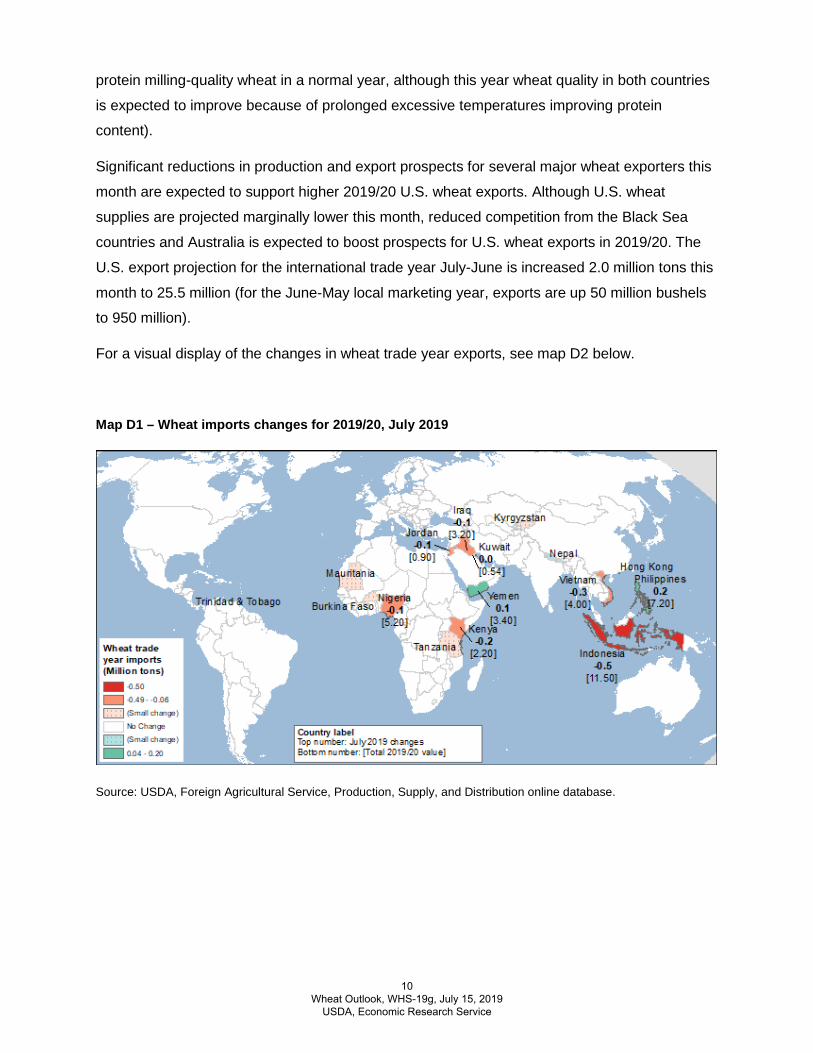
World wheat trade for the 2019/20 international trade year (July-June) is forecast down 1.7
million tons this month, at 182.3 million tons. A 0.5-million ton decline in projected imports for
Indonesia reflects tighter wheat supplies in Australia, Russia, and Ukraine – its major suppliers.
Wheat imports are also reduced for Vietnam, as it is taking action to restrict inflows of thistle-
seed infected wheat from Russia, Canada, and the United States. Because of lower Russian
wheat supplies, imports are also reduced for Kenya. Wheat imports are revised for a number of
countries, see map D1 below.
Projected wheat exports by Russia are lowered 2.5 million tons this month, to 34.5 million, as
major losses are expected in the main wheat-exporting regions of the South. Lower production
prospects for Australia contribute to a 1.0-million-ton decline in projected exports, to 12.0 million
(an equivalent reduction is taken for the local October-September marketing year). A 0.5-million-
ton drop in exports is also projected for Ukraine, now at 19.0 million. With lower Australia and
Black Sea (Russia and Ukraine) wheat production and stocks, Canadian wheat is expected to
be remain competitive in 2019/20, and its exports are unchanged this month at 24.0 million tons,
despite lower production prospects. In the EU, wheat exports are projected to increase by 0.5
million tons, even with a noticeable production cut because of expectations of lower competition
from Russia and Ukraine in North Africa and other nearby markets. Those two countries are the
EU’s main competitors in the global wheat market, as they produce wheat of similar quality (low 9
Wheat Outlook, WHS-19g, July 15, 2019 USDA, Economic Research Service
protein milling-quality wheat in a normal year, although this year wheat quality in both countries
is expected to improve because of prolonged excessive temperatures improving protein
content).
Significant reductions in production and export prospects for several major wheat exporters this
month are expected to support higher 2019/20 U.S. wheat exports. Although U.S. wheat
supplies are projected marginally lower this month, reduced competition from the Black Sea
countries and Australia is expected to boost prospects for U.S. wheat exports in 2019/20. The
U.S. export projection for the international trade year July-June is increased 2.0 million tons this
month to 25.5 million (for the June-May local marketing year, exports are up 50 million bushels
to 950 million).
For a visual display of the changes in wheat trade year exports, see map D2 below.
Map D1 – Wheat imports changes for 2019/20, July 2019
Source: USDA, Foreign Agricultural Service, Production, Supply, and Distribution online database.
10 Wheat Outlook, WHS-19g, July 15, 2019
USDA, Economic Research Service
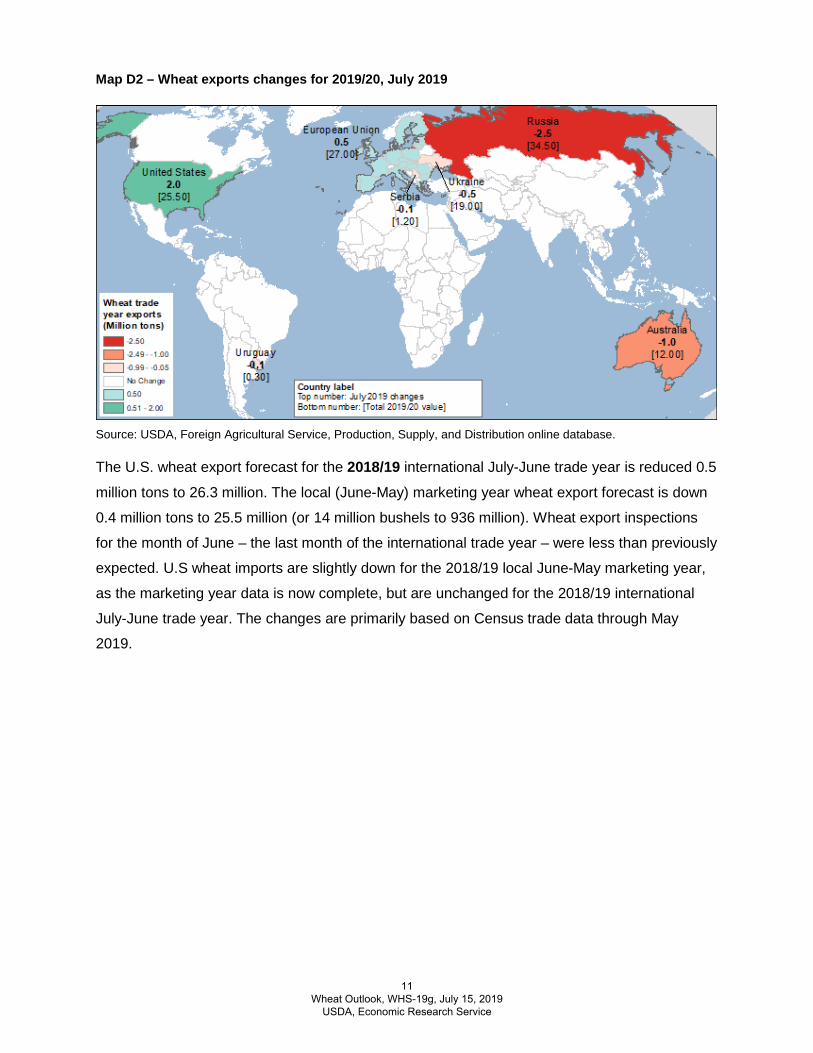
Map D2 – Wheat exports changes for 2019/20, July 2019
Source: USDA, Foreign Agricultural Service, Production, Supply, and Distribution online database.
The U.S. wheat export forecast for the 2018/19 international July-June trade year is reduced 0.5
million tons to 26.3 million. The local (June-May) marketing year wheat export forecast is down
0.4 million tons to 25.5 million (or 14 million bushels to 936 million). Wheat export inspections
for the month of June – the last month of the international trade year – were less than previously
expected. U.S wheat imports are slightly down for the 2018/19 local June-May marketing year,
as the marketing year data is now complete, but are unchanged for the 2018/19 international
July-June trade year. The changes are primarily based on Census trade data through May
2019.
11 Wheat Outlook, WHS-19g, July 15, 2019
USDA, Economic Research Service
Suggested Citation
Bond, Jennifer K., and Olga Liefert. Wheat Outlook, WHS-19g, U.S. Department of Agriculture, Economic Research Service, July 16, 2019
12 Wheat Outlook, WHS-19g, July 15, 2019
USDA, Economic Research Service
Use of commercial and trade names does not imply approval or constitute endorsement by USDA.
To ensure the quality of its research reports and satisfy governmentwide standards, ERS requires that all research reports with substantively new material be reviewed by qualified technical research peers. This technical peer review process, coordinated by ERS' Peer Review Coordinating Council, allows experts who possess the technical background, perspective, and expertise to provide an objective and meaningful assessment of the output’s substantive content and clarity of communication during the publication’s review.
In accordance with Federal civil rights law and U.S. Department of Agriculture (USDA) civil rights regulations and policies, the USDA, its Agencies, offices, and employees, and institutions participating in or administering USDA programs are prohibited from discriminating based on race, color, national origin, religion, sex, gender identity (including gender expression), sexual orientation, disability, age, marital status, family/parental status, income derived from a public assistance program, political beliefs, or reprisal or retaliation for prior civil rights activity, in any program or activity conducted or funded by USDA (not all bases apply to all programs). Remedies and complaint filing deadlines vary by program or incident.
Persons with disabilities who require alternative means of communication for program information (e.g., Braille, large print, audiotape, American Sign Language, etc.) should contact the responsible Agency or USDA's TARGET Center at (202) 720-2600 (voice and TTY) or contact USDA through the Federal Relay Service at (800) 877-8339. Additionally, program information may be made available in languages other than English.
To file a program discrimination complaint, complete the USDA Program Discrimination Complaint Form, AD-3027, found online at How to File a Program Discrimination Complaint and at any USDA office or write a letter addressed to USDA and provide in the letter all of the information requested in the form. To request a copy of the complaint form, call (866) 632-9992. Submit your completed form or letter to USDA by: (1) mail: U.S. Department of Agriculture, Office of the Assistant Secretary for Civil Rights, 1400 Independence Avenue, SW, Washington, D.C. 20250-9410; (2) fax: (202) 690-7442; or (3) email: [email protected].
USDA is an equal opportunity provider, employer, and lender.
13 Wheat Outlook, WHS-19g, July 15, 2019
USDA, Economic Research Service
0.00
1.00
2.00
3.00
4.00
5.00
6.00
June July Aug. Sept. Oct. Nov. Dec. Jan. Feb. Mar. Apr. May
2016/17 2017/18 2018/19
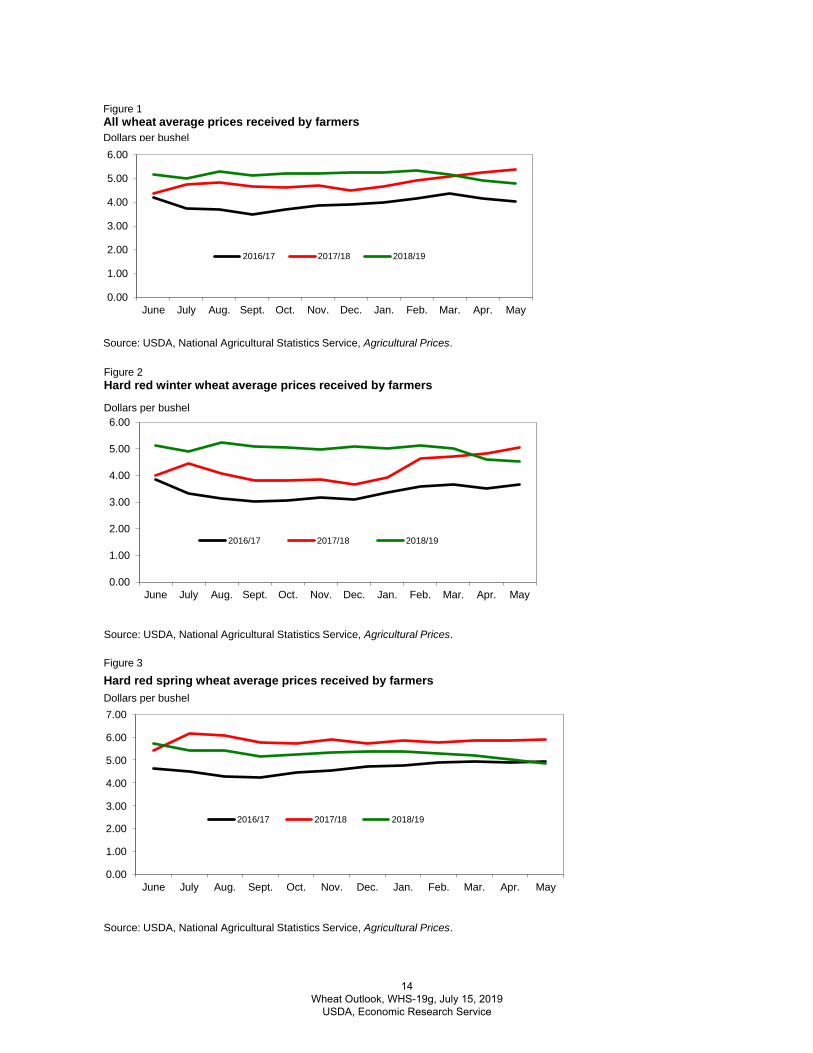
Figure 1All wheat average prices received by farmersDollars per bushel
0.00
1.00
2.00
3.00
4.00
5.00
6.00
June July Aug. Sept. Oct. Nov. Dec. Jan. Feb. Mar. Apr. May
2016/17 2017/18 2018/19
Source: USDA, National Agricultural Statistics Service, Agricultural Prices.
Figure 2Hard red winter wheat average prices received by farmers
Dollars per bushel
0.00
1.00
2.00
June July Aug. Sept. Oct. Nov. Dec. Jan. Feb. Mar. Apr. May
2016/17 2017/18 2018/19
Source: USDA, National Agricultural Statistics Service, Agricultural Prices.
Source: USDA, National Agricultural Statistics Service, Agricultural Prices.
Figure 3Hard red spring wheat average prices received by farmers Dollars per bushel7.00
6.00
5.00
4.00
3.00
14 Wheat Outlook, WHS-19g, July 15, 2019
USDA, Economic Research Service
0.00
1.00
2.00
3.00
4.00
5.00
6.00
June July Aug. Sept. Oct. Nov. Dec. Jan. Feb. Mar. Apr. May
2016/17 2017/18 2018/19
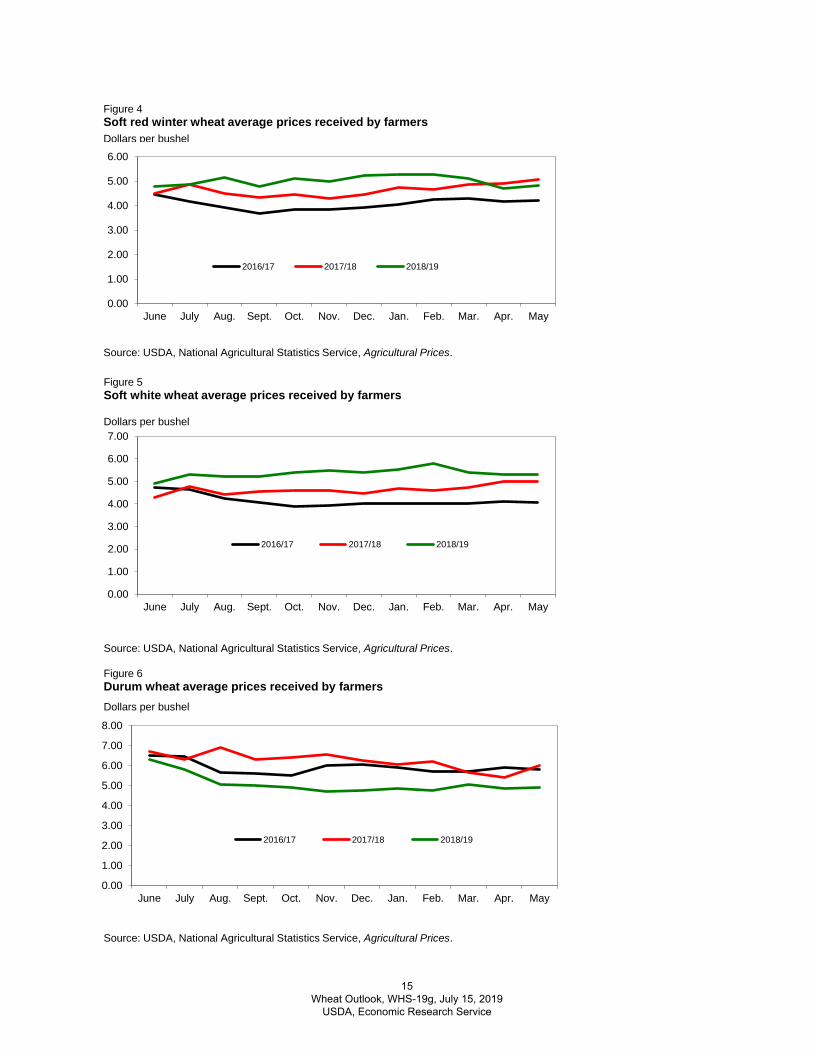
Figure 4Soft red winter wheat average prices received by farmersDollars per bushel
0.00
1.00
2.00
3.00
4.00
5.00
6.00
7.00
June July Aug. Sept. Oct. Nov. Dec. Jan. Feb. Mar. Apr. May
2016/17 2017/18 2018/19
Source: USDA, National Agricultural Statistics Service, Agricultural Prices.
Figure 5Soft white wheat average prices received by farmers
Dollars per bushel
0.00
1.00
2.00
3.00
4.00
5.00
6.00
7.00
8.00
June July Aug. Sept. Oct. Nov. Dec. Jan. Feb. Mar. Apr. May
2016/17 2017/18 2018/19
Source: USDA, National Agricultural Statistics Service, Agricultural Prices.
Figure 6Durum wheat average prices received by farmersDollars per bushel
Source: USDA, National Agricultural Statistics Service, Agricultural Prices.
15 Wheat Outlook, WHS-19g, July 15, 2019
USDA, Economic Research Service
-100 -50 0 50 100 150 200
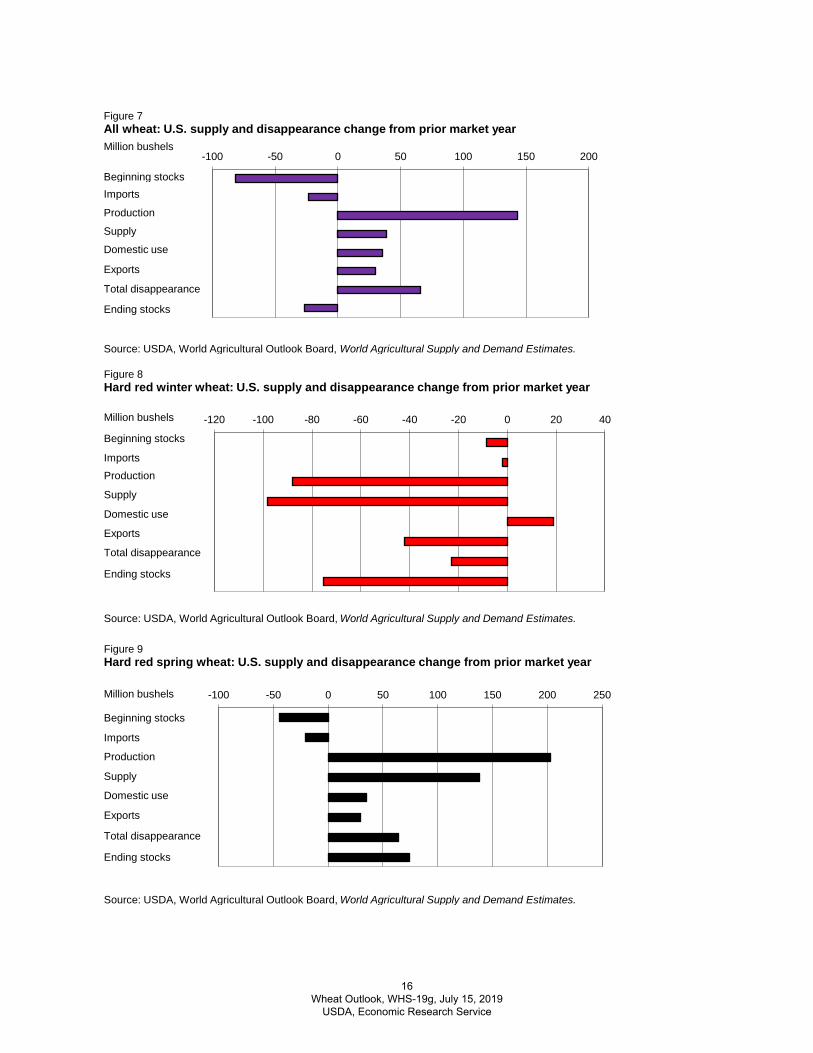
Figure 7All wheat: U.S. supply and disappearance change from prior market year
Beginning stocksImports
Production
Supply
Domestic use
Exports
Ending stocks
Total disappearance
Million bushels
Source: USDA, World Agricultural Outlook Board, World Agricultural Supply and Demand Estimates.
-120 -100 -80 -60 -40 -20 0 20 40
Figure 8Hard red winter wheat: U.S. supply and disappearance change from prior market year
Million bushels
Source: USDA, World Agricultural Outlook Board, World Agricultural Supply and Demand Estimates.
Beginning stocks
ImportsProduction
Supply
Domestic use
Exports
Total disappearance
Ending stocks
-100 -50 0 50 100 150 200 250
Figure 9Hard red spring wheat: U.S. supply and disappearance change from prior market year
Beginning stocks
Imports
Production
Supply
Domestic use
Exports
Ending stocks
Total disappearance
Million bushels
Source: USDA, World Agricultural Outlook Board, World Agricultural Supply and Demand Estimates.
16 Wheat Outlook, WHS-19g, July 15, 2019
USDA, Economic Research Service
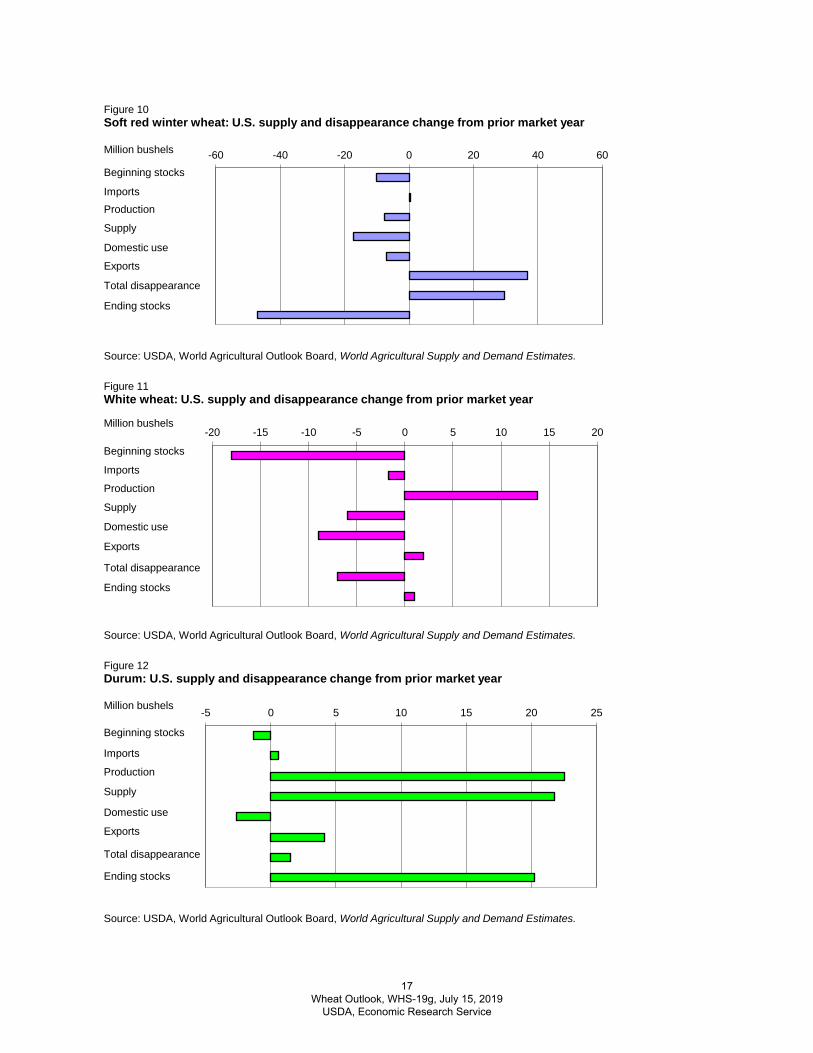
-60 -40 -20 0 20 40 60
Figure 10Soft red winter wheat: U.S. supply and disappearance change from prior market year
Beginning stocks
ImportsProduction
Supply
Domestic use
Exports
Ending stocks
Total disappearance
Million bushels
Source: USDA, World Agricultural Outlook Board, World Agricultural Supply and Demand Estimates.
-20 -15 -10 -5 0 5 10 15 20
Figure 11White wheat: U.S. supply and disappearance change from prior market year
Beginning stocks
Imports
Production
Supply
Domestic use
Exports
Ending stocks
Total disappearance
Million bushels
Source: USDA, World Agricultural Outlook Board, World Agricultural Supply and Demand Estimates.
-5 0 5 10 15 20 25
Figure 12Durum: U.S. supply and disappearance change from prior market year
Beginning stocks
Imports
Production
Supply
Domestic use
Exports
Ending stocks
Total disappearance
Million bushels
Source: USDA, World Agricultural Outlook Board, World Agricultural Supply and Demand Estimates.
17 Wheat Outlook, WHS-19g, July 15, 2019
USDA, Economic Research Service
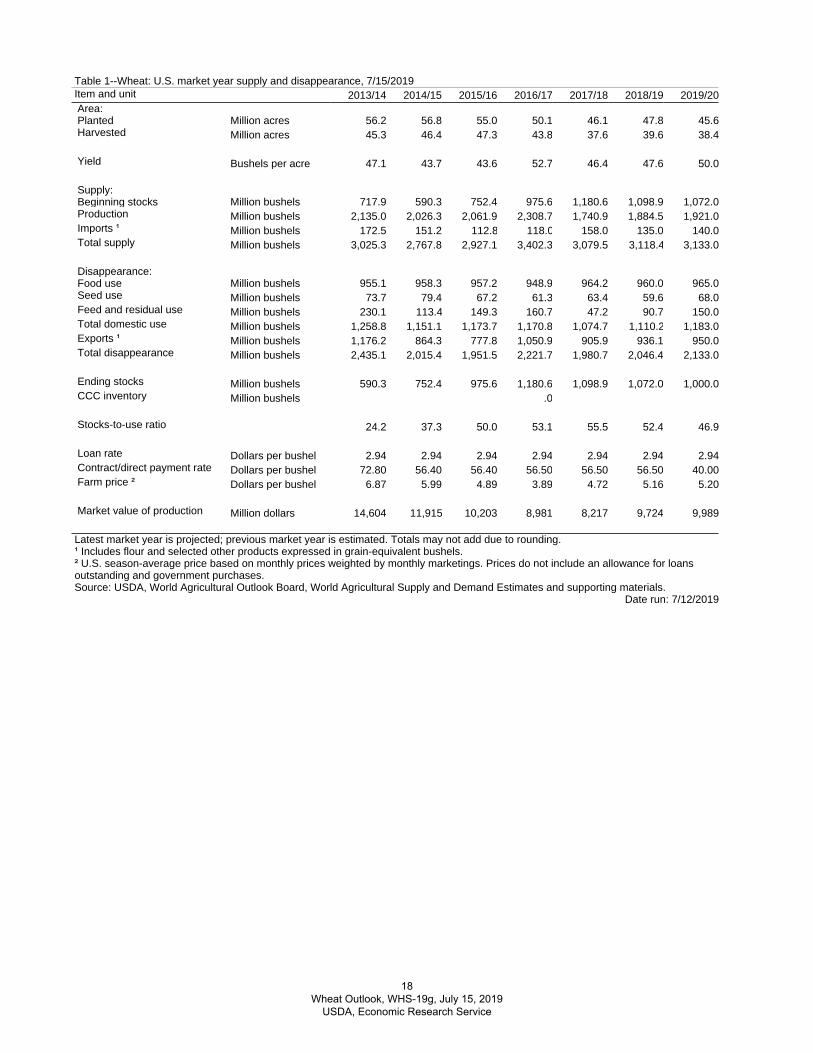
Item and unit 2013/14 2014/15 2015/16 2016/17 2017/18 2018/19 2019/20Area:Planted Million acres 56.2 56.8 55.0 50.1 46.1 47.8 45.6Harvested Million acres 45.3 46.4 47.3 43.8 37.6 39.6 38.4
Yield Bushels per acre 47.1 43.7 43.6 52.7 46.4 47.6 50.0
Supply:Beginning stocks Million bushels 717.9 590.3 752.4 975.6 1,180.6 1,098.9 1,072.0Production Million bushels 2,135.0 2,026.3 2,061.9 2,308.7 1,740.9 1,884.5 1,921.0Imports ¹ Million bushels 172.5 151.2 112.8 118.0 158.0 135.0 140.0Total supply Million bushels 3,025.3 2,767.8 2,927.1 3,402.3 3,079.5 3,118.4 3,133.0
Disappearance:Food use Million bushels 955.1 958.3 957.2 948.9 964.2 960.0 965.0Seed use Million bushels 73.7 79.4 67.2 61.3 63.4 59.6 68.0Feed and residual use Million bushels 230.1 113.4 149.3 160.7 47.2 90.7 150.0Total domestic use Million bushels 1,258.8 1,151.1 1,173.7 1,170.8 1,074.7 1,110.2 1,183.0Exports ¹ Million bushels 1,176.2 864.3 777.8 1,050.9 905.9 936.1 950.0Total disappearance Million bushels 2,435.1 2,015.4 1,951.5 2,221.7 1,980.7 2,046.4 2,133.0
Ending stocks Million bushels 590.3 752.4 975.6 1,180.6 1,098.9 1,072.0 1,000.0CCC inventory Million bushels .0
Stocks-to-use ratio 24.2 37.3 50.0 53.1 55.5 52.4 46.9
Loan rate Dollars per bushel 2.94 2.94 2.94 2.94 2.94 2.94 2.94Contract/direct payment rate Dollars per bushel 72.80 56.40 56.40 56.50 56.50 56.50 40.00Farm price ² Dollars per bushel 6.87 5.99 4.89 3.89 4.72 5.16 5.20
Market value of production Million dollars 14,604 11,915 10,203 8,981 8,217 9,724 9,989
Table 1--Wheat: U.S. market year supply and disappearance, 7/15/2019
Latest market year is projected; previous market year is estimated. Totals may not add due to rounding.¹ Includes flour and selected other products expressed in grain-equivalent bushels.
Date run: 7/12/2019
² U.S. season-average price based on monthly prices weighted by monthly marketings. Prices do not include an allowance for loans outstanding and government purchases.Source: USDA, World Agricultural Outlook Board, World Agricultural Supply and Demand Estimates and supporting materials.
18 Wheat Outlook, WHS-19g, July 15, 2019
USDA, Economic Research Service
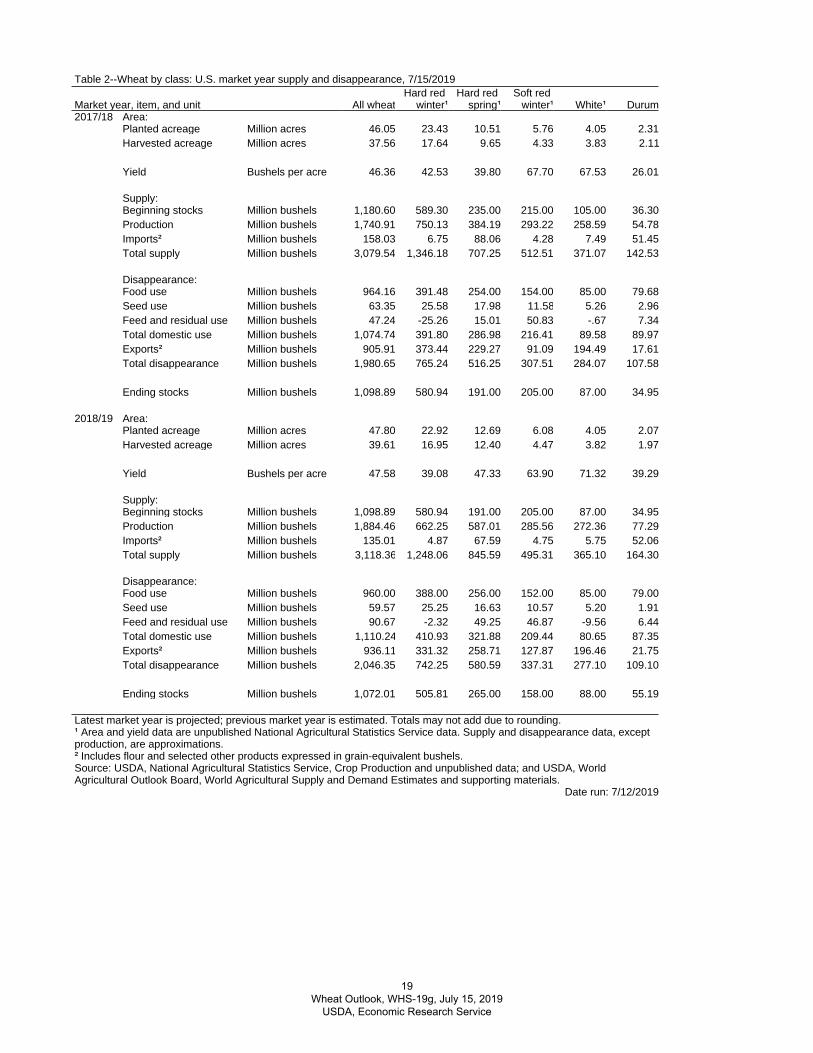
Table 2--Wheat by class: U.S. market year supply and disappearance, 7/15/2019
Latest market year is projected; previous market year is estimated. Totals may not add due to rounding.¹ Area and yield data are unpublished National Agricultural Statistics Service data. Supply and disappearance data, except production, are approximations.
Date run: 7/12/2019
Market year, item, and unit All wheatHard red
winter¹Hard red
spring¹Soft red
winter¹ White¹ Durum2017/18 Area:
Planted acreage Million acres 46.05 23.43 10.51 5.76 4.05 2.31Harvested acreage Million acres 37.56 17.64 9.65 4.33 3.83 2.11
Yield Bushels per acre 46.36 42.53 39.80 67.70 67.53 26.01
Supply:Beginning stocks Million bushels 1,180.60 589.30 235.00 215.00 105.00 36.30Production Million bushels 1,740.91 750.13 384.19 293.22 258.59 54.78Imports² Million bushels 158.03 6.75 88.06 4.28 7.49 51.45Total supply Million bushels 3,079.54 1,346.18 707.25 512.51 371.07 142.53
Disappearance:Food use Million bushels 964.16 391.48 254.00 154.00 85.00 79.68Seed use Million bushels 63.35 25.58 17.98 11.58 5.26 2.96Feed and residual use Million bushels 47.24 -25.26 15.01 50.83 -.67 7.34Total domestic use Million bushels 1,074.74 391.80 286.98 216.41 89.58 89.97Exports² Million bushels 905.91 373.44 229.27 91.09 194.49 17.61Total disappearance Million bushels 1,980.65 765.24 516.25 307.51 284.07 107.58
Ending stocks Million bushels 1,098.89 580.94 191.00 205.00 87.00 34.95
2018/19 Area:Planted acreage Million acres 47.80 22.92 12.69 6.08 4.05 2.07Harvested acreage Million acres 39.61 16.95 12.40 4.47 3.82 1.97
Yield Bushels per acre 47.58 39.08 47.33 63.90 71.32 39.29
Supply:Beginning stocks Million bushels 1,098.89 580.94 191.00 205.00 87.00 34.95Production Million bushels 1,884.46 662.25 587.01 285.56 272.36 77.29Imports² Million bushels 135.01 4.87 67.59 4.75 5.75 52.06Total supply Million bushels 3,118.36 1,248.06 845.59 495.31 365.10 164.30
Disappearance:Food use Million bushels 960.00 388.00 256.00 152.00 85.00 79.00Seed use Million bushels 59.57 25.25 16.63 10.57 5.20 1.91Feed and residual use Million bushels 90.67 -2.32 49.25 46.87 -9.56 6.44Total domestic use Million bushels 1,110.24 410.93 321.88 209.44 80.65 87.35Exports² Million bushels 936.11 331.32 258.71 127.87 196.46 21.75Total disappearance Million bushels 2,046.35 742.25 580.59 337.31 277.10 109.10
Ending stocks Million bushels 1,072.01 505.81 265.00 158.00 88.00 55.19
² Includes flour and selected other products expressed in grain-equivalent bushels.Source: USDA, National Agricultural Statistics Service, Crop Production and unpublished data; and USDA, World Agricultural Outlook Board, World Agricultural Supply and Demand Estimates and supporting materials.
19 Wheat Outlook, WHS-19g, July 15, 2019
USDA, Economic Research Service
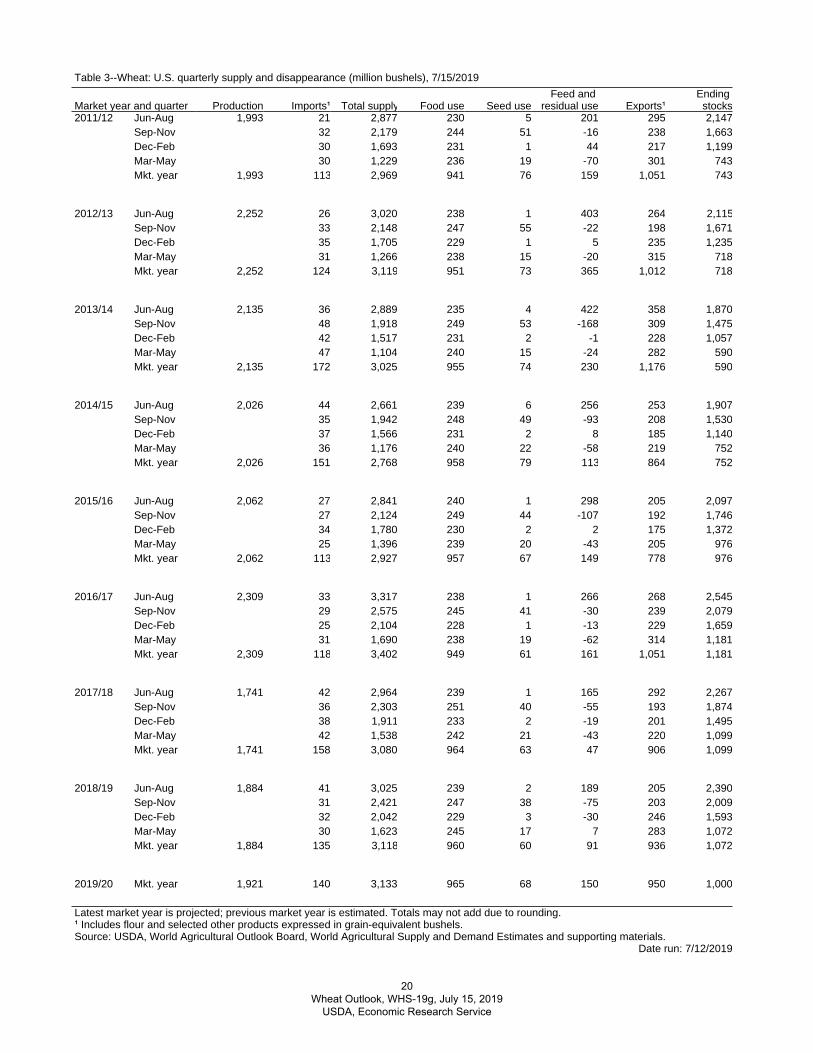
Table 3--Wheat: U.S. quarterly supply and disappearance (million bushels), 7/15/2019
Latest market year is projected; previous market year is estimated. Totals may not add due to rounding.¹ Includes flour and selected other products expressed in grain-equivalent bushels.Source: USDA, World Agricultural Outlook Board, World Agricultural Supply and Demand Estimates and supporting materials.
Date run: 7/12/2019
Market year and quarter Production Imports¹ Total supply Food use Seed useFeed and
residual use Exports¹Ending
stocks2011/12 Jun-Aug 1,993 21 2,877 230 5 201 295 2,147
Sep-Nov 32 2,179 244 51 -16 238 1,663Dec-Feb 30 1,693 231 1 44 217 1,199Mar-May 30 1,229 236 19 -70 301 743Mkt. year 1,993 113 2,969 941 76 159 1,051 743
2012/13 Jun-Aug 2,252 26 3,020 238 1 403 264 2,115Sep-Nov 33 2,148 247 55 -22 198 1,671Dec-Feb 35 1,705 229 1 5 235 1,235Mar-May 31 1,266 238 15 -20 315 718Mkt. year 2,252 124 3,119 951 73 365 1,012 718
2013/14 Jun-Aug 2,135 36 2,889 235 4 422 358 1,870Sep-Nov 48 1,918 249 53 -168 309 1,475Dec-Feb 42 1,517 231 2 -1 228 1,057Mar-May 47 1,104 240 15 -24 282 590Mkt. year 2,135 172 3,025 955 74 230 1,176 590
2014/15 Jun-Aug 2,026 44 2,661 239 6 256 253 1,907Sep-Nov 35 1,942 248 49 -93 208 1,530Dec-Feb 37 1,566 231 2 8 185 1,140Mar-May 36 1,176 240 22 -58 219 752Mkt. year 2,026 151 2,768 958 79 113 864 752
2015/16 Jun-Aug 2,062 27 2,841 240 1 298 205 2,097Sep-Nov 27 2,124 249 44 -107 192 1,746Dec-Feb 34 1,780 230 2 2 175 1,372Mar-May 25 1,396 239 20 -43 205 976Mkt. year 2,062 113 2,927 957 67 149 778 976
2016/17 Jun-Aug 2,309 33 3,317 238 1 266 268 2,545Sep-Nov 29 2,575 245 41 -30 239 2,079Dec-Feb 25 2,104 228 1 -13 229 1,659Mar-May 31 1,690 238 19 -62 314 1,181Mkt. year 2,309 118 3,402 949 61 161 1,051 1,181
2017/18 Jun-Aug 1,741 42 2,964 239 1 165 292 2,267Sep-Nov 36 2,303 251 40 -55 193 1,874Dec-Feb 38 1,911 233 2 -19 201 1,495Mar-May 42 1,538 242 21 -43 220 1,099Mkt. year 1,741 158 3,080 964 63 47 906 1,099
2018/19 Jun-Aug 1,884 41 3,025 239 2 189 205 2,390Sep-Nov 31 2,421 247 38 -75 203 2,009Dec-Feb 32 2,042 229 3 -30 246 1,593Mar-May 30 1,623 245 17 7 283 1,072Mkt. year 1,884 135 3,118 960 60 91 936 1,072
2019/20 Mkt. year 1,921 140 3,133 965 68 150 950 1,000
20 Wheat Outlook, WHS-19g, July 15, 2019
USDA, Economic Research Service
¹ Current year is preliminary. Previous year is preliminary through August of current year, estimated afterwards.² Food imports and exports used to calculate total food use. Includes all categories of wheat flour, semolina, bulgur, and couscous and selected categories of pasta.³ Wheat prepared for food use by processes other than milling.
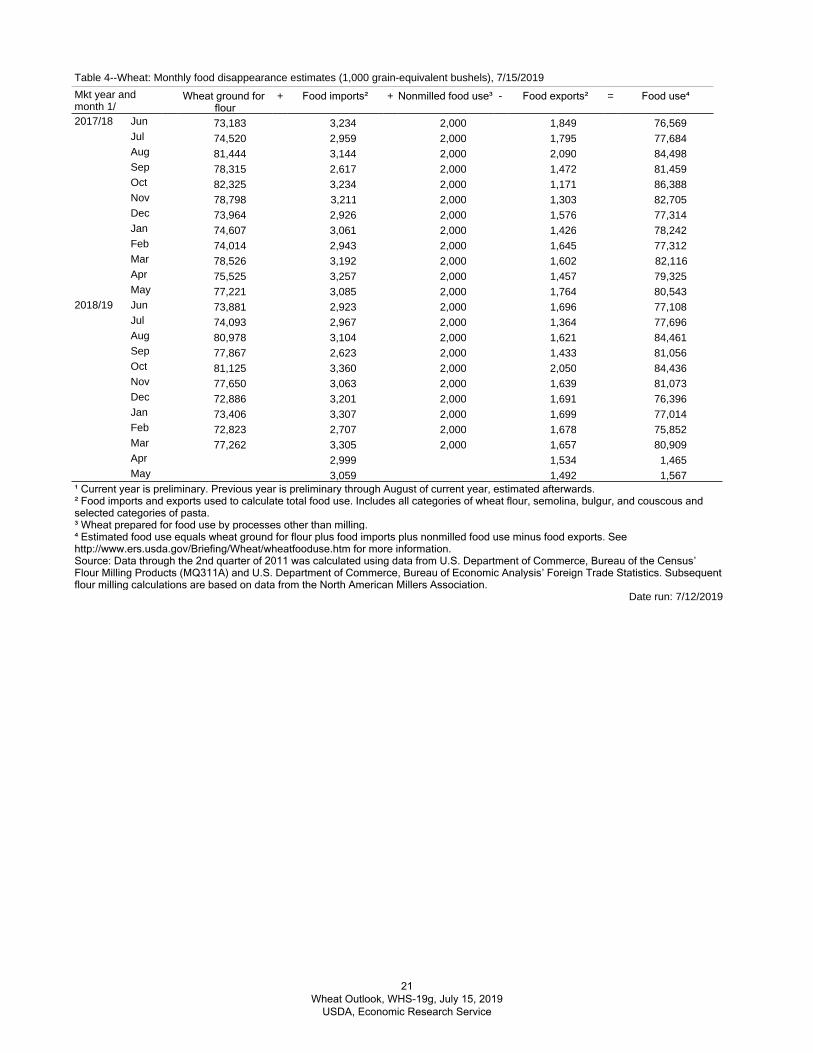
Table 4--Wheat: Monthly food disappearance estimates (1,000 grain-equivalent bushels), 7/15/2019
Date run: 7/12/2019
Mkt year and month 1/
Wheat ground for flour
+ Food imports² + Nonmilled food use³ - Food exports² = Food use⁴
2017/18 Jun 73,183 3,234 2,000 1,849 76,569Jul 74,520 2,959 2,000 1,795 77,684Aug 81,444 3,144 2,000 2,090 84,498Sep 78,315 2,617 2,000 1,472 81,459Oct 82,325 3,234 2,000 1,171 86,388Nov 78,798 3,211 2,000 1,303 82,705Dec 73,964 2,926 2,000 1,576 77,314Jan 74,607 3,061 2,000 1,426 78,242Feb 74,014 2,943 2,000 1,645 77,312Mar 78,526 3,192 2,000 1,602 82,116Apr 75,525 3,257 2,000 1,457 79,325May 77,221 3,085 2,000 1,764 80,543
2018/19 Jun 73,881 2,923 2,000 1,696 77,108Jul 74,093 2,967 2,000 1,364 77,696Aug 80,978 3,104 2,000 1,621 84,461Sep 77,867 2,623 2,000 1,433 81,056Oct 81,125 3,360 2,000 2,050 84,436Nov 77,650 3,063 2,000 1,639 81,073Dec 72,886 3,201 2,000 1,691 76,396Jan 73,406 3,307 2,000 1,699 77,014Feb 72,823 2,707 2,000 1,678 75,852Mar 77,262 3,305 2,000 1,657 80,909Apr 2,999 1,534 1,465May 3,059 1,492 1,567
⁴ Estimated food use equals wheat ground for flour plus food imports plus nonmilled food use minus food exports. See http://www.ers.usda.gov/Briefing/Wheat/wheatfooduse.htm for more information.Source: Data through the 2nd quarter of 2011 was calculated using data from U.S. Department of Commerce, Bureau of the Census’ Flour Milling Products (MQ311A) and U.S. Department of Commerce, Bureau of Economic Analysis’ Foreign Trade Statistics. Subsequent flour milling calculations are based on data from the North American Millers Association.
21 Wheat Outlook, WHS-19g, July 15, 2019
USDA, Economic Research Service
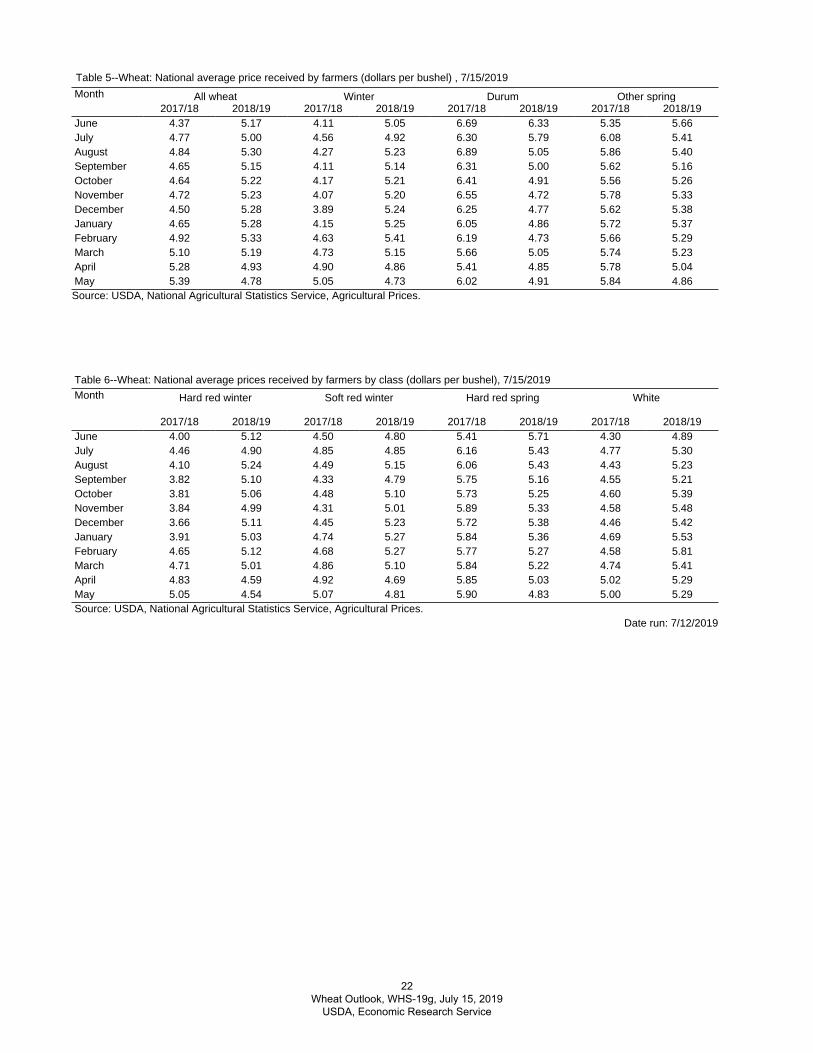
Table 5--Wheat: National average price received by farmers (dollars per bushel) , 7/15/2019
Source: USDA, National Agricultural Statistics Service, Agricultural Prices.
Month All wheat Winter Durum Other spring2017/18 2018/19 2017/18 2018/19 2017/18 2018/19 2017/18 2018/19
June 4.37 5.17 4.11 5.05 6.69 6.33 5.35 5.66July 4.77 5.00 4.56 4.92 6.30 5.79 6.08 5.41August 4.84 5.30 4.27 5.23 6.89 5.05 5.86 5.40September 4.65 5.15 4.11 5.14 6.31 5.00 5.62 5.16October 4.64 5.22 4.17 5.21 6.41 4.91 5.56 5.26November 4.72 5.23 4.07 5.20 6.55 4.72 5.78 5.33December 4.50 5.28 3.89 5.24 6.25 4.77 5.62 5.38January 4.65 5.28 4.15 5.25 6.05 4.86 5.72 5.37February 4.92 5.33 4.63 5.41 6.19 4.73 5.66 5.29March 5.10 5.19 4.73 5.15 5.66 5.05 5.74 5.23April 5.28 4.93 4.90 4.86 5.41 4.85 5.78 5.04May 5.39 4.78 5.05 4.73 6.02 4.91 5.84 4.86
Table 6--Wheat: National average prices received by farmers by class (dollars per bushel), 7/15/2019
Source: USDA, National Agricultural Statistics Service, Agricultural Prices.Date run: 7/12/2019
Month Hard red winter Soft red winter Hard red spring White
2017/18 2018/19 2017/18 2018/19 2017/18 2018/19 2017/18 2018/19June 4.00 5.12 4.50 4.80 5.41 5.71 4.30 4.89July 4.46 4.90 4.85 4.85 6.16 5.43 4.77 5.30August 4.10 5.24 4.49 5.15 6.06 5.43 4.43 5.23September 3.82 5.10 4.33 4.79 5.75 5.16 4.55 5.21October 3.81 5.06 4.48 5.10 5.73 5.25 4.60 5.39November 3.84 4.99 4.31 5.01 5.89 5.33 4.58 5.48December 3.66 5.11 4.45 5.23 5.72 5.38 4.46 5.42January 3.91 5.03 4.74 5.27 5.84 5.36 4.69 5.53February 4.65 5.12 4.68 5.27 5.77 5.27 4.58 5.81March 4.71 5.01 4.86 5.10 5.84 5.22 4.74 5.41April 4.83 4.59 4.92 4.69 5.85 5.03 5.02 5.29May 5.05 4.54 5.07 4.81 5.90 4.83 5.00 5.29
22 Wheat Outlook, WHS-19g, July 15, 2019
USDA, Economic Research Service
Date run: 7/12/2019
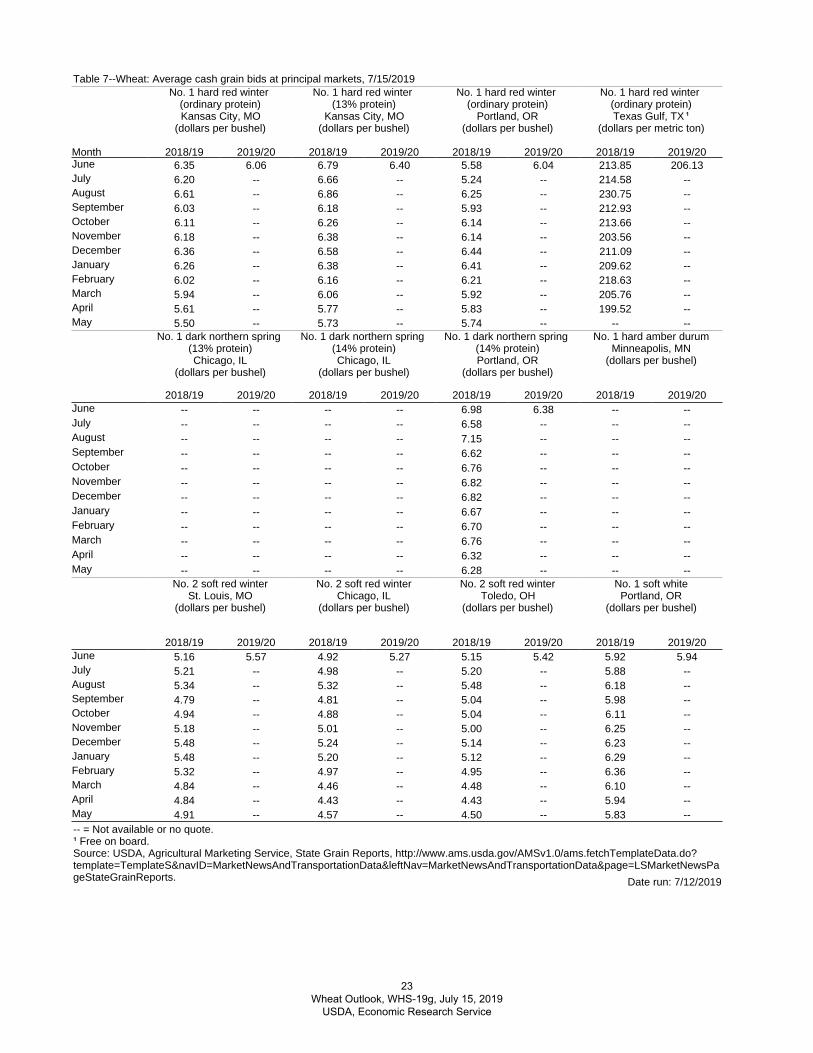
Table 7--Wheat: Average cash grain bids at principal markets, 7/15/2019
-- = Not available or no quote.¹ Free on board.Source: USDA, Agricultural Marketing Service, State Grain Reports, http://www.ams.usda.gov/AMSv1.0/ams.fetchTemplateData.do?template=TemplateS&navID=MarketNewsAndTransportationData&leftNav=MarketNewsAndTransportationData&page=LSMarketNewsPageStateGrainReports.
Month
No. 1 hard red winter (ordinary protein)Kansas City, MO
(dollars per bushel)
No. 1 hard red winter (13% protein)
Kansas City, MO(dollars per bushel)
No. 1 hard red winter (ordinary protein)
Portland, OR(dollars per bushel)
No. 1 hard red winter (ordinary protein)Texas Gulf, TX ¹
(dollars per metric ton)
2018/19 2019/20 2018/19 2019/20 2018/19 2019/20 2018/19 2019/20June
6.35 6.06 6.79 6.40 5.58 6.04 213.85 206.13July
6.20 -- 6.66 -- 5.24 -- 214.58 --August
6.61 -- 6.86 -- 6.25 -- 230.75 --September
6.03 -- 6.18 -- 5.93 -- 212.93 --October
6.11 -- 6.26 -- 6.14 -- 213.66 --November
6.18 -- 6.38 -- 6.14 -- 203.56 --December
6.36 -- 6.58 -- 6.44 -- 211.09 --January
6.26 -- 6.38 -- 6.41 -- 209.62 --February
6.02 -- 6.16 -- 6.21 -- 218.63 --March
5.94 -- 6.06 -- 5.92 -- 205.76 --April
5.61 -- 5.77 -- 5.83 -- 199.52 --May
5.50 -- 5.73 -- 5.74 -- -- --No. 1 dark northern spring
(13% protein)Chicago, IL
(dollars per bushel)
No. 1 dark northern spring (14% protein)Chicago, IL
(dollars per bushel)
No. 1 dark northern spring (14% protein)Portland, OR
(dollars per bushel)
No. 1 hard amber durumMinneapolis, MN
(dollars per bushel)
2018/19 2019/20 2018/19 2019/20 2018/19 2019/20 2018/19 2019/20June
-- -- -- -- 6.98 6.38 -- --July
-- -- -- -- 6.58 -- -- --August
-- -- -- -- 7.15 -- -- --September
-- -- -- -- 6.62 -- -- --October
-- -- -- -- 6.76 -- -- --November
-- -- -- -- 6.82 -- -- --December
-- -- -- -- 6.82 -- -- --January
-- -- -- -- 6.67 -- -- --February
-- -- -- -- 6.70 -- -- --March
-- -- -- -- 6.76 -- -- --April
-- -- -- -- 6.32 -- -- --May
-- -- -- -- 6.28 -- -- --No. 2 soft red winter
St. Louis, MO(dollars per bushel)
No. 2 soft red winterChicago, IL
(dollars per bushel)
No. 2 soft red winterToledo, OH
(dollars per bushel)
No. 1 soft whitePortland, OR
(dollars per bushel)
2018/19 2019/20 2018/19 2019/20 2018/19 2019/20 2018/19 2019/20June
5.16 5.57 4.92 5.27 5.15 5.42 5.92 5.94July
5.21 -- 4.98 -- 5.20 -- 5.88 --August
5.34 -- 5.32 -- 5.48 -- 6.18 --September
4.79 -- 4.81 -- 5.04 -- 5.98 --October
4.94 -- 4.88 -- 5.04 -- 6.11 --November
5.18 -- 5.01 -- 5.00 -- 6.25 --December
5.48 -- 5.24 -- 5.14 -- 6.23 --January
5.48 -- 5.20 -- 5.12 -- 6.29 --February
5.32 -- 4.97 -- 4.95 -- 6.36 --March
4.84 -- 4.46 -- 4.48 -- 6.10 --April
4.84 -- 4.43 -- 4.43 -- 5.94 --May
4.91 -- 4.57 -- 4.50 -- 5.83 --
23 Wheat Outlook, WHS-19g, July 15, 2019
USDA, Economic Research Service
Date run: 7/12/2019
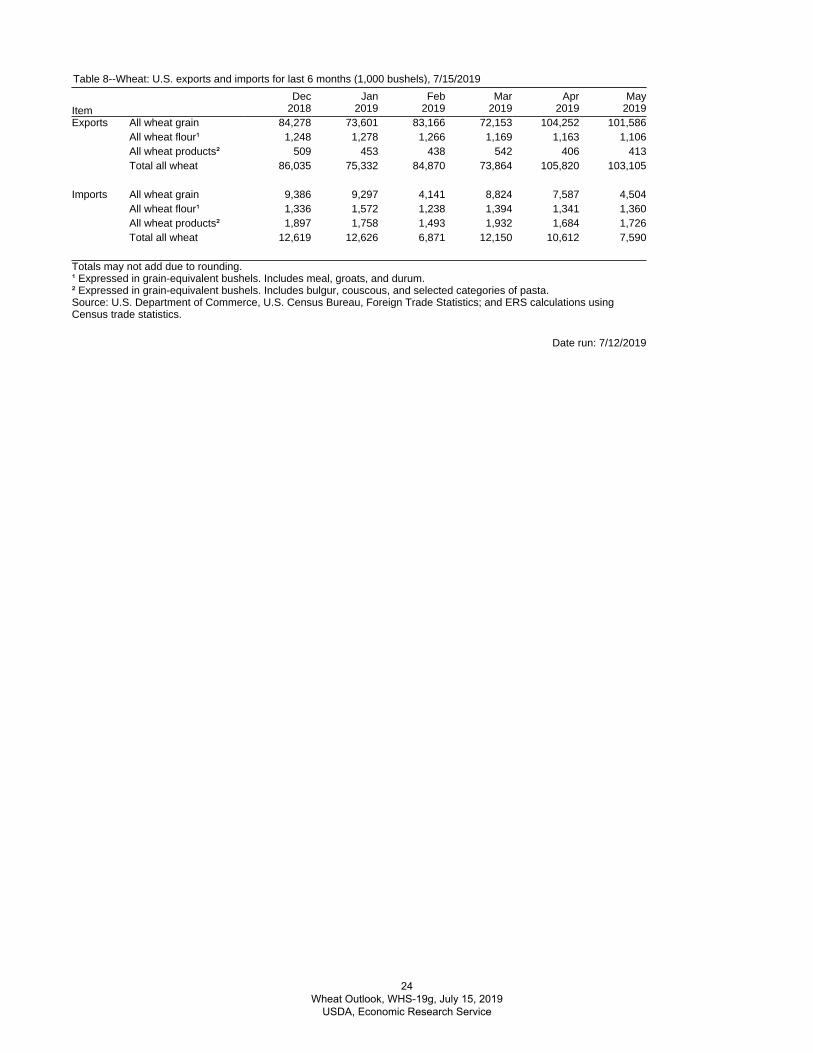
Table 8--Wheat: U.S. exports and imports for last 6 months (1,000 bushels), 7/15/2019
Totals may not add due to rounding.¹ Expressed in grain-equivalent bushels. Includes meal, groats, and durum.² Expressed in grain-equivalent bushels. Includes bulgur, couscous, and selected categories of pasta.Source: U.S. Department of Commerce, U.S. Census Bureau, Foreign Trade Statistics; and ERS calculations using Census trade statistics.
ItemDec Jan Feb Mar Apr May
2018 2019 2019 2019 2019 2019Exports All wheat grain 84,278 73,601 83,166 72,153 104,252 101,586
All wheat flour¹ 1,248 1,278 1,266 1,169 1,163 1,106All wheat products² 509 453 438 542 406 413Total all wheat 86,035 75,332 84,870 73,864 105,820 103,105
Imports All wheat grain 9,386 9,297 4,141 8,824 7,587 4,504All wheat flour¹ 1,336 1,572 1,238 1,394 1,341 1,360All wheat products² 1,897 1,758 1,493 1,932 1,684 1,726Total all wheat 12,619 12,626 6,871 12,150 10,612 7,590
24 Wheat Outlook, WHS-19g, July 15, 2019
USDA, Economic Research Service
Contacts & Additional Information
Subscribe to ERS e-mail notification service at https://www Telephone.ers.usda.gov/subscribe-to-ers-e-newletters/ to receive timely notification of newsletter availability.
Data Tables from the Wheat Yearbook are available in the Wheat Data Topics at https://www.ers.usda.gov/data-products/wheat-data/. They contain the latest data and historical information on the production, use, prices, imports, and exports of sugar and sweeteners.
Related Websites Wheat Outlook https://www.ers.usda.gov/publications/pub-details/?pubid=87376 WASDE http://usda.mannlib.cornell.edu/MannUsda/viewDocumentInfo.do?documented=1194 Wheat Topics https://www.ers.usda.gov/topics/crops/wheat/
E-mail NotificationReaders of ERS outlook reports have two ways they can receive an e-mail notice about release of reports and associated data.
• Receive timely notification (soon after the report is posted on the web) via USDA’s Economics,Statistics and Market Information System (which is housed at Cornell University’s Mann Library).Go to http://usda.mannlib.cornell.edu/MannUsda/aboutEmailService.do and follow theinstructions to receive e-mail notices about ERS, Agricultural Marketing Service, NationalAgricultural Statistics Service, and World Agricultural Outlook Board products.
• Receive weekly notification (on Friday afternoon) via the ERS website. Go tohttp://www.ers.usda.gov/Updates/and follow the instructions to receive notices about ERS outlookreports, Amber Waves magazine, and other reports and data products on specific topics. ERSalso offers RSS (really simple syndication) feeds for all ERS products. Go tohttp://www.ers.usda.gov/rss/ to get started.
Contacts Phone E-mailJennifer K Bond, (coordinator, domestic) (202) 694-5326 [email protected]
Olga Liefert, (international) (202) 694-5326 [email protected]