WhatsUp Gold v11 Features Overview - Ipswitch Gold v11/02... · WhatsUp Gold v11 Features Overview...
17
WhatsUp Gold v11 Features Overview This guide provides an overview of the core functionality of WhatsUp Gold v11, and introduces interesting features and processes that help users maximize productivity and minimize network problems.
Transcript of WhatsUp Gold v11 Features Overview - Ipswitch Gold v11/02... · WhatsUp Gold v11 Features Overview...
WhatsUp Gold v11 Features Overview This guide provides an overview of the core functionality of WhatsUp Gold v11, and introduces interesting features and processes that help users maximize productivity and minimize network problems.
WhatsUp Gold v11- Features Overview 2
Table of Contents
Comprehensive Network Monitoring..........................................................3
Discovery...................................................................................................4
Customizable Views into your Network ....................................................5
Polling/Listening .......................................................................................7
Notification of Network Events...................................................................9
Data Gathering and Reporting...................................................................10
Workspaces...............................................................................................11
Database Driven........................................................................................13
Remote Configuration and Management...................................................14
Scripted Monitors and Actions ...................................................................15
Advanced Reporting Capabilities ..............................................................16
Feature Comparison..................................................................................17
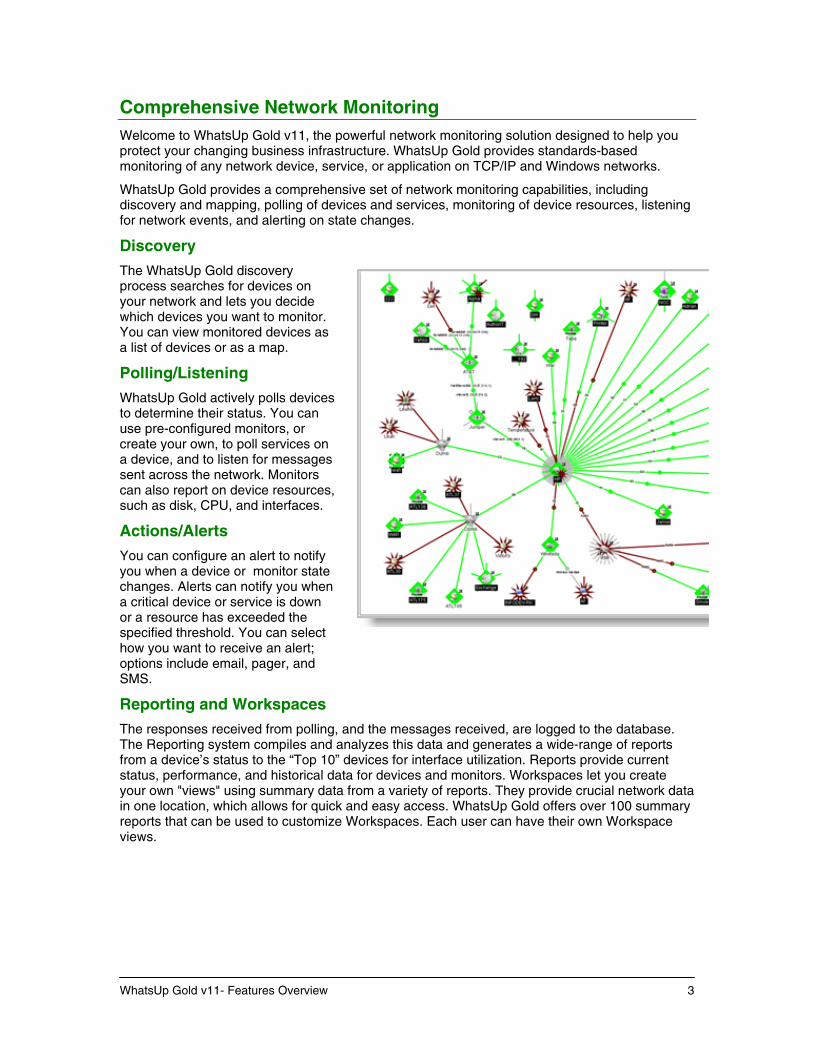
Comprehensive Network Monitoring Welcome to WhatsUp Gold v11, the powerful network monitoring solution designed to help you protect your changing business infrastructure. WhatsUp Gold provides standards-based monitoring of any network device, service, or application on TCP/IP and Windows networks.
WhatsUp Gold provides a comprehensive set of network monitoring capabilities, including discovery and mapping, polling of devices and services, monitoring of device resources, listening for network events, and alerting on state changes.
Discovery
The WhatsUp Gold discovery process searches for devices on your network and lets you decide which devices you want to monitor. You can view monitored devices as a list of devices or as a map.
Polling/Listening
WhatsUp Gold actively polls devices to determine their status. You can use pre-configured monitors, or create your own, to poll services on a device, and to listen for messages sent across the network. Monitors can also report on device resources, such as disk, CPU, and interfaces.
Actions/Alerts
You can configure an alert to notify you when a device or monitor state changes. Alerts can notify you when a critical device or service is down or a resource has exceeded the specified threshold. You can select how you want to receive an alert; options include email, pager, and SMS.
Reporting and Workspaces
The responses received from polling, and the messages received, are logged to the database. The Reporting system compiles and analyzes this data and generates a wide-range of reports from a device’s status to the “Top 10” devices for interface utilization. Reports provide current status, performance, and historical data for devices and monitors. Workspaces let you create your own "views" using summary data from a variety of reports. They provide crucial network data in one location, which allows for quick and easy access. WhatsUp Gold offers over 100 summary reports that can be used to customize Workspaces. Each user can have their own Workspace views.
WhatsUp Gold v11- Features Overview 3
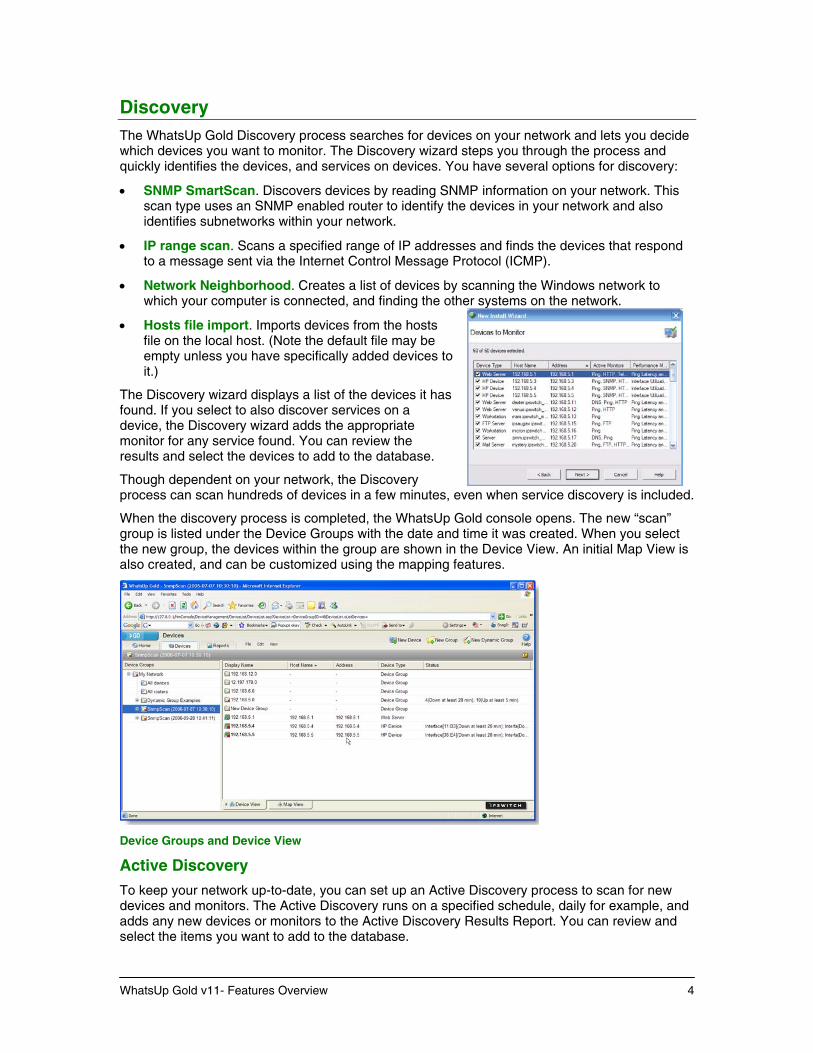
Discovery The WhatsUp Gold Discovery process searches for devices on your network and lets you decide which devices you want to monitor. The Discovery wizard steps you through the process and quickly identifies the devices, and services on devices. You have several options for discovery:
• SNMP SmartScan. Discovers devices by reading SNMP information on your network. This scan type uses an SNMP enabled router to identify the devices in your network and also identifies subnetworks within your network.
• IP range scan. Scans a specified range of IP addresses and finds the devices that respond to a message sent via the Internet Control Message Protocol (ICMP).
• Network Neighborhood. Creates a list of devices by scanning the Windows network to which your computer is connected, and finding the other systems on the network.
• Hosts file import. Imports devices from the hosts file on the local host. (Note the default file may be empty unless you have specifically added devices to it.)
The Discovery wizard displays a list of the devices it has found. If you select to also discover services on a device, the Discovery wizard adds the appropriate monitor for any service found. You can review the results and select the devices to add to the database.
Though dependent on your network, the Discovery process can scan hundreds of devices in a few minutes, even when service discovery is included.
When the discovery process is completed, the WhatsUp Gold console opens. The new “scan” group is listed under the Device Groups with the date and time it was created. When you select the new group, the devices within the group are shown in the Device View. An initial Map View is also created, and can be customized using the mapping features.
Device Groups and Device View
Active Discovery
To keep your network up-to-date, you can set up an Active Discovery process to scan for new devices and monitors. The Active Discovery runs on a specified schedule, daily for example, and adds any new devices or monitors to the Active Discovery Results Report. You can review and select the items you want to add to the database.
WhatsUp Gold v11- Features Overview 4
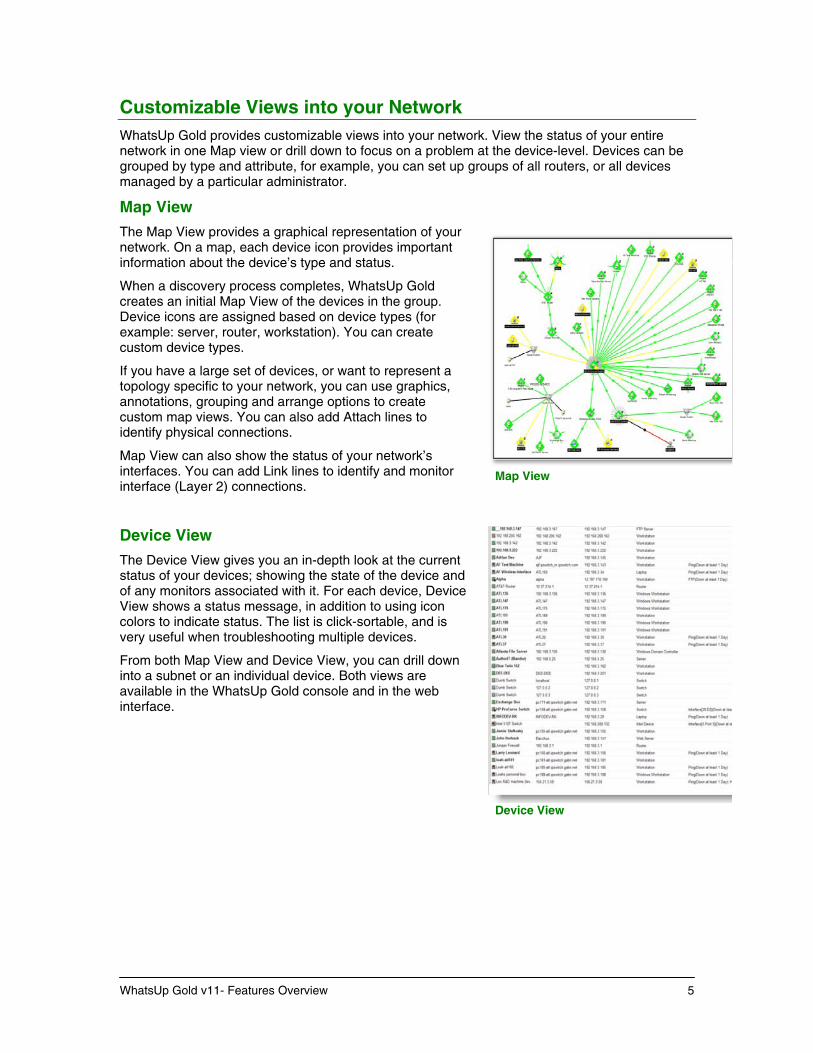
Customizable Views into your Network WhatsUp Gold provides customizable views into your network. View the status of your entire network in one Map view or drill down to focus on a problem at the device-level. Devices can be grouped by type and attribute, for example, you can set up groups of all routers, or all devices managed by a particular administrator.
Map View
The Map View provides a graphical representation of your network. On a map, each device icon provides important information about the device’s type and status.
Map View
Device View
When a discovery process completes, WhatsUp Gold creates an initial Map View of the devices in the group. Device icons are assigned based on device types (for example: server, router, workstation). You can create custom device types.
If you have a large set of devices, or want to represent a topology specific to your network, you can use graphics, annotations, grouping and arrange options to create custom map views. You can also add Attach lines to identify physical connections.
Map View can also show the status of your network’s interfaces. You can add Link lines to identify and monitor interface (Layer 2) connections.
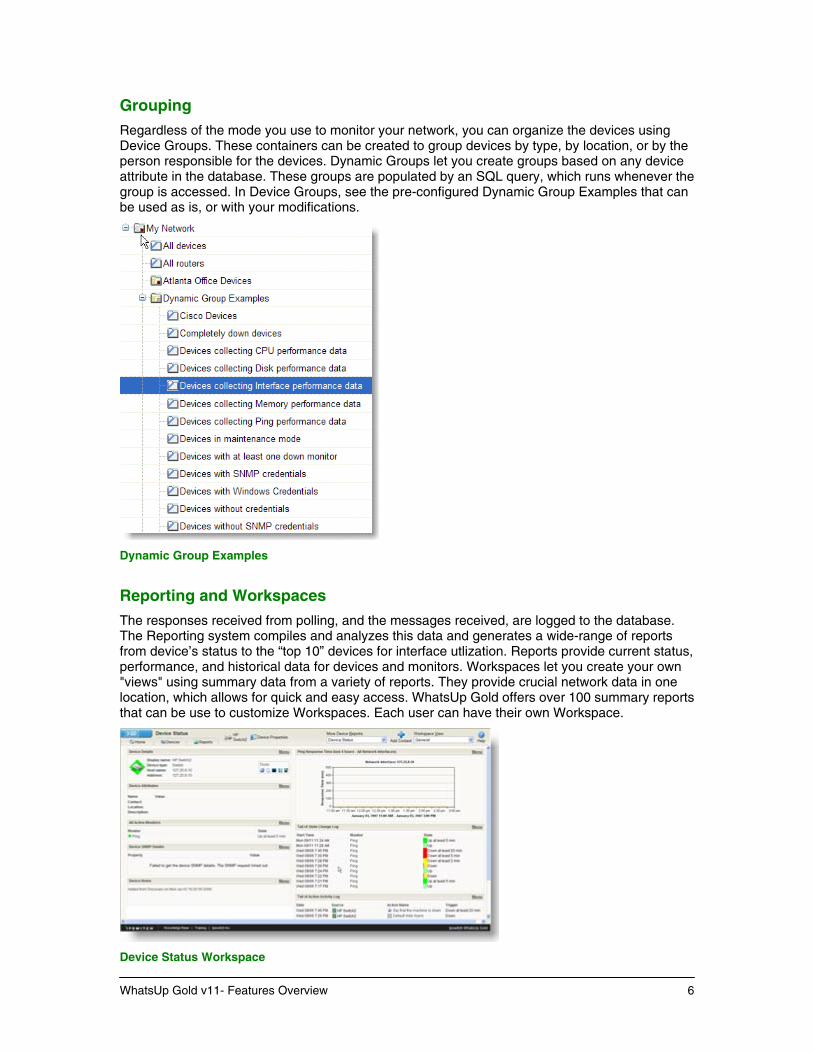
Device View
The Device View gives you an in-depth look at the current status of your devices; showing the state of the device and of any monitors associated with it. For each device, Device View shows a status message, in addition to using icon colors to indicate status. The list is click-sortable, and is very useful when troubleshooting multiple devices.
From both Map View and Device View, you can drill down into a subnet or an individual device. Both views are available in the WhatsUp Gold console and in the web interface.
WhatsUp Gold v11- Features Overview 5
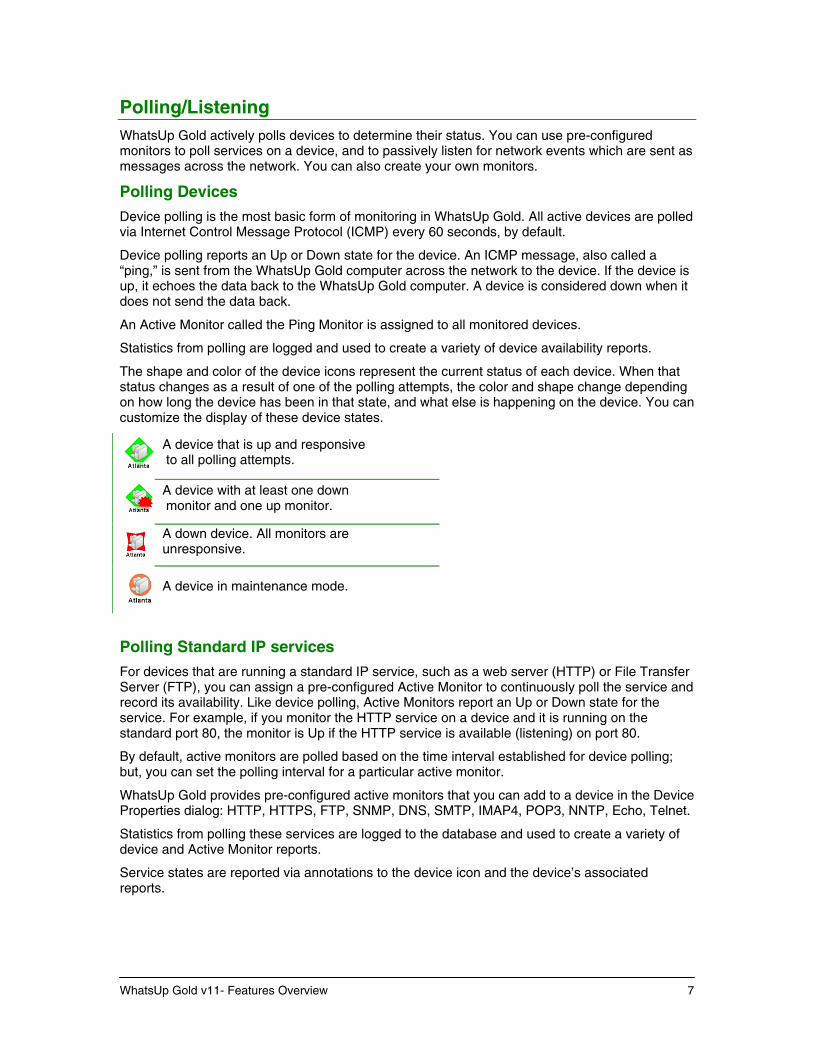
Grouping
Regardless of the mode you use to monitor your network, you can organize the devices using Device Groups. These containers can be created to group devices by type, by location, or by the person responsible for the devices. Dynamic Groups let you create groups based on any device attribute in the database. These groups are populated by an SQL query, which runs whenever the group is accessed. In Device Groups, see the pre-configured Dynamic Group Examples that can be used as is, or with your modifications.
Dynamic Group Examples
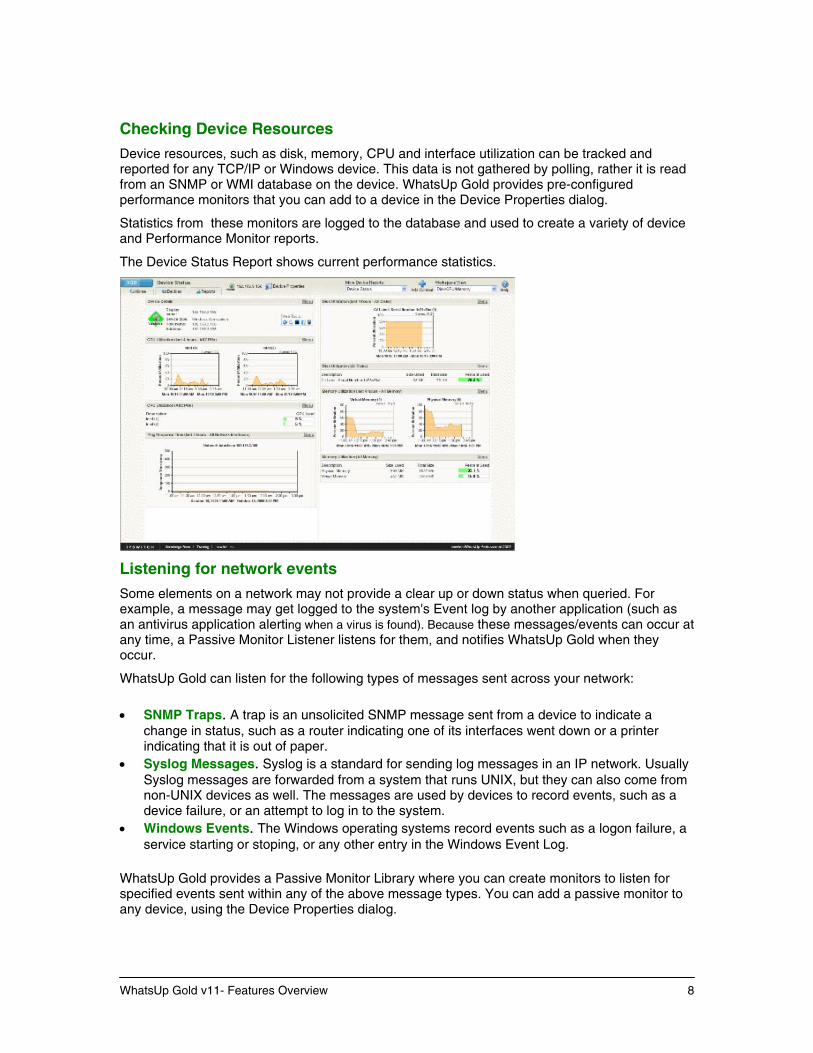
Reporting and Workspaces
The responses received from polling, and the messages received, are logged to the database. The Reporting system compiles and analyzes this data and generates a wide-range of reports from device’s status to the “top 10” devices for interface utlization. Reports provide current status, performance, and historical data for devices and monitors. Workspaces let you create your own "views" using summary data from a variety of reports. They provide crucial network data in one location, which allows for quick and easy access. WhatsUp Gold offers over 100 summary reports that can be use to customize Workspaces. Each user can have their own Workspace.
WhatsUp Gold v11- Features Overview 6
Device Status Workspace
Polling/Listening
WhatsUp Gold actively polls devices to determine their status. You can use pre-configured monitors to poll services on a device, and to passively listen for network events which are sent as messages across the network. You can also create your own monitors.
Polling Devices
Device polling is the most basic form of monitoring in WhatsUp Gold. All active devices are polled via Internet Control Message Protocol (ICMP) every 60 seconds, by default.
Device polling reports an Up or Down state for the device. An ICMP message, also called a “ping,” is sent from the WhatsUp Gold computer across the network to the device. If the device is up, it echoes the data back to the WhatsUp Gold computer. A device is considered down when it does not send the data back.
An Active Monitor called the Ping Monitor is assigned to all monitored devices.
Statistics from polling are logged and used to create a variety of device availability reports.
The shape and color of the device icons represent the current status of each device. When that status changes as a result of one of the polling attempts, the color and shape change depending on how long the device has been in that state, and what else is happening on the device. You can customize the display of these device states.
A device that is up and responsive to all polling attempts.
A device with at least one down monitor and one up monitor.
A down device. All monitors are unresponsive.
A device in maintenance mode.
Polling Standard IP services
For devices that are running a standard IP service, such as a web server (HTTP) or File Transfer Server (FTP), you can assign a pre-configured Active Monitor to continuously poll the service and record its availability. Like device polling, Active Monitors report an Up or Down state for the service. For example, if you monitor the HTTP service on a device and it is running on the standard port 80, the monitor is Up if the HTTP service is available (listening) on port 80.
By default, active monitors are polled based on the time interval established for device polling; but, you can set the polling interval for a particular active monitor.
WhatsUp Gold provides pre-configured active monitors that you can add to a device in the Device Properties dialog: HTTP, HTTPS, FTP, SNMP, DNS, SMTP, IMAP4, POP3, NNTP, Echo, Telnet.
Statistics from polling these services are logged to the database and used to create a variety of device and Active Monitor reports.
Service states are reported via annotations to the device icon and the device’s associated reports.
WhatsUp Gold v11- Features Overview 7
Checking Device Resources
Device resources, such as disk, memory, CPU and interface utilization can be tracked and reported for any TCP/IP or Windows device. This data is not gathered by polling, rather it is read from an SNMP or WMI database on the device. WhatsUp Gold provides pre-configured performance monitors that you can add to a device in the Device Properties dialog.
Statistics from these monitors are logged to the database and used to create a variety of device and Performance Monitor reports.
The Device Status Report shows current performance statistics.
Listening for network events
Some elements on a network may not provide a clear up or down status when queried. For example, a message may get logged to the system's Event log by another application (such as an antivirus application alerting when a virus is found). Because these messages/events can occur at any time, a Passive Monitor Listener listens for them, and notifies WhatsUp Gold when they occur.
WhatsUp Gold can listen for the following types of messages sent across your network:
• SNMP Traps. A trap is an unsolicited SNMP message sent from a device to indicate a change in status, such as a router indicating one of its interfaces went down or a printer indicating that it is out of paper.
• Syslog Messages. Syslog is a standard for sending log messages in an IP network. Usually Syslog messages are forwarded from a system that runs UNIX, but they can also come from non-UNIX devices as well. The messages are used by devices to record events, such as a device failure, or an attempt to log in to the system.
• Windows Events. The Windows operating systems record events such as a logon failure, a service starting or stoping, or any other entry in the Windows Event Log.
WhatsUp Gold provides a Passive Monitor Library where you can create monitors to listen for specified events sent within any of the above message types. You can add a passive monitor to any device, using the Device Properties dialog.
WhatsUp Gold v11- Features Overview 8
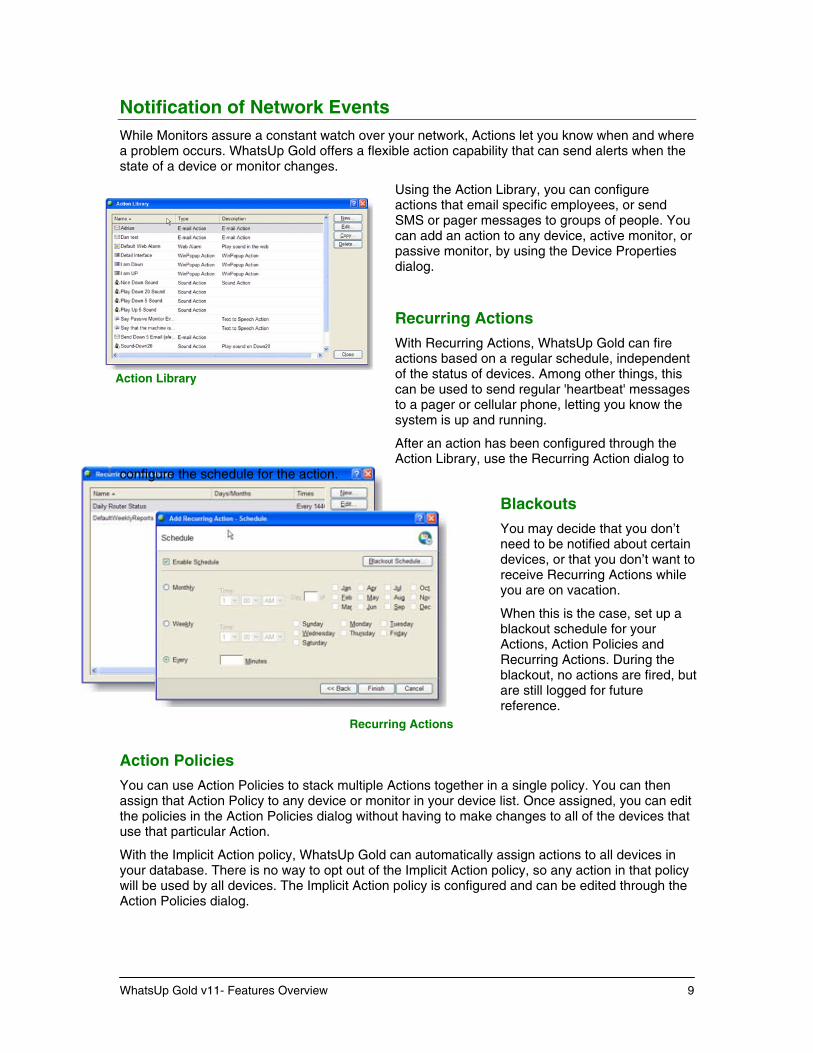
Notification of Network Events While Monitors assure a constant watch over your network, Actions let you know when and where a problem occurs. WhatsUp Gold offers a flexible action capability that can send alerts when the state of a device or monitor changes.
Using the Action Library, you can configure actions that email specific employees, or send SMS or pager messages to groups of people. You can add an action to any device, active monitor, or passive monitor, by using the Device Properties dialog.
Action Library
Recurring Actions
With Recurring Actions, WhatsUp Gold can fire actions based on a regular schedule, independent of the status of devices. Among other things, this can be used to send regular 'heartbeat' messages to a pager or cellular phone, letting you know the system is up and running.
Recurring Actions
After an action has been configured through the Action Library, use the Recurring Action dialog to
configure the schedule for the action.
Blackouts
You may decide that you don’t need to be notified about certain devices, or that you don’t want to receive Recurring Actions while you are on vacation.
When this is the case, set up a blackout schedule for your Actions, Action Policies and Recurring Actions. During the blackout, no actions are fired, butare still logged for future reference.
Action Policies
You can use Action Policies to stack multiple Actions together in a single policy. You can then assign that Action Policy to any device or monitor in your device list. Once assigned, you can edit the policies in the Action Policies dialog without having to make changes to all of the devices that use that particular Action.
With the Implicit Action policy, WhatsUp Gold can automatically assign actions to all devices in your database. There is no way to opt out of the Implicit Action policy, so any action in that policy will be used by all devices. The Implicit Action policy is configured and can be edited through the Action Policies dialog.
WhatsUp Gold v11- Features Overview 9
Data Gathering and Reporting During the network monitoring process, a large amount of information is stored in the WhatsUp Gold database. This information represents the results from Active Monitor polling, Passive Monitor events, and Performance Monitor gathering and can be viewed through the WhatsUp Gold Reporting feature. This feature gives you the ability to view historical trends, or to watch the data as it is gathered in real time.
These graphical reports are viewed through the Reports Tab on the WhatsUp Gold web interface. All of the reports in WhatsUp Gold can be printed or saved as html files, and many can be exported as a text or Microsoft® Excel® file.
Report Types
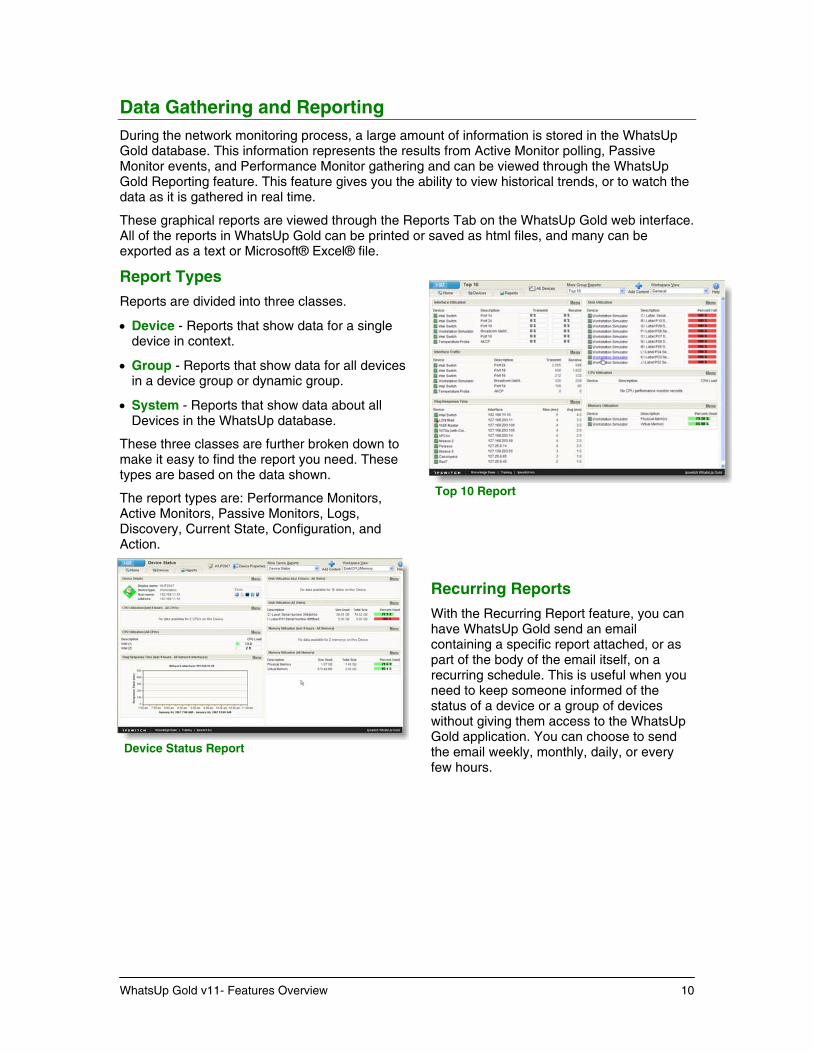
Top 10 Report
Reports are divided into three classes.
• Device - Reports that show data for a single device in context.
• Group - Reports that show data for all devices in a device group or dynamic group.
• System - Reports that show data about all Devices in the WhatsUp database.
These three classes are further broken down to make it easy to find the report you need. These types are based on the data shown.
The report types are: Performance Monitors, Active Monitors, Passive Monitors, Logs, Discovery, Current State, Configuration, and Action.
Device Status Report
Recurring Reports
With the Recurring Report feature, you can have WhatsUp Gold send an email containing a specific report attached, or as part of the body of the email itself, on a recurring schedule. This is useful when you need to keep someone informed of the status of a device or a group of devices without giving them access to the WhatsUp Gold application. You can choose to send the email weekly, monthly, daily, or every few hours.
WhatsUp Gold v11- Features Overview 10
Workspaces WhatsUp Gold v11 provides a significant new capability, via Workspaces, for viewing current status and historical trends provided by report data. Workspaces are views, available in the web interface, that contain summaries or specified elements of the report data.
Workspaces are designed to be user-specific, and are configurable to include report data specific to users' needs. Workspaces contain multiple views that let you organize workspace reports by the type of information they display.
Changes that you make to a workspace view only affect your user account. If you decide to completely change all of the workspace views under your account, your user account will be the only account affected by these changes.
Users with Administrator rights can copy workspace views to other users, which allows for one-time setup and distribution of the workpaces views.
Pre-configured Workspaces
WhatsUp Gold provides the following pre-configured workspaces, which you can modify:
• Home workspace
• Device Status workspace
• Top 10 workspace
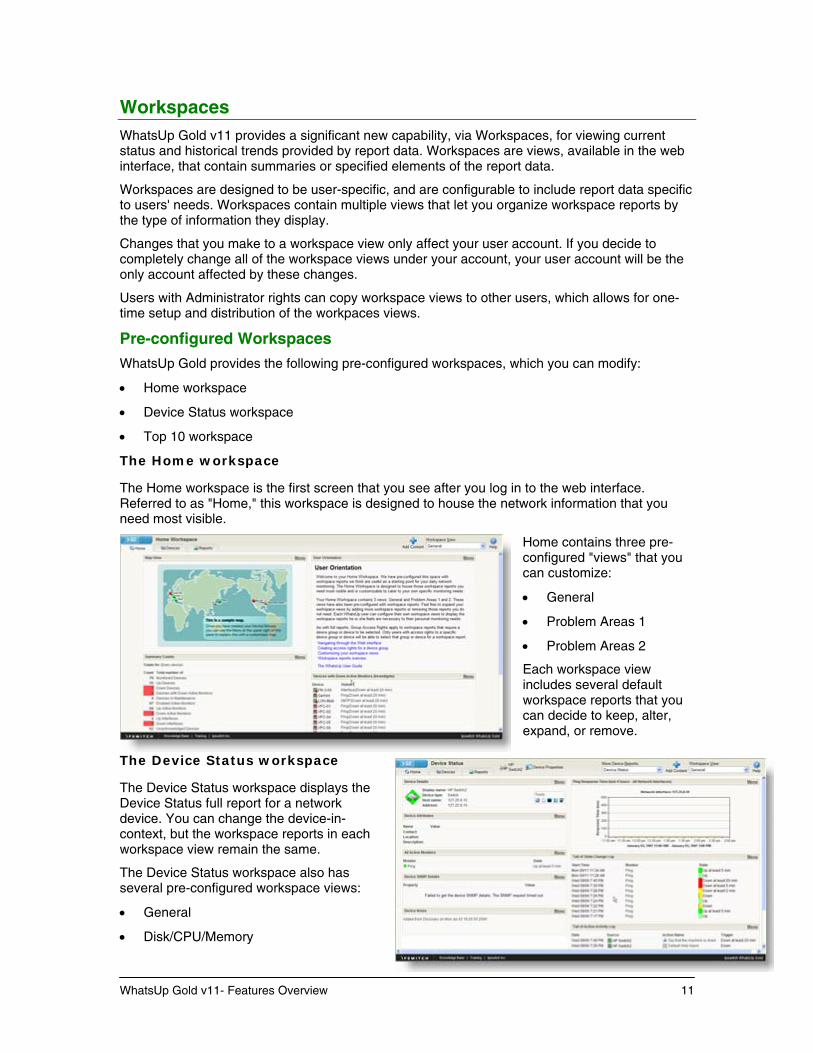
The Home workspace
The Home workspace is the first screen that you see after you log in to the web interface. Referred to as "Home," this workspace is designed to house the network information that you need most visible.
Home contains three pre-configured "views" that you can customize:
• General
• Problem Areas 1
• Problem Areas 2
Each workspace view includes several default workspace reports that you can decide to keep, alter, expand, or remove.
The Device Status workspace
The Device Status workspace displays the Device Status full report for a network device. You can change the device-in-context, but the workspace reports in each workspace view remain the same.
The Device Status workspace also has several pre-configured workspace views:
• General
• Disk/CPU/Memory
WhatsUp Gold v11- Features Overview 11
• Problem Areas
• Router/Switch/Interface
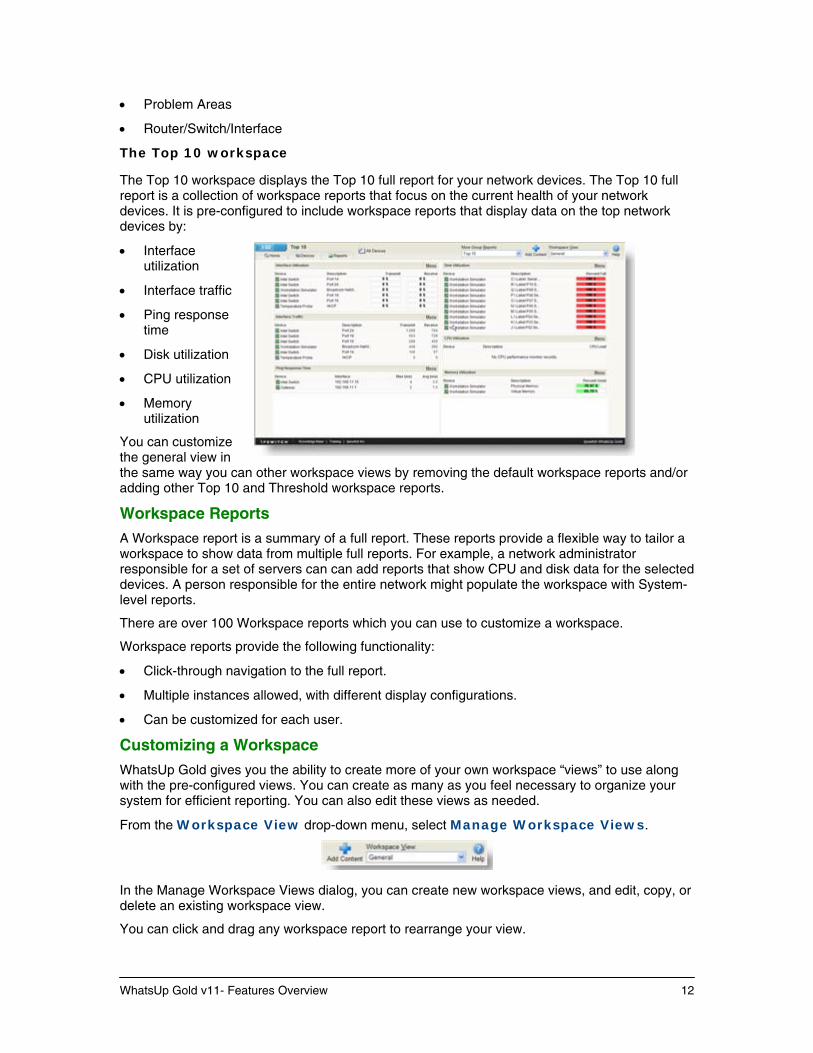
The Top 10 workspace
The Top 10 workspace displays the Top 10 full report for your network devices. The Top 10 full report is a collection of workspace reports that focus on the current health of your network devices. It is pre-configured to include workspace reports that display data on the top network devices by:
• Interface utilization
WhatsUp Gold v11- Features Overview 12
• Interface traffic
• Ping response time
• Disk utilization
• CPU utilization
• Memory utilization
You can customize the general view in the same way you can other workspace views by removing the default workspace reports and/or adding other Top 10 and Threshold workspace reports.
Workspace Reports
A Workspace report is a summary of a full report. These reports provide a flexible way to tailor a workspace to show data from multiple full reports. For example, a network administrator responsible for a set of servers can can add reports that show CPU and disk data for the selected devices. A person responsible for the entire network might populate the workspace with System-level reports.
There are over 100 Workspace reports which you can use to customize a workspace.
Workspace reports provide the following functionality:
• Click-through navigation to the full report.
• Multiple instances allowed, with different display configurations.
• Can be customized for each user.
Customizing a Workspace
WhatsUp Gold gives you the ability to create more of your own workspace “views” to use along with the pre-configured views. You can create as many as you feel necessary to organize your system for efficient reporting. You can also edit these views as needed.
From the Workspace View drop-down menu, select Manage Workspace Views.
In the Manage Workspace Views dialog, you can create new workspace views, and edit, copy, or delete an existing workspace view.
You can click and drag any workspace report to rearrange your view.
Database Driven WhatsUp Gold uses a relational database, Microsoft SQL Server, to store information in tables. This allows for access to the data from any number of standard programs. The customer can easily write their own reports and examine their data in the tables. The use of a standard database technology makes enhancements and maintenance much easier as well.
SQL Server and MSDE
WhatsUp Gold can be used with either Microsoft SQL Server, or with the free MSDE version of SQL Server. MSDE is limited to 2 GB of database size, and can address a maximum of only 2 GB of physical memory (RAM). Also, Microsoft inserts “sleeps,” or a “governor,” in MSDE to slow down processing when more than five user connections (and three system connections) are being used at the same time. These restrictions do not seriously limit the performance of WhatsUp Gold databases under MSDE for most small- and medium-size networks.
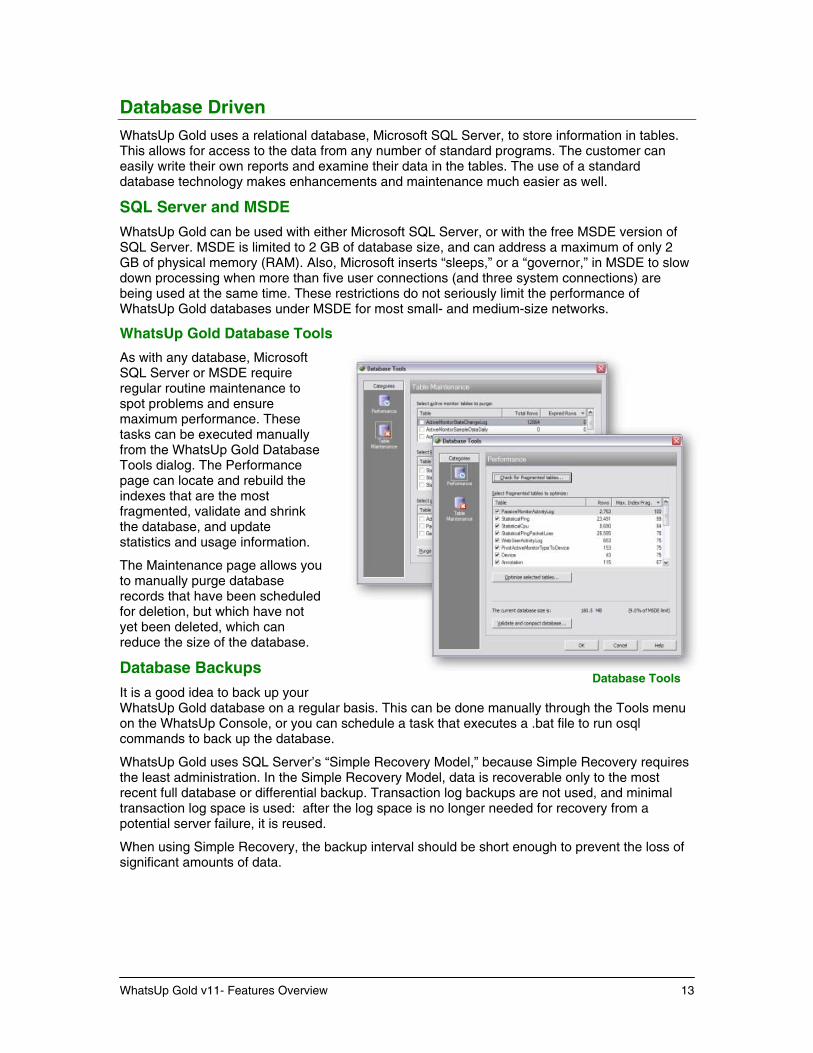
WhatsUp Gold Database Tools
As with any database, Microsoft SQL Server or MSDE require regular routine maintenance to spot problems and ensure maximum performance. These tasks can be executed manually from the WhatsUp Gold Database Tools dialog. The Performance page can locate and rebuild the indexes that are the most fragmented, validate and shrink the database, and update statistics and usage information.
Database Tools
The Maintenance page allows you to manually purge database records that have been scheduled for deletion, but which have not yet been deleted, which can reduce the size of the database.
Database Backups
It is a good idea to back up your WhatsUp Gold database on a regular basis. This can be done manually through the Tools menu on the WhatsUp Console, or you can schedule a task that executes a .bat file to run osql commands to back up the database.
WhatsUp Gold uses SQL Server’s “Simple Recovery Model,” because Simple Recovery requires the least administration. In the Simple Recovery Model, data is recoverable only to the most recent full database or differential backup. Transaction log backups are not used, and minimal transaction log space is used: after the log space is no longer needed for recovery from a potential server failure, it is reused.
When using Simple Recovery, the backup interval should be short enough to prevent the loss of significant amounts of data.
WhatsUp Gold v11- Features Overview 13
Remote Configuration and Management
Through the web interface, you can remotely configure your network, just as if you were sitting at the WhatsUp Gold computer and using the console. Although some of the navigation methods are different, the general functions and configuration procedures are identical.
The web interface runs on the WhatsUp Gold web server, or optionally, on Microsoft Internet Information Services (IIS). The server can be turned on or off in the WhatsUp Gold console, in the Program Options (Web Server section). You can also enable the SSL web server, or change the default port the server is run on.
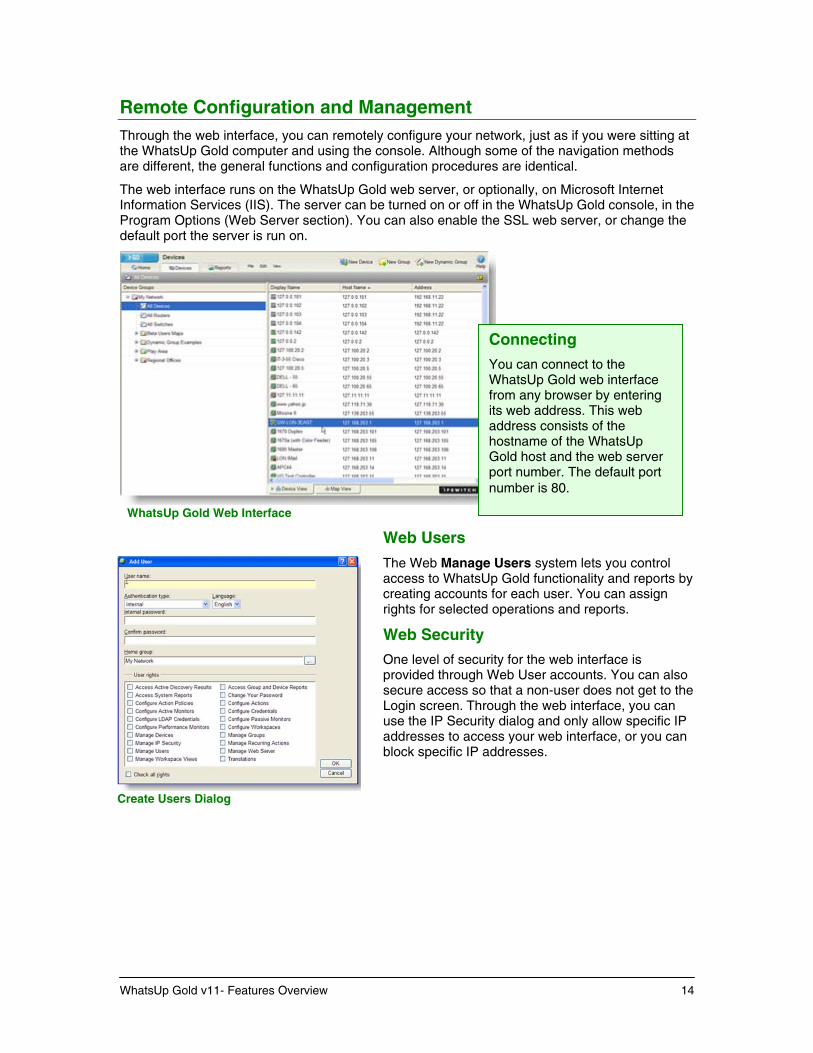
Connecting
You can connect to the WhatsUp Gold web interface from any browser by entering its web address. This web address consists of the hostname of the WhatsUp Gold host and the web server port number. The default port number is 80.
WhatsUp Gold Web Interface
Web Users
Create Users Dialog
The Web Manage Users system lets you control access to WhatsUp Gold functionality and reports by creating accounts for each user. You can assign rights for selected operations and reports.
Web Security
One level of security for the web interface is provided through Web User accounts. You can also secure access so that a non-user does not get to the Login screen. Through the web interface, you can use the IP Security dialog and only allow specific IP addresses to access your web interface, or you can block specific IP addresses.
WhatsUp Gold v11- Features Overview 14
Scripted Monitors and Actions The WhatsUp Gold Active Scripting features lets you create custom scripts that run as an Active Monitor, Performance Monitor, or as an Action. These scripts are written in either JScript or VBScript, and entered into the Active Monitor, Performance, or Action during creation either through the corresponding library, or from a specific device.
Script Examples
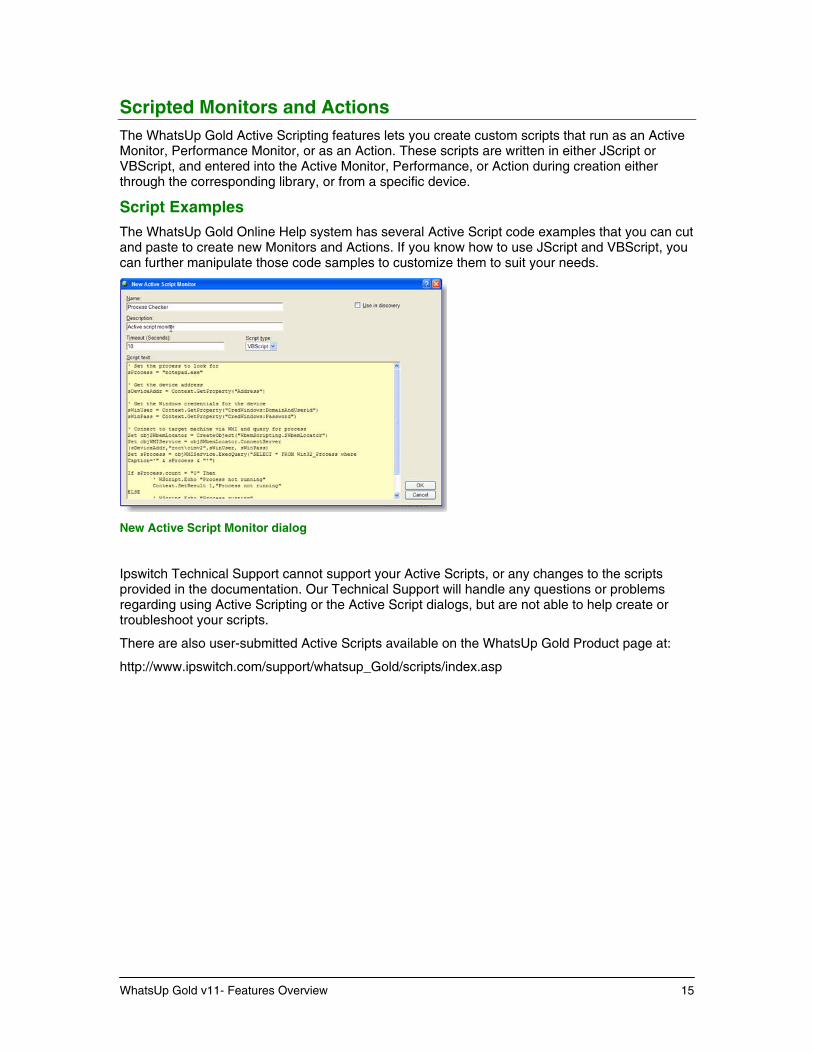
The WhatsUp Gold Online Help system has several Active Script code examples that you can cut and paste to create new Monitors and Actions. If you know how to use JScript and VBScript, you can further manipulate those code samples to customize them to suit your needs.
New Active Script Monitor dialog
Ipswitch Technical Support cannot support your Active Scripts, or any changes to the scripts provided in the documentation. Our Technical Support will handle any questions or problems regarding using Active Scripting or the Active Script dialogs, but are not able to help create or troubleshoot your scripts.
There are also user-submitted Active Scripts available on the WhatsUp Gold Product page at:
http://www.ipswitch.com/support/whatsup_Gold/scripts/index.asp
WhatsUp Gold v11- Features Overview 15
Advanced Monitoring Capabilities
WhatsUp Gold v11- Features Overview 16
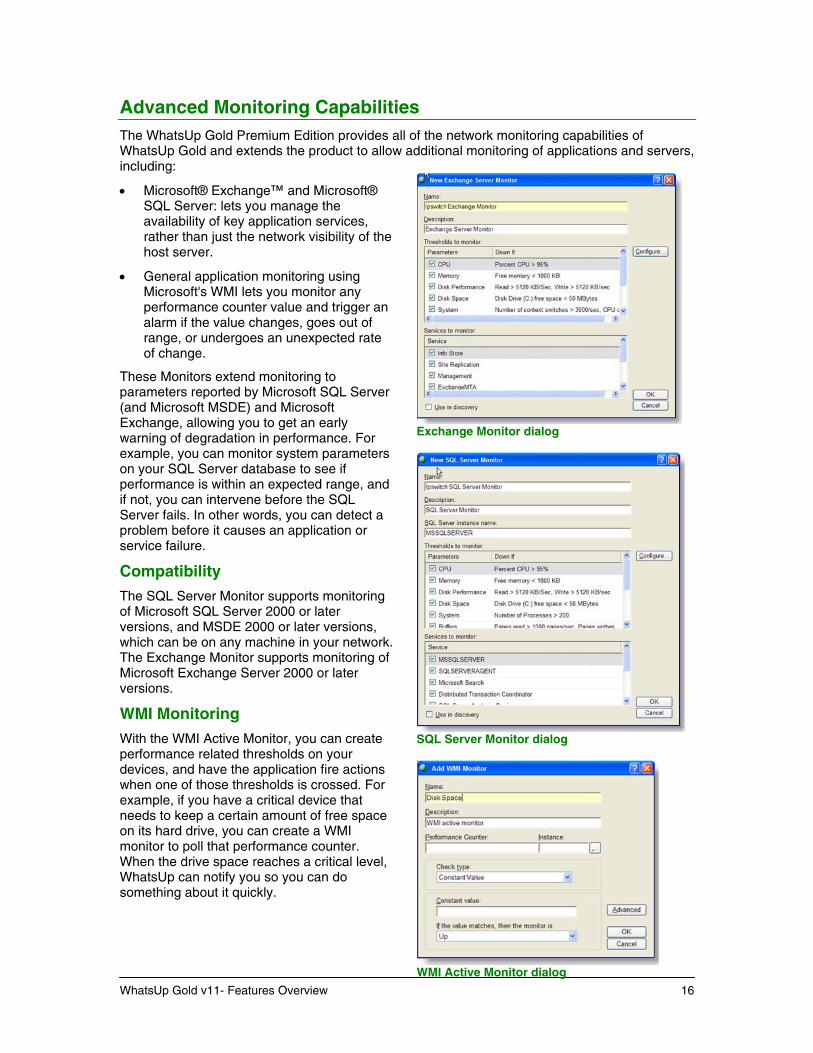
Exchange Monitor dialog
SQL Server Monitor dialog
WMI Active Monitor dialog
The WhatsUp Gold Premium Edition provides all of the network monitoring capabilities of WhatsUp Gold and extends the product to allow additional monitoring of applications and servers, including:
• Microsoft® Exchange™ and Microsoft® SQL Server: lets you manage the availability of key application services, rather than just the network visibility of the host server.
• General application monitoring using Microsoft's WMI lets you monitor any performance counter value and trigger an alarm if the value changes, goes out of range, or undergoes an unexpected rate of change.
These Monitors extend monitoring to parameters reported by Microsoft SQL Server (and Microsoft MSDE) and Microsoft Exchange, allowing you to get an early warning of degradation in performance. For example, you can monitor system parameters on your SQL Server database to see if performance is within an expected range, and if not, you can intervene before the SQL Server fails. In other words, you can detect a problem before it causes an application or service failure.
Compatibility
The SQL Server Monitor supports monitoring of Microsoft SQL Server 2000 or later versions, and MSDE 2000 or later versions, which can be on any machine in your network. The Exchange Monitor supports monitoring of Microsoft Exchange Server 2000 or later versions.
WMI Monitoring
With the WMI Active Monitor, you can create performance related thresholds on your devices, and have the application fire actions when one of those thresholds is crossed. For example, if you have a critical device that needs to keep a certain amount of free space on its hard drive, you can create a WMI monitor to poll that performance counter. When the drive space reaches a critical level, WhatsUp can notify you so you can do something about it quickly.
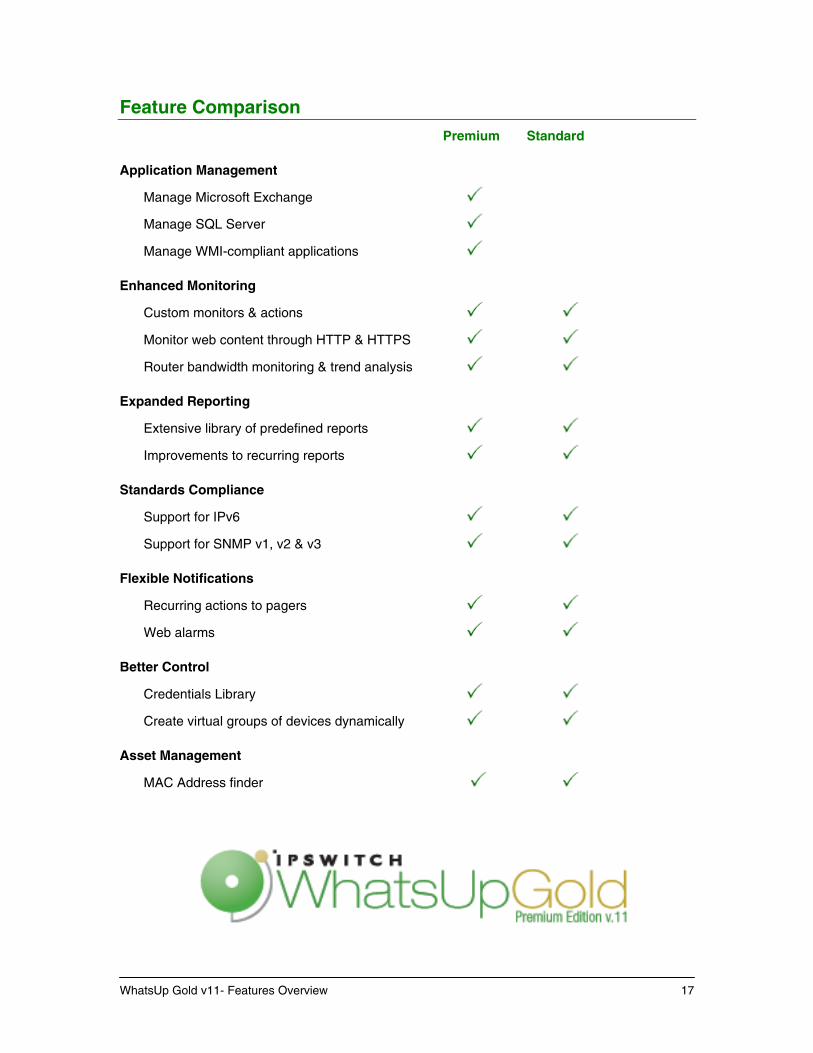
Feature Comparison Premium Standard
Application Management
Manage Microsoft Exchange
Manage SQL Server
Manage WMI-compliant applications
Enhanced Monitoring
Custom monitors & actions
Monitor web content through HTTP & HTTPS
Router bandwidth monitoring & trend analysis
Expanded Reporting
Extensive library of predefined reports
Improvements to recurring reports
Standards Compliance
Support for IPv6
Support for SNMP v1, v2 & v3
Flexible Notifications
Recurring actions to pagers
Web alarms
Better Control
Credentials Library
Create virtual groups of devices dynamically
Asset Management
MAC Address finder
WhatsUp Gold v11- Features Overview 17