WHAT’S TRENDING IN BEVERAGE ALCOHOL - ECRM- A … · WHAT’S TRENDING IN BEVERAGE ALCOHOL....
58
1 Copyright © 2017 The Nielsen Company. Confidential and proprietary. Copyright © 2017 The Nielsen Company. Confidential and proprietary. Chateau Elan Winery & Resort Braselton, GA August 27, 2017 WHAT’S TRENDING IN BEVERAGE ALCOHOL Global Wine, Beer, & Spirits EPPS
Transcript of WHAT’S TRENDING IN BEVERAGE ALCOHOL - ECRM- A … · WHAT’S TRENDING IN BEVERAGE ALCOHOL....
1Cop
yrig
ht ©
201
7 Th
e N
iels
en C
ompa
ny. C
onfid
entia
l and
pro
prie
tary
.
Copyright © 2017 The Nielsen Company. Confidential and proprietary.
Chateau Elan Winery & ResortBraselton, GAAugust 27, 2017
WHAT’S TRENDING IN BEVERAGE ALCOHOL
Global Wine, Beer, & Spirits EPPS
2Cop
yrig
ht ©
201
7 Th
e N
iels
en C
ompa
ny. C
onfid
entia
l and
pro
prie
tary
.
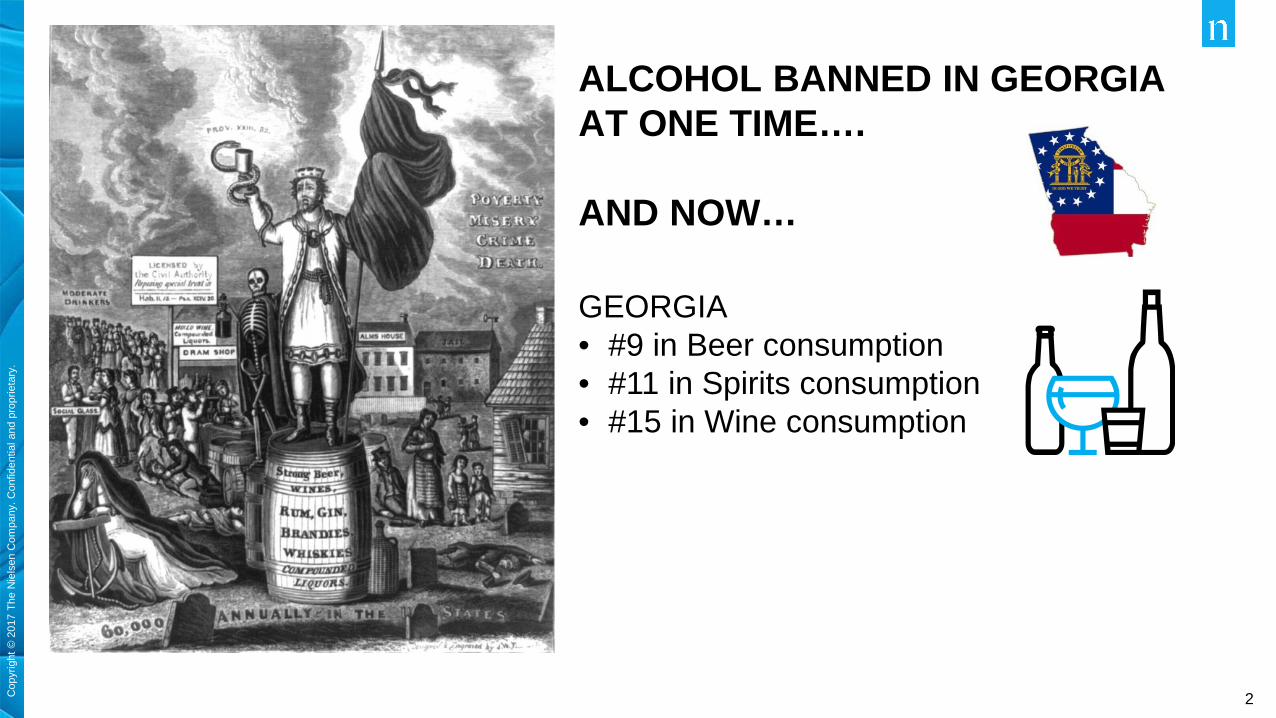
ALCOHOL BANNED IN GEORGIA AT ONE TIME….
AND NOW…
GEORGIA• #9 in Beer consumption• #11 in Spirits consumption• #15 in Wine consumption
3Cop
yrig
ht ©
201
7 Th
e N
iels
en C
ompa
ny. C
onfid
entia
l and
pro
prie
tary
.
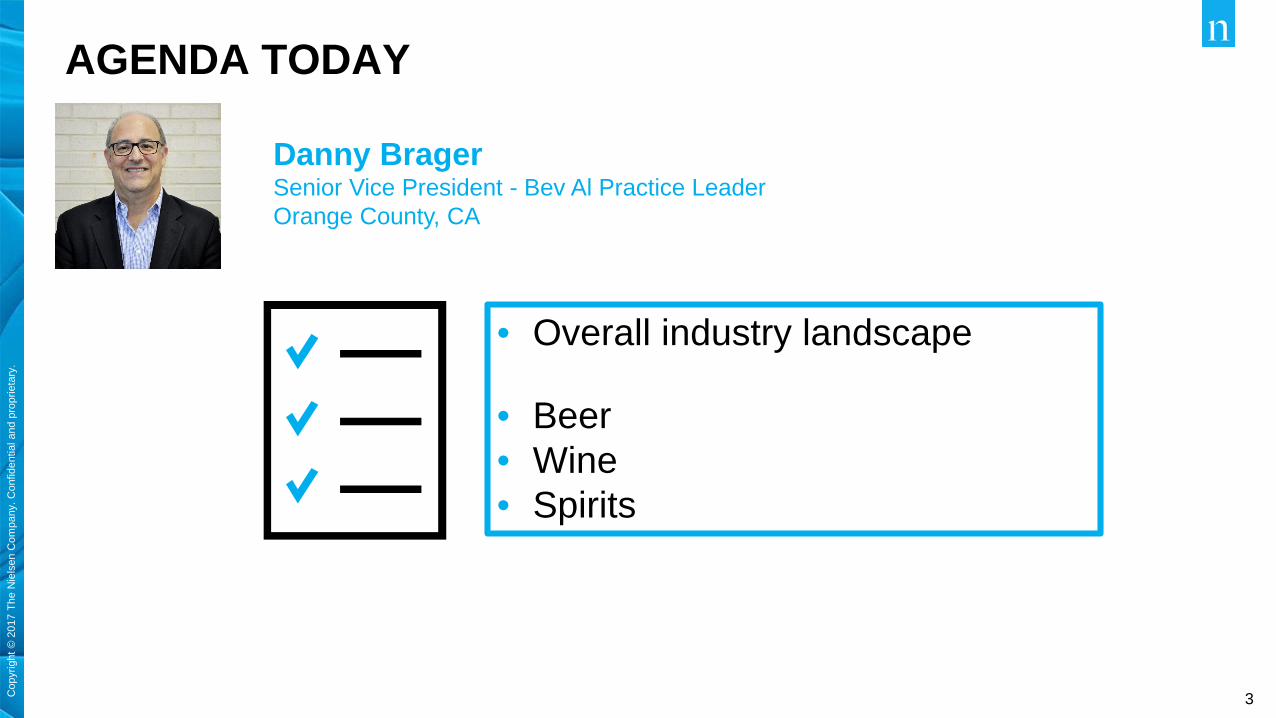
AGENDA TODAY
Danny BragerSenior Vice President - Bev Al Practice LeaderOrange County, CA
• Overall industry landscape
• Beer• Wine• Spirits
4Cop
yrig
ht ©
201
7 Th
e N
iels
en C
ompa
ny. C
onfid
entia
l and
pro
prie
tary
.
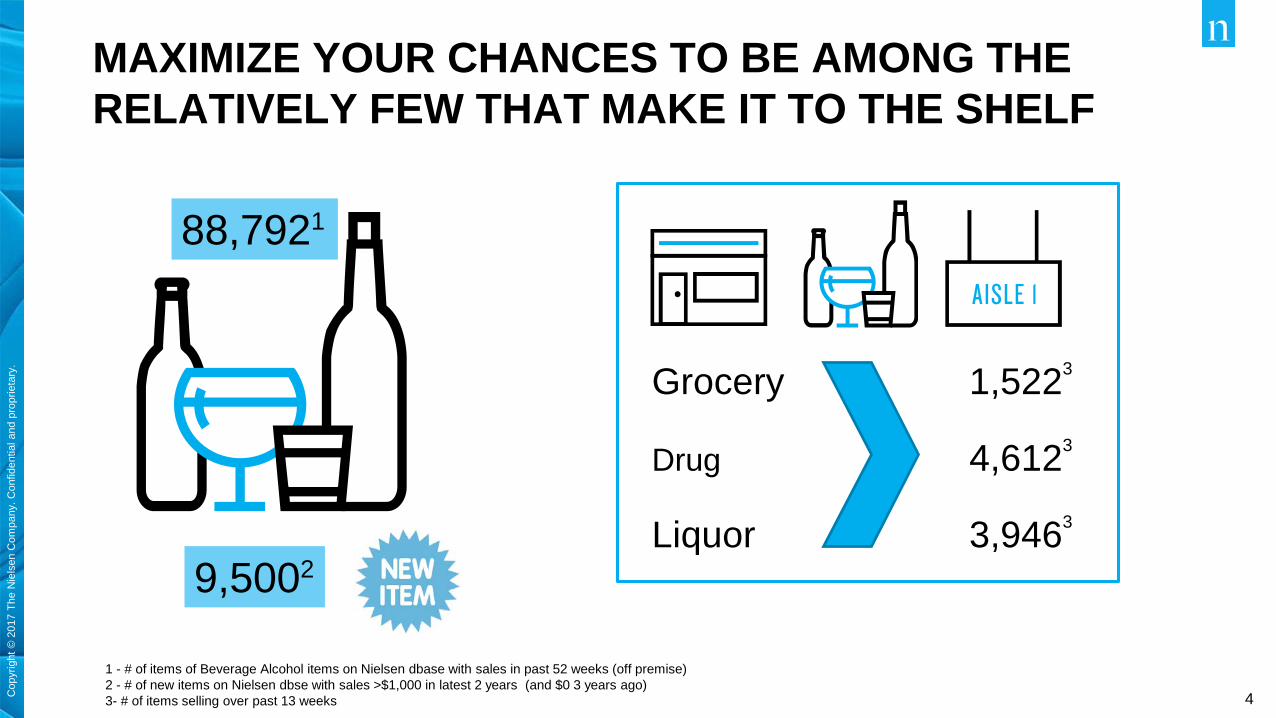
MAXIMIZE YOUR CHANCES TO BE AMONG THE RELATIVELY FEW THAT MAKE IT TO THE SHELF
1 - # of items of Beverage Alcohol items on Nielsen dbase with sales in past 52 weeks (off premise)2 - # of new items on Nielsen dbse with sales >$1,000 in latest 2 years (and $0 3 years ago)3- # of items selling over past 13 weeks
88,7921
9,5002
Grocery 1,5223
Drug 4,6123
Liquor 3,9463

5Cop
yrig
ht ©
201
7 Th
e N
iels
en C
ompa
ny. C
onfid
entia
l and
pro
prie
tary
.
Copyright © 2017 The Nielsen Company. Confidential and proprietary.
TREND OR FAD?
GET IN? GET OUT? STAY OUT!
6Cop
yrig
ht ©
201
7 Th
e N
iels
en C
ompa
ny. C
onfid
entia
l and
pro
prie
tary
.
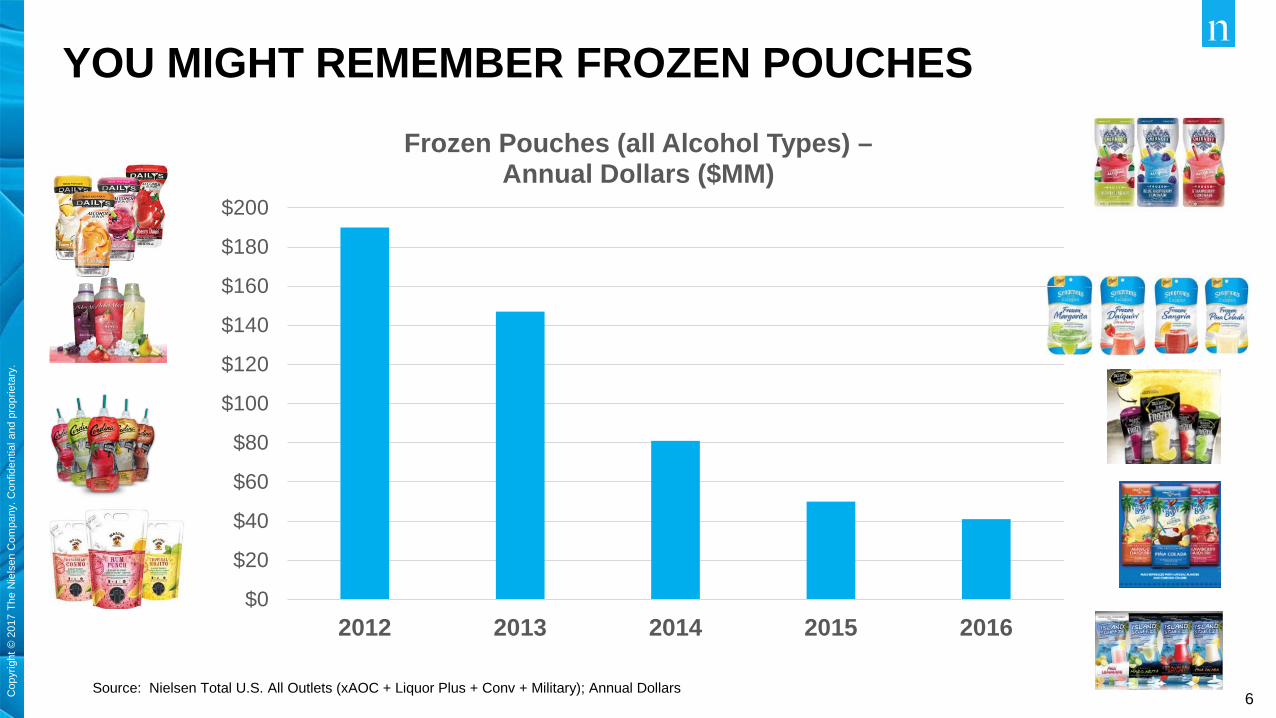
YOU MIGHT REMEMBER FROZEN POUCHES
Source: Nielsen Total U.S. All Outlets (xAOC + Liquor Plus + Conv + Military); Annual Dollars
$0
$20
$40
$60
$80
$100
$120
$140
$160
$180
$200
2012 2013 2014 2015 2016
Frozen Pouches (all Alcohol Types) –Annual Dollars ($MM)
7Cop
yrig
ht ©
201
7 Th
e N
iels
en C
ompa
ny. C
onfid
entia
l and
pro
prie
tary
.
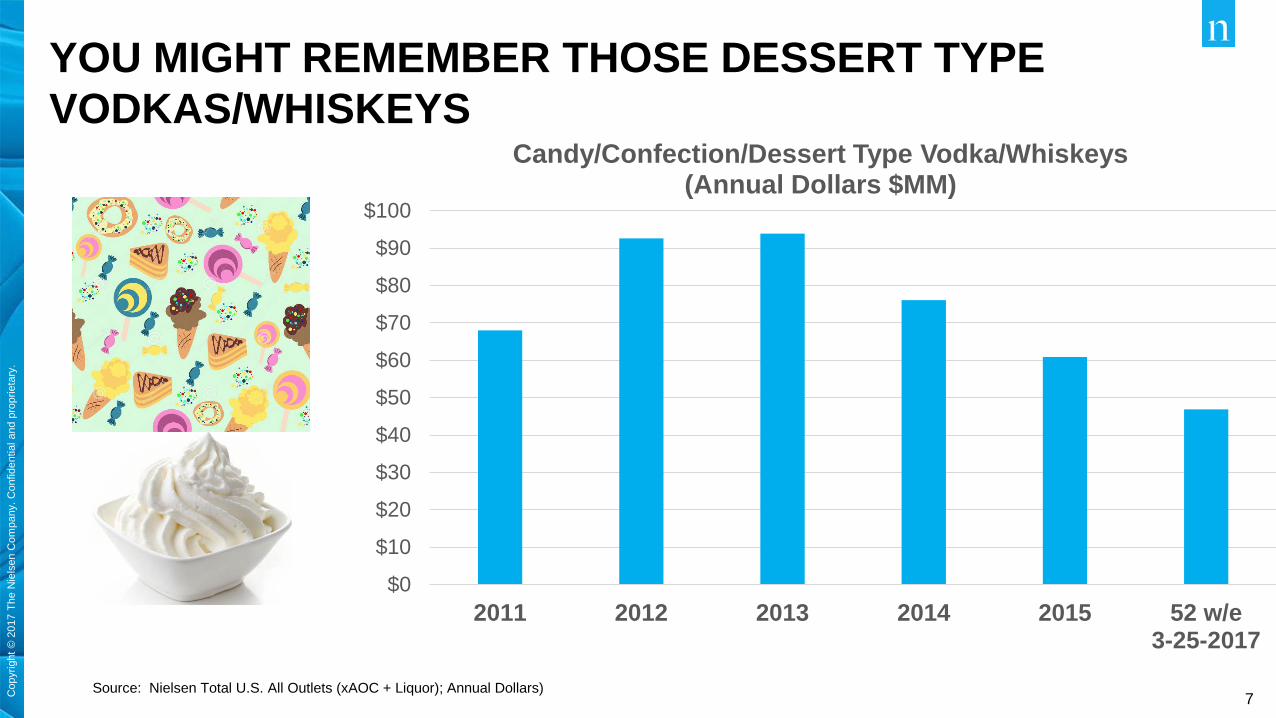
YOU MIGHT REMEMBER THOSE DESSERT TYPE VODKAS/WHISKEYS
Source: Nielsen Total U.S. All Outlets (xAOC + Liquor); Annual Dollars)
$0
$10
$20
$30
$40
$50
$60
$70
$80
$90
$100
2011 2012 2013 2014 2015 52 w/e3-25-2017
Candy/Confection/Dessert Type Vodka/Whiskeys (Annual Dollars $MM)
8Cop
yrig
ht ©
201
7 Th
e N
iels
en C
ompa
ny. C
onfid
entia
l and
pro
prie
tary
.
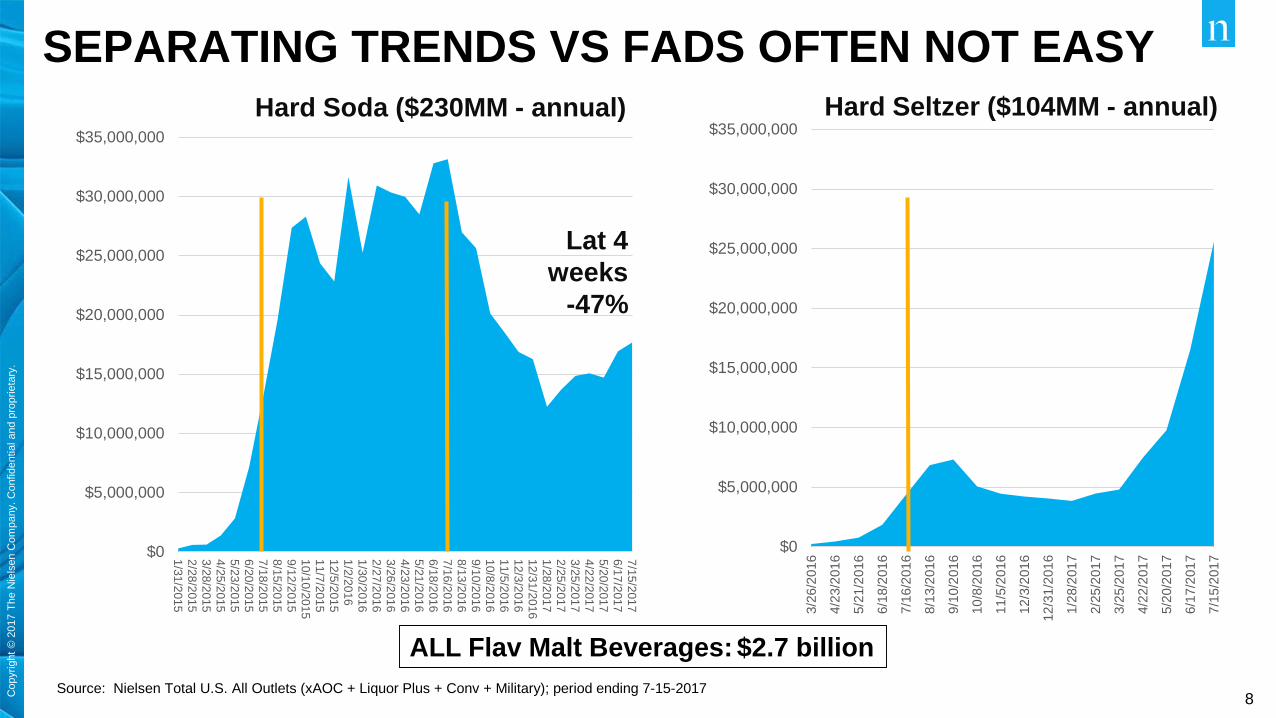
SEPARATING TRENDS VS FADS OFTEN NOT EASY
Source: Nielsen Total U.S. All Outlets (xAOC + Liquor Plus + Conv + Military); period ending 7-15-2017
$0
$5,000,000
$10,000,000
$15,000,000
$20,000,000
$25,000,000
$30,000,000
$35,000,000
1/31/20152/28/20153/28/20154/25/20155/23/20156/20/20157/18/20158/15/20159/12/201510/10/201511/7/201512/5/20151/2/20161/30/20162/27/20163/26/20164/23/20165/21/20166/18/20167/16/20168/13/20169/10/201610/8/201611/5/201612/3/201612/31/20161/28/20172/25/20173/25/20174/22/20175/20/20176/17/20177/15/2017
Hard Soda ($230MM - annual)
Lat 4 weeks
-47%
ALL Flav Malt Beverages: $2.7 billion
$0
$5,000,000
$10,000,000
$15,000,000
$20,000,000
$25,000,000
$30,000,000
$35,000,000
3/26
/201
6
4/23
/201
6
5/21
/201
6
6/18
/201
6
7/16
/201
6
8/13
/201
6
9/10
/201
6
10/8
/201
6
11/5
/201
6
12/3
/201
6
12/3
1/20
16
1/28
/201
7
2/25
/201
7
3/25
/201
7
4/22
/201
7
5/20
/201
7
6/17
/201
7
7/15
/201
7
Hard Seltzer ($104MM - annual)
9Cop
yrig
ht ©
201
7 Th
e N
iels
en C
ompa
ny. C
onfid
entia
l and
pro
prie
tary
.
Copyright © 2017 The Nielsen Company. Confidential and proprietary.
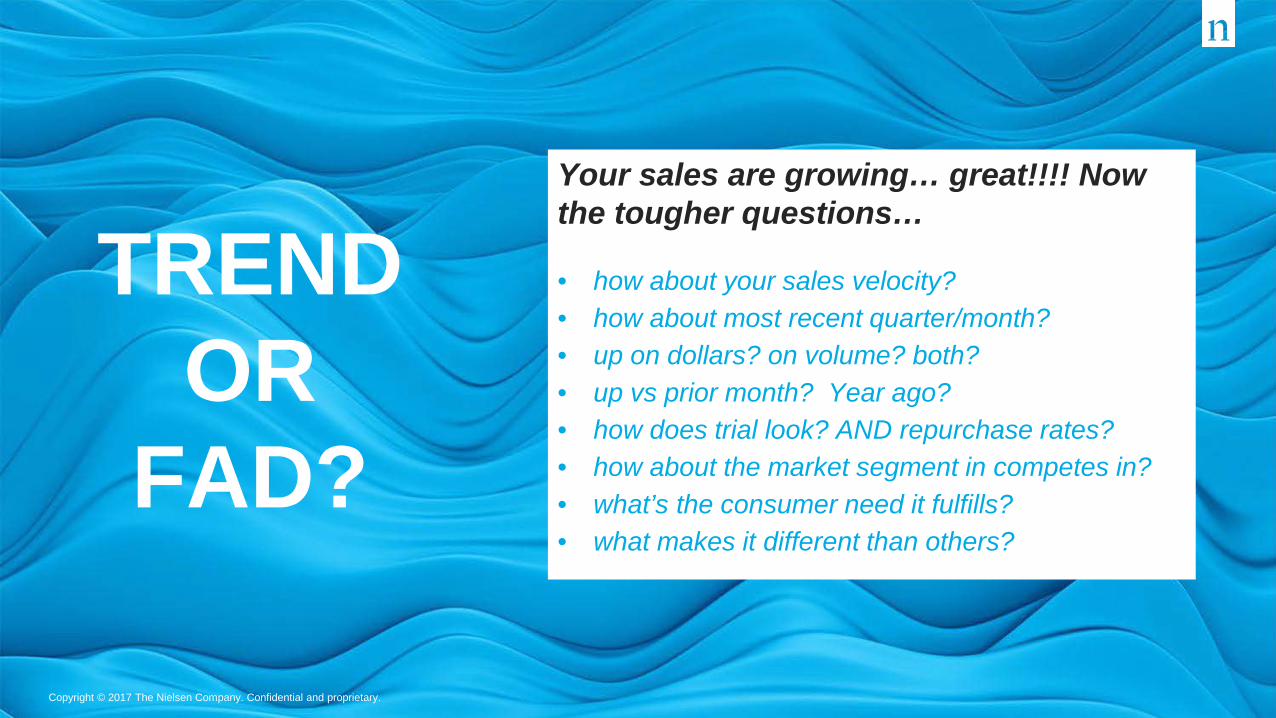
TREND OR
FAD?
Your sales are growing… great!!!! Now the tougher questions…
• how about your sales velocity?• how about most recent quarter/month?• up on dollars? on volume? both?• up vs prior month? Year ago? • how does trial look? AND repurchase rates?• how about the market segment in competes in? • what’s the consumer need it fulfills?• what makes it different than others?
10Cop
yrig
ht ©
201
7 Th
e N
iels
en C
ompa
ny. C
onfid
entia
l and
pro
prie
tary
.
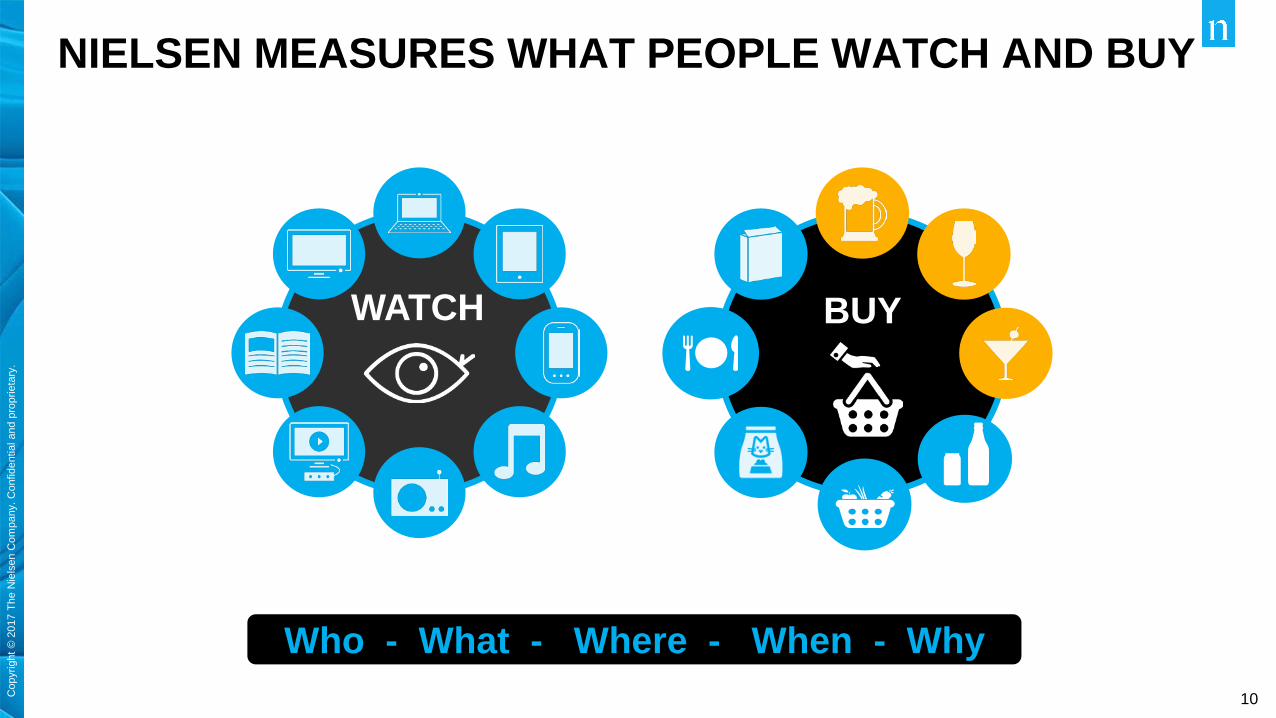
NIELSEN MEASURES WHAT PEOPLE WATCH AND BUY
WATCH
Who - What - Where - When - Why
BUY
11Cop
yrig
ht ©
201
7 Th
e N
iels
en C
ompa
ny. C
onfid
entia
l and
pro
prie
tary
.
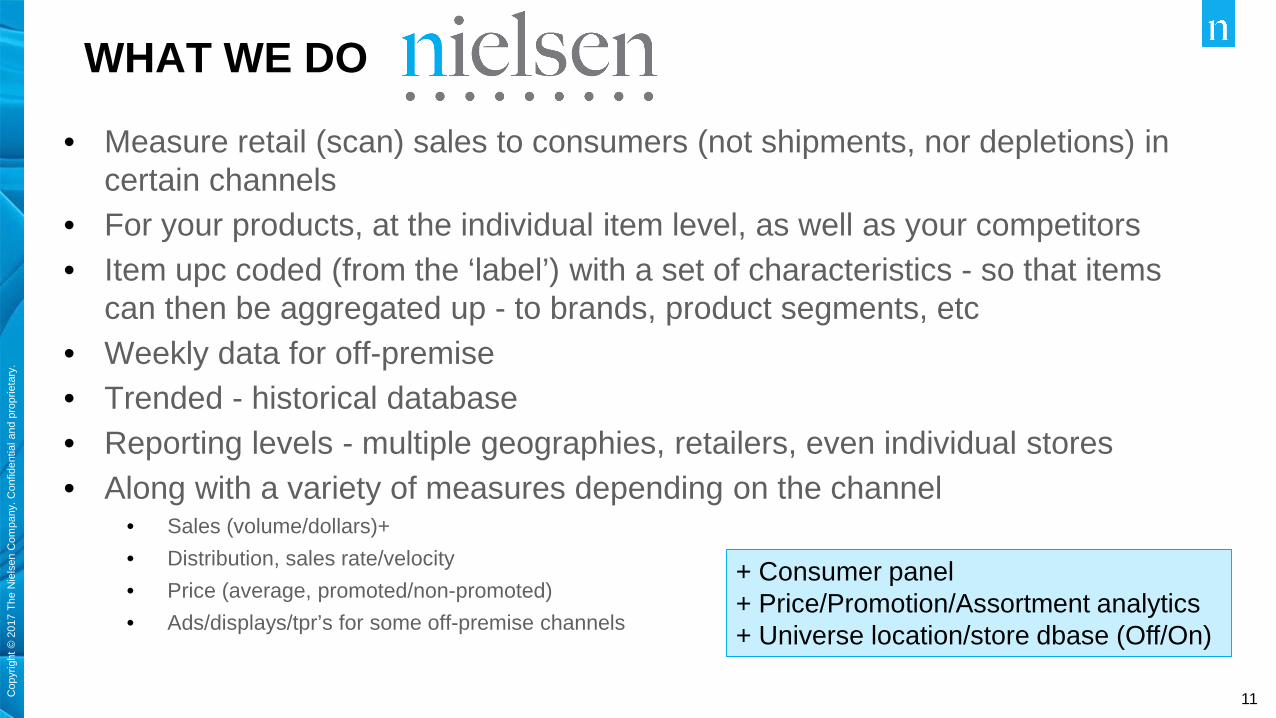
WHAT WE DO
• Measure retail (scan) sales to consumers (not shipments, nor depletions) in certain channels
• For your products, at the individual item level, as well as your competitors • Item upc coded (from the ‘label’) with a set of characteristics - so that items
can then be aggregated up - to brands, product segments, etc• Weekly data for off-premise• Trended - historical database• Reporting levels - multiple geographies, retailers, even individual stores• Along with a variety of measures depending on the channel
• Sales (volume/dollars)+ • Distribution, sales rate/velocity• Price (average, promoted/non-promoted)• Ads/displays/tpr’s for some off-premise channels
+ Consumer panel+ Price/Promotion/Assortment analytics+ Universe location/store dbase (Off/On)
12Cop
yrig
ht ©
201
7 Th
e N
iels
en C
ompa
ny. C
onfid
entia
l and
pro
prie
tary
.
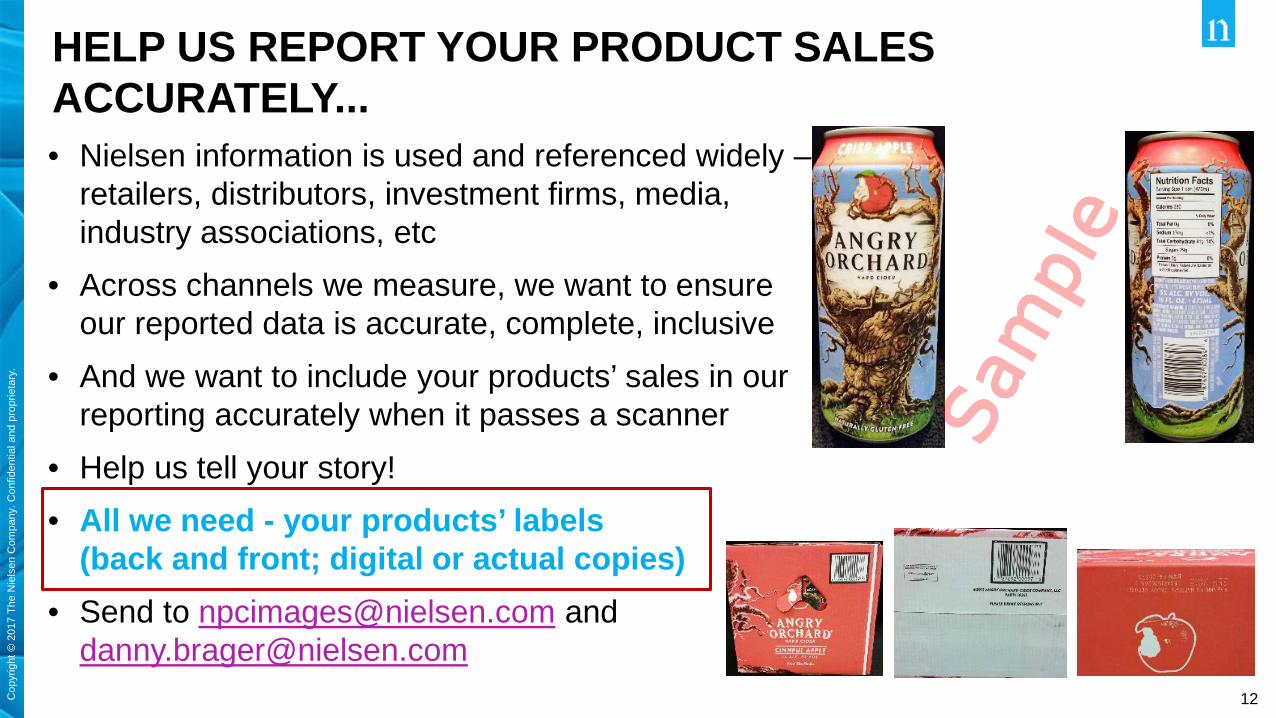
HELP US REPORT YOUR PRODUCT SALES ACCURATELY...• Nielsen information is used and referenced widely –
retailers, distributors, investment firms, media, industry associations, etc
• Across channels we measure, we want to ensure our reported data is accurate, complete, inclusive
• And we want to include your products’ sales in our reporting accurately when it passes a scanner
• Help us tell your story!• All we need - your products’ labels
(back and front; digital or actual copies)• Send to [email protected] and
13Cop
yrig
ht ©
201
7 Th
e N
iels
en C
ompa
ny. C
onfid
entia
l and
pro
prie
tary
.
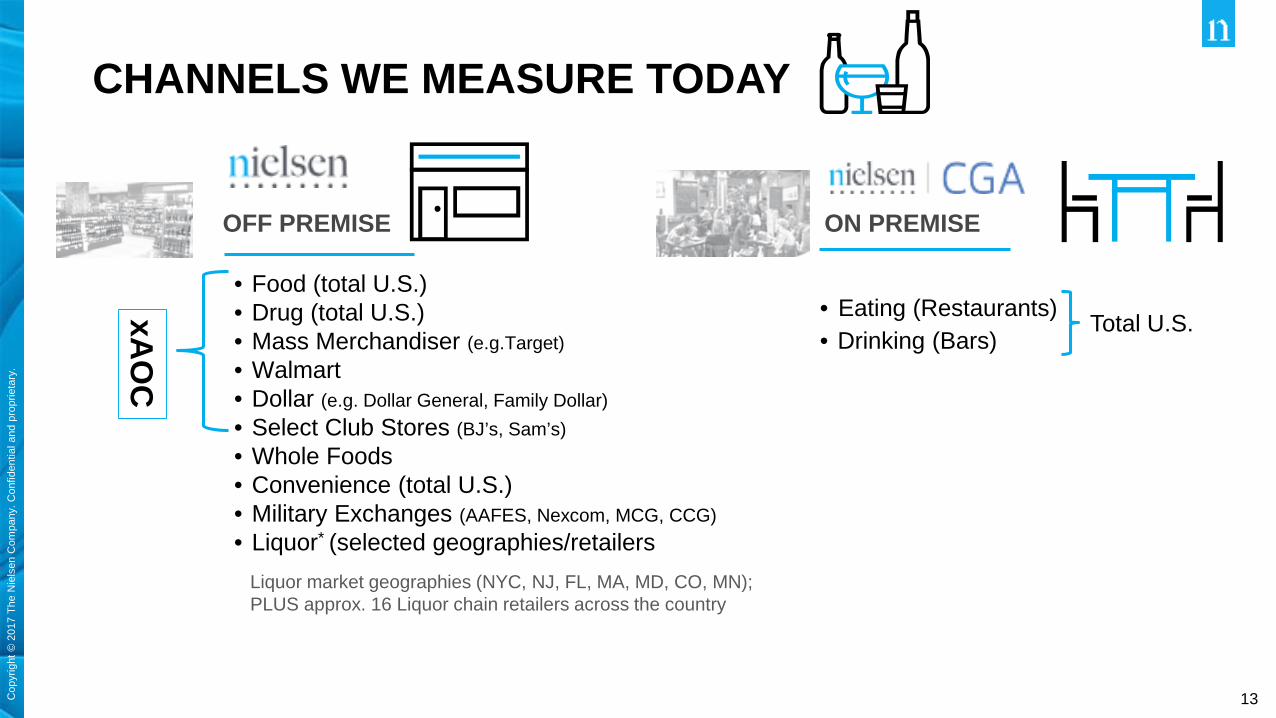
CHANNELS WE MEASURE TODAY
OFF PREMISE
• Food (total U.S.)• Drug (total U.S.)• Mass Merchandiser (e.g.Target)• Walmart• Dollar (e.g. Dollar General, Family Dollar)• Select Club Stores (BJ’s, Sam’s)• Whole Foods• Convenience (total U.S.)• Military Exchanges (AAFES, Nexcom, MCG, CCG)• Liquor* (selected geographies/retailers
ON PREMISE
• Eating (Restaurants)• Drinking (Bars)
Liquor market geographies (NYC, NJ, FL, MA, MD, CO, MN); PLUS approx. 16 Liquor chain retailers across the country
xAO
C
Total U.S.
14Cop
yrig
ht ©
201
7 Th
e N
iels
en C
ompa
ny. C
onfid
entia
l and
pro
prie
tary
.
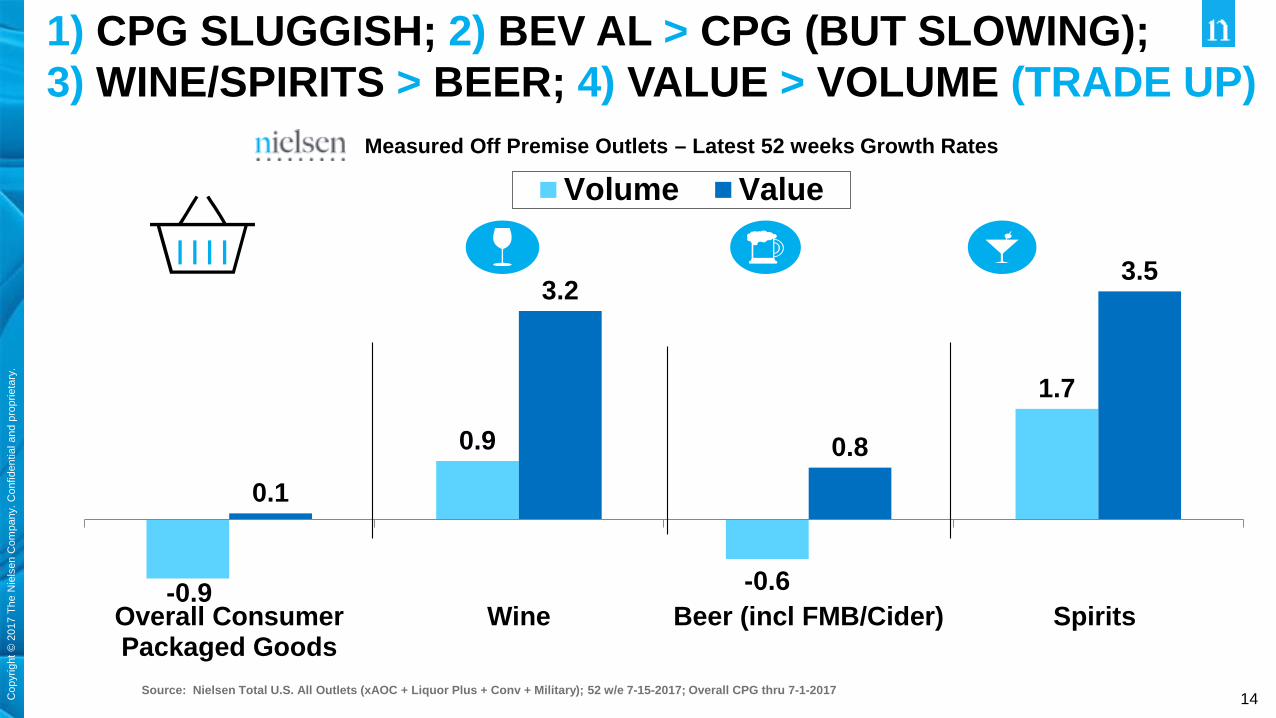
-0.9
0.9
-0.6
1.7
0.1
3.2
0.8
3.5
Overall ConsumerPackaged Goods
Wine Beer (incl FMB/Cider) Spirits
Measured Off Premise Outlets – Latest 52 weeks Growth Rates
Volume Value
1) CPG SLUGGISH; 2) BEV AL > CPG (BUT SLOWING); 3) WINE/SPIRITS > BEER; 4) VALUE > VOLUME (TRADE UP)
Source: Nielsen Total U.S. All Outlets (xAOC + Liquor Plus + Conv + Military); 52 w/e 7-15-2017; Overall CPG thru 7-1-2017
15Cop
yrig
ht ©
201
7 Th
e N
iels
en C
ompa
ny. C
onfid
entia
l and
pro
prie
tary
.
15
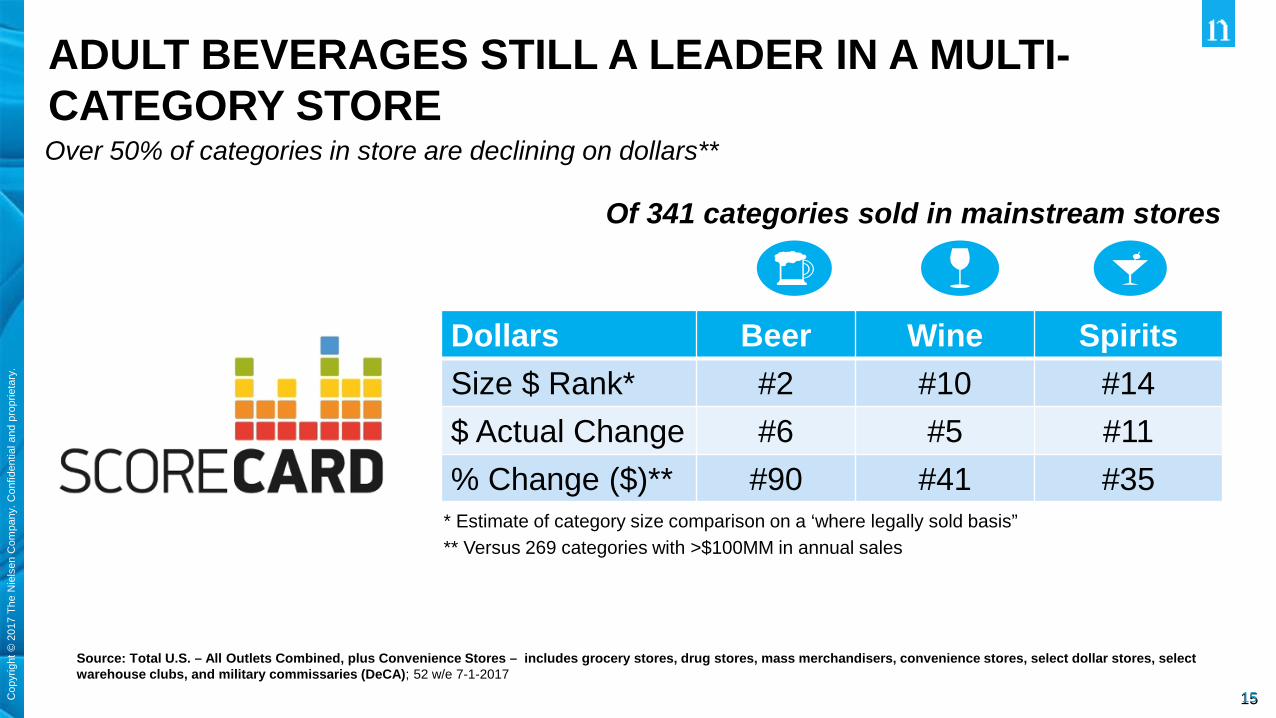
ADULT BEVERAGES STILL A LEADER IN A MULTI-CATEGORY STORE
Source: Total U.S. – All Outlets Combined, plus Convenience Stores – includes grocery stores, drug stores, mass merchandisers, convenience stores, select dollar stores, select warehouse clubs, and military commissaries (DeCA); 52 w/e 7-1-2017
Over 50% of categories in store are declining on dollars**
Dollars Beer Wine SpiritsSize $ Rank* #2 #10 #14$ Actual Change #6 #5 #11% Change ($)** #90 #41 #35
Of 341 categories sold in mainstream stores
* Estimate of category size comparison on a ‘where legally sold basis”** Versus 269 categories with >$100MM in annual sales
Copyright © 2017 The Nielsen Company. Confidential and proprietary.
17Cop
yrig
ht ©
201
7 Th
e N
iels
en C
ompa
ny. C
onfid
entia
l and
pro
prie
tary
.
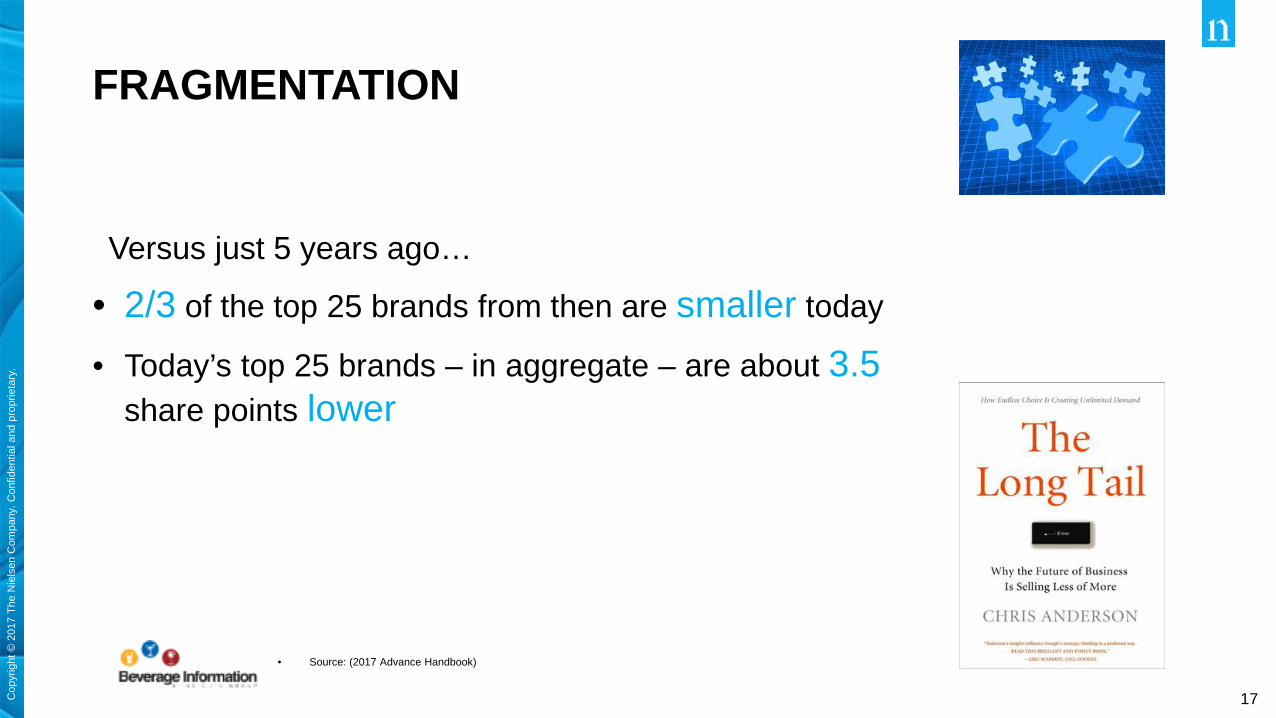
FRAGMENTATION
Versus just 5 years ago…
• 2/3 of the top 25 brands from then are smaller today
• Today’s top 25 brands – in aggregate – are about 3.5 share points lower
• Source: (2017 Advance Handbook)
18Cop
yrig
ht ©
201
7 Th
e N
iels
en C
ompa
ny. C
onfid
entia
l and
pro
prie
tary
.
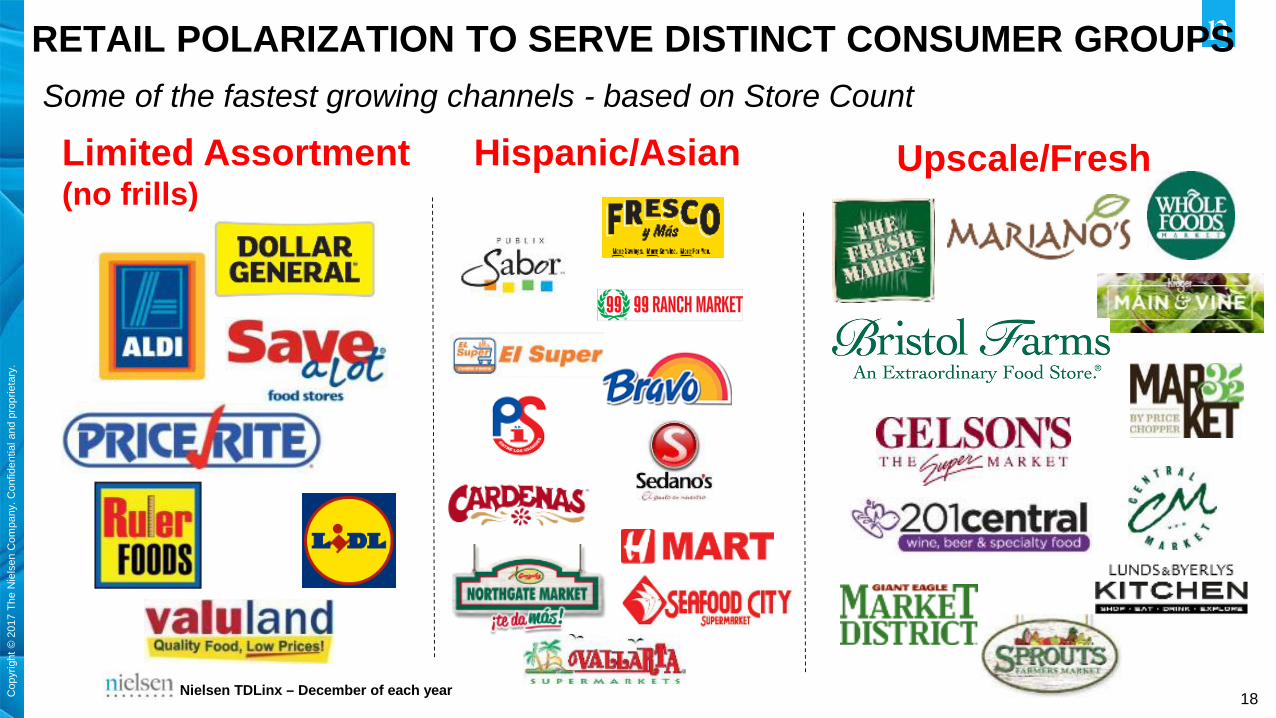
RETAIL POLARIZATION TO SERVE DISTINCT CONSUMER GROUPSSome of the fastest growing channels - based on Store Count
Limited Assortment (no frills)
Nielsen TDLinx – December of each year
Upscale/FreshHispanic/Asian
19Cop
yrig
ht ©
201
7 Th
e N
iels
en C
ompa
ny. C
onfid
entia
l and
pro
prie
tary
.
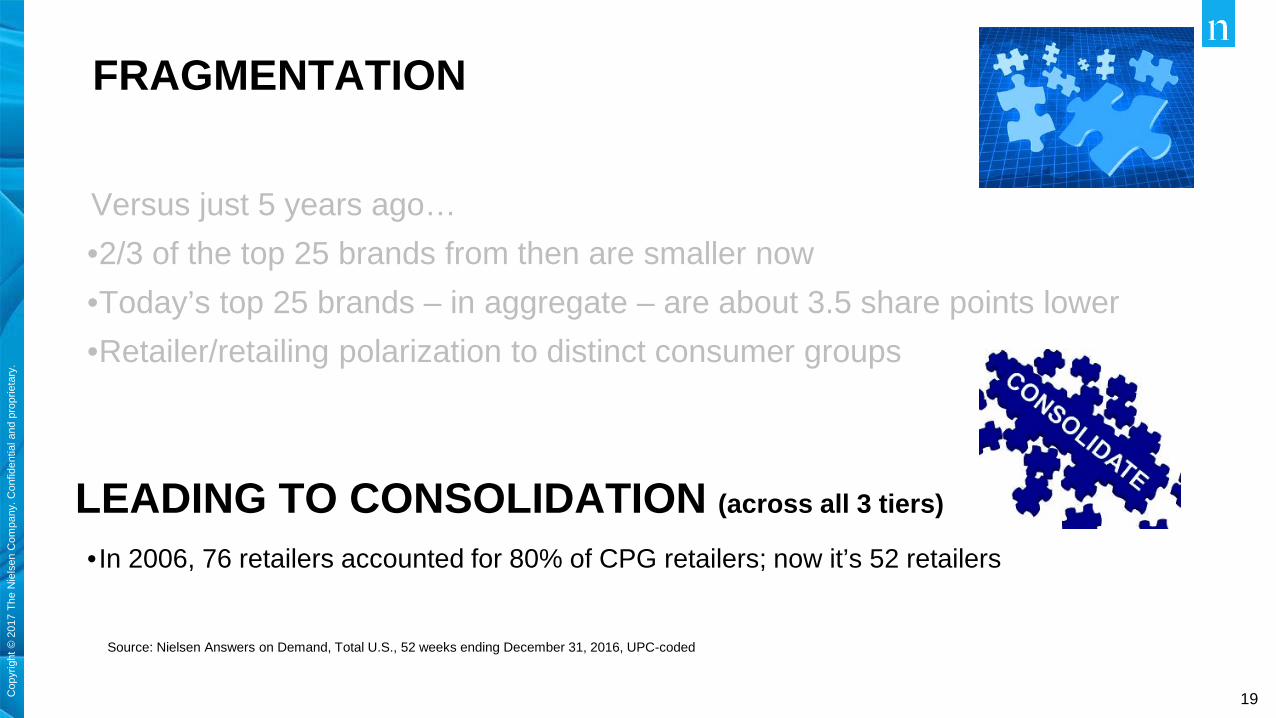
FRAGMENTATION
Versus just 5 years ago…•2/3 of the top 25 brands from then are smaller now•Today’s top 25 brands – in aggregate – are about 3.5 share points lower•Retailer/retailing polarization to distinct consumer groups
LEADING TO CONSOLIDATION (across all 3 tiers)
Source: Nielsen Answers on Demand, Total U.S., 52 weeks ending December 31, 2016, UPC-coded
• In 2006, 76 retailers accounted for 80% of CPG retailers; now it’s 52 retailers
20Cop
yrig
ht ©
201
7 Th
e N
iels
en C
ompa
ny. C
onfid
entia
l and
pro
prie
tary
.
SOME KEY CONSUMER GROUPS…•Millennials now largest generation; but VERY, VERY diverse within…
–Broad age, and lifestage range; 21-39–Disparate incomes: from… 28%<$25K, and ….27%>$75K
–44% Multi-cultural (& growing) – Hispanic, African American, Asian
•Senior/Older group – only age group with significant population growth (>1%)
•Females - Gender balance a huge asset
21Cop
yrig
ht ©
201
7 Th
e N
iels
en C
ompa
ny. C
onfid
entia
l and
pro
prie
tary
.
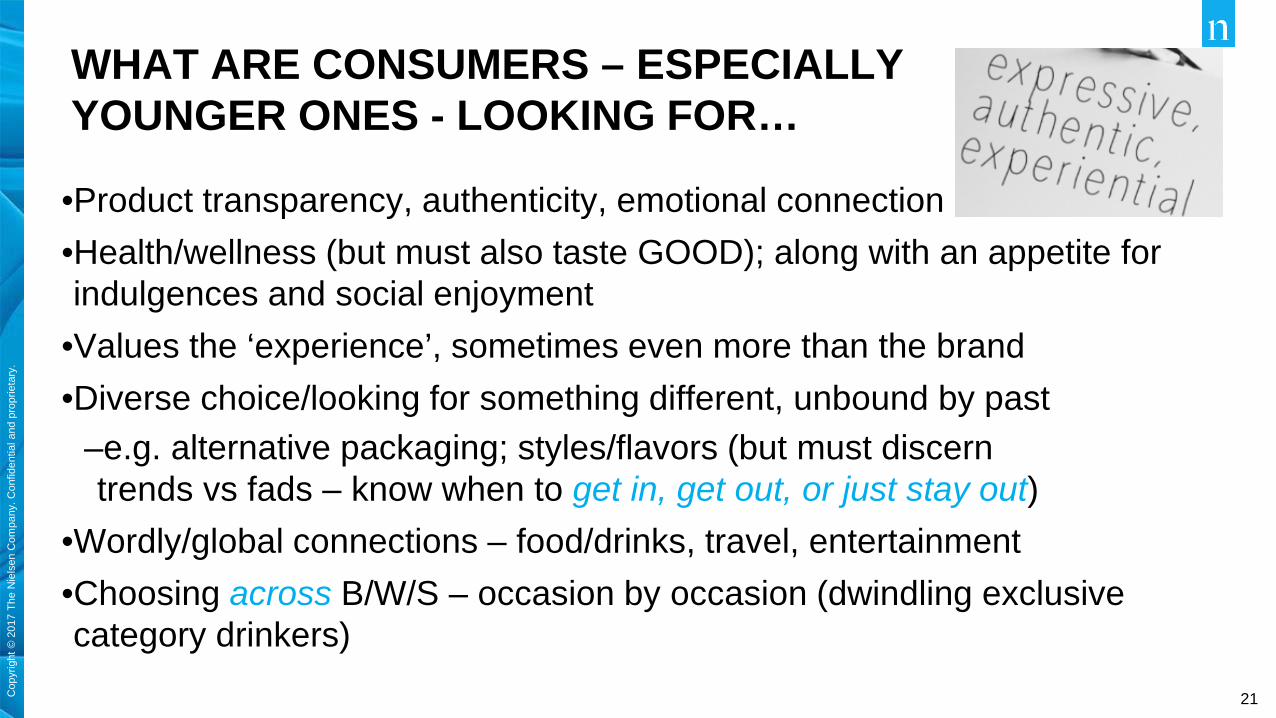
WHAT ARE CONSUMERS – ESPECIALLY YOUNGER ONES - LOOKING FOR…
•Product transparency, authenticity, emotional connection •Health/wellness (but must also taste GOOD); along with an appetite for indulgences and social enjoyment
•Values the ‘experience’, sometimes even more than the brand•Diverse choice/looking for something different, unbound by past
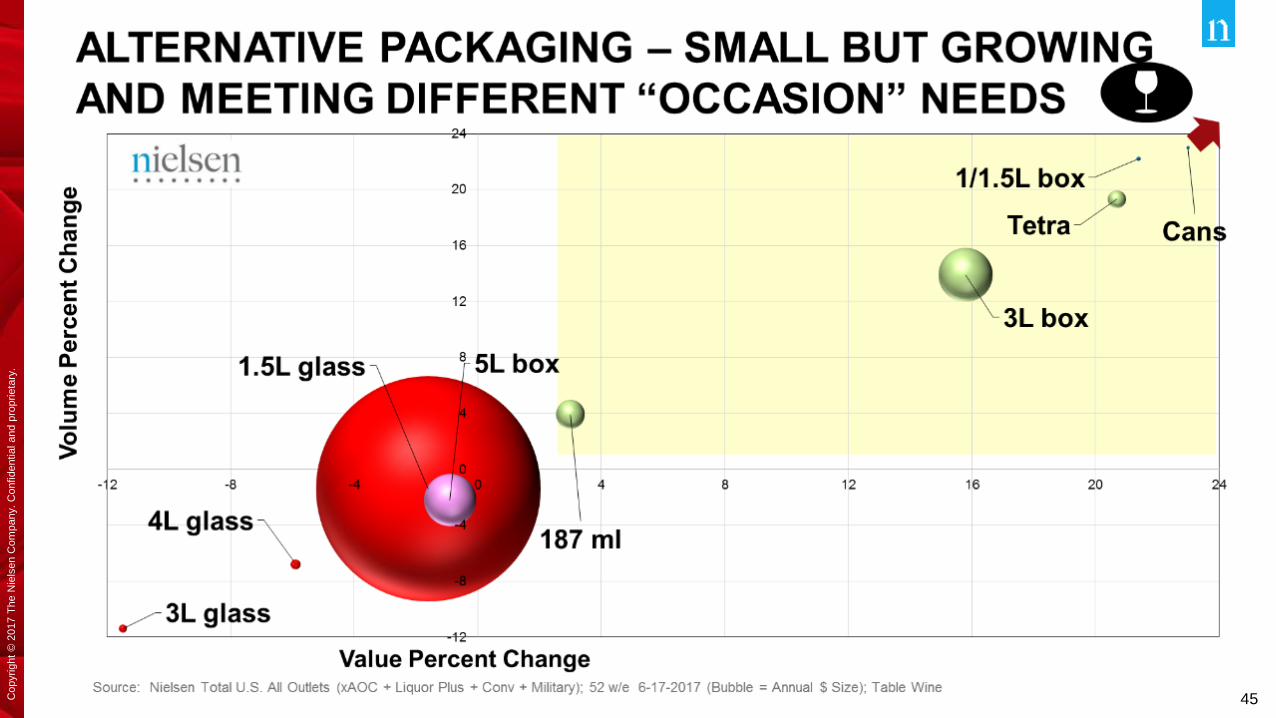
–e.g. alternative packaging; styles/flavors (but must discern trends vs fads – know when to get in, get out, or just stay out)
•Wordly/global connections – food/drinks, travel, entertainment•Choosing across B/W/S – occasion by occasion (dwindling exclusive category drinkers)

22Cop
yrig
ht ©
201
7 Th
e N
iels
en C
ompa
ny. C
onfid
entia
l and
pro
prie
tary
.
Copyright © 2017 The Nielsen Company. Confidential and proprietary.
BEER
23Cop
yrig
ht ©
201
7 Th
e N
iels
en C
ompa
ny. C
onfid
entia
l and
pro
prie
tary
.C
opyr
ight
© 2
017
The
Nie
lsen
Com
pany
. Con
fiden
tial a
nd p
ropr
ieta
ry.
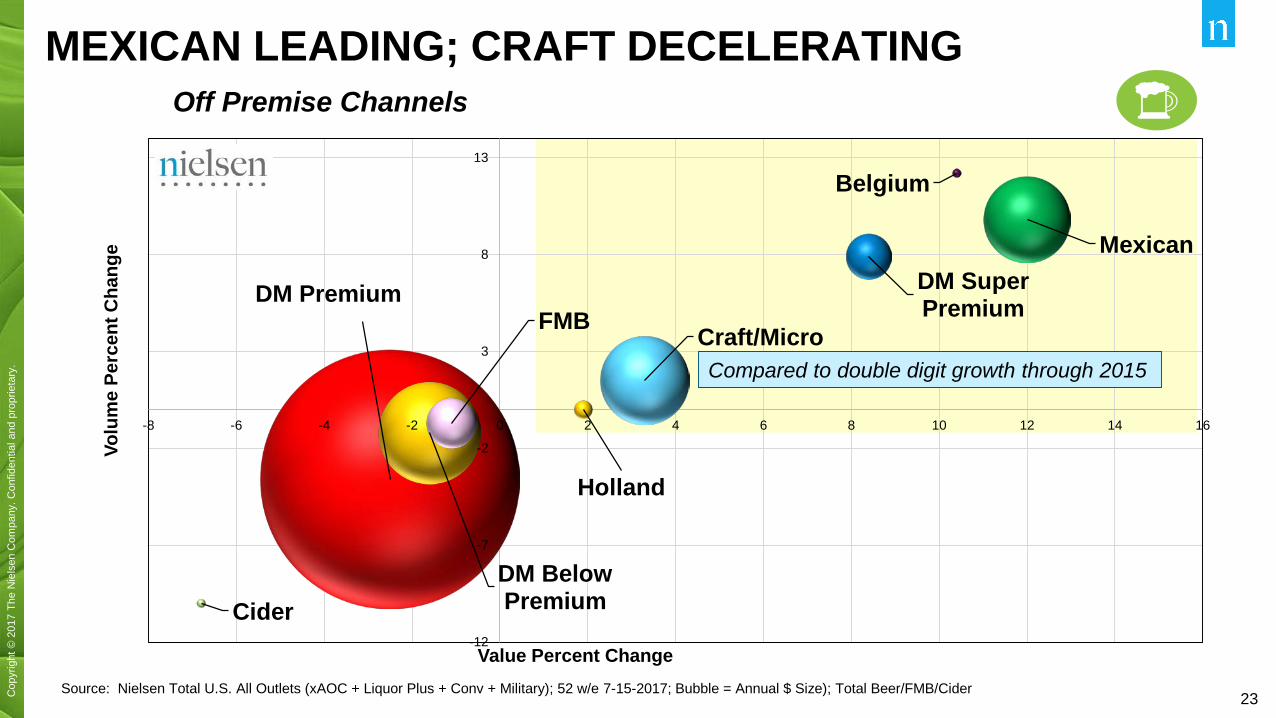
DM Premium
DM Below Premium
DM Super Premium
Mexican
Craft/MicroFMB
Holland
Belgium
Cider-12
-7
-2
3
8
13
-8 -6 -4 -2 0 2 4 6 8 10 12 14 16
Volu
me
Perc
ent C
hang
e
Value Percent Change
MEXICAN LEADING; CRAFT DECELERATINGOff Premise Channels
Source: Nielsen Total U.S. All Outlets (xAOC + Liquor Plus + Conv + Military); 52 w/e 7-15-2017; Bubble = Annual $ Size); Total Beer/FMB/Cider
Compared to double digit growth through 2015
24Cop
yrig
ht ©
201
7 Th
e N
iels
en C
ompa
ny. C
onfid
entia
l and
pro
prie
tary
.C
opyr
ight
© 2
017
The
Nie
lsen
Com
pany
. Con
fiden
tial a
nd p
ropr
ieta
ry.
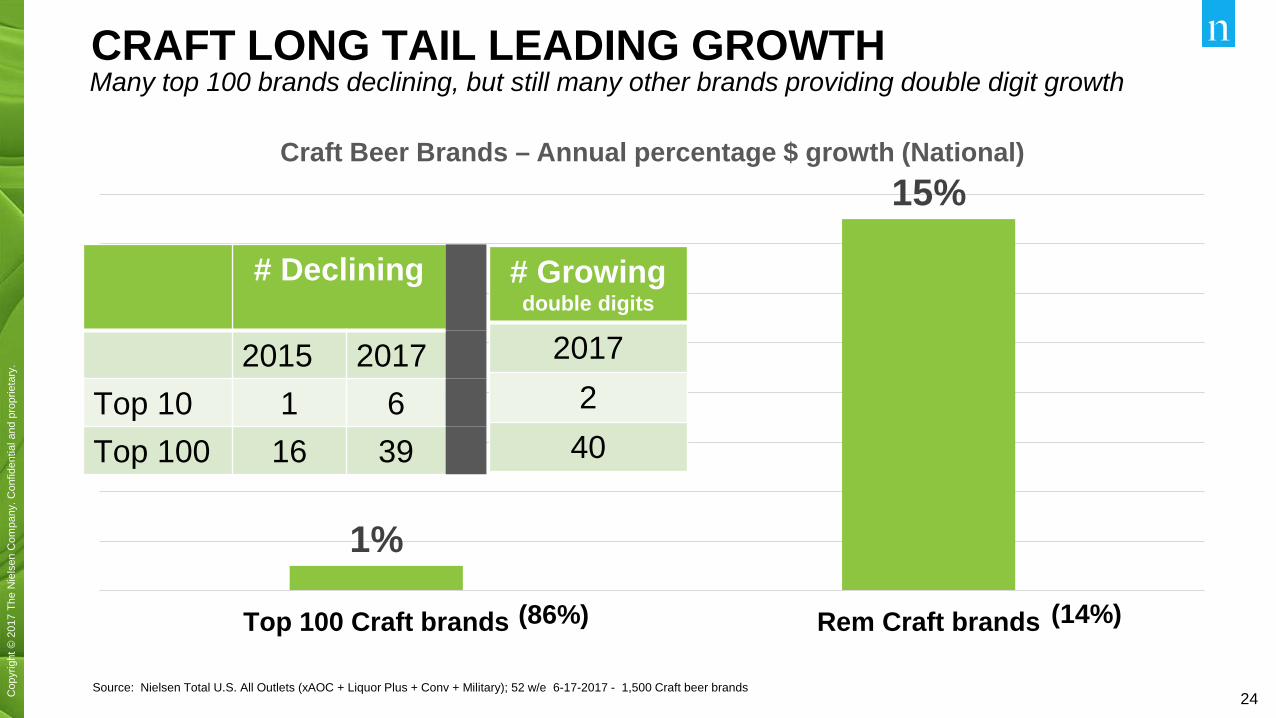
1%
15%
Top 100 Craft brands Rem Craft brands
Craft Beer Brands – Annual percentage $ growth (National)
CRAFT LONG TAIL LEADING GROWTH Many top 100 brands declining, but still many other brands providing double digit growth
Source: Nielsen Total U.S. All Outlets (xAOC + Liquor Plus + Conv + Military); 52 w/e 6-17-2017 - 1,500 Craft beer brands
(86%) (14%)
# Declining
2015 2017Top 10 1 6Top 100 16 39
# Growingdouble digits
2017240
25Cop
yrig
ht ©
201
7 Th
e N
iels
en C
ompa
ny. C
onfid
entia
l and
pro
prie
tary
.C
opyr
ight
© 2
017
The
Nie
lsen
Com
pany
. Con
fiden
tial a
nd p
ropr
ieta
ry.
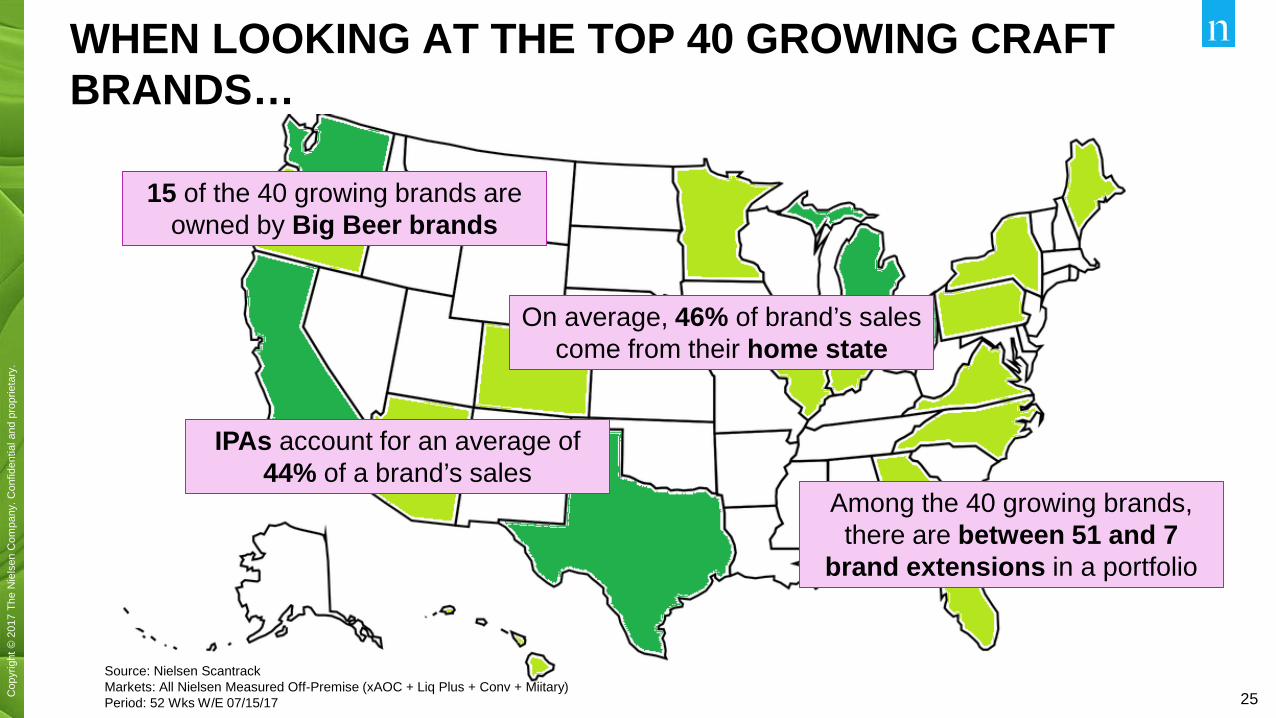
WHEN LOOKING AT THE TOP 40 GROWING CRAFT BRANDS…
Source: Nielsen ScantrackMarkets: All Nielsen Measured Off-Premise (xAOC + Liq Plus + Conv + Miitary)Period: 52 Wks W/E 07/15/17
15 of the 40 growing brands are owned by Big Beer brands
IPAs account for an average of 44% of a brand’s sales
On average, 46% of brand’s sales come from their home state
Among the 40 growing brands, there are between 51 and 7
brand extensions in a portfolio
26Cop
yrig
ht ©
201
7 Th
e N
iels
en C
ompa
ny. C
onfid
entia
l and
pro
prie
tary
.C
opyr
ight
© 2
017
The
Nie
lsen
Com
pany
. Con
fiden
tial a
nd p
ropr
ieta
ry.
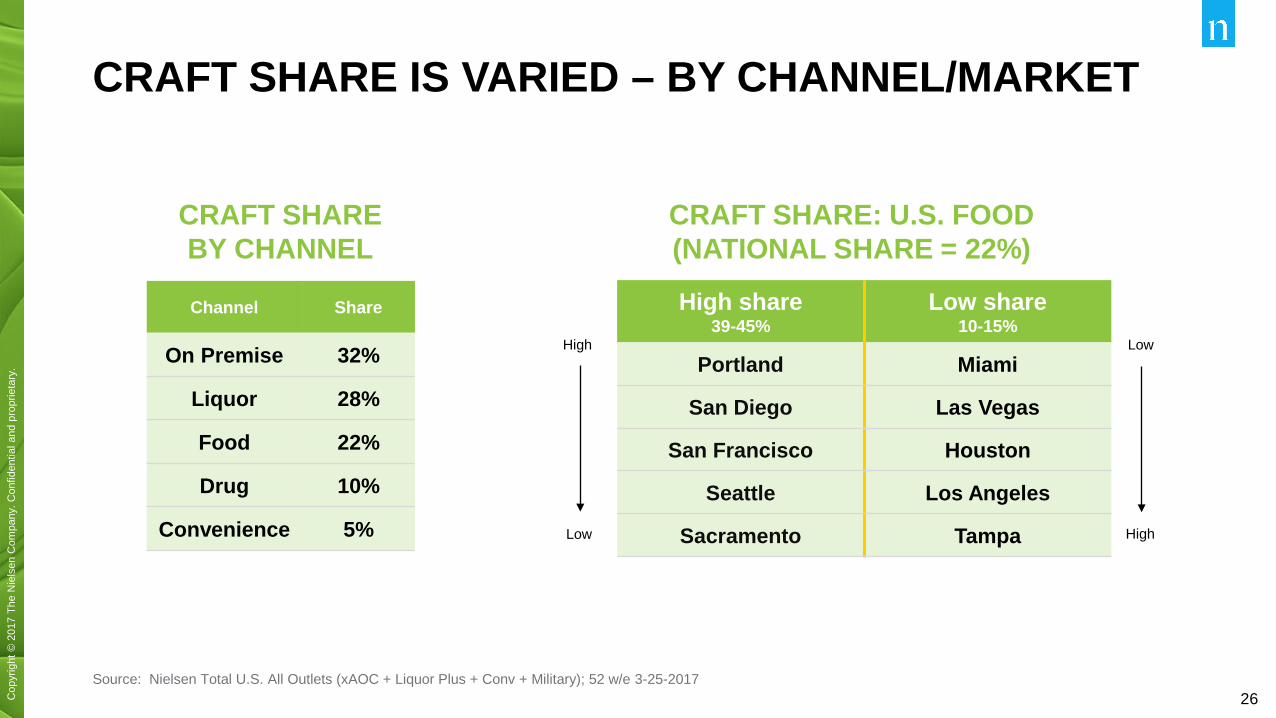
CRAFT SHARE IS VARIED – BY CHANNEL/MARKET
Source: Nielsen Total U.S. All Outlets (xAOC + Liquor Plus + Conv + Military); 52 w/e 3-25-2017
High
Low
CRAFT SHARE: U.S. FOOD(NATIONAL SHARE = 22%)
High share39-45%
Low share10-15%
Portland Miami
San Diego Las Vegas
San Francisco Houston
Seattle Los Angeles
Sacramento Tampa
Low
High
CRAFT SHARE BY CHANNEL
Channel Share
On Premise 32%
Liquor 28%
Food 22%
Drug 10%
Convenience 5%
27Cop
yrig
ht ©
201
7 Th
e N
iels
en C
ompa
ny. C
onfid
entia
l and
pro
prie
tary
.C
opyr
ight
© 2
017
The
Nie
lsen
Com
pany
. Con
fiden
tial a
nd p
ropr
ieta
ry.
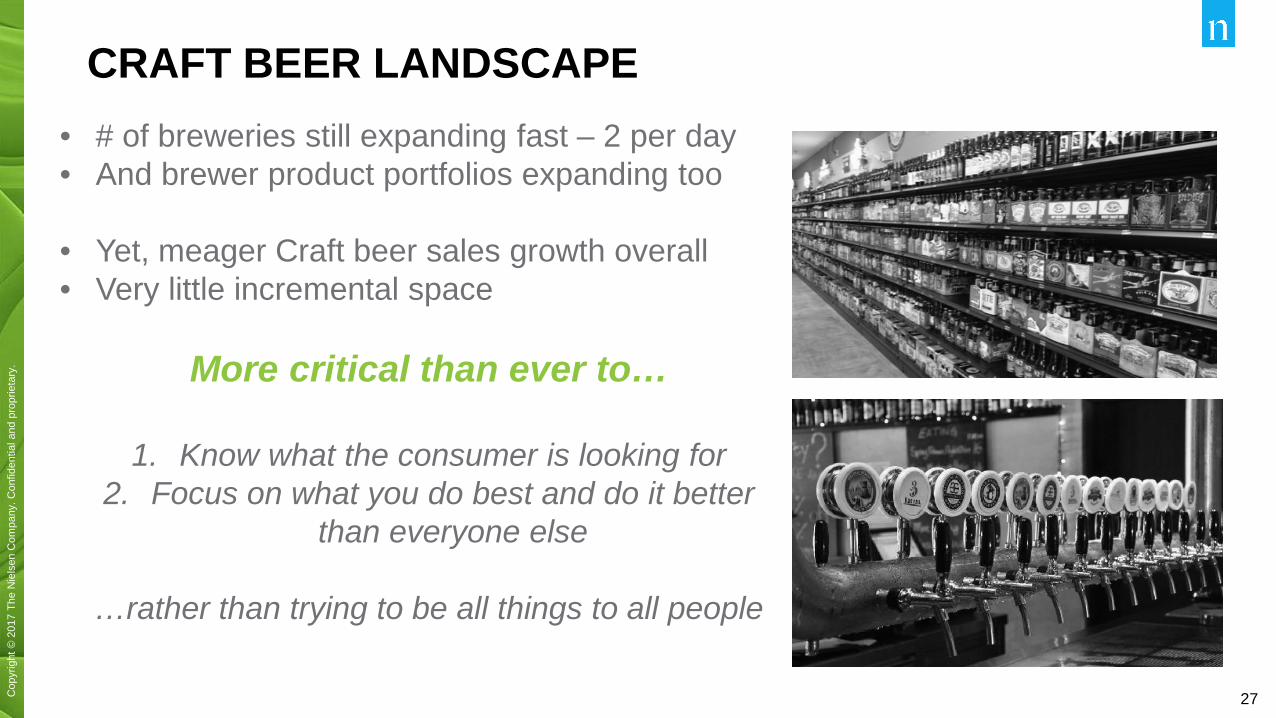
CRAFT BEER LANDSCAPE • # of breweries still expanding fast – 2 per day• And brewer product portfolios expanding too
• Yet, meager Craft beer sales growth overall• Very little incremental space
More critical than ever to…
1. Know what the consumer is looking for2. Focus on what you do best and do it better
than everyone else
…rather than trying to be all things to all people
28Cop
yrig
ht ©
201
7 Th
e N
iels
en C
ompa
ny. C
onfid
entia
l and
pro
prie
tary
.C
opyr
ight
© 2
017
The
Nie
lsen
Com
pany
. Con
fiden
tial a
nd p
ropr
ieta
ry.
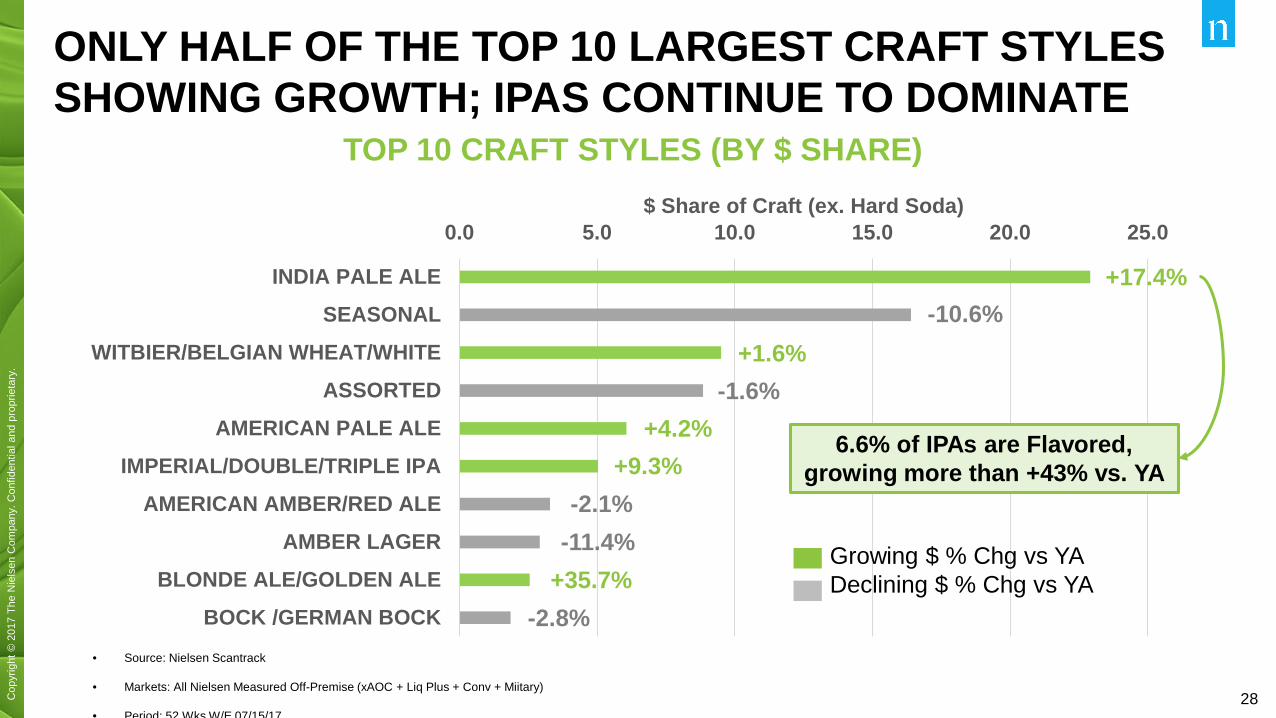
TOP 10 CRAFT STYLES (BY $ SHARE)
0.0 5.0 10.0 15.0 20.0 25.0
INDIA PALE ALESEASONAL
WITBIER/BELGIAN WHEAT/WHITEASSORTED
AMERICAN PALE ALEIMPERIAL/DOUBLE/TRIPLE IPA
AMERICAN AMBER/RED ALEAMBER LAGER
BLONDE ALE/GOLDEN ALEBOCK /GERMAN BOCK
$ Share of Craft (ex. Hard Soda)
ONLY HALF OF THE TOP 10 LARGEST CRAFT STYLES SHOWING GROWTH; IPAS CONTINUE TO DOMINATE
• Source: Nielsen Scantrack
• Markets: All Nielsen Measured Off-Premise (xAOC + Liq Plus + Conv + Miitary)
• Period: 52 Wks W/E 07/15/17
+17.4%
+1.6%
+4.2%+9.3%
+35.7%
-10.6%
-1.6%
-2.1%-11.4%
-2.8%
6.6% of IPAs are Flavored, growing more than +43% vs. YA
Growing $ % Chg vs YADeclining $ % Chg vs YA
29Cop
yrig
ht ©
201
7 Th
e N
iels
en C
ompa
ny. C
onfid
entia
l and
pro
prie
tary
.C
opyr
ight
© 2
017
The
Nie
lsen
Com
pany
. Con
fiden
tial a
nd p
ropr
ieta
ry.
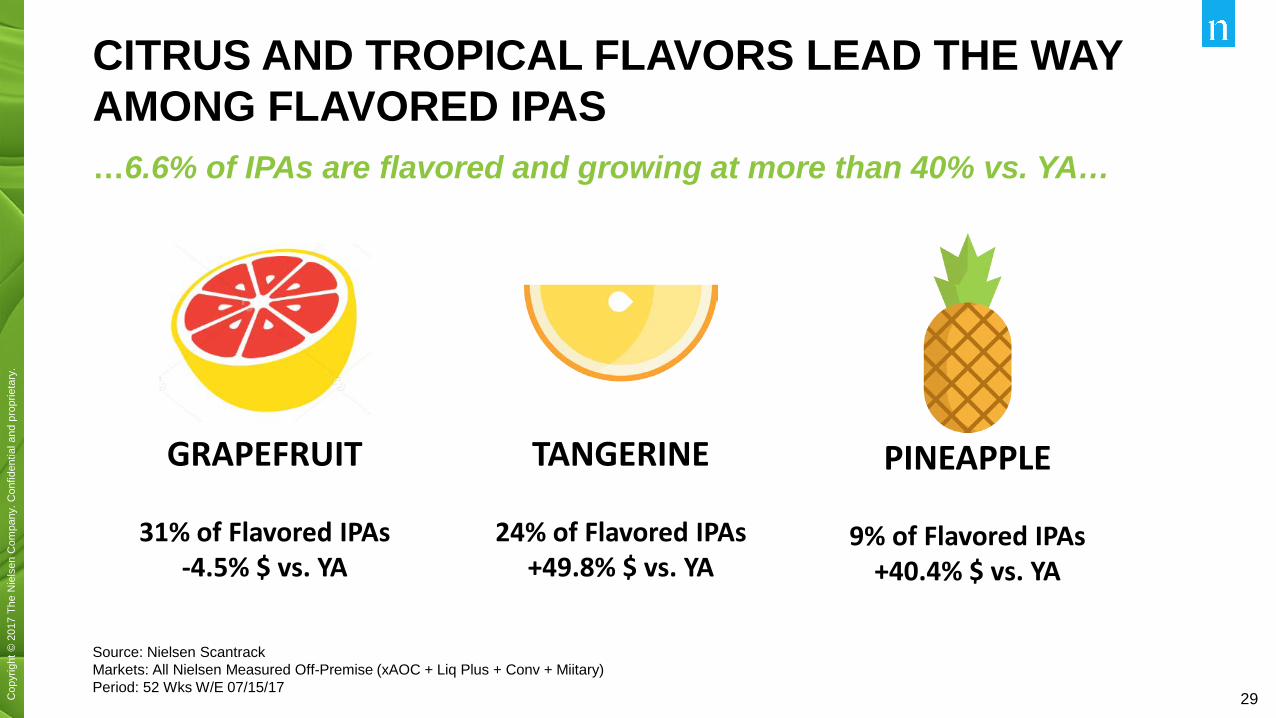
CITRUS AND TROPICAL FLAVORS LEAD THE WAY AMONG FLAVORED IPAS
Source: Nielsen ScantrackMarkets: All Nielsen Measured Off-Premise (xAOC + Liq Plus + Conv + Miitary)Period: 52 Wks W/E 07/15/17
…6.6% of IPAs are flavored and growing at more than 40% vs. YA…
GRAPEFRUIT
31% of Flavored IPAs-4.5% $ vs. YA
TANGERINE
24% of Flavored IPAs+49.8% $ vs. YA
PINEAPPLE
9% of Flavored IPAs+40.4% $ vs. YA
30Cop
yrig
ht ©
201
7 Th
e N
iels
en C
ompa
ny. C
onfid
entia
l and
pro
prie
tary
.C
opyr
ight
© 2
017
The
Nie
lsen
Com
pany
. Con
fiden
tial a
nd p
ropr
ieta
ry.
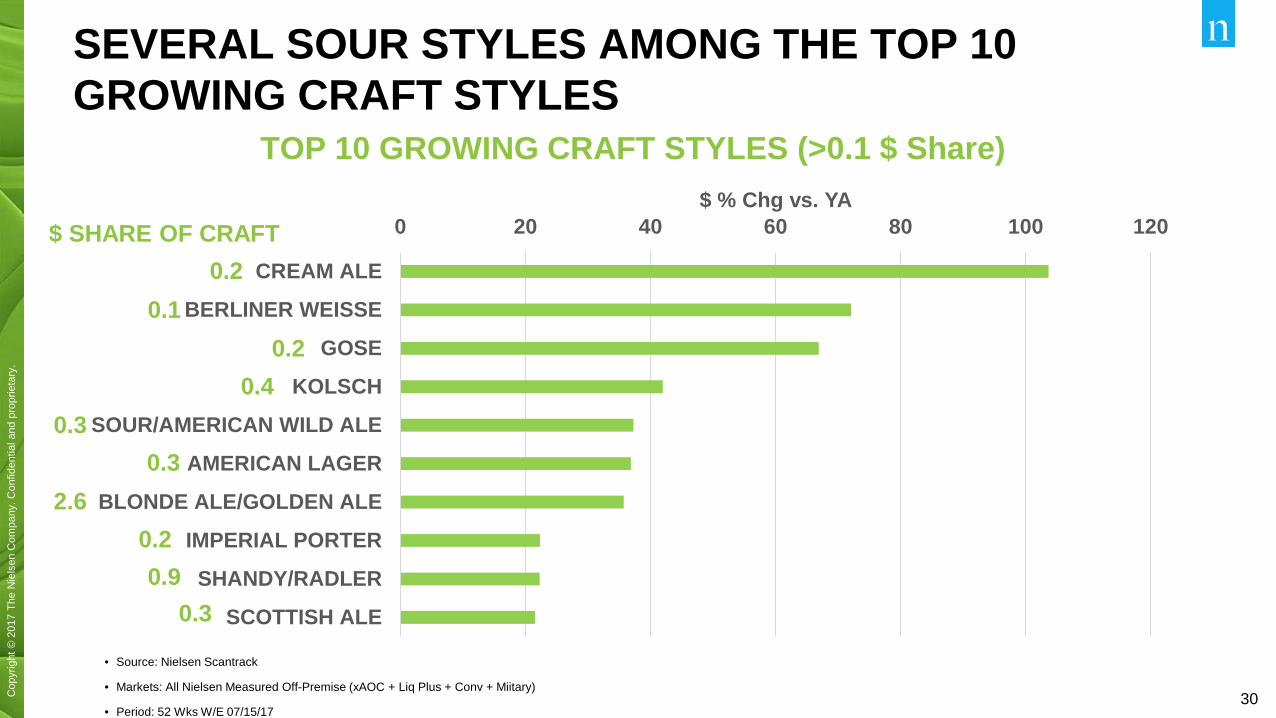
TOP 10 GROWING CRAFT STYLES (>0.1 $ Share)
0 20 40 60 80 100 120
CREAM ALE
BERLINER WEISSE
GOSE
KOLSCH
SOUR/AMERICAN WILD ALE
AMERICAN LAGER
BLONDE ALE/GOLDEN ALE
IMPERIAL PORTER
SHANDY/RADLER
SCOTTISH ALE
$ % Chg vs. YA
SEVERAL SOUR STYLES AMONG THE TOP 10 GROWING CRAFT STYLES
• Source: Nielsen Scantrack
• Markets: All Nielsen Measured Off-Premise (xAOC + Liq Plus + Conv + Miitary)
• Period: 52 Wks W/E 07/15/17
0.20.1
0.20.4
0.30.3
2.60.20.9
0.3
$ SHARE OF CRAFT
31Cop
yrig
ht ©
201
7 Th
e N
iels
en C
ompa
ny. C
onfid
entia
l and
pro
prie
tary
.C
opyr
ight
© 2
017
The
Nie
lsen
Com
pany
. Con
fiden
tial a
nd p
ropr
ieta
ry.
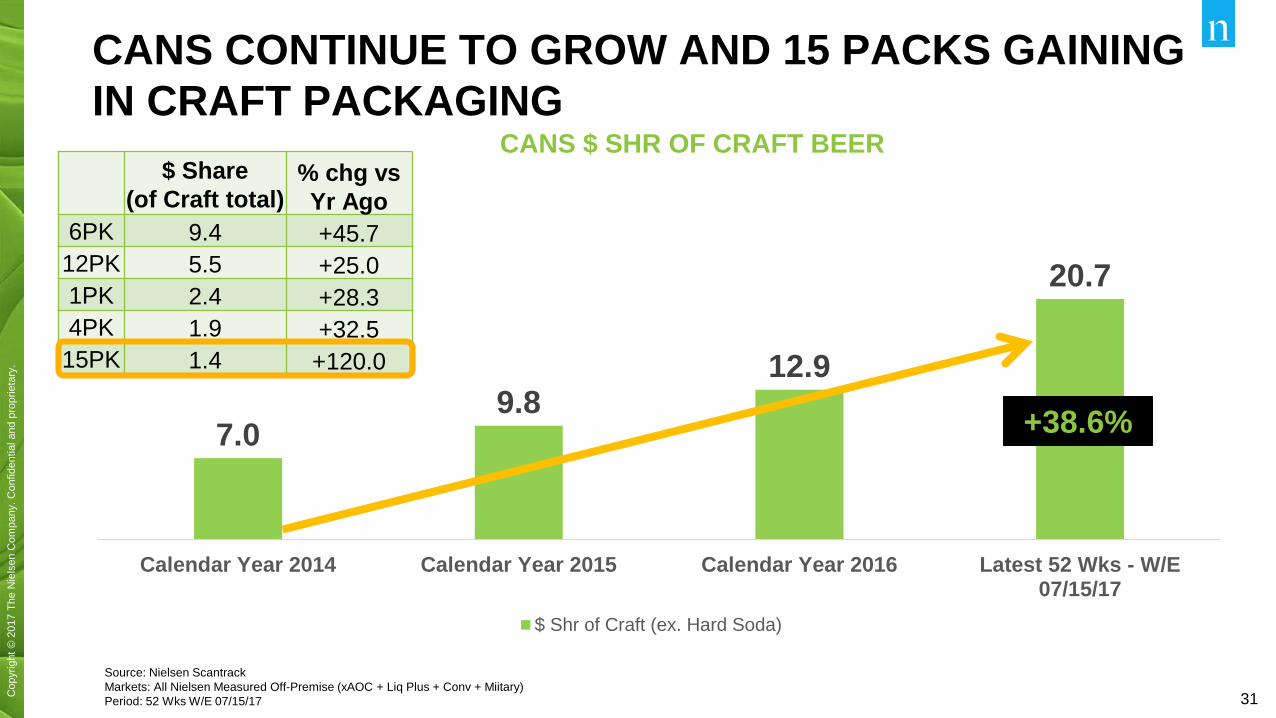
CANS $ SHR OF CRAFT BEER
7.09.8
12.9
20.7
Calendar Year 2014 Calendar Year 2015 Calendar Year 2016 Latest 52 Wks - W/E07/15/17
$ Shr of Craft (ex. Hard Soda)
CANS CONTINUE TO GROW AND 15 PACKS GAINING IN CRAFT PACKAGING
Source: Nielsen ScantrackMarkets: All Nielsen Measured Off-Premise (xAOC + Liq Plus + Conv + Miitary)Period: 52 Wks W/E 07/15/17
+38.6%
$ Share (of Craft total)
% chg vs Yr Ago
6PK 9.4 +45.712PK 5.5 +25.01PK 2.4 +28.34PK 1.9 +32.5
15PK 1.4 +120.0
32Cop
yrig
ht ©
201
7 Th
e N
iels
en C
ompa
ny. C
onfid
entia
l and
pro
prie
tary
.C
opyr
ight
© 2
017
The
Nie
lsen
Com
pany
. Con
fiden
tial a
nd p
ropr
ieta
ry.
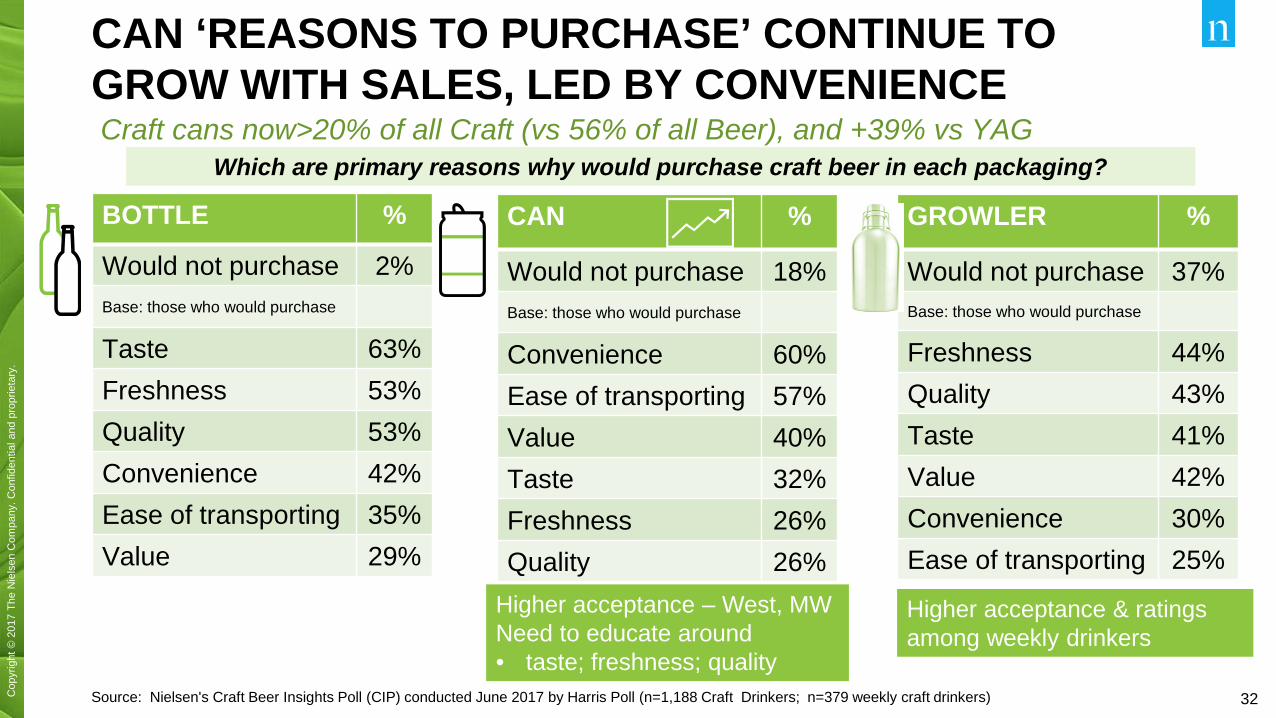
CAN ‘REASONS TO PURCHASE’ CONTINUE TO GROW WITH SALES, LED BY CONVENIENCE Craft cans now>20% of all Craft (vs 56% of all Beer), and +39% vs YAG
Source: Nielsen's Craft Beer Insights Poll (CIP) conducted June 2017 by Harris Poll (n=1,188 Craft Drinkers; n=379 weekly craft drinkers)
BOTTLE %
Would not purchase 2%Base: those who would purchase
Taste 63%Freshness 53%Quality 53%Convenience 42%Ease of transporting 35%Value 29%
CAN %
Would not purchase 18%Base: those who would purchase
Convenience 60%Ease of transporting 57%Value 40%Taste 32%Freshness 26%Quality 26%
GROWLER %
Would not purchase 37%Base: those who would purchase
Freshness 44%Quality 43%Taste 41%Value 42%Convenience 30%Ease of transporting 25%
Which are primary reasons why would purchase craft beer in each packaging?
Higher acceptance – West, MWNeed to educate around• taste; freshness; quality
Higher acceptance & ratings among weekly drinkers
33Cop
yrig
ht ©
201
7 Th
e N
iels
en C
ompa
ny. C
onfid
entia
l and
pro
prie
tary
.C
opyr
ight
© 2
017
The
Nie
lsen
Com
pany
. Con
fiden
tial a
nd p
ropr
ieta
ry.
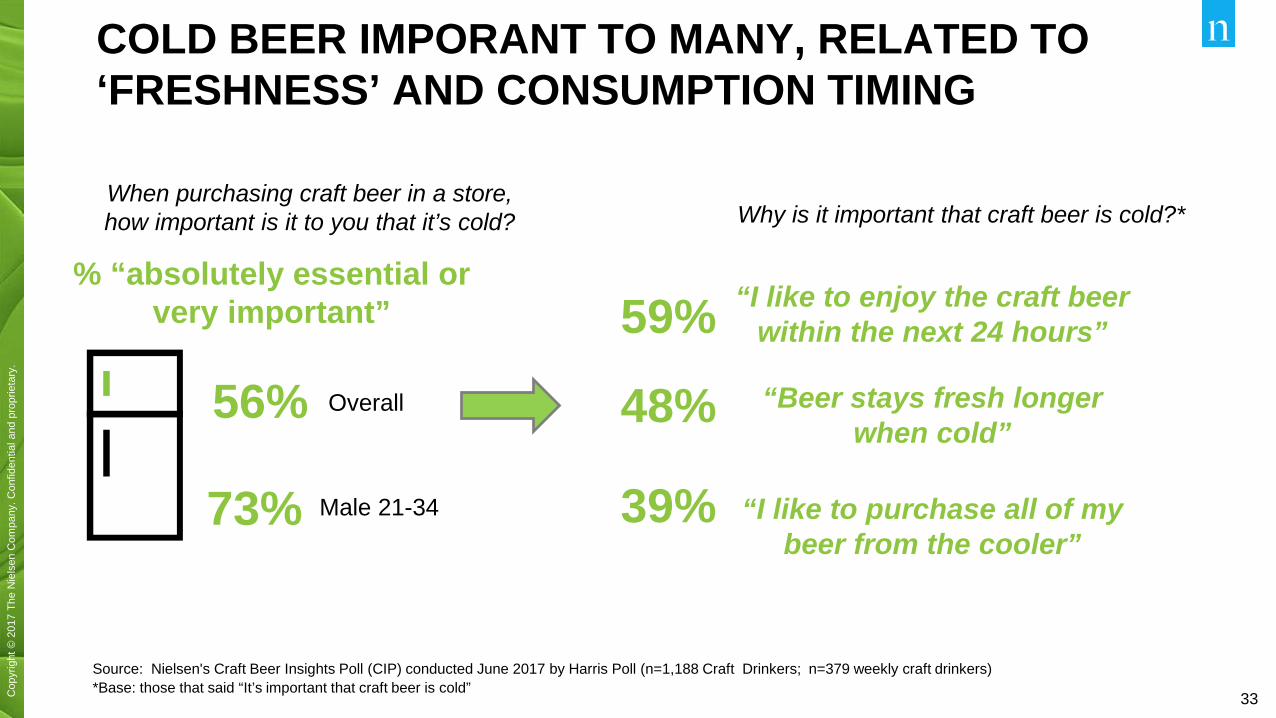
COLD BEER IMPORANT TO MANY, RELATED TO‘FRESHNESS’ AND CONSUMPTION TIMING
Source: Nielsen's Craft Beer Insights Poll (CIP) conducted June 2017 by Harris Poll (n=1,188 Craft Drinkers; n=379 weekly craft drinkers)*Base: those that said “It’s important that craft beer is cold”
56%
When purchasing craft beer in a store, how important is it to you that it’s cold?
73%
% “absolutely essential or very important”
Male 21-34
Overall
Why is it important that craft beer is cold?*
“I like to enjoy the craft beer within the next 24 hours”59%
48% “Beer stays fresh longer when cold”
39% “I like to purchase all of my beer from the cooler”
34Cop
yrig
ht ©
201
7 Th
e N
iels
en C
ompa
ny. C
onfid
entia
l and
pro
prie
tary
.C
opyr
ight
© 2
017
The
Nie
lsen
Com
pany
. Con
fiden
tial a
nd p
ropr
ieta
ry.
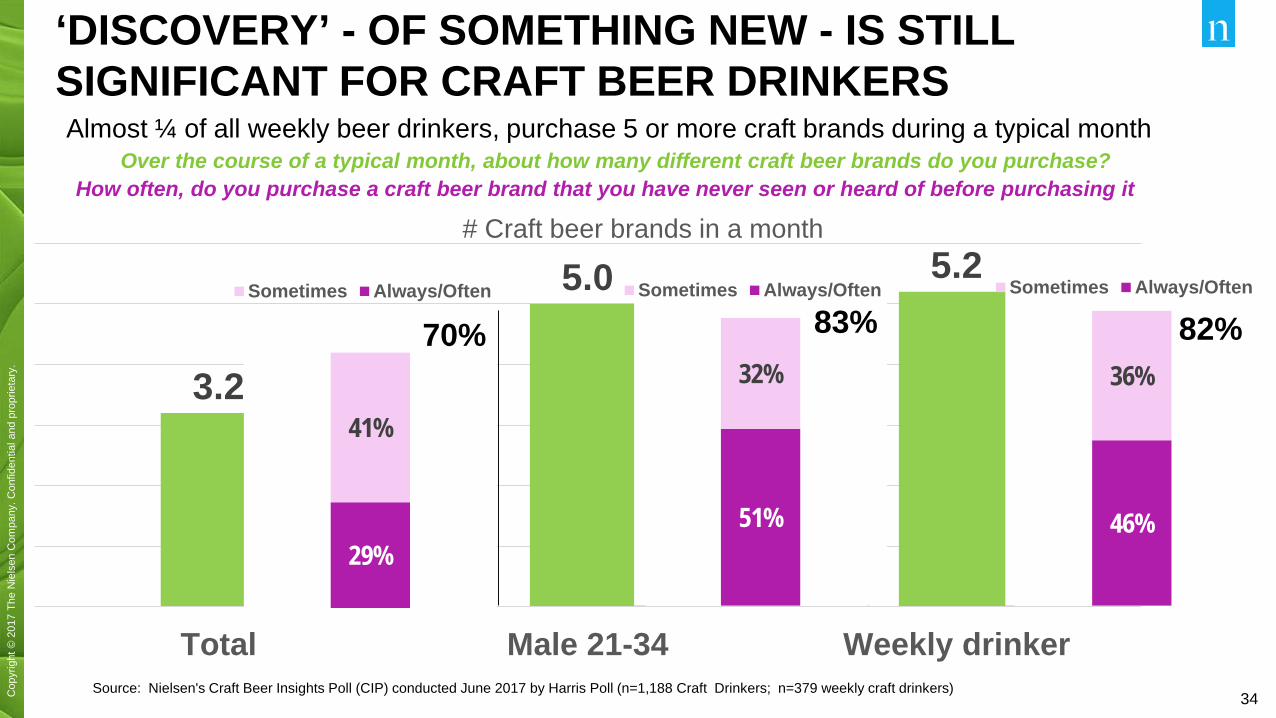
‘DISCOVERY’ - OF SOMETHING NEW - IS STILL SIGNIFICANT FOR CRAFT BEER DRINKERS
Source: Nielsen's Craft Beer Insights Poll (CIP) conducted June 2017 by Harris Poll (n=1,188 Craft Drinkers; n=379 weekly craft drinkers)
3.2
5.0 5.2
Total Male 21-34 Weekly drinker
# Craft beer brands in a month
Over the course of a typical month, about how many different craft beer brands do you purchase?Almost ¼ of all weekly beer drinkers, purchase 5 or more craft brands during a typical month
29%
41%
Sometimes Always/Often
51%
32%
Sometimes Always/Often
46%
36%
Sometimes Always/Often
How often, do you purchase a craft beer brand that you have never seen or heard of before purchasing it
70% 83% 82%
35Cop
yrig
ht ©
201
7 Th
e N
iels
en C
ompa
ny. C
onfid
entia
l and
pro
prie
tary
.C
opyr
ight
© 2
017
The
Nie
lsen
Com
pany
. Con
fiden
tial a
nd p
ropr
ieta
ry.
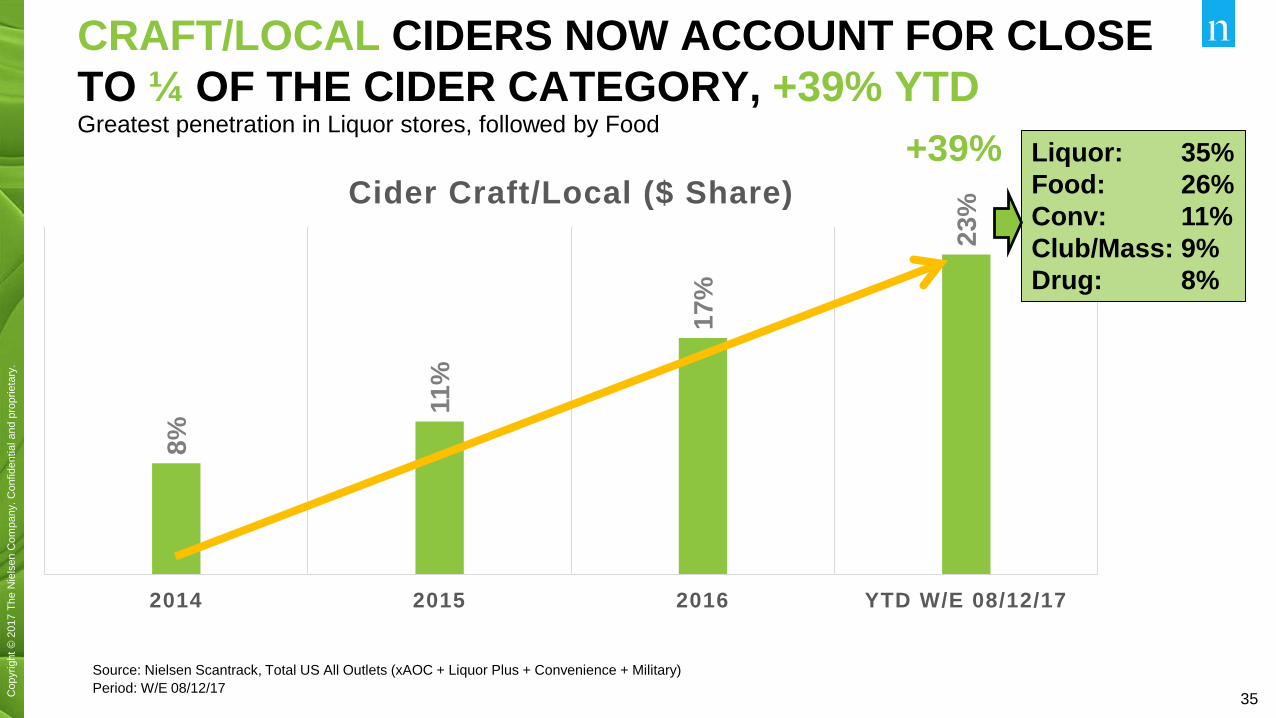
CRAFT/LOCAL CIDERS NOW ACCOUNT FOR CLOSE TO ¼ OF THE CIDER CATEGORY, +39% YTD
Source: Nielsen Scantrack, Total US All Outlets (xAOC + Liquor Plus + Convenience + Military)Period: W/E 08/12/17
8%
11%
17%
23%
2014 2015 2016 YTD W/E 08/12/17
Cider Craft/Local ($ Share)Liquor: 35%Food: 26%Conv: 11%Club/Mass: 9%Drug: 8%
Greatest penetration in Liquor stores, followed by Food+39%
36Cop
yrig
ht ©
201
7 Th
e N
iels
en C
ompa
ny. C
onfid
entia
l and
pro
prie
tary
.C
opyr
ight
© 2
017
The
Nie
lsen
Com
pany
. Con
fiden
tial a
nd p
ropr
ieta
ry.
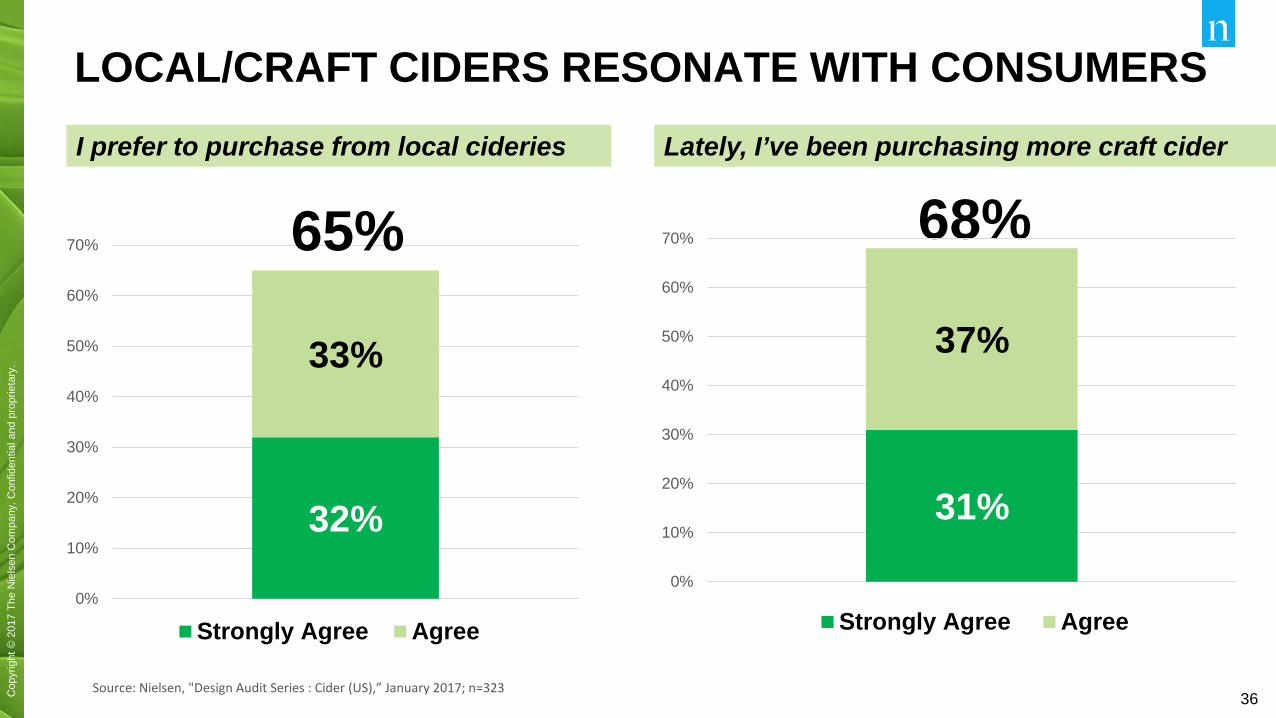
LOCAL/CRAFT CIDERS RESONATE WITH CONSUMERS
Source: Nielsen, "Design Audit Series : Cider (US),” January 2017; n=323
32%
33%
0%
10%
20%
30%
40%
50%
60%
70%
Strongly Agree Agree
I prefer to purchase from local cideries Lately, I’ve been purchasing more craft cider
65% 68%
31%
37%
0%
10%
20%
30%
40%
50%
60%
70%
Strongly Agree Agree

Copyright © 2017 The Nielsen Company. Confidential and proprietary.
WINE
38Cop
yrig
ht ©
201
7 Th
e N
iels
en C
ompa
ny. C
onfid
entia
l and
pro
prie
tary
.C
opyr
ight
© 2
017
The
Nie
lsen
Com
pany
. Con
fiden
tial a
nd p
ropr
ieta
ry.
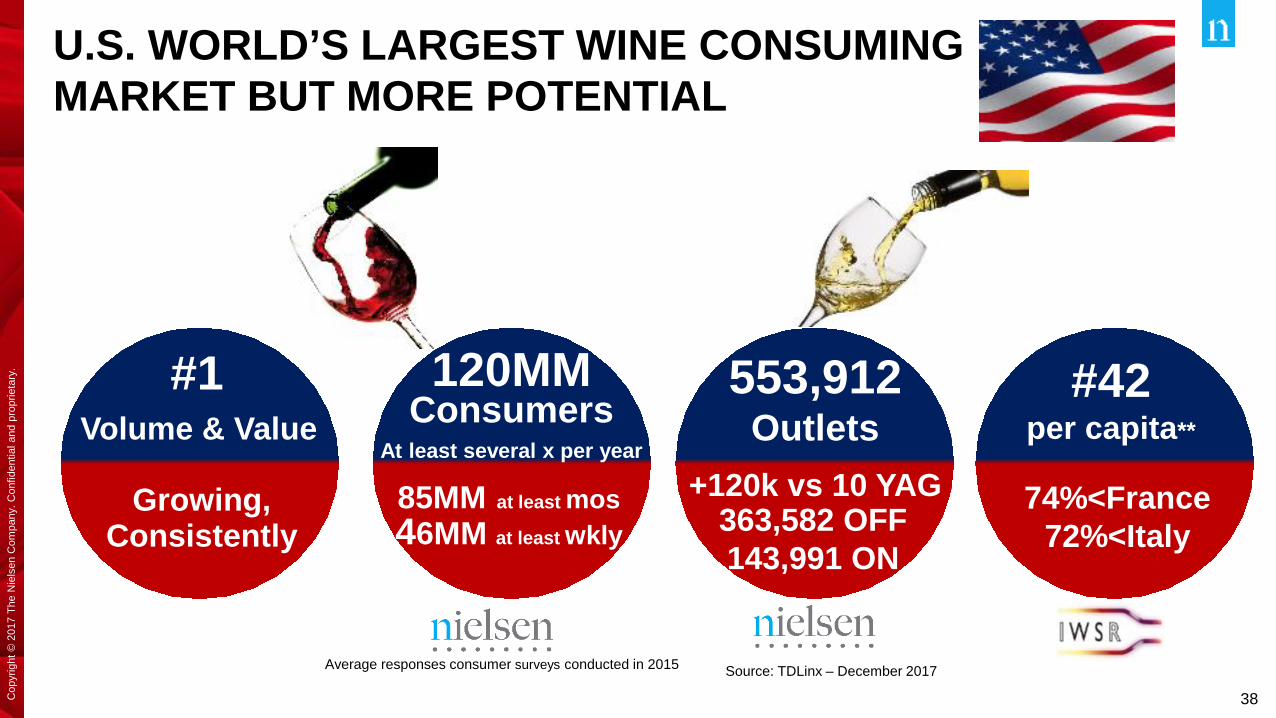
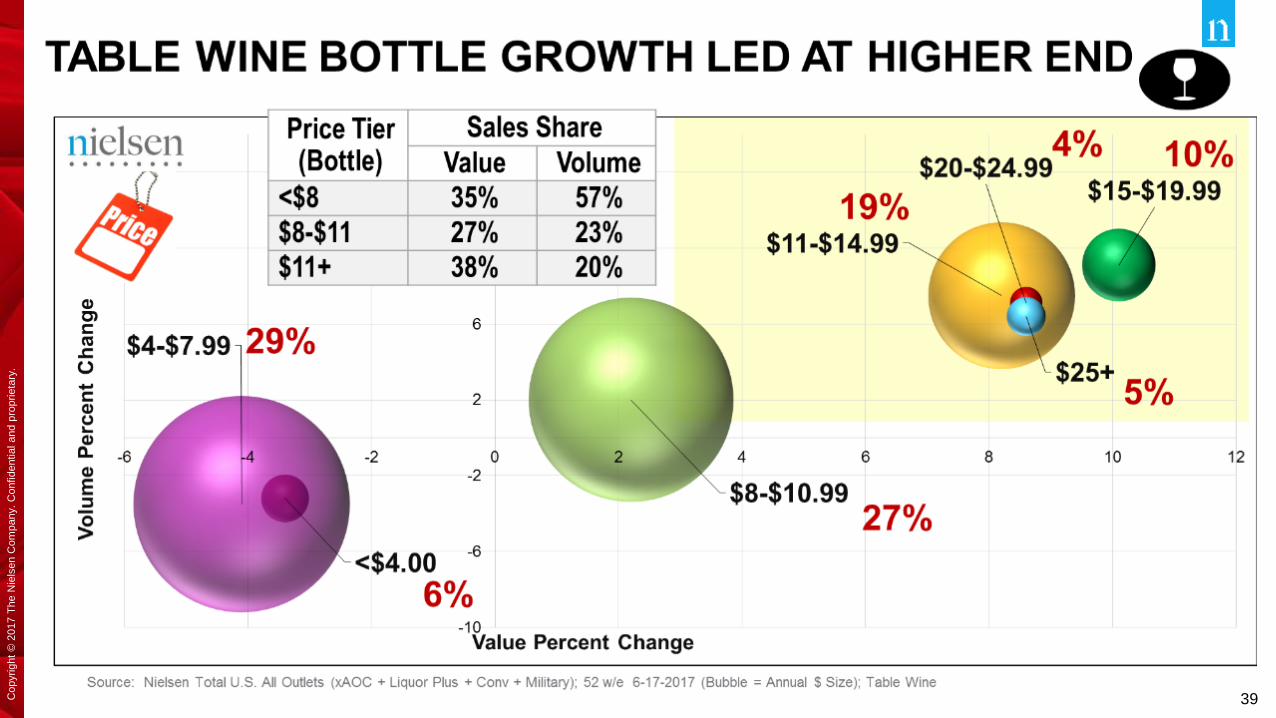
U.S. WORLD’S LARGEST WINE CONSUMING MARKET BUT MORE POTENTIAL
Average responses consumer surveys conducted in 2015
#1
Growing, Consistently
Volume & Value120MM
ConsumersAt least several x per year
85MM at least mos46MM at least wkly
Source: TDLinx – December 2017
553,912Outlets
+120k vs 10 YAG363,582 OFF143,991 ON
#42 per capita**
74%<France72%<Italy
39Cop
yrig
ht ©
201
7 Th
e N
iels
en C
ompa
ny. C
onfid
entia
l and
pro
prie
tary
.C
opyr
ight
© 2
017
The
Nie
lsen
Com
pany
. Con
fiden
tial a
nd p
ropr
ieta
ry.
40Cop
yrig
ht ©
201
7 Th
e N
iels
en C
ompa
ny. C
onfid
entia
l and
pro
prie
tary
.C
opyr
ight
© 2
017
The
Nie
lsen
Com
pany
. Con
fiden
tial a
nd p
ropr
ieta
ry.
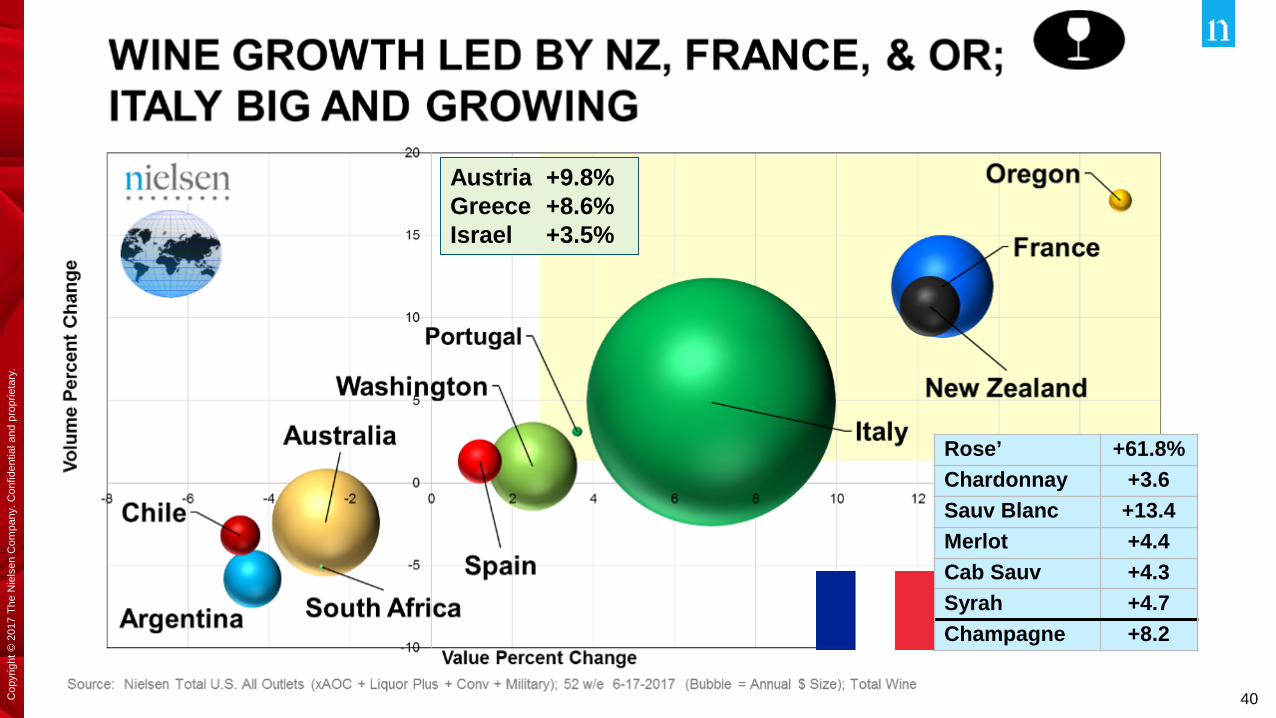
Austria +9.8%Greece +8.6%Israel +3.5%
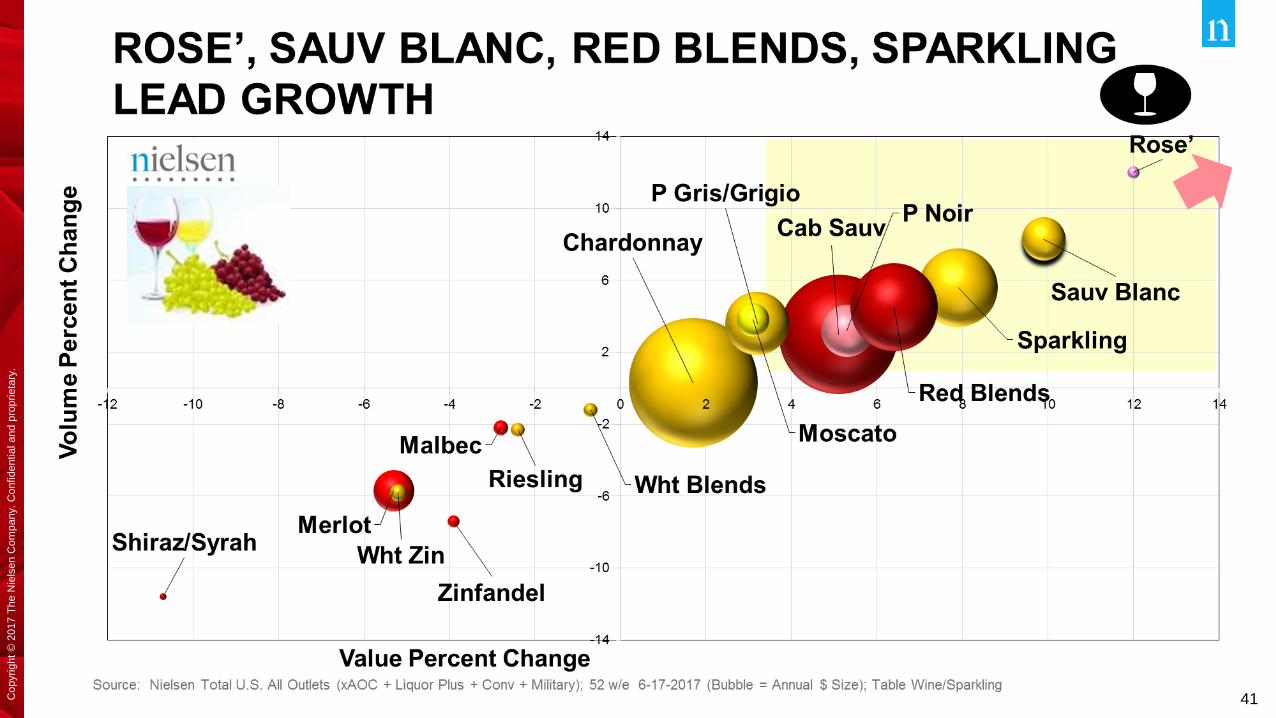
Rose’ +61.8%Chardonnay +3.6Sauv Blanc +13.4Merlot +4.4Cab Sauv +4.3Syrah +4.7Champagne +8.2
41Cop
yrig
ht ©
201
7 Th
e N
iels
en C
ompa
ny. C
onfid
entia
l and
pro
prie
tary
.C
opyr
ight
© 2
017
The
Nie
lsen
Com
pany
. Con
fiden
tial a
nd p
ropr
ieta
ry.
42Cop
yrig
ht ©
201
7 Th
e N
iels
en C
ompa
ny. C
onfid
entia
l and
pro
prie
tary
.C
opyr
ight
© 2
017
The
Nie
lsen
Com
pany
. Con
fiden
tial a
nd p
ropr
ieta
ry.
$-
$50,000,000
$100,000,000
$150,000,000
$200,000,000
$250,000,000
$300,000,000
$350,000,000
$400,000,0006/
15/2
013
7/15
/201
38/
15/2
013
9/15
/201
310
/15/
2013
11/1
5/20
1312
/15/
2013
1/15
/201
42/
15/2
014
3/15
/201
44/
15/2
014
5/15
/201
46/
15/2
014
7/15
/201
48/
15/2
014
9/15
/201
410
/15/
2014
11/1
5/20
1412
/15/
2014
1/15
/201
52/
15/2
015
3/15
/201
54/
15/2
015
5/15
/201
56/
15/2
015
7/15
/201
58/
15/2
015
9/15
/201
510
/15/
2015
11/1
5/20
1512
/15/
2015
1/15
/201
62/
15/2
016
3/15
/201
64/
15/2
016
5/15
/201
66/
15/2
016
7/15
/201
68/
15/2
016
9/15
/201
610
/15/
2016
11/1
5/20
1612
/15/
2016
1/15
/201
72/
15/2
017
3/15
/201
74/
15/2
017
5/15
/201
76/
15/2
017
7/15
/201
7
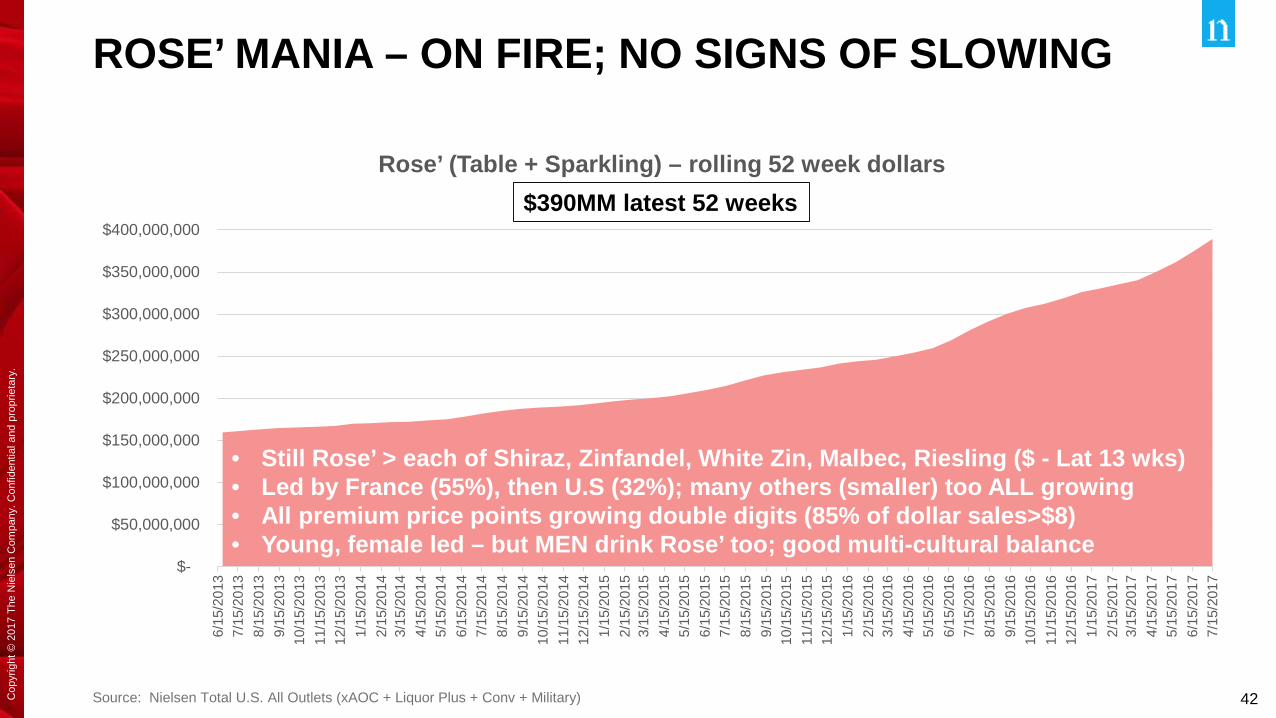
Rose’ (Table + Sparkling) – rolling 52 week dollars
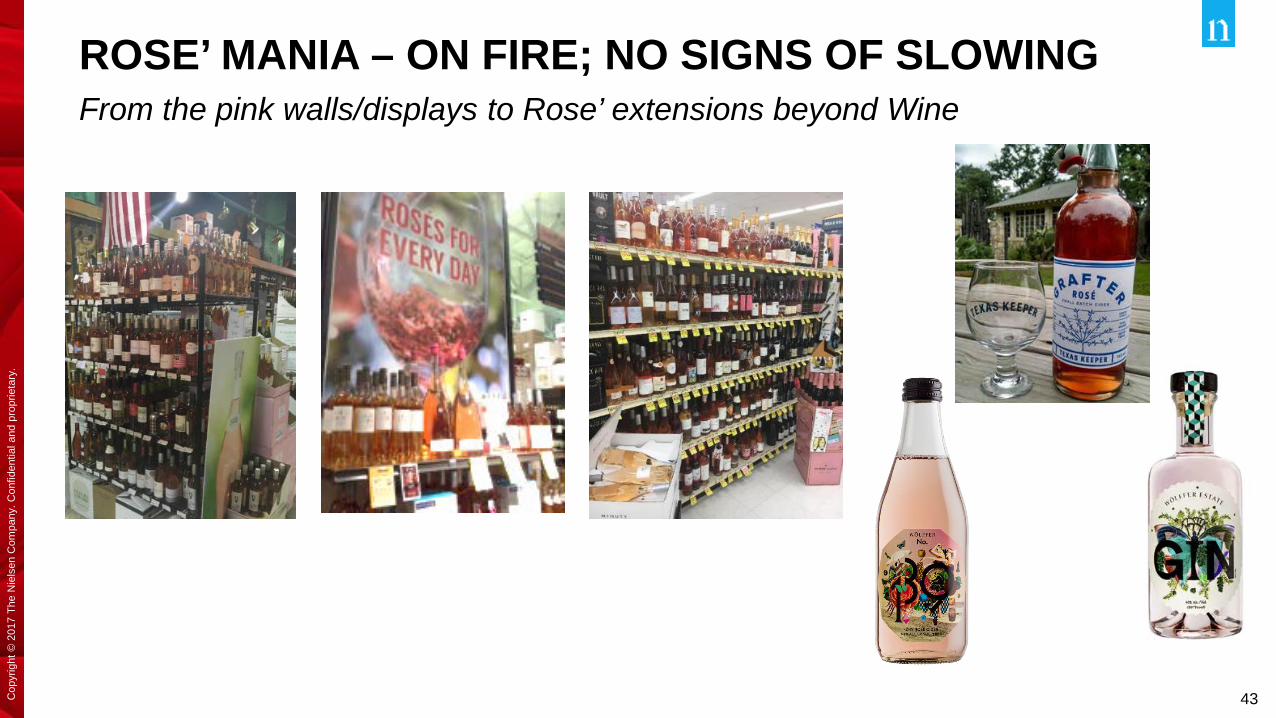
ROSE’ MANIA – ON FIRE; NO SIGNS OF SLOWING
Source: Nielsen Total U.S. All Outlets (xAOC + Liquor Plus + Conv + Military)
$390MM latest 52 weeks
• Still Rose’ > each of Shiraz, Zinfandel, White Zin, Malbec, Riesling ($ - Lat 13 wks)• Led by France (55%), then U.S (32%); many others (smaller) too ALL growing• All premium price points growing double digits (85% of dollar sales>$8)• Young, female led – but MEN drink Rose’ too; good multi-cultural balance
43Cop
yrig
ht ©
201
7 Th
e N
iels
en C
ompa
ny. C
onfid
entia
l and
pro
prie
tary
.C
opyr
ight
© 2
017
The
Nie
lsen
Com
pany
. Con
fiden
tial a
nd p
ropr
ieta
ry.
ROSE’ MANIA – ON FIRE; NO SIGNS OF SLOWINGFrom the pink walls/displays to Rose’ extensions beyond Wine
44Cop
yrig
ht ©
201
7 Th
e N
iels
en C
ompa
ny. C
onfid
entia
l and
pro
prie
tary
.C
opyr
ight
© 2
017
The
Nie
lsen
Com
pany
. Con
fiden
tial a
nd p
ropr
ieta
ry.
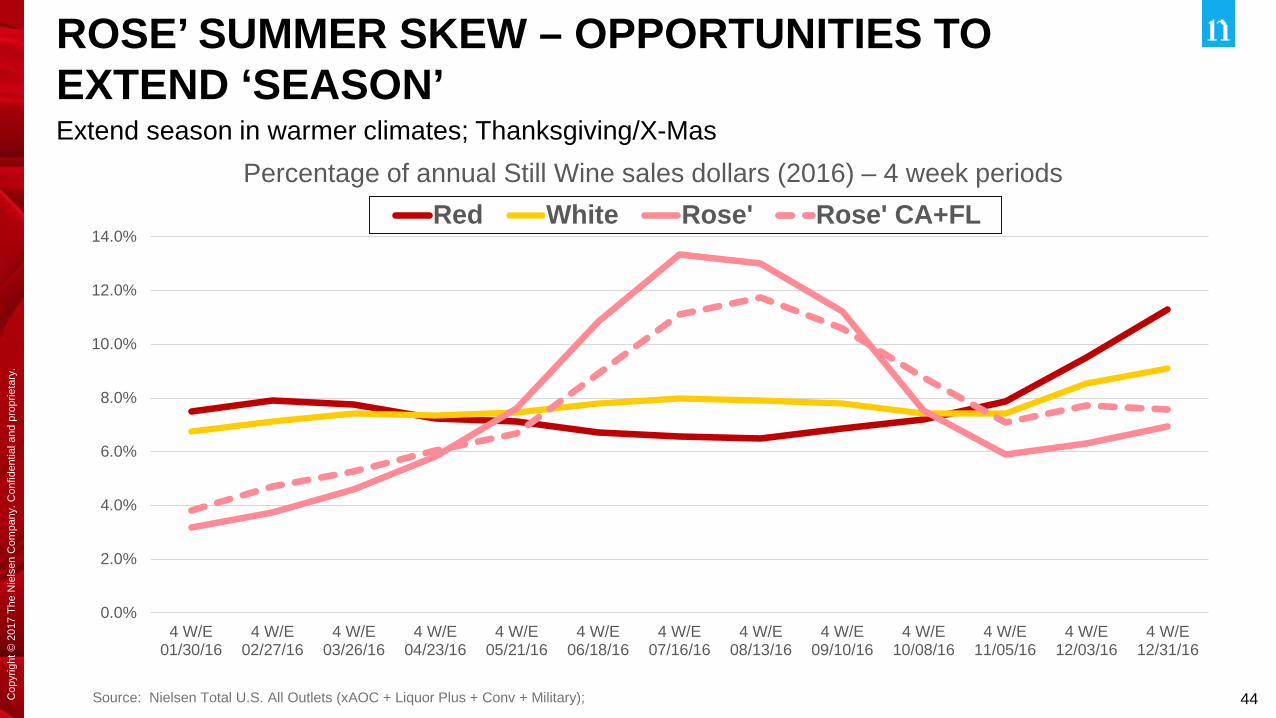
ROSE’ SUMMER SKEW – OPPORTUNITIES TO EXTEND ‘SEASON’
Source: Nielsen Total U.S. All Outlets (xAOC + Liquor Plus + Conv + Military);
0.0%
2.0%
4.0%
6.0%
8.0%
10.0%
12.0%
14.0%
4 W/E01/30/16
4 W/E02/27/16
4 W/E03/26/16
4 W/E04/23/16
4 W/E05/21/16
4 W/E06/18/16
4 W/E07/16/16
4 W/E08/13/16
4 W/E09/10/16
4 W/E10/08/16
4 W/E11/05/16
4 W/E12/03/16
4 W/E12/31/16
Percentage of annual Still Wine sales dollars (2016) – 4 week periodsRed White Rose' Rose' CA+FL
Extend season in warmer climates; Thanksgiving/X-Mas
45Cop
yrig
ht ©
201
7 Th
e N
iels
en C
ompa
ny. C
onfid
entia
l and
pro
prie
tary
.C
opyr
ight
© 2
017
The
Nie
lsen
Com
pany
. Con
fiden
tial a
nd p
ropr
ieta
ry.
Copyright © 2017 The Nielsen Company. Confidential and proprietary.
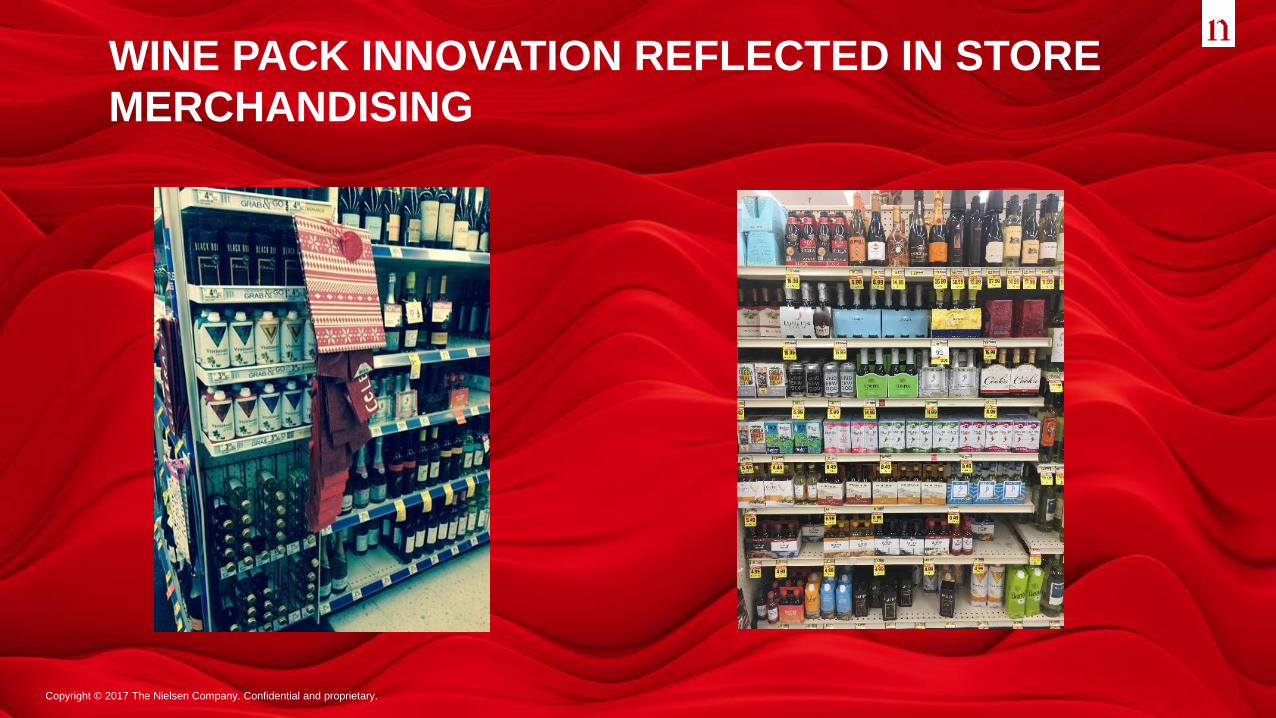
WINE PACK INNOVATION REFLECTED IN STORE MERCHANDISING
47Cop
yrig
ht ©
201
7 Th
e N
iels
en C
ompa
ny. C
onfid
entia
l and
pro
prie
tary
.C
opyr
ight
© 2
017
The
Nie
lsen
Com
pany
. Con
fiden
tial a
nd p
ropr
ieta
ry.
$0
$1,000,000
$2,000,000
$3,000,000
$4,000,000
$5,000,000
$6,000,0004
W/E
08/
18/1
24
W/E
09/
15/1
24
W/E
10/
13/1
24
W/E
11/
10/1
24
W/E
12/
08/1
24
W/E
01/
05/1
34
W/E
02/
02/1
34
W/E
03/
02/1
34
W/E
03/
30/1
34
W/E
04/
27/1
34
W/E
05/
25/1
34
W/E
06/
22/1
34
W/E
07/
20/1
34
W/E
08/
17/1
34
W/E
09/
14/1
34
W/E
10/
12/1
34
W/E
11/
09/1
34
W/E
12/
07/1
34
W/E
01/
04/1
44
W/E
02/
01/1
44
W/E
03/
01/1
44
W/E
03/
29/1
44
W/E
04/
26/1
44
W/E
05/
24/1
44
W/E
06/
21/1
44
W/E
07/
19/1
44
W/E
08/
16/1
44
W/E
09/
13/1
44
W/E
10/
11/1
44
W/E
11/
08/1
44
W/E
12/
06/1
44
W/E
01/
03/1
54
W/E
01/
31/1
54
W/E
02/
28/1
54
W/E
03/
28/1
54
W/E
04/
25/1
54
W/E
05/
23/1
54
W/E
06/
20/1
54
W/E
07/
18/1
54
W/E
08/
15/1
54
W/E
09/
12/1
54
W/E
10/
10/1
54
W/E
11/
07/1
54
W/E
12/
05/1
54
W/E
01/
02/1
64
W/E
01/
30/1
64
W/E
02/
27/1
64
W/E
03/
26/1
64
W/E
04/
23/1
64
W/E
05/
21/1
64
W/E
06/
18/1
64
W/E
07/
16/1
64
W/E
08/
13/1
64
W/E
09/
10/1
64
W/E
10/
08/1
64
W/E
11/
05/1
64
W/E
12/
03/1
64
W/E
12/
31/1
64
W/E
01/
28/1
74
W/E
02/
25/1
74
W/E
03/
25/1
74
W/E
04/
22/1
74
W/E
05/
20/1
74
W/E
06/
17/1
74
W/E
07/
15/1
7
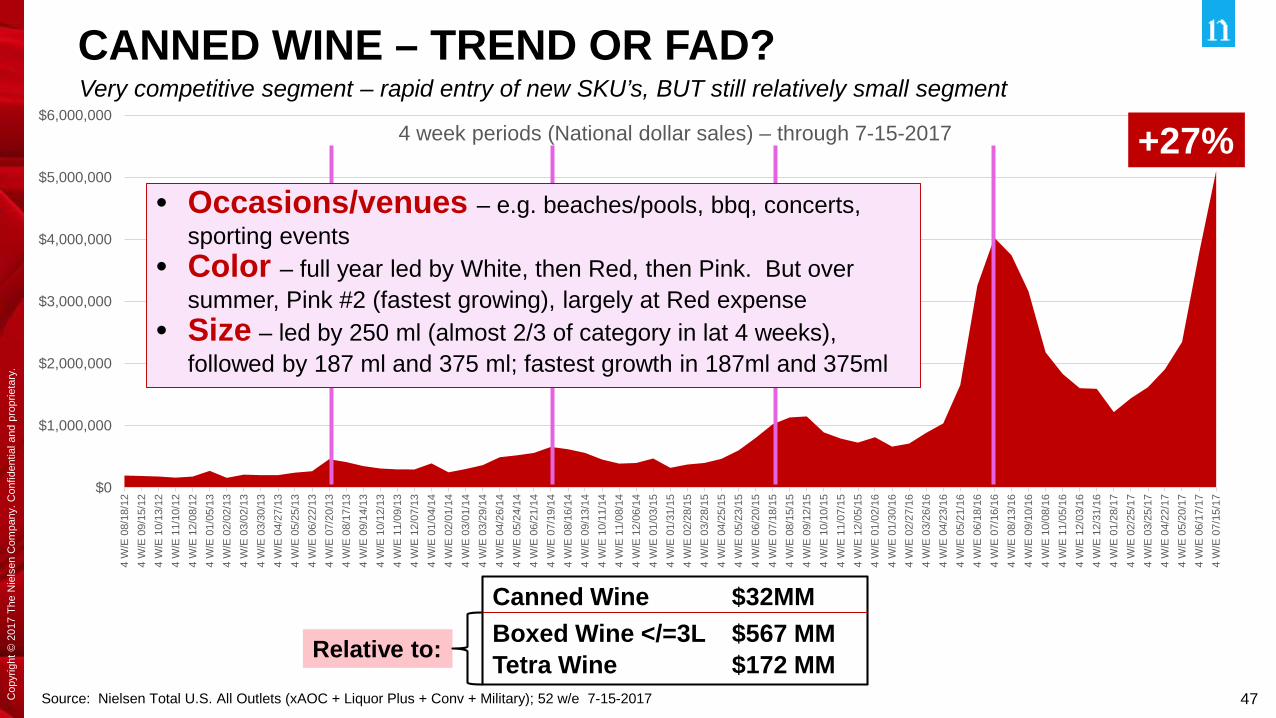
4 week periods (National dollar sales) – through 7-15-2017
CANNED WINE – TREND OR FAD?
Source: Nielsen Total U.S. All Outlets (xAOC + Liquor Plus + Conv + Military); 52 w/e 7-15-2017
Canned Wine $32MM Boxed Wine </=3L $567 MMTetra Wine $172 MMRelative to:
+27%• Occasions/venues – e.g. beaches/pools, bbq, concerts,
sporting events• Color – full year led by White, then Red, then Pink. But over
summer, Pink #2 (fastest growing), largely at Red expense• Size – led by 250 ml (almost 2/3 of category in lat 4 weeks),
followed by 187 ml and 375 ml; fastest growth in 187ml and 375ml
Very competitive segment – rapid entry of new SKU’s, BUT still relatively small segment
Copyright © 2017 The Nielsen Company. Confidential and proprietary.
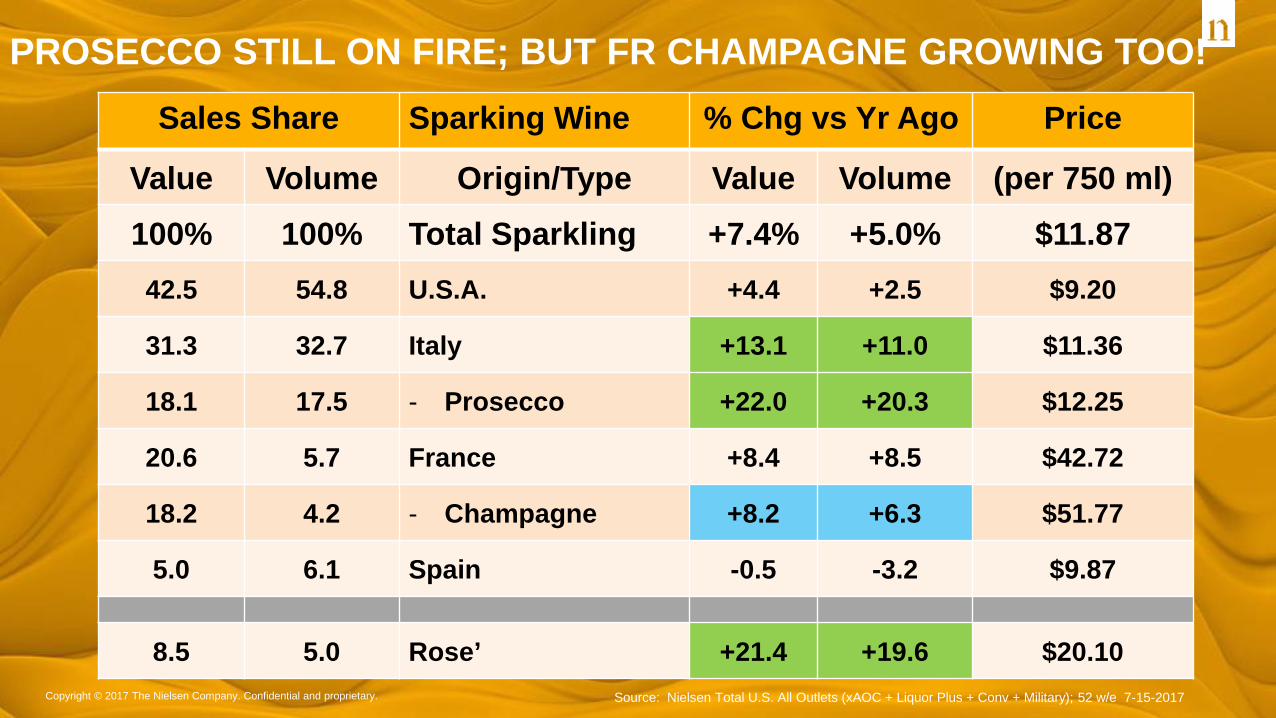
Sales Share Sparking Wine % Chg vs Yr Ago Price
Value Volume Origin/Type Value Volume (per 750 ml)100% 100% Total Sparkling +7.4% +5.0% $11.8742.5 54.8 U.S.A. +4.4 +2.5 $9.20
31.3 32.7 Italy +13.1 +11.0 $11.36
18.1 17.5 - Prosecco +22.0 +20.3 $12.25
20.6 5.7 France +8.4 +8.5 $42.72
18.2 4.2 - Champagne +8.2 +6.3 $51.77
5.0 6.1 Spain -0.5 -3.2 $9.87
8.5 5.0 Rose’ +21.4 +19.6 $20.10
PROSECCO STILL ON FIRE; BUT FR CHAMPAGNE GROWING TOO!
Source: Nielsen Total U.S. All Outlets (xAOC + Liquor Plus + Conv + Military); 52 w/e 7-15-2017
49Cop
yrig
ht ©
201
7 Th
e N
iels
en C
ompa
ny. C
onfid
entia
l and
pro
prie
tary
.C
opyr
ight
© 2
017
The
Nie
lsen
Com
pany
. Con
fiden
tial a
nd p
ropr
ieta
ry.
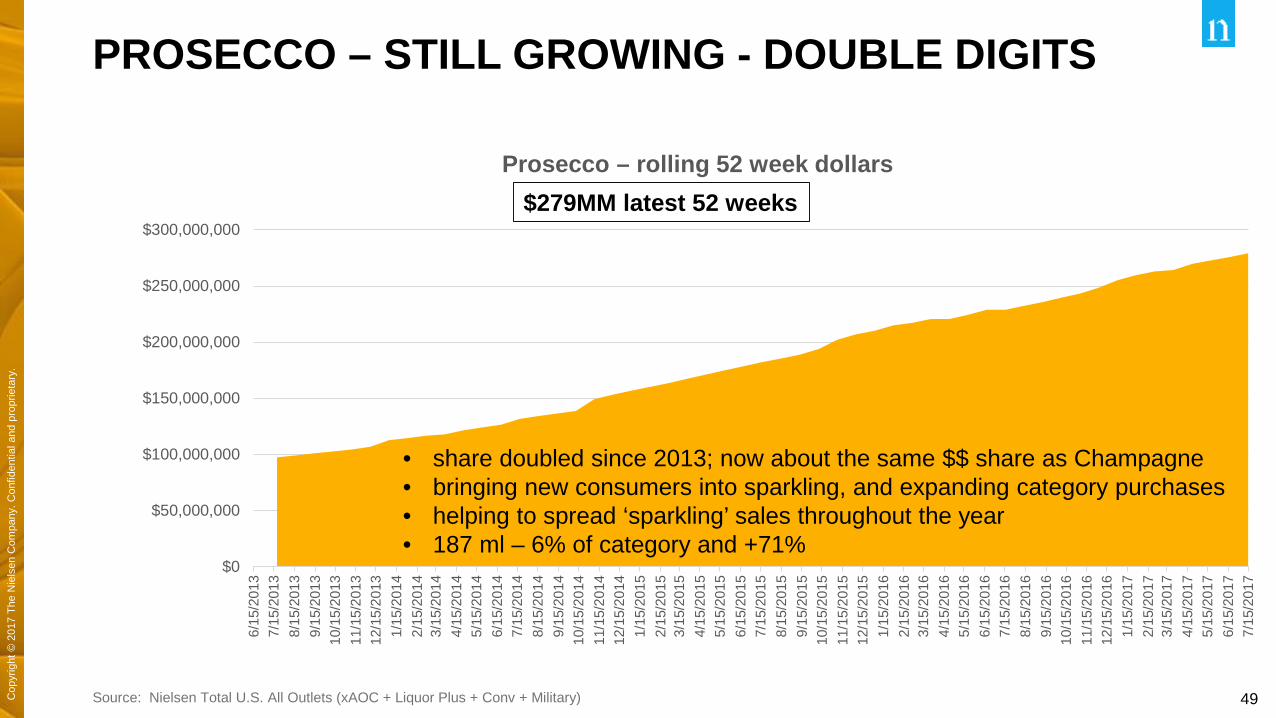
PROSECCO – STILL GROWING - DOUBLE DIGITS
Source: Nielsen Total U.S. All Outlets (xAOC + Liquor Plus + Conv + Military)
$0
$50,000,000
$100,000,000
$150,000,000
$200,000,000
$250,000,000
$300,000,0006/
15/2
013
7/15
/201
38/
15/2
013
9/15
/201
310
/15/
2013
11/1
5/20
1312
/15/
2013
1/15
/201
42/
15/2
014
3/15
/201
44/
15/2
014
5/15
/201
46/
15/2
014
7/15
/201
48/
15/2
014
9/15
/201
410
/15/
2014
11/1
5/20
1412
/15/
2014
1/15
/201
52/
15/2
015
3/15
/201
54/
15/2
015
5/15
/201
56/
15/2
015
7/15
/201
58/
15/2
015
9/15
/201
510
/15/
2015
11/1
5/20
1512
/15/
2015
1/15
/201
62/
15/2
016
3/15
/201
64/
15/2
016
5/15
/201
66/
15/2
016
7/15
/201
68/
15/2
016
9/15
/201
610
/15/
2016
11/1
5/20
1612
/15/
2016
1/15
/201
72/
15/2
017
3/15
/201
74/
15/2
017
5/15
/201
76/
15/2
017
7/15
/201
7
Prosecco – rolling 52 week dollars$279MM latest 52 weeks
• share doubled since 2013; now about the same $$ share as Champagne• bringing new consumers into sparkling, and expanding category purchases• helping to spread ‘sparkling’ sales throughout the year• 187 ml – 6% of category and +71%
Copyright © 2017 The Nielsen Company. Confidential and proprietary.
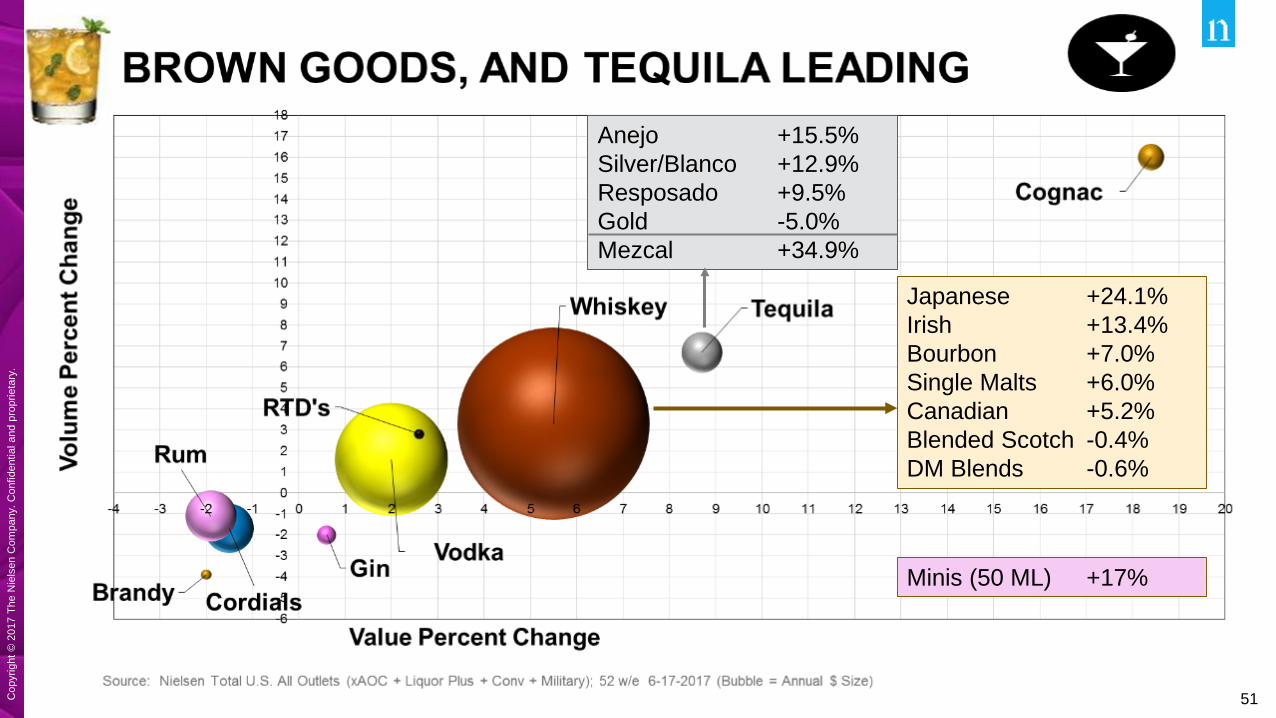
SPIRITS• Price (least expensive per serving)• Diversity and versatility - every drink
can be a new drink• Expanding demographics
51Cop
yrig
ht ©
201
7 Th
e N
iels
en C
ompa
ny. C
onfid
entia
l and
pro
prie
tary
.C
opyr
ight
© 2
017
The
Nie
lsen
Com
pany
. Con
fiden
tial a
nd p
ropr
ieta
ry.
Japanese +24.1%Irish +13.4%Bourbon +7.0%Single Malts +6.0%Canadian +5.2%Blended Scotch -0.4%DM Blends -0.6%
Anejo +15.5%Silver/Blanco +12.9%Resposado +9.5%Gold -5.0%Mezcal +34.9%
Minis (50 ML) +17%
52Cop
yrig
ht ©
201
7 Th
e N
iels
en C
ompa
ny. C
onfid
entia
l and
pro
prie
tary
.C
opyr
ight
© 2
017
The
Nie
lsen
Com
pany
. Con
fiden
tial a
nd p
ropr
ieta
ry.
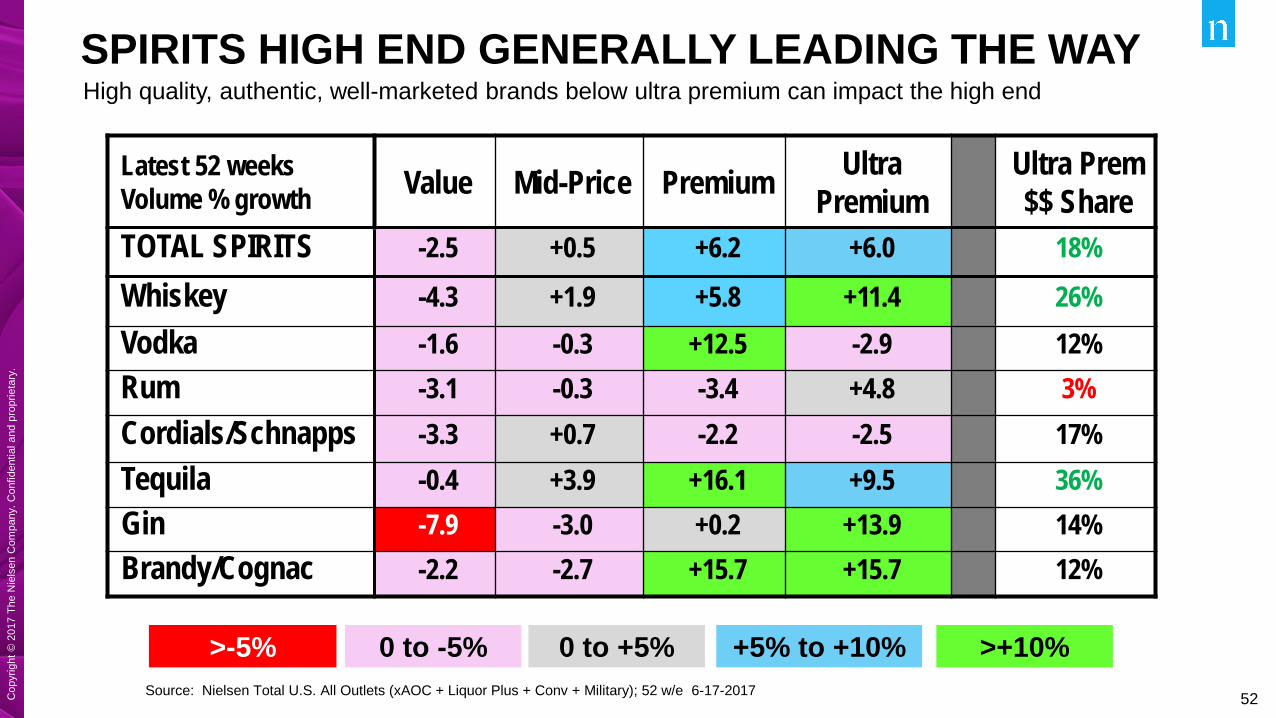
SPIRITS HIGH END GENERALLY LEADING THE WAY
Latest 52 weeksVolume % growth Value Mid-Price Premium Ultra
PremiumUltra Prem $$ Share
TOTAL SPIRITS -2.5 +0.5 +6.2 +6.0 18%Whiskey -4.3 +1.9 +5.8 +11.4 26%Vodka -1.6 -0.3 +12.5 -2.9 12%Rum -3.1 -0.3 -3.4 +4.8 3%Cordials/Schnapps -3.3 +0.7 -2.2 -2.5 17%Tequila -0.4 +3.9 +16.1 +9.5 36%Gin -7.9 -3.0 +0.2 +13.9 14%Brandy/Cognac -2.2 -2.7 +15.7 +15.7 12%
>-5% >+10%+5% to +10%0 to -5% 0 to +5%Source: Nielsen Total U.S. All Outlets (xAOC + Liquor Plus + Conv + Military); 52 w/e 6-17-2017
High quality, authentic, well-marketed brands below ultra premium can impact the high end
53Cop
yrig
ht ©
201
7 Th
e N
iels
en C
ompa
ny. C
onfid
entia
l and
pro
prie
tary
.C
opyr
ight
© 2
017
The
Nie
lsen
Com
pany
. Con
fiden
tial a
nd p
ropr
ieta
ry.
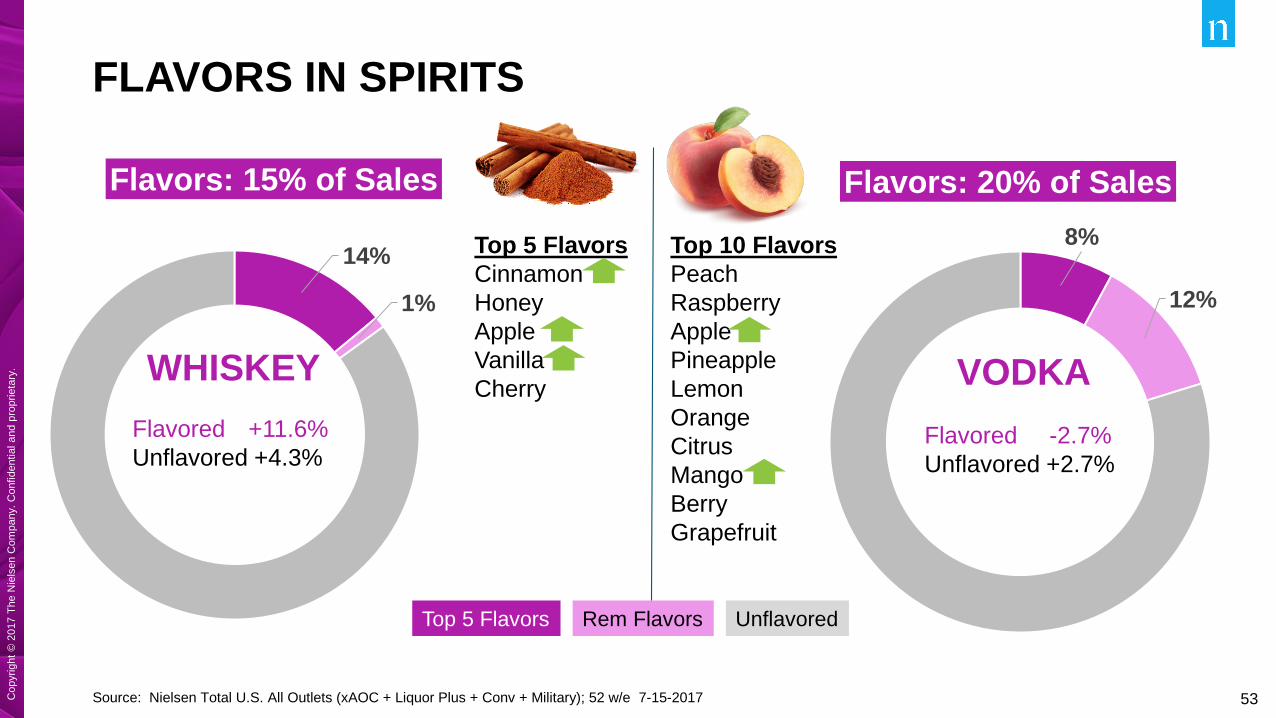
FLAVORS IN SPIRITS
Source: Nielsen Total U.S. All Outlets (xAOC + Liquor Plus + Conv + Military); 52 w/e 7-15-2017
Top 5 Flavors Rem Flavors Unflavored
Top 10 FlavorsPeachRaspberryApplePineappleLemonOrangeCitrusMangoBerryGrapefruit
Top 5 FlavorsCinnamonHoneyAppleVanillaCherry
14%
1%
Flavors: 15% of Sales
WHISKEYFlavored +11.6%Unflavored +4.3%
8%
12%
Flavors: 20% of Sales
VODKAFlavored -2.7%Unflavored +2.7%
54Cop
yrig
ht ©
201
7 Th
e N
iels
en C
ompa
ny. C
onfid
entia
l and
pro
prie
tary
.
Copyright © 2017 The Nielsen Company. Confidential and proprietary.
CHANGE, CHANGE, CHANGE
55Cop
yrig
ht ©
201
7 Th
e N
iels
en C
ompa
ny. C
onfid
entia
l and
pro
prie
tary
.
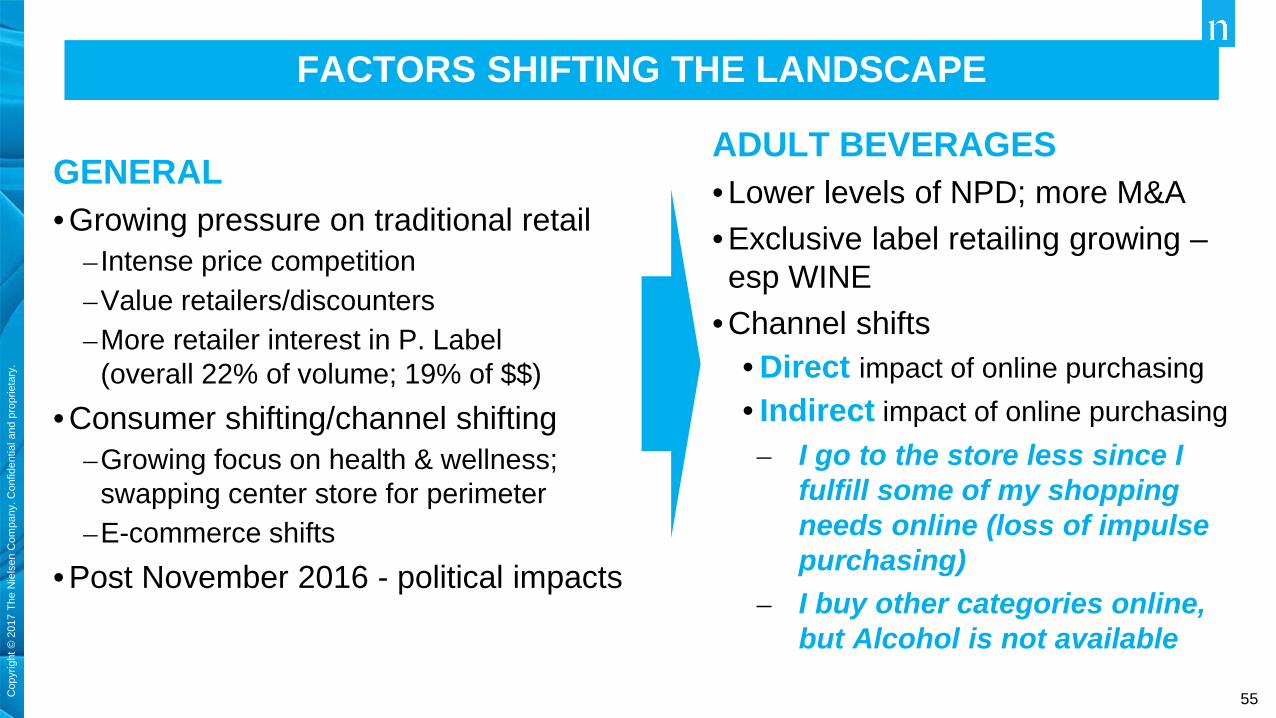
FACTORS SHIFTING THE LANDSCAPE
GENERAL• Growing pressure on traditional retail
– Intense price competition–Value retailers/discounters–More retailer interest in P. Label
(overall 22% of volume; 19% of $$) • Consumer shifting/channel shifting
–Growing focus on health & wellness; swapping center store for perimeter
–E-commerce shifts • Post November 2016 - political impacts
ADULT BEVERAGES• Lower levels of NPD; more M&A• Exclusive label retailing growing –esp WINE
• Channel shifts• Direct impact of online purchasing• Indirect impact of online purchasing– I go to the store less since I
fulfill some of my shopping needs online (loss of impulse purchasing)
– I buy other categories online, but Alcohol is not available
56Cop
yrig
ht ©
201
7 Th
e N
iels
en C
ompa
ny. C
onfid
entia
l and
pro
prie
tary
.
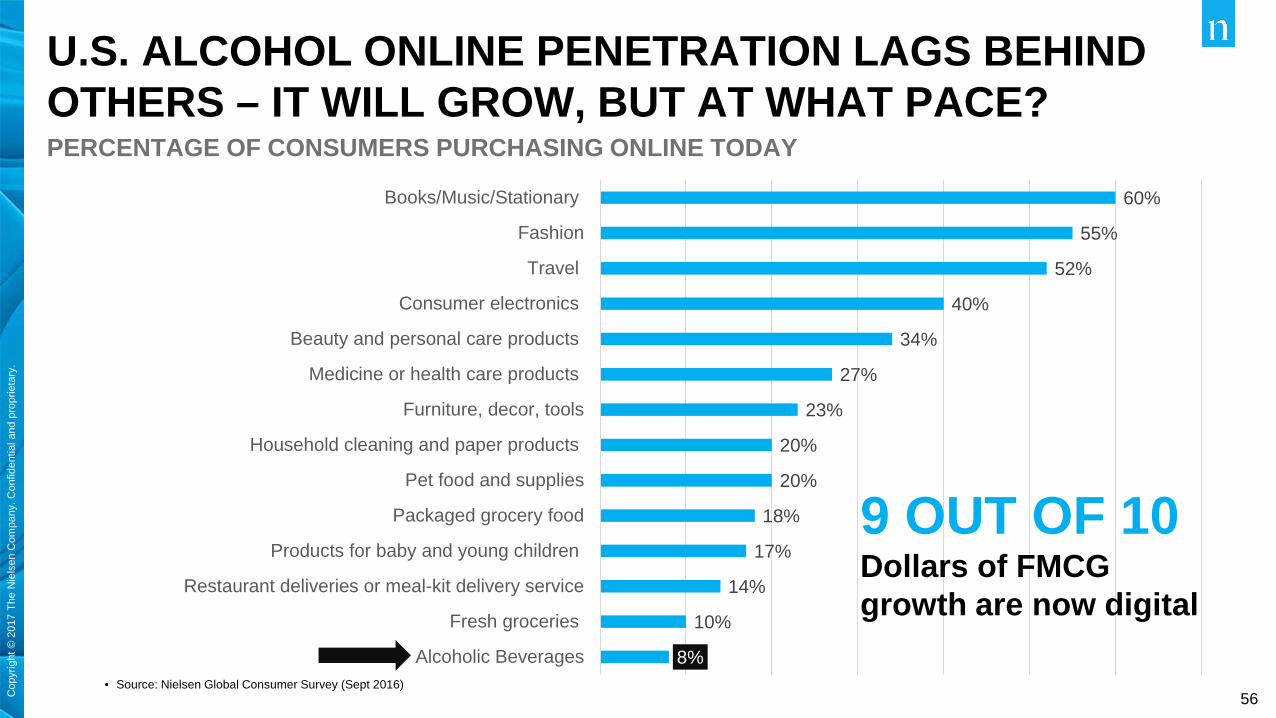
8%
10%
14%
17%
18%
20%
20%
23%
27%
34%
40%
52%
55%
60%
Alcoholic Beverages
Fresh groceries
Restaurant deliveries or meal-kit delivery service
Products for baby and young children
Packaged grocery food
Pet food and supplies
Household cleaning and paper products
Furniture, decor, tools
Medicine or health care products
Beauty and personal care products
Consumer electronics
Travel
Fashion
Books/Music/Stationary
• Source: Nielsen Global Consumer Survey (Sept 2016)
U.S. ALCOHOL ONLINE PENETRATION LAGS BEHIND OTHERS – IT WILL GROW, BUT AT WHAT PACE?PERCENTAGE OF CONSUMERS PURCHASING ONLINE TODAY
9 OUT OF 10Dollars of FMCG growth are now digital

57Cop
yrig
ht ©
201
7 Th
e N
iels
en C
ompa
ny. C
onfid
entia
l and
pro
prie
tary
.
Copyright © 2017 The Nielsen Company. Confidential and proprietary.
58Cop
yrig
ht ©
201
7 Th
e N
iels
en C
ompa
ny. C
onfid
entia
l and
pro
prie
tary
.
Copyright © 2017 The Nielsen Company. Confidential and proprietary.
Danny Brager – [email protected]
Thank you – Cheers!!!