What’s new at Embedded Systems Conference · PDF fileEmbedded systems have shown rapid...
20
Embedded systems have shown rapid development in the last 15 years. There was a time when they were only to be found in complex technical products that were never used in the average household, but now they are everywhere. The general public may be unaware of them since they are embedded and work behind the scenes, but we in the “embedded community” know that every ordinary member of society comes into contact with them every day. Whether in the car, cell phone, MP3 player, home cinema, washing machine, or cooker – embedded systems are in daily use in almost all technical de- vices, using one or more microcontrollers, digital signal processors, and of course their respective software. And we, the “embedded community”, have to make sure that everything works perfectly and without any fuss. TRACE32 – a premium product Lauterbach was founded 29 years ago in the pio- neering age of embedded systems. It has managed to turn the challenges of this market into techno- logical and economic success by a mixture of the right know-how and enormous commitment. Just as we can no longer imagine items of daily use without embedded systems, a developer in the embedded systems industry cannot imagine work without TRACE32. Whether in Europe, the USA, or Asia, TRACE32 is recognized as the premier product and the world’s leading brand in micropro- cessor development tools, which is borne out by some very impressive figures: In 2007 alone, over 7000 new workplaces worldwide were equipped with TRACE32! TRACE32 stands for continuity, but mainly for progress and inventive- ness. One or the other is always in the foreground, depending on the branch of industry. In this coming year, we intend to push ahead strongly in the development of our products and in- vest in solid growth so that you can continue to rely on Lauterbach as an innovative partner. The past year, 2007, was of course not a year of standing still. In this news- letter for 2008, we wish to show you the technological progress we have made during the last year. We would like to encourage you to try some of these new features for your development to improve your efficiency. We will be presenting many of these innovations at the ESC Silicon Valley, to which, as every year, we cordially invite you. What’s new at Embedded Systems Conference 2008 Contents Hardware debugging in UML 3 New supported processors 8 Debugging with power-saving modes 9 New debugging concept for SMP systems 13 New preprocessors / NEXUS adapters 17 CombiProbe 18 Working successfully behind the scenes www.lauterbach.com RTOS DigRF CFI UML TRACE 32 Combi Probe Power Saving STM ITM WinCE SMP Nexus Auto- Focus TI DSP
Transcript of What’s new at Embedded Systems Conference · PDF fileEmbedded systems have shown rapid...

Embedded systems have shown rapid development
in the last 15 years. There was a time when they
were only to be found in complex technical products
that were never used in the average household, but
now they are everywhere. The general public may
be unaware of them since they are embedded and
work behind the scenes, but we in the “embedded
community” know that every ordinary member of
society comes into contact with them every day.
Whether in the car, cell phone, MP3 player, home
cinema, washing machine, or cooker – embedded
systems are in daily use in almost all technical de-
vices, using one or more microcontrollers, digital
signal processors, and of course their respective
software. And we, the “embedded community”,
have to make sure that everything works perfectly
and without any fuss.
TRACE32 – a premium productLauterbach was founded 29 years ago in the pio-
neering age of embedded systems. It has managed
to turn the challenges of this market into techno-
logical and economic success by a mixture of the
right know-how and enormous commitment. Just
as we can no longer imagine items of daily use
without embedded systems, a developer in the
embedded systems industry cannot imagine work
without TRACE32. Whether in Europe, the USA,
or Asia, TRACE32 is recognized as the premier
product and the world’s leading brand in micropro-
cessor development tools, which is borne out by
some very impressive fi gures: In 2007 alone, over
7000 new workplaces worldwide were
equipped with TRACE32!
TRACE32 stands for continuity, but
mainly for progress and inventive-
ness. One or the other is always in the
foreground, depending on the branch
of industry. In this coming year, we
intend to push ahead strongly in the
development of our products and in-
vest in solid growth so that you can
continue to rely on Lauterbach as an
innovative partner.
The past year, 2007, was of course not
a year of standing still. In this news-
letter for 2008, we wish to show you the
technological progress we have made
during the last year. We would like to
encourage you to try some of these new features
for your development to improve your effi ciency.
We will be presenting many of these innovations at
the ESC Silicon Valley, to which, as every year, we
cordially invite you.
What’s new at EmbeddedSystems Conference 2008
Contents
Hardware debugging in UML 3
New supported processors 8
Debugging with power-saving modes 9
New debugging concept for SMP systems
13
New preprocessors / NEXUS adapters 17
CombiProbe 18
Working successfully behind the scenes
www.lauterbach.com
RTOS
DigRF
CFIUML
TRACE32
Combi ProbePower Saving
STM ITM
WinCE
SMP
NexusAuto-Focus
TI DSP

www.lauterbach.com
DEBUGGER, REAL-TIME TRACE, LOGIC ANALYZER
NEWS 2008
2
PowerDebug
PowerTrace
Power-Integrator
PowerView
PowerProbe
Today, fast and effi cient software development is
often the decisive factor in the launching of new
products. To avoid having to wait for the fi rst hard-
ware prototypes at the start of the development
phase, Virtual Prototypes (software models of the
hardware) are becoming increasingly common.
As soon as a Virtual Prototype is available for the
target hardware, work can start on debugging the
drivers, the operating system, and the application.
So that we can offer our customers the profes-
sional development environment TRACE32 in this
early phase of their project, Lauterbach has been
supporting the debugging of software models
since 2007. The debugging interface used here is
the debugging API of the Virtual Prototype.
TRACE32 for Virtual Prototypes
CoWare® CoWare
Virtual Platform
ARM
Synopsys® Virtual Platform
(formerly Virtio)
ARM
XScale
VaST ™ VaST
Virtual System
Prototype
ARM
OAK
PowerPC/eTPU
SH2A
StarCore
TeakLite
TriCore/PCP
V850
Virtual Prototypes
TRACE32 as GDB front end
Since early 2007, the TRACE32 GUI can also be
used for process debugging with GDB. The sup-
ported communication interfaces to the target
hardware are Ethernet or RS-232.
Debugging application processesTo debug two or more application processes simul-
taneously, Lauterbach provides its own debugging
agent – t32server, which is started fi rst in the Linux
terminal window. Subsequently via the TRACE32
GUI several GDB servers for testing application
processes can be started. The t32server service is
then responsible for data exchange between the
TRACE32 GUI and the GDB servers (see Fig. 1).
Other innovationsIn the 2007 Newsletter, Lauterbach announced
“Integrated run- & stop-mode debugging for em-
bedded Linux applications”. This year this is fol-
lowed by a new concept for debugging SMP Linux
(see page 13).
ARM Available
I386 Available
MIPS32 Available
PowerPC Available
SH4 Planned
XScale Available
GDB front end
GDBserver 1
Task1
Task2
Task3
GDBserver 2
GDBserver 3
Ethernet / RS-232
t32server
TRACE32GUI
Embedded LINUXEmbedded LINUX
Fig. 1: The t32server service, enabling simultaneous debugging of two or more application processes

IntroductionIt will soon no longer be possible to master the
growing complexity of software without the use of
CASE tools. UML, especially, has enabled the uni-
form design of modular software components, in-
cluding automatic code generation, which prevents
common coding errors right from the start.
However many companies shy away from the per-
ceived effort required for the changeover to these
new techniques. They have a code base that has
been built up over decades and although the soft-
ware has been constantly extended and improved.
This has also led to the creation of more and more
“spaghetti code”. Millions of functioning lines of
code would need to be analyzed, re-programmed,
and fi nally re-tested.
In most cases these fears are unfounded. Existing
C code can be transferred to a UML model element
with almost no changes necessary. Future exten-
sions can then be written as UML models, gener-
ated, and integrated with the “old” C code. As a
result, an easy and progressive transition from C to
UML is possible. The following example explains
these procedures:
1. Transfer from “old” C code to UML.
2. Integration of a new functionality coded in UML.
3. Uniform testing and debugging in UML, C++
and C.
Old C codeAt the outset, we have a fi nished project in C code.
The following example uses a traffi c light system
(which is a favorite of software designers due to
its simplicity). There is a standard intersection with
four sets of traffi c lights. The traffi c lights located
opposite each other are controlled in parallel. The
traffi c lights at the right angle to them are, of course,
controlled complementary. The different traffi c light
phases are: red – red and yellow – green – yellow –
red. During the red phase of one set of traffi c lights,
right of way switches to the opposite direction.
As a result, there is a short period when the lights
facing in all directions are on red (this is important,
as we shall see later).
This circuit is coded in C as a simple control (switch-
case) in a continuous loop (while (1)). This continu-
ous loop is found directly in the “main()” routine of
the application, and is called immediately after ini-
tialization (see Fig. 3).
New requirementsThe street planners have decided that a tramline
should cross the intersection in both directions ⟩⟩
www.lauterbach.com 3
NEWS 2007DEBUGGER, REAL-TIME TRACE, LOGIC ANALYZER
NEWS 2008
PowerView
PowerDebug
Power-Integrator
PowerProbe
PowerTrace
Integration, testing, and debugging of C code together with UML-generated sources
Fig. 2: Adding tram traffi c lights to a traffi c intersection
... int main (void) { horizontal = vertical = red; state = closed_to_h;
while (1) { switch (state) { case closed_to_h: wait (1); horizontal = yellowred; state = yellowred_h; break;
case yellowred_h: wait (3); horizontal = green state = green_h; break; ...
Fig. 3: Existing C code for traffi c-light control; the “main()” routine includes a continuous loop that contains the logic as a switch-case construct.
www.lauterbach.com
DEBUGGER, REAL-TIME TRACE, LOGIC ANALYZER
NEWS 2008
4
(vertically as well as horizontally, refer to Fig. 2 on
page 3). Therefore, the trams must be stopped at
the intersection by their own set of traffi c lights. At
the request of the tram driver, the intersection is
blocked for cars at the next red light phase, and the
tram is given right of way.
UML wrapper for C codeWe could, of course, just “patch” these require-
ments into our C code. But doing so would only
make the function larger and more complicated,
which is exactly what we want to avoid. So instead
of this, we will take a modular approach to the
problem and solve it with the help of UML.
Firstly, we need to “trans-
fer” the existing appli-
cation over to our UML
model, which is easier
than it sounds: We create
one class, called “Car-
Junction”, which contains
the complete “old” appli-
cation (see Fig. 4).
The only thing that we need to adapt are the corre-
sponding interfaces. The usual continuous loop in
main() is already part of the framework and there-
fore has to be omitted. Instead, “main()” is renamed
“processJunction()”, and this becomes our new
starting point. The end point of the function will be
the phase when all traffi c lights are on red. Now, if
required, we can execute additional actions during
this red phase (see Fig. 5). – And that’s it.
UML design for new requirementsNow we can take care of the design for the new
requirements. We build a class called “Junction”,
which contains the old traffi c light controls, called
“CarJunction”, as well as two new tram traffi c lights
(Fig. 6). The design is now fi nished, and we can
focus on the behavior of the extended intersection,
using a state transition diagram.
The old application is once again used as a starting
point, and its whole behavior is incorporated into a
single state of the new intersection (state: cars), see
Fig. 7 on the opposite page. When the new model
has this state, it works in exactly the same way as
the old application. Only when the new feature – the
tram driver requests right of way – is required, the old
code is left and the new model starts. The phases
and the transition of states for both tramlines are de-
fi ned in the state diagram: request – wait – release –
wait (possibly a switch between tramlines). This
completes our model of the new requirements. ⟩⟩
PowerTrace
Power-Integrator
PowerView
PowerProbe
PowerDebug
Fig. 4: The “CarJunction” class, containing the com-plete “old” application
void processJunction (void) { horizontal = vertical = red; state = closed_to_h;
do { switch (state) { case closed_to_h: wait (1); horizontal = yellowred state = yellowred_h; break; /*........*/ case yellow_v: wait (3); vertical = red; state = closed_to_h; break;
} // switch (state) } while ((state != closed_to_h) && (state != closed_to_v)); } // processJunction()
Fig. 5: Modifi ed C code that can be integrated in the UML tool in this form
Fig. 6: The new class, “Junction”, integrating the “old” traffi c-light switching and the two new traffi c lights for the tram

Code generationWe can now generate the executable application.
For good UML tools this is all that is required for
generating the fi nished application for the above-
mentioned model. However, now is the time to
note a few points about integration. Our initial ap-
plication is written, and remains, in C. UML tools,
however, normally generate C++ code, meaning
that our “CarJunction” is a wrapper class that ref-
erences the C code. Here, the usual adaptations
between C and C++ must be taken into account.
Typically, an RTOS is used to manage the model
and must be integrated as required. Once all this
has been done, a simple press of a button gener-
ates a ready-to-run application from the model.
Target runIn the fi eld of embedded technology, the target
hardware is often different from the computers
used for development. This means that we need to
load the generated application onto the so-called
“target” and run it there. This can be done using any
external tool that can install code on the target.
This is especially easy if the UML tool and the de-
bugger communicate over a common (software)
interface, such as the integration between the UML
tool Rhapsody from Telelogic and the TRACE32
debugger from Lauterbach. This allows you, at the
press of a button in the modeling tool, to load the
application to the target over the debug interface,
and – if required – start it straight away. The com-
plete cycle of design – modeling – generation – run
is possible in one GUI.
Testing in CAs was mentioned at the start, performing testing
and debugging in a heterogeneous environment
pose certain requirements. It must be ensured that
the whole application can be tested in its respec-
tive function and implementation.
Although we are assuming that we already had a
functioning application in C, debugging should still
be possible. After all, the transfer of new features
to the “old” code needs to be tested, and the old
source code maintained. At least for this part of the
application any commercial debugger can be used,
as it is now standard in the fi eld of embedded tech-
nology to debug C code.
Testing in C++The process becomes more interesting when we
begin testing the new features at source level.
Most UML tools generate C++ code with all the ⟩⟩
www.lauterbach.com 5
NEWS 2007DEBUGGER, REAL-TIME TRACE, LOGIC ANALYZER
NEWS 2008
PowerView
PowerDebug
Power-Integrator
PowerProbe
PowerTrace
Fig. 7: State diagram of new traffi c-light switching

characteristics that belong to it, such as templates,
polymorphism, and exception handling. It must be
remembered that the debugger used must provide
full support for the C++ dialect of the compiler. The
TRACE32 debugger from Lauterbach supports all
current C++ compilers, and so guarantees com-
fortable debugging of object-oriented C++ code.
Testing in UMLBut of course, we didn’t write our code in C++, but
rather in UML. And what would
make more sense than to carry out
debugging on the modeling level?
Rhapsody from Telelogic offers sev-
eral options to serve this purpose.
If the behavior of the application is
completely modeled in UML, the
sequence can be simulated directly
from the model. For simple behavior analysis, the
actual target hardware is not required. As the tar-
get will have a different timing than the simulation,
the application can also be run as an “animation”
on the real target. The UML tool controls and vi-
sualizes the target process over a communication
channel (serial or Ethernet). So it is possible to per-
form single steps through state charts or to induce
events.
In combination with a TRACE32 debugger, this
communication can also take place over the de-
bug interface if there is no other interface available.
Direct debugging in the UML model is made pos-
sible via “animation”.
Integrated UML -> C++ -> C debuggingNow we have a situation spread over three levels:
UML, C++, and C. When an error is found, espe-
cially in C++ code, it is better to repair it in the mod-
el, and not in the generated C++ code itself. On the
other hand, the debugging of the implementa-
tion of a model element is best carried out in the
source, without having to search for it.
The integration of TRACE32 and Rhapsody offers
extensive functionality in order to link these levels
together (Fig. 8), such as the implementation of
simple, interdependent navigation. A single mouse
click on a model element in Rhapsody is enough
to display the corresponding source code in
TRACE32. This then allows the extensive analysis
of variables, function calls, and so on. It also works
the other way around; with a simple click on a line
of source code in the debugger, the accompany-
ing model element is highlighted in the UML tool. ⟩⟩
www.lauterbach.com
DEBUGGER, REAL-TIME TRACE, LOGIC ANALYZER
NEWS 2008
6
PowerTrace
Power-Integrator
PowerView
PowerProbe
PowerDebug
Fig 8: The integration of TRACE32 and Rhapsody allows a debugging in UML, C++ and C.

CFI fl ash programmingAutomatic generation of the fl ash declaration via
the Common Flash Memory Interface – CFI – has
been supported since September 2007.
To program a fl ash, you always had to have detailed
knowledge about the exact type and organization
of the device. Thanks to the special query mode of
CFI-conformant fl ash devices, TRACE32 can now
identify the parameters needed for programming
and use this data to create a fl ash declaration
automatically.
Serial fl ash / NAND fl ashSince September 2007, TRACE32 has supported
the programming of NAND fl ash devices as well
as serial fl ash devices with a separate command
(FLASHFILE).
Code overlaysSince December 2007, TRACE32 has support-
ed the symbol management for code overlays in
ELF fi les with the command sYmbol.OVERLAY. The
ARC, ARM, and PowerPC architectures are cur-
rently supported. Further architectures are planned
for 2008.
PCP debuggerSince November 2007, a separate TRACE32 in-
stance has to be started to debug the Peripheral
Control Processor – PCP – of the Infi neon TriCore
processor. This innovation was needed to enable
the loading and testing of C code for the PCP.
Of course this instance is also used to confi gure
the PCP trace and analyze the trace information.
The license for the PCP debugging and tracing is
included in the scope of delivery of the TRACE32
debugger for TriCore.
www.lauterbach.com 7
NEWS 2007DEBUGGER, REAL-TIME TRACE, LOGIC ANALYZER
NEWS 2008
PowerView
PowerDebug
Power-Integrator
PowerProbe
PowerTrace
This is especially helpful if a problem is found with
the debugger, which needs to be repaired in the
model. A lengthy search and navigation to the
relevant element thus becomes unnecessary.
Debugger breakpoints can also be defi ned in the
model and the target can be set into Go or Stop
status. This enables you to set a breakpoint at a
class and start the target, all from within the UML
tool. The debugger stops the application as soon as
the model element under examination is invoked.
SummaryA complete redesign is not always necessary.
Particularly for projects where re-engineering is not
possible due to time or organization constraints, a
step-by-step approach is often appropriate. This
limits the effort required and allows to import the
existing software step by step into a modern and
innovative CASE tool.
It is, of course, essential that the tools used in this
process help and don’t hinder; the selection of the
correct tools is an important factor. They should
not just be able to perform these tasks, but should
also encourage them.
Lauterbach and Telelogic have achieved just this
with the integration of their tools TRACE32 and
Rhapsody. Both companies want to help their cus-
tomers keep software quality at high levels, despite
increasing complexity and ever more requirements.
Now nothing stands in the way of modernizing your
existing code bases with UML.
Latest news in brief

www.lauterbach.com
DEBUGGER, REAL-TIME TRACE, LOGIC ANALYZER
NEWS 2008
8
PowerTrace
Power-Integrator
PowerView
PowerProbe
New supported processors
PowerDebug
P.A. Semi PWRfi cient™ Q2/2008
Renesas H8SX Available
Tensilica Xtensa
Processors
Available
TexasInstruments
TMS320™C28xx Available
New architecturesPWRfi cientThe PA6T-1682M dual-core processor will be the
fi rst 64-bit PowerPC of the PWRfi cient architecture
supported by a Lauterbach debugger.
TMS320C28xxWith the debugger for the TMS320C28xx DSPs,
Lauterbach is providing even more support for
the TMS320 Processor Platform from Texas Instru-
ments.
New derivatives
AMCC PPC405- PPC405EX / EXR
PPC44x- PPC460EX
ARC ARC- ARC® 700 Core
- ARCtangent-A4
- ARCtangent-A5
Freescale™ ColdFire- MCF52110 / MCF52100
- MCF5221x
- MCF523x / MCF532x
- MCF5372 / MCF5373
MPC5500- MPC551x
- MPC56xx
MPC5200- MPC512x with
AXE audio processor
PowerQUICC II- MPC8377
PowerQUICC III- MPC8572
Freescale™
(cont.)
ARM11 / StarCore- MXC91321
Infi neon C166S- XC22xx / XC23xx / XC27xx
- XE166
TriCore- TC1736
- TC1767 / TC1767ED
- TC1797 / TC1797ED
Microchip MIPS32- PIC32™
NXP ARM9- LPC3000
MIPS32- PNX83xx / PNX85xx
STMicro-electronics
MPC5500- SPC563Mxx
- SPC560Bxx / Pxx / Sxx
Cortex-M- STM32
TexasInstruments
Cortex-A / DSP- OMAP3430

In response to constantly rising demands for economical use of energy and long standby times, modern cores often have various differ-ent energy-saving mechanisms. These allow the software, whenever possible, either to reduce the core frequency or to switch off the core com-pletely. However, these so-called energy-saving modes can adversely affect communication be-tween the debugger and the core. In the follow-ing, with the ARM architecture as an example, we show variants for problem-free debugging of programs using energy-saving modes.
Ignoring energy-saving modesOf course, the fi rst and easiest way is to tell the
core to ignore energy-saving modes during de-
bugging. For example, ARM11 has a so-called
Powerdown Disable Bit. When this bit is set, the
core activates a line that informs the external pow-
er and clock management about the debugging.
If then the program tries to activate an energy-
saving mode, the power and clock management
can simply ignore it to avoid problems during de-
bugging. Setting the Powerdown Disable Bit is one
of the basic settings of the TRACE32 debugger for
ARM11, Cortex-A, and Cortex-M.
If developers want to test
the behavior of the design
with regard to energy-saving
modes, they can of course
reset the Powerdown Disable Bit with a debugger option
(SYStem.Option PWRDWN ON, see Fig. 9).
However, there are many ARM-
based chips that do not have
a Powerdown Disable Bit. In
this case, a special debug
version of the software with-
out instructions for activating
energy-saving modes could
be created. However, the dis-
advantage of this is that the
debug version of the software
would be different from the
release version.
But why can debugging and use of energy-saving
modes lead to problems? In the fi rst part of this
article, we look at single-core chips: How does
switching off (core) power or clock affect debug-
ging? Next, we look at multi-core chips. From the
large number of possible challenges, we concen-
trate on the effect that switching off the clock of
a single core has on the debugging of the entire
chip.
Switching off powerAt the VTREF pin (target voltage reference pin) of
the JTAG connector, the debugger can detect a
powerdown. If the user confi gures the debugger to
use this energy-saving method, the debugger can
wait until power-up instead of issuing an error mes-
sage (StandBy mode).
In practice, the debugger can be in one of the two
following states:
• Up (StandBy): the processor has power and
there is communication between the debugger
and the processor.
• StandBy: power is off and the debugger keeps
the ARM processor in reset over the SRST line.
The debugger waits for power to be switched on
again (see Fig. 10).
When power is switched on again, the debugger
releases the reset line and the processor runs as it
would after a power-up reset.
However, the power-up reset of the ARM proces-
sor resets the debug logic, the ETM/ETB logic,
and the assignment for the ETM pins. The settings
that were active before powerdown are lost. ⟩⟩
www.lauterbach.com 9
NEWS 2007DEBUGGER, REAL-TIME TRACE, LOGIC ANALYZER
NEWS 2008
PowerView
PowerDebug
Power-Integrator
PowerProbe
PowerTrace
Debugging with power-saving modes for ARM cores
Fig. 9: The PWRDWN option, defi ning whether energy-saving modes are ignored or not dur-ing debugging
Power is switched on
Power is switched off
StandByStandBy
Up (StandBy)Up (StandBy)
Fig. 10: Instead of issuing an error message, the debugger waits for power-up following a powerdown.

Seamless continuation of debugging is possible
only if the debugger manages to restore these set-
tings before the ARM processor starts executing
the program.
For the debugger to be able to carry out the neces-
sary restore actions at power-up, the target hard-
ware must meet some requirements.
The best caseThe best case is when the following requirements
are met:
1. The debugger can keep the ARM processor in
reset over the SRST line.
2. The processor reset (SRST) and the reset for the
debug logic (TRST) are separate lines.
3. Via the VTREF pin of the JTAG interface, the de-
bugger can quickly detect that power has been
switched off.
If these requirements are met, the debugger only
releases the reset for the debug logic when it
detects power-up. The settings of the debug logic
and the ETM/ETB confi guration are now restored.
Next, the processor reset is released and debug-
ging can be continued seamlessly, albeit somewhat
delayed (see Fig. 11).
Since the I/O pins are confi gured via memory
mapped registers, they cannot be restored for
the ETM trace port before the processor reset is
released and the program starts, so the program
itself has to activate the ETM port as fast as pos-
sible.
Other casesIf requirements 1 and/or 2 are not met, the ARM
processor starts up at power-up (see Fig. 12), while
the debugger simultaneously restores the debug
logic and the ETM/ETB confi guration. This can
have undesirable side effects. At the same time,
of course, the on-chip breakpoints and the trace
broadcasting are inactive in the restore phase.
Switching off the clock
Switching off the processor clock is a completely
different challenge for the debugger. We are deal-
ing here with the communication between the de-
bugger and the processor, or to be more precise,
the communication between the debugger and the
on-chip debug logic. This communication is almost
always running, even when the ARM processor is
processing the program.
As long as the debug logic is independent from the
processor clock the communication works, even if
the processor clock is switched off. For clocking
the (as asynchronously standardized) debug logic,
however, often a delayed and divided processor
clock is used. You know this is the case if you have
to use the command SYStem.JtagClock RTCK
when you confi gure the debugger.
Switching off the processor clock can affect com-
munication between the debugger and the on-chip
debug logic if two requirements are met:
1. The debug logic clock depends on the processor
clock.
2. The processor clock is switched off during
communication between the debugger and the
on-chip debug logic.
Now, when the processor clock is switched off, the
following happens:
1. The ARM processor freezes its current state.
2. The debug logic also freezes its current state
since its clock depends on the processor clock. ⟩⟩
www.lauterbach.com
DEBUGGER, REAL-TIME TRACE, LOGIC ANALYZER
NEWS 2008
10
PowerDebug
Power-Integrator
PowerView
PowerProbe
PowerTrace
nTRST
Core running shut down reset running
nSRST
VTREF
Fig. 11: Following power-restore, fi rst the debug logic and the ETM/ETB confi guration are restored (green arrow). Only then does the ARM processor start to execute the program.
Core running shut down running
nSRST / nTRST
VTREF
*
(* = reset)
Fig. 12: Undesirable side effects resulting from a processor restart while the debugger is restoring the debug logic and the ETM/ETB confi guration (red arrow)

3. The debugger breaks off communication with the
on-chip debug logic after some timeout since
the on-chip debug logic no longer responds.
When the processor clock is switched on again,
the debug logic resumes communication with the
debugger at exactly the place where it was frozen,
while the debugger has long since re-initialized
communication since it received no response from
the debug logic.
Since the debug logic of the ARM processor is con-
trolled by the debugger, the debugger would have
to reset the debug logic in order to synchronize
communication again. However, at least for a brief
period during the program run, all on-chip break-
points would be deleted. This is far from ideal.
The following solutions have proved reliable for
customers:
1. Checking the processor clock
We recommend confi guring the debugger so that
it checks whether the processor clock is running
before starting communication with the on-chip
debug logic. For this the debugger puts the debug
logic in Run Test/Idle mode at the end of each com-
munication. In this mode, the processor clock can
be easily tested before resumed communication.
2. Reducing status queries
While the ARM core is processing the program, the
debugger sends status queries to the debug log-
ic 10 times a second. This way it checks whether
the program is still running or whether it has been
stopped. A next step is to reduce the frequency of
these status queries. We recommend a query every
2-3 seconds (SETUP.URATE 3.s). This solution is
quite simple: fewer queries reduce the risk of com-
munication problems.
3. Increasing timeout
If the program switches off the processor clock
very often but always only very briefl y, the debug-
ger can be confi gured so that it simply waits longer
before breaking off communication with the debug
logic (SYStem.POLLING SLOW). In certain circum-
stances, it might not even notice that the processor
clock was switched off.
Multi-core chipsMulti-core chips, which use only one JTAG inter-
face for debugging daisy-chained cores, require
additional measures if energy-saving modes are
used for individual cores. Consider the following
situation as an example: the clocking of the debug
logic depends on the core clock (RTCK) for core 2
and now the clock is switched off for only this core
(Fig. 13).
As described in the section “Switching off the
clock”, the debug logic of core 2 is frozen in this
case. Since the chaining of the cores means that
debug commands for core 1 / core 3 have to run
through core 2, the debugging for the entire chip is
now blocked.
To be able to continue debugging without compli-
cations when the clock for core 2 is switched on
again, we recommend confi guring the debugger
for the individual cores so that a check is made on
whether the core clock is running, before commu-
nication with the debug logic starts.
However, this is no solution to the problem that de-
bugging is blocked for the entire chip as soon as
the debug logic of a single core is frozen. Some
good solutions exist for this problem today, but the
chip manufacturers consider their solutions to be
confi dential, so we cannot present them here.
We will therefore restrict ourselves in the following
to explaining how the CoreSight DAP technology
solves this problem.
In the case of multi-core chips whose debug and
trace functionality is based on the CoreSight tech-
nology, the TRACE32 debugger no longer com-
municates directly with the debug logic of the ⟩⟩
www.lauterbach.com 11
NEWS 2007DEBUGGER, REAL-TIME TRACE, LOGIC ANALYZER
NEWS 2008
PowerView
PowerDebug
PowerProbe
PowerTrace
Power-Integrator
TMS
TCK
RTCKRTCK
TDO
TDI Core 3TMS TCK
TDI TDO
Core 1TMS TCK
TDOTDI
Core 2
TDI TDO
TMS RTCK TCK
Fig. 13: Switching off the clock for core 2 blocks debugging for the whole chip.

www.lauterbach.com
DEBUGGER, REAL-TIME TRACE, LOGIC ANALYZER
NEWS 2008
12
PowerView
PowerProbe
individual cores but with a so-called DAP (Debug
Access Port) instead. The DAP’s task is to distri-
bute the debug commands to the individual cores.
For debugging with energy-saving modes, the most
important innovation of the DAP technology is that
the DAP has its own power and clock domain. This
means that the DAP is unaffected by the energy-
saving modes of the individual cores. At the same
time, the cores are no longer daisy-chained under
CoreSight. Instead,
• Their debug logic is controlled by bus accesses
if it is implemented via memory mapped debug
registers.
• Their debug logic is controlled over a JTAG ac-
cess port if the core works with the traditional
debug logic.
These new control mechanisms guarantee that
the DAP can always address the individual cores
directly and that no further debug commands are
blocked by any frozen cores (see Fig. 14).
It can be generally said for multi-core chips that
if the debugging of energy-saving modes is par-
ticularly important in the development phase, you
should discuss this subject with the semiconduc-
tor manufacturer when choosing your chips. The
experts of the Lauterbach team will be happy to
advise you on this subject.
Analyzing energy consumptionFor all ARM-based chips with ETM and an off-chip
trace port, Lauterbach offers the option of analyz-
ing whether the energy-saving modes really result
in a maximum reduction of energy consumption for
the design. To answer this question, a measuring
arrangement is required that records the currents
and voltages at selected measurement points and
correlates them with the program fl ow information
output at the trace port.
Lauterbach offers such a measuring arrangement
since 2007. For this you need additionally to the
TRACE32 debugger:
• A real-time trace for the ETM
• An Analog Probe
• A Lauterbach logic analyzer; either the IProbe Logic Analyzer in PowerTrace II or the TRACE32-PowerIntegrator
Since in this measuring arrangement both the cur-
rents and voltages as well as the program fl ow are
synchronously timestamped by the TRACE32 soft-
ware, the links between the control software fl ow
and the current/power consumption can be easily
displayed and analyzed. Fig. 15 shows as an ex-
ample the absolute and percentage share of total
energy consumption calculated for each function
executed during the measurement time. In this way,
the important energy-consumption and standby-
time data can be verifi ed.
PowerDebug
PowerTrace
Power-Integrator
Memory mapped debug register
Memory mapped debug register
ARM core
Memory access port to APB/AHB/AXI
JTAG access port
ARM core
ARM core ARM core
JTAG JTAG
TRACE32CoreSight
DAPJTA
G
Fig. 14: The DAP can always address the debug logic of the in-dividual cores directly. This means it is no longer possible for the switching off of a clock for an individual core to block debugging of the entire chip.
Fig. 15: Graphic showing the connection between the program and the current/power consumption of the hardware
www.lauterbach.com 13
DEBUGGER, REAL-TIME TRACE, LOGIC ANALYZER
NEWS 2008
PowerView
PowerDebug
PowerProbe
PowerTrace
Power-Integrator
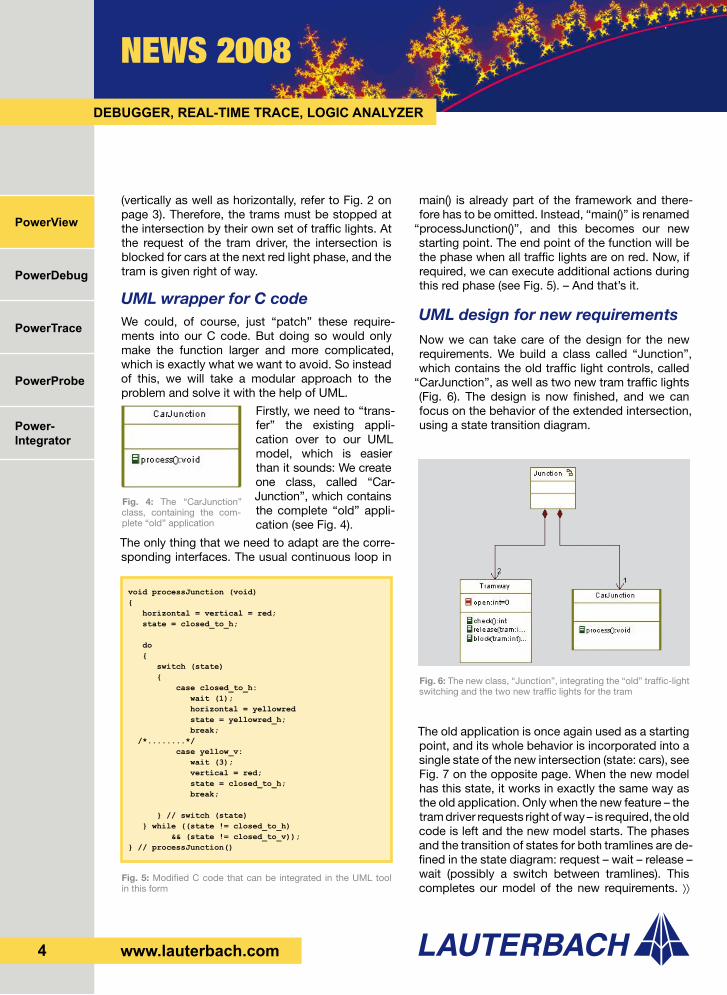
Lauterbach, the leading manufacturer world-wide of high-quality debuggers and real-time trace tools, is presenting its new debugging concept for SMP systems at the ESC 2008. SMP systems use an operating system to distribute processes dynamically to several cores or hard-ware threads. SMP Linux on a MIPS 34K will be demonstrated live at the fair.
Hardware parallelizationTo achieve higher processor performance for com-
plex applications and to save energy, more and
more parallelization of tasks is used. The most
popular method is to provide several identical
execution units that can all process the same task.
To most readers, the term “identical execution units”
means symmetric multi-core processors. It is easy
to imagine that the kernel of an operating system
is running permanently on a core and ensures that
the application processes are evenly distributed to
all cores (see Fig. 16).
However, for the parallelization of tasks not nec-
essarily a multi-core processor is required. Hard-
ware multithreading, for example, is an approach
that enables parallelization also for single-core
processors. Here, we deal with a basic problem of
cores with pipeline architecture: cache misses or
data dependencies between the instructions mean
that the pipelined instruction processing has to be
stalled in order to wait for the availability of required
data. The greater the difference between instruc-
tion processing time and memory access time, the
higher the performance loss.
Hardware multithreading deals with this situation
by making the core process several mutually inde-
pendent tasks quasi-simultaneously. In the case of
an operating system, “tasks” and “processes” are
equivalent.
In principle, this works as follows: As soon as a
task can no longer be further processed because
required data is not yet available,
the processing of another task is
continued.
Fig. 17 shows the processing of
3 tasks on 3 cores with simple
pipeline architecture (at the top)
and then (at the bottom) shows the
execution on a multithreaded core.
In order for hardware multithread-
ing to work, fast switching between
tasks must be possible. This can
be done simply by giving each task
a separate register set for its con-
text. With this method, it is easy to
deduce that the number of register
sets provided by the core defi nes
how many tasks can be processed
in parallel. For the MIPS 34K the
number is fi ve. In this way, one ⟩⟩
New debugging concept for symmetric multiprocessing (SMP)
Fig. 16: SMP Linux on a dual-core processor
SMP Linux & applications
Hardware with a dual-core processor
Core 2Core 1
Fig. 17: No more stalls in the pipeline, thanks to the quasi-simultaneous processing of several tasks
Task 1
Processing on 3 cores with simple pipeline architecture
Processing on a multithreaded core
Task 2
Task 3
process updateload
miss
miss
miss
missmiss
miss miss miss miss missmiss
load
miss miss miss
process update
process updateload
load process update load
load
load process update load processupdate loadprocess

www.lauterbach.com14
PowerDebug
Power-Integrator
PowerView
PowerProbe
PowerTrace
NEWS 2008DEBUGGER, REAL-TIME TRACE, LOGIC ANALYZER
“execution unit” (a so-called hardware thread) de-
rives from each register set (see Fig. 18).
SMP operating systemsAt the hardware level, the parallelization of pro-
cesses is implemented by symmetric multi-core
processors or multithreaded cores. Now software
is needed to organize the parallelization. An operat-
ing system is normally used for this purpose.
One variant, which is primarily suitable for hardware
with identical execution units, is operating systems
that implement symmetric multiprocessing (SMP).
The central feature of SMP operating systems is
the dynamic distribution of task/processes to the
available cores or hardware threads at program
runtime.
Other features:
• One instance of the operating system operates
all cores or hardware threads.
• Each application process can run on each core
or hardware thread. As a rule, only the kernel is
rigidly assigned to a core or hardware thread.
• All cores or hardware threads have equal rights
to request and use resources (e.g.: memory,
external interfaces, external devices).
• The operating system provides the functions for
distributing resources to the cores or hardware
threads.
New debug conceptAt present, the TRACE32 concept enables just one
core to be debugged with one instance of the de-
bugger (Core View). Up to now, this concept has
also worked perfectly for multi-core processors
since these processors were also operated as
asymmetric multiprocessing systems (AMP). Asym-
metric multiprocessing means: An independent
instance of an operating system runs on each core.
For AMP systems, this always statically defi nes
which process is running on which core. In this
way, the debug information can also be uniquely
assigned to the corresponding core.
In contrast, on SMP systems, the processes are
not assigned to the cores or hardware threads until
runtime. For this reason, it no longer makes sense
to start a debugging instance specifi cally for the
debugging of a selected core or hardware thread.
System View
As an alternative to the Core View, which works
very well for AMP systems, there is now the System View for SMP systems.
With the System View, only one instance of the
TRACE32 debugger is started to debug all cores
or hardware threads (see Fig. 19). Here too, root of
information display is one core or hardware thread.
The new aspect here is that the information ⟩⟩
Fig. 18: SMP Linux on a multithreaded core – here MIPS 34K
Thread1
Thread5
Thread4
Thread3
Thread2
SMP Linux & applications
Hardware with MIPS 34K
Fig. 19: Only one instance of the TRACE32 debugger is used for debugging all cores or hardware threads.
Thread1
Thread5
Thread4
Thread3
Thread2
Hardware with MIPS 34K
SMP Linux & applications

www.lauterbach.com 15
DEBUGGER, REAL-TIME TRACE, LOGIC ANALYZER
NEWS 2008
PowerView
PowerDebug
PowerProbe
PowerTrace
Power-Integrator
display can be switched by a command to another
core or hardware thread.
Process debugging can now be done as follows:
1. The current list of all active task/processes is
used to identify the core or hardware thread on
which a task/process is running (Fig. 20). Linux
uses here the term CPU instead of using core or
hardware thread.
2. A command is used to switch the information
displayed in the debugger to the required core or
hardware thread (Fig. 21).
Common breakpoints
The fact that an SMP operating system does not
assign application processes to a core or hardware
thread until runtime also has consequences for the
setting of on-chip breakpoints.
A simple example: The “sieve” process is to be
stopped as soon as it writes to the variable “xyz”.
In order for the debugger to be able to implement
this request, it must program the break logic of all
cores or hardware threads for this break condi-
tion since it cannot know beforehand the core or
hardware thread on which the “sieve” application
process will run. This means that even if each core
or hardware thread has its own break logic, the
debugger programs the breakpoints for the user
as if there were only one break logic shared by all.
When setting of software breakpoints, for the im-
plementation of which the original instruction in
memory is temporarily overwritten by a break in-
struction, there are no changes compared to AMP
systems. Operating systems protect the address
spaces of processes from each other. However, if
the same application process is started more than
once, Linux (for example) loads the program code
only once. Each instance of the application process
thus sees the same program memory as well as the
software breakpoints set there. To make sure that
the program execution is stopped only in the de-
sired application process, the TRACE32 debugger
enables the setting of process-specifi c software
breakpoints.
SummaryThe systematic extension of the TRACE32 concept
enables Lauterbach to offer its customers simple
debugging of embedded designs that use an SMP
operating system for controlling several cores or
hardware threads. To be able to use this new con-
cept for debugging SMP operating systems, you
just need a TRACE32 debugger whose debug
cable has not only a license for the processor
architecture but also a second license such as a
multi-core license.
Following the support for the MIPS 34K, the de-
bugging of SMP systems for ARM and PowerPC
architectures is also planned for early 2008.
Fig. 20: The TASK.DTASK window, showing the core or hardware thread to which SMP Linux has assigned a task/process
Fig. 21: The TRACE32 window, which always shows only the context of a core or hardware thread. The number of the core or hardware thread is shown in the status line.

www.lauterbach.com16
PowerDebug
Power-Integrator
PowerView
PowerProbe
PowerTrace
NEWS 2008DEBUGGER, REAL-TIME TRACE, LOGIC ANALYZER
Further RTOS innovationsWindows CE 6.0 for ARM and SH4TRACE32 now also supports Windows Embed-ded CE 6.0 for ARM and SH4 architecture.Since the end of 2006, developers have been able
to use the new version of Windows CE for their
projects. Version 6.0 introduced some fundamen-
tal changes in the kernel architecture. For exam-
ple, Windows CE now supports process address
spaces of 2 GB. For Version 5.0, these were limited
to 32 MB.
Since late 2007, an updated version of TRACE32 Windows CE Awareness has been available, so that
a TRACE32 debugger can now be used to monitor
and test all processes, threads and libraries simul-
taneously. In combination with a real-time trace
tool, a runtime analysis of Windows CE threads is
also possible. The confi guration of Windows CE Awareness has been simplifi ed:
• The debugger now supports automatic detec-
tion of the kernel objects. This means that the
symbol information for the kernel no longer has
to be loaded explicitly.
• The Windows CE Autoloader of the debugger
simplifi es symbol management for the different
processes and libraries. If the autoloader is con-
fi gured accordingly (sYmbol.AutoLOAD.CHECK-WINCE), the matching symbol information is auto-
matically loaded to the debugger when needed.
Integration in the Windows CE Platform BuilderSince the beginning of 2007, Lauterbach debug-gers can be used as hardware debug back end for the Windows CE Platform Builder.To debug the kernel and application processes in
Windows CE, Lauterbach offers an eXDI2 driver
that permits control of a Lauterbach debugger
through the internal debugger of the Windows CE Platform Builder.
By means of target device connectivity, the
TRACE32 eXDI2 driver is fi rst integrated into the
platform builder (PB). As a result of this integration,
all debug commands of the PB debugger are now
translated into TRACE32 commands in the back-
ground and passed to the Lauterbach debugger.
The eXDI2 driver is available for Windows CE 5.0
and 6.0 as well as for Windows Mobile Versions 5
and 6.
Extensions• Linux – Support for Xenomai Threads
• Linux – Symbol Autoloader
• OSE – Support for 5.2 Load Modules
• PXROS – Redesign for C167
DSP/BIOS for TMS320C28xx Available
eCOS for MIPS Available
FreeRTOS for ARM
and MicroBlaze
Available
HI7000 for SH4 Available
Linux for ARC and MicroBlaze Planned
LynxOS-SE for PowerPC Planned
NetBSD for ARM and PowerPC Available
OS/9 for ARM and PowerPC Available
RX4000 for MIPS Available
ThreadX for ARC and Blackfi n Available
ThreadX for Xtensa Planned
Windows CE 6.0 for ARM
and SH4
Available
μClinux for Blackfi n Planned
μClinux for MicroBlaze Available
μC/OS-II for V850 Available
μC/OS-II for Xtensa Planned
New supported RTOS

www.lauterbach.com 17
DEBUGGER, REAL-TIME TRACE, LOGIC ANALYZER
NEWS 2008
PowerView
PowerDebug
PowerProbe
PowerTrace
Power-Integrator
New preprocessors /NEXUS adapters
Many SoCs (system on-chip designs) now have a
trace port that makes runtime information visible
off-chip. Such information can be the instructions
executed by the program as well as data transfers.
If an operating system is used, output of the cur-
rent task ID can be helpful. The best-known trace
ports are certainly ETM for the ARM architectures
and NEXUS for the PowerPC architecture.
To record runtime information Lauterbach offers
TRACE32-PowerTrace, a real-time trace tool. At
the hardware level an architecture-specifi c prepro-
cessor or NEXUS adapter receives the data from
the trace port and transfers it to the trace memory
(up to 4 GB) of the PowerTrace hardware. This
recorded information serves the user as the basis
for effi cient troubleshooting as well as for compre-
hensive runtime analyses of his design.
Lauterbach is now offering preprocessors and
NEXUS adapters for more than 30 processor archi-
tectures. Many more will be supported in 2008.
New NEXUS adapter for MPC5500 architectureFrom March 2008, the NEXUS adapter for the
MPC5500 architecture will be available in an im-
proved version using an advanced technology.
To respond fl exibly and quickly to new variants of
the NEXUS port, this adapter supports a port width
of up to 16-bit MDO and a voltage range of 1.0 V
to 5.0 V.
Lauterbach offers converters to adapt to the spe-
cifi c processors´ NEXUS port.
To guarantee optimum sampling of trace signals at
high trace port data rates, the new NEXUS adapter
also contains FPGAs for the automatic setting
of the optimum sampling instant (AUTOFOCUS
technology).
New AUTOFOCUS II preprocessorsTo enable preprocessors to handle trace port
frequencies of over 500 MHz, the AUTOFOCUS II technology was developed in 2006. The most im-
portant feature of this technology is the automatic
setting of the optimum sampling instant for trace
data. Based on this technology, further prepro-
cessors are now offered for a series of DSPs.
MicroBlazeSince November 2007, a preprocessor for the
MicroBlaze architecture has also been available.
Using a 22-pin wide trace port, the MicroBlaze Trace Core makes program fl ow as well as (op-
tionally) the data fl ow visible off-chip. Trace port
frequencies of over 100 MHz can now be handled
by the preprocessor.
TRACE32-PowerTrace
CPU specific debug cable &CPU specific preprocessor
CPU specific NEXUS adapter
Program flow
Data flow
Task ID
Trac
e p
ort • NEXUS port width up to 16-bit MDO,
2-bit MSEO, EVTI, EVTO
• Data rate up to 200 MBit/s
• 200 MHz at SDR or 100 MHz at DDR
• Voltage range 1.0 V to 5.0 V
• Adapter for different variants of the
NEXUS port
• AUTOFOCUS technology
NEXUS adapter MPC5500 AF
New AUTOFOCUS IIpreprocessors
Preprocessor for Ceva-X Q1/2008
Preprocessor for StarCore Q3/2008
Preprocessor for TMS320C55x
and TMS320C64x
Q1/2008

www.lauterbach.com18
PowerDebug
Power-Integrator
PowerView
PowerProbe
PowerTrace
NEWS 2008DEBUGGER, REAL-TIME TRACE, LOGIC ANALYZER
CombiProbeFor fast output of important system informa-tion at runtime, some cores now have simple trace ports. These ports enable an application program to make user-defi ned data visible off-chip. For recording and processing this data, Lauterbach offers a new tool option called CombiProbe. Here we describe the hardware and operation of this new product.
InstrumentationMost developers are familiar with test scenarios for
which a simple printf() is the most effi cient imple-
mentation. Typical examples are output of diag-
nostic information or logging of important system
events, i.e., test scenarios where the application is
already working as intended, and now operational
tests have to be conducted. Usually, code instru-
mentation is used for these tests.
Two steps are necessary to make important system
information visible with instrumentation at program
runtime:
1. Instructions are inserted in the application pro-
gram to provide the necessary information.
2. A way has to be found to make this information
visible. An external communication interface
such as RS-232 or Ethernet is usually used for
this.
The great advantage of instrumentation is that only
the information of interest to the tester is made
visible. At the same time, however, large communi-
cation overhead is created since, as a rule, a further
communication interface has to be operated by the
operating system. If the interface is slow, consi-
derable runtime problems can result for the actual
application.
System TraceThe communication overhead created during in-
strumentation can be largely reduced if the core of-
fers a separate trace port for the output of system
information generated by the application program.
As an IP provider, ARM offers such a solution as
part of its CoreSight technology.
The CoreSight Instrumentation Trace Macrocell (ITM) basically works as follows:
1. The application program writes the information
that has to be made visible to a 32-bit memory
mapped register as-
signed to the ITM.
2. The ITM makes the in-
formation visible either
directly over the Serial Wire Output (see Fig. 22)
or together with other
trace data over the Co-reSight Trace Port Inter-face Unit (TPIU).
Many mobile phone manu-
facturers are already wor-
king with similar propri-
etary solutions for their
chips. However, to save money, they are interested
in a uniform standard for such a trace port. In May
2007 the “Test and Debug” workgroup of the MIPI
Alliance specifi ed, under the name “System Trace”,
a standard for a 4-bit trace port as well as a 34-pin
debug and trace connector.
Along with the standard-
ization, the functionality
of the trace port was
extended. Apart from
the system information
generated by the ap-
plication program, the
System Trace can now
output hardware infor-
mation too (see Fig. 23).
A programmable bus
watcher, e.g., can de-
tect and display specifi c
bus cycles, or a signal
monitor can return the
status of selected chip-
internal signals.
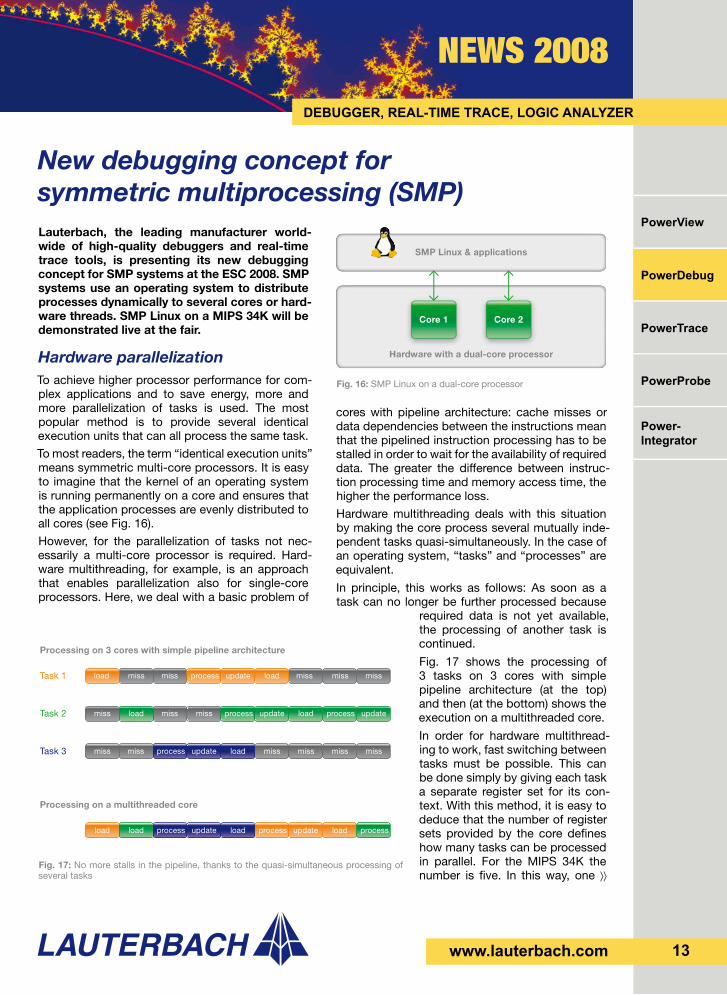
CombiProbe hardwareAs a “Test and Debug” workgroup member,
Lauterbach took an active part in the System Trace specifi cation and at the same time in the
development of a suitable debug and trace op-
tion named “CombiProbe”. Since October 2007,
Lauterbach has been marketing this new product.
CombiProbe is a combination of a special debug
cable and 128-MB of trace memory. It can, for ex-
ample, be plugged into the universal Lauterbach ⟩⟩
Fig. 22: CoreSight Instru-mentation Trace over Serial Wire Output
InstrumentationTrace
Macrocell
32-bit register
Software data
Serial Wire Output(asynchronous)
Fig. 23: System Trace specifi ed by MIPI Alliance
Arbiter
Hardware data
System Trace Port(4-bit data & 1 clock)
Software data
SystemTrace
Module
base hardware such as the POWER DEBUG
INTERFACE / USB 2 (see Fig. 24). As target system
connection, the 34-pin debug and trace plug from
the MIPI Standard is used, comprising connec-
tors for a JTAG port and a 4-bit System Trace Port. Lauterbach offers also adapters for other target
system connectors.
Operating conceptAdditionally to the traditional debug functions
CombiProbe provides new confi guration com-
mands as well as commands for displaying and
analyzing recorded trace information.
Confi guration commands are:
• ITM.<subcommand> for confi guring the Instru-mentation Trace Macrocell of CoreSight tech-
nology (see Fig. 25)
• STM.<subcommand> for confi guring a System Trace Module
• SystemTrace.<subcommand> for confi guring
the CombiProbe
The SystemTrace command is also used to analyze
and process recorded trace data.
System information visible at the trace port can
be recorded as usual into the trace memory of the
CombiProbe and analyzed using TRACE32 com-
mands. An intuitive analysis of system information
is supported by formatting the raw trace data ac-
cording to application with the help of the so-called
TRACE32 Protocol API.
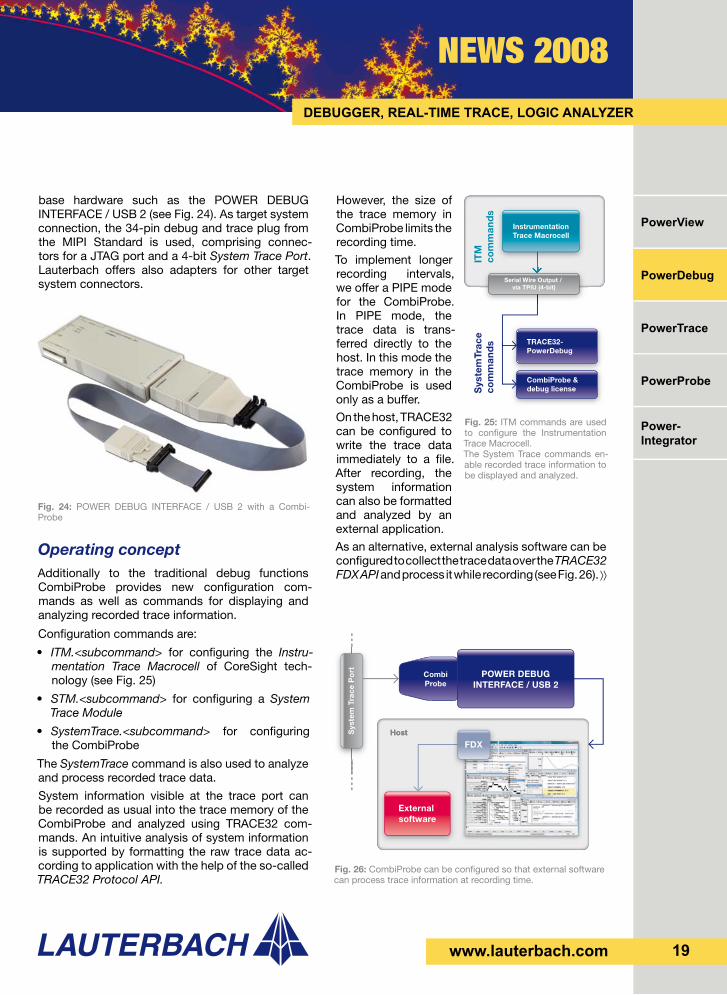
However, the size of
the trace memory in
CombiProbe limits the
recording time.
To implement longer
recording intervals,
we offer a PIPE mode
for the CombiProbe.
In PIPE mode, the
trace data is trans-
ferred directly to the
host. In this mode the
trace memory in the
CombiProbe is used
only as a buffer.
On the host, TRACE32
can be confi gured to
write the trace data
immediately to a fi le.
After recording, the
system information
can also be formatted
and analyzed by an
external application.
As an alternative, external analysis software can be
confi gured to collect the trace data over the TRACE32 FDX API and process it while recording (see Fig. 26). ⟩⟩
Fig. 26: CombiProbe can be confi gured so that external software can process trace information at recording time.
External software
Sys
tem
Tra
ce P
ort POWER DEBUG
INTERFACE / USB 2CombiProbe
HostHost
FDX
www.lauterbach.com 19
DEBUGGER, REAL-TIME TRACE, LOGIC ANALYZER
NEWS 2008
PowerView
PowerDebug
PowerProbe
PowerTrace
Power-Integrator
Fig. 24: POWER DEBUG INTERFACE / USB 2 with a Combi-Probe
Fig. 25: ITM commands are used to confi gure the Instrumentation Trace Macrocell.The System Trace commands en-able recorded trace information to be displayed and analyzed.
TRACE32-PowerDebug
InstrumentationTrace Macrocell
ITM
com
man
ds
Sys
tem
Trac
e co
mm
and
s
CombiProbe & debug license
Serial Wire Output / via TPIU (4-bit)

If you would like us to remove your name from our mailing list or receive additional information,send an e-mail to:
Please inform us:
www.lauterbach.com20
PowerDebug
Power-Integrator
PowerView
PowerProbe
PowerTrace
NEWS 2008DEBUGGER, REAL-TIME TRACE, LOGIC ANALYZER
SummaryThe CombiProbe is a new tool option for recording
runtime information in the broad Lauterbach pro-
duct range. For complex test cases, CombiProbe
can also be used in conjunction with TRACE32-
PowerTrace. Since all Lauterbach tools share a
common time base, important system information
can be placed in a direct chronological context with
the program/data fl ow of the core.
3G / DigRF reportFrom the summer of 2007, Lauterbach has of-fered a new set of probes for PowerIntegrator, which allow the recording of data traffi c from a 3G / DigRF interface.The following sampling rates are used for recording:
• 2 GigaSample /s for the RX / TX lines
• 250 MegaSample /s for the SysClkEnable line
A recording duration between 25.156 ms at full load
and up to several hours is possible, depending on
the data traffi c on the lines. The high sensitivity
of the probes and the very low load of the input
signals guarantee error-free recording.
The measured data can be evaluated and analyzed
at protocol level as well as time-correlated with the
program fl ow.
• Debug cable and 128-MB of trace memory
• JTAG support for ARM cores
- Standard JTAG
- Serial Wire Debug Port from ARM
- cJTAG (IEEE P1149.7), planned
• Standard JTAG possible for other processor
architectures
• Trace port support for
- MIPI System Trace
- ITM over Serial Wire Output
- ITM over 4-bit CoreSight TPIU
- 4-Bit ETMv3 in continuous mode,
planned
• Bandwidth of 200 MBit /s per trace channel
with up to 4 trace channels
• Voltage range 0.3 V to 3.3 V,
5 V tolerant
• 34-pin half-size connector to target hardware
• Adapters also for 10- and 20-pin half-size
connector
CombiProbe data