Developing a Global Digital Accessibility Policy: What’s Going On Around the World?

Click to start
What’s around the curve? 5 ways a process signature reveals insights from your production line

2 What’s around the curve? 5 ways a process signature reveals insights from your production line | e-book
Winning the Industry 4.0 quality race starts with a single station
Whether you call it Industry 4.0, the Industrial Internet of Things or smart manufacturing, the underlying theme today is that making more effective use of data is key for manufacturers to remain profitable and competitive.
This begins with the operators and engineers for whom the priority is to keep the line running. How can Industry 4.0 help them do this while achieving the seemingly disparate goals of cost reduction and quality improvement?
To find the answer, we have to look at the parts in production. They have their own story to tell, found in the data generated by each process and test that touches the part as it moves down the line. Understanding this story is key to making parts, not just right, but better, and raising a red flag before quality takes a hit. With part production data, manufacturers can elevate the efficiency and profitability of their operations beyond what is possible with MES and SPC alone.
The starting point is in-process testing (IPT) using digital process signature analysis. Instead of just collecting scalars, the full digital process signature of each cycle of each process or test (also called a waveform or trace) is collected at the station level.

3 What’s around the curve? 5 ways a process signature reveals insights from your production line | e-book
Why is it called a signature?
Because each combination of a part and a process is unique. With any controlled process – press fitting, leak testing, welding, liquid dispensing and so on – the signature is repeatable and consistent when parts meet specification. A signature that does not match indicates a flawed process and a defective part.
With a signature, a much more reliable and insightful pass/fail determination can be made. This is just the beginning.
Signatures can be collected into a birth history record, correlated by part serial number with all the other production data that is relevant to that part, for easy retrieval and analysis. This eliminates data silos across the plant and allows data to be organized in a way that mimics the production process, to create a digital thread or digital twin and make the “Batch of One” easier to achieve than ever before.
This provides manufacturers with a powerful tool to drive continuous improvement and quality gains, while delivering the traceability their customers and partners expect.
Keep reading to learn the basics of digital process signature analysis, the story it can tell and the benefits it can deliver to manufacturers.
4 What’s around the curve? 5 ways a process signature reveals insights from your production line | e-book
This provides unparalleled insight at the station level, in production real-time, for each cycle of a process or test. Think of it as a video instant replay, versus the handful of snapshots provided by scalars.
This delivers:
• Greater accuracy: Signatures deliver hundreds or thousands of data points per process cycle that can be analyzed to arrive at a pass/fail decision, versus scalars that capture only a few isolated points in time during the cycle. This makes it possible to quickly trace the root cause of existing problems or spot the anomalies that point to new ones before quality suffers.
• Better visibility: This “video instant replay” provides your team with the data-driven insight for continuous improvement of processes, to reduce scrap and rework rates and boost first-time yield.
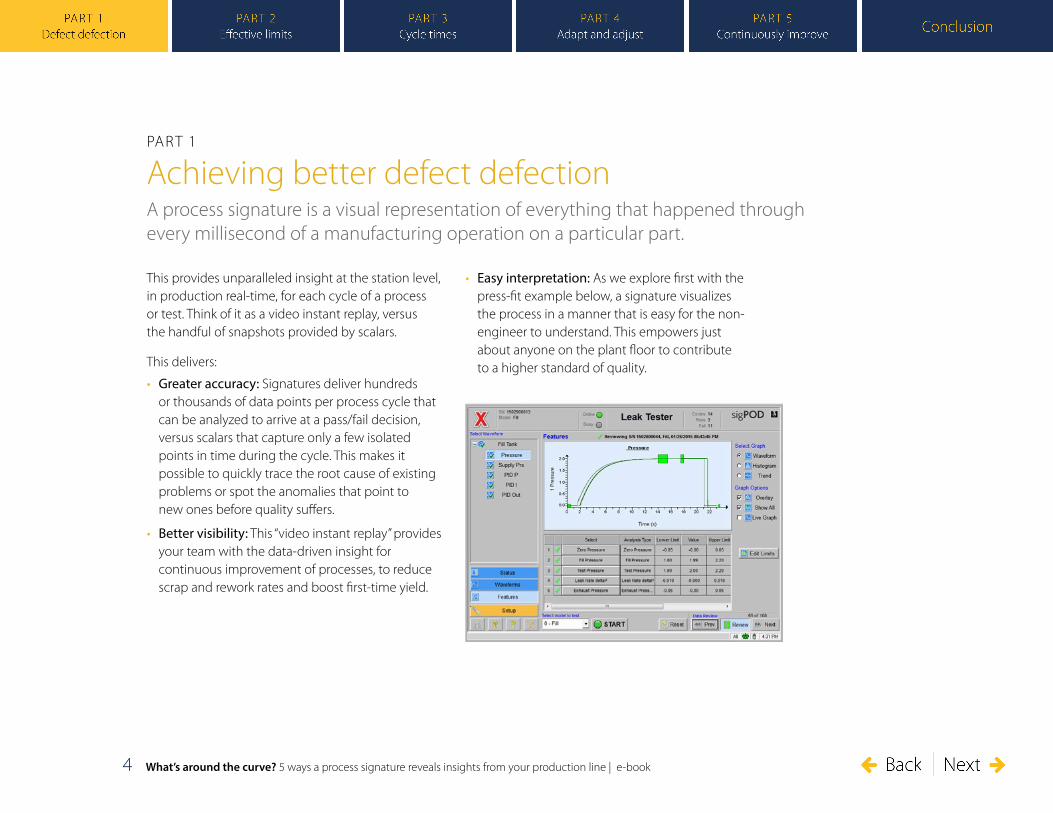
• Easy interpretation: As we explore first with the press-fit example below, a signature visualizes the process in a manner that is easy for the non-engineer to understand. This empowers just about anyone on the plant floor to contribute to a higher standard of quality.
PART 1
Achieving better defect defection
A process signature is a visual representation of everything that happened through every millisecond of a manufacturing operation on a particular part.

5 What’s around the curve? 5 ways a process signature reveals insights from your production line | e-book
Consider signature analysis a forensic investigation fueled by hard facts that eliminates the traditional reliance on educated guesses based on a visual inspection. Hundreds or thousands of signatures from the same process or test can be visualized as a histogram to spot trends and patterns. If quality problems are identified in finished products, the team can quickly identify a few possible causes.
This station-level insight also provides advance warning of impending performance problems. Small anomalies can indicate initial issues with alignment, calibration, tool wear and so forth that will worsen over time. Action can be taken before a quality spill is apparent.
The right tool for the jobAcquiring this capability requires an investment to equip a process or test station with the means to collect, analyze and visualize digital process signatures. This investment does not have to be costly or complex.
Sciemetric’s sigPOD, for example, is a cost-effective and intelligent process monitoring system with advanced signature analysis and process signature verification capability. It can be up and running on a production station in 60 minutes. sigPOD can be deployed across the production line on virtually any manufacturing process, including crimp, dispense, force-distance monitoring, torque, noise and vibration, gauge and profile, weld and more.

6 What’s around the curve? 5 ways a process signature reveals insights from your production line | e-book
The complex story of a simple press-fit operationTake a press-fit operation – one part is pushed into another. It doesn’t really matter what is being manufactured. The basic premise is the same, and how the operation can go wrong is generally the same. Parts could be misaligned with the press. The part to be inserted could be the wrong shape, size or type. The cavity into which it will be inserted may not have been bored or otherwise prepared properly. The press machine may be in need of maintenance, as reflected by the max force it can apply or how long it takes to apply it.
All these quality/performance issues are illustrated by the signature of each process cycle. A signature can easily track force vs. time, distance vs. time, and force vs. distance, to reveal if a process cycle is falling outside the established norm.
From Figure 1, you can see there is a small spike in pressure as the parts align and then a constant slope as the parts are pressed together. The area under the curve represents the energy or work applied to the pin. The shape of the curve reveals the quality of the press-fit operation.
Now look at Figure 2, where we see spikes in force that indicate “rocking of the pin” during the press operation.
For whatever reason, the part being press-fitted, the “pin,” is not inserting with proper alignment. Depending on the cause, this may be a sporadic problem, or a chronic one that is worsening with consecutive process cycles. Whatever the cause and its frequency, each time it happens, the anomaly shows up in the signature. This gives operators and quality engineers the forensic data they need to triage the scope of the problem and trace its root cause.
Figure 2: Example failure mode with a press operation and resulting force – distance signature
Figure 1: Typical stages of a press operation and the resulting force – distance signature

7 What’s around the curve? 5 ways a process signature reveals insights from your production line | e-book
Optimizing limits on a test eliminates false failures and reduces the risk of giving bad parts a passing grade. On process stations, it ensures parts will meet spec and the process will be completed within acceptable parameters, to prevent a failure down the road that could lead to warranty claims and recalls.
With signature analysis, setting limits is no longer a matter of guesswork.
sigPOD features in-station SPC that uses production statistics, including all the data in the process signatures, to calculate optimal test limits. The information is graphically presented, and the user can see the results of proposed limit changes before deploying them. Limits can therefore be set more accurately and quickly. sigPOD also features an auto-learn capability that can propose optimal, statistically derived limits.
Additional tools can pull together signature data from test systems for more sophisticated analysis. Sciemetric’s QualityWorX data management software allows you to simultaneously analyze an historic collection of signatures (along with any other relevant production data), to define stable limits without false rejects. A range of tests can be run on the same stored data rather than running
additional parts through the process to validate parameters. This saves both the time and expense of running parts and allows for rapid test development.
Figure 3 shows an example production trend where the original limit caught two failures in the dataset. What if the limit where lowered? You can see in the trend on the right that the optimized limits would have identified eight statistical outliers which are suspect parts. This is an example of how accumulating data combined with greater experience with a process can lead to tightened parameters, with very little time or effort. This in turn improves the performance of quality tests.
PART 2
Setting more effective limits The optimal function of process and test stations on the line rests with determining the right limits.
Figure 3 - Red lines indicate current test limits. Dotted blue lines indicate the calculated control limits (+/- 3 sigma) for the feature and show that the test limits can be tightened without an impact to quality.

8 What’s around the curve? 5 ways a process signature reveals insights from your production line | e-book
PART 3
Optimizing test cycle timesThe rate at which a certain test can be performed may limit the pace of the production line. The challenge is to maintain quality standards while optimizing cycle time as much as possible.
That full replay provided by a process signature (versus scalar data’s handful of snapshots) provides an effective means to quickly and easily see how a test cycle can be shortened and with what effect.
Figure 4 is an overlay of a series of breakaway torque test signatures which show how much torque is required to start the rotation of the part. Once in rotation, the torque falls off as running torque takes over. Running torque is not an important part of this test. What is important is that breakaway torque completes with a characteristically fast rise time and that peak torque is not too high.
One curve shows a unit with much higher breakaway torque than the rest (the red line). It may be missing lubrication or have the wrong bearings installed. Several other signatures have the wrong shape but achieve the same running torque as good units. They are likely missing components.
The important thing to notice is that the test takes over twice as long as necessary to find defective parts. All normal signatures, along with many of the outliers, have achieved breakaway before the time
indicated by the green box. At this point, enough of the signature is captured to differentiate good vs. bad parts.
This is a real-world example, not a hypothetical one. By adding a new test and terminating the cycle based upon its result, one manufacturer increased the number of parts that could be tested per hour for a substantial increase in the production line’s monthly output and no loss in quality.
Optimizing the test to achieve this result took only minutes.
Figure 4 – Waveform trend overlay of multiple torque tests
9 What’s around the curve? 5 ways a process signature reveals insights from your production line | e-book
PART 4
Adapt and adjust, quicklyImproved defect detection, more effective limits and optimized test cycles – the utility of a process signature to improve the function of each station on the line is unparalleled.
But it doesn’t end there. Process signatures have a crucial role to play for optimizing the whole line, the entire factory and even accelerating startup of new lines and factories.
Adapting for variabilityFor example, many manufacturers produce variants of the same part or model on the same line. Stations on the line must periodically switch over to produce a different model. This may require changes in limits, cycle times, tooling, etc. All this raises the risk of production and quality issues. Calibration and verification can be a time-consuming process.
Process signature analysis can be used to substantially accelerate calibration and verification, to reduce down-time and maintain quality.
Predict maintenance needs before they show up as a defectSmall but apparent changes in the typical signature for a process can be an early warning sign of impending quality defects.
Take this example from a plant producing engine parts for several automotive OEMs. At one station, a horizontal boring machine rough cuts a body part for an oil pump. The cuts are performed by tooling inserts that need to be replaced after every 200 cycles. Inserts, however, can chip or wear in fewer than 200 cycles and cause defects in the parts, resulting in a surge in the scrap rate. The flawed process manifests as edges on the outside diameter of the oil pump body and uneven face depths when the tool hits a cavity on the face of the part.

10 What’s around the curve? 5 ways a process signature reveals insights from your production line | e-book
Figures 5 and 6 are examples of where increased noise and vibration will indicate a wearing or damaged insert in need of replacement. But this station is automated – there is often not an operator present to hear that noise and vibration. Even if there were, relying on the attentiveness of an operator introduces a high degree of subjectivity and risk of human error.
A sigPOD unit with digital sensors and an accelerometer was connected to the station to capture and analyze process signatures. This established clear limits and a baseline profile of an optimal process that made the indicators of a worn or chipped insert easy to spot.
Figure 7 shows a frequency vibration analysis for this process station, in which vibration is converted to a frequency waveform. The flatter the line, the cleaner the cut. But as the tooling inserts get dull, more force is required to make the cut and vibration increases. This is exhibited by the more and higher peaks (the red lines) in specific frequency bands.
By collecting and visualizing relevant data, unexpected quality issues were eliminated, scrap rates were reduced, and maintenance requirements could be addressed proactively. This dramatically improved the optimal operation of the station.
Figure 5 and 6 – Example defects caused by worn machine tooling
Figure 7 – Vibration signature of machine tool cutting process

11 What’s around the curve? 5 ways a process signature reveals insights from your production line | e-book
Launch new machines or lines fasterOne manufacturer is now able to launch production lines at locations around the world in two to six weeks with signature analysis, versus six to 12 months before. Conservatively, this customer realizes an estimated savings of $4 million per plant on capital cost alone.
The typical challenge in getting lines into production is to foresee the major start-up problems and create run-off data reports that will be applicable when equipment moves from the integrator to the plant. Process signatures provide a detailed report of the process and its proof-of-production readiness. By using signature-based test data and analysis tools such as QualityWorX, engineers can develop test algorithms for specific defects to accurately set test limits for new stations and lines.
They can:
• Employ failure and defect Paretos to identify the top sources of failures
• Conduct “what if” experiments off-line to create tests that will catch defects
• Generate a runoff report if the station is built at an integrator or machine builder site so performance can be clearly shown at installation. This reduces the time and effort needed to dial-in the new machine
These engineers are also able to compare machine performance to that of existing lines, applying common metrics to ensure targets are met. With process signatures, it is easy to compare detailed data from before and after the start of full production.

12 What’s around the curve? 5 ways a process signature reveals insights from your production line | e-book
PART 5
Continuously improve the entire production lineA newly discovered defect disrupts the line. Until the root cause is discovered, an unappealing choice must be made between shutting down the line or risking flawed product reaching customers.
While the original test set may appear sufficient to eliminate bad parts, new faults may emerge, passing the in-process test undetected. This raises two problematic questions: What is the root cause of the flaw? How can it be reliably detected?
Process signatures provide the key to rapid troubleshooting. Root cause can be discovered in a matter of hours (or even less), compared to days or weeks with the trial-and-error approach that is required with scalar data alone.
This is possible with more extensive data analytics using platforms such as Sciemetric’s QualityWorX or Sciemetric Studio. These software tools can ingest all the available data from sigPOD and other sources in the plant to quickly trace root cause. Here are a couple of examples.
A sticky problem with throttlesA manufacturer of electronic throttles experienced a high rate of failure during end-of-line testing, despite parts passing quality checks at every upstream station. The failure rate affected almost 200 engines, which represented significant repair costs.
Analyzing the signatures captured by a sigPOD during upstream vacuum testing revealed that only total failures (2 in Figure 8) were being caught.
Because only start and stop pressures were used to determine pass/fail in the test (shown by arrows), some defective throttles were still passing the test (3). These subtle failures were resulting in high repair costs at the end of the line.
Figure 8 – Waveform trend analysis of throttle vacuum tests
2
1
2
33

13 What’s around the curve? 5 ways a process signature reveals insights from your production line | e-book
The manufacturer determined that 77% of these subtle failures were due to stuck or sluggish throttles and the remaining 23% were false rejects. Engineers were able to take immediate action: test algorithms and limits on upstream test stations were adjusted accordingly to reduce the number of false rejects. Manufacturing process changes were also undertaken to reduce the number of stuck or sluggish throttles from being produced.
In the end, the failure rate was reduced to 0.07%, or 10 engines a month. With only minor changes, the manufacturer was able to produce an additional 170 engines per month.
The ability to overlay current and/or historical process signatures to quickly see if there were any anomalies allowed the manufacturer to swiftly address the problem. Without signatures, it would have taken a great deal of time to recognize the need to add parameters to what had been considered a fairly reliable and simple test.
An unexpected consequence of heavy metal Another manufacturer experienced an elevated rejection rate after substituting lead-based bearings for non-lead bearings. No one had thought that the change in material would have any impact on the in-station test.
By combining data collected by sigPOD and aggregating it with historical data in QualityWorX, as shown in Figure 9, it soon became apparent that the characteristic signature had changed when the change in material occurred. The amplitude is greater, some of the characteristic resonances have changed and failures appear quite differently. The test was adjusted to accommodate the change in a matter of hours.
Figure 9 – Waveform trend analysis of torque test, with old and new bearing sets
14 What’s around the curve? 5 ways a process signature reveals insights from your production line | e-book
Conclusion: Telling the story of part assembly with digital process signaturesIn the age of Industry 4.0, manufacturers today are more aware than ever of the value of data taken from the production line, for improving quality, yield and efficiency. When that data is captured in the form of a digital process signature, even greater insight is revealed.
Digital process signatures are a complete trail, depicting everything that happened to a part as it went through the assembly process. As a result, they provide a more thorough view of your processes and result in more accurate pass/fail.
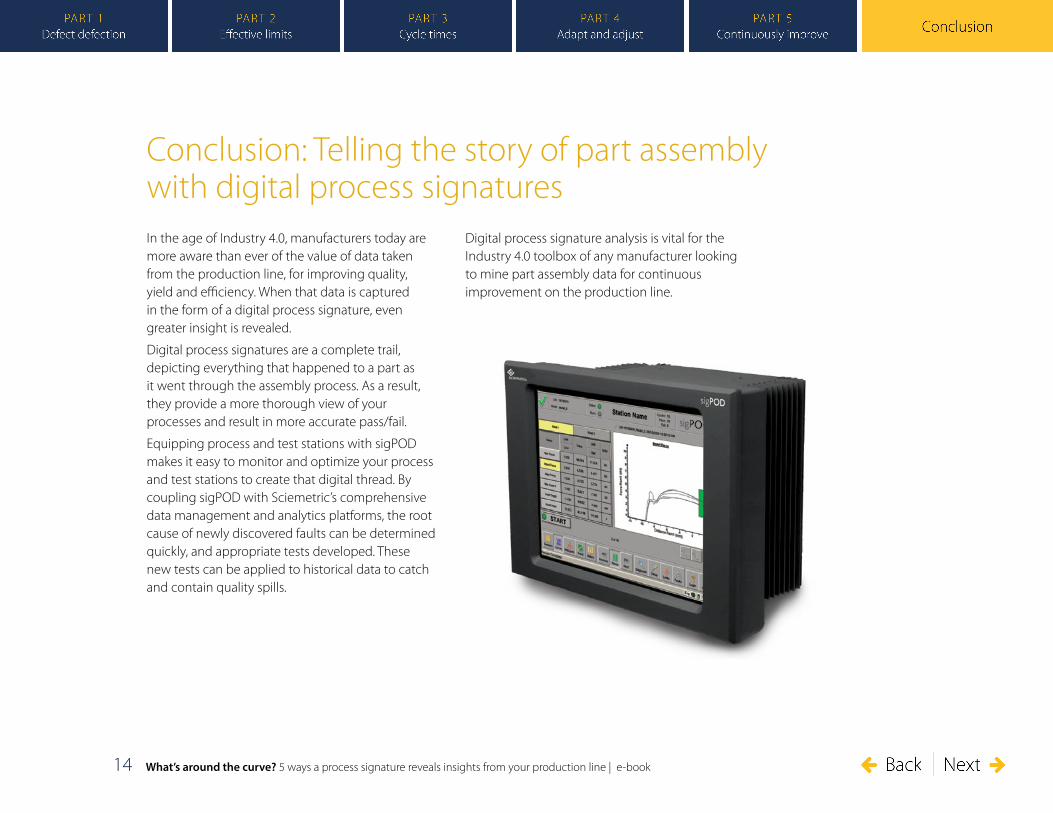
Equipping process and test stations with sigPOD makes it easy to monitor and optimize your process and test stations to create that digital thread. By coupling sigPOD with Sciemetric’s comprehensive data management and analytics platforms, the root cause of newly discovered faults can be determined quickly, and appropriate tests developed. These new tests can be applied to historical data to catch and contain quality spills.
Digital process signature analysis is vital for the Industry 4.0 toolbox of any manufacturer looking to mine part assembly data for continuous improvement on the production line.

© 2019 Sciemetric, sigPOD, QualityWorX and any related marks are trademarks or registered trademarks of Sciemetric Instruments Inc. All other trademarks are the property of their respective companies. All rights reserved. No part of this publication may be reproduced without the prior written permission of Sciemetric Instruments Inc. While every precaution has been taken in the preparation of this document, Sciemetric Instruments Inc. assumes no responsibility for errors or omissions. Neither is any liability assumed for damages resulting from the use of the information contained herein. Specifications subject to change without notice.
Sciemetric Instruments359 Terry Fox Drive, Suite 100, Ottawa, ON, Canada K2K 2E71.877.931.9200 | [email protected]
sciemetric.com
Contact us to learn more about the Sciemetric advantage.