What’s a Watershed Worth? - Rutgers...
75
Gerald J. Kauffman University of Delaware Rutgers College ‘81 What’s a Watershed Worth? June 13, 2014
Transcript of What’s a Watershed Worth? - Rutgers...

Gerald J. Kauffman University of Delaware
Rutgers College ‘81
What’s a Watershed Worth?
June 13, 2014

Rutgers 6 Princeton 4
Nov 6, 1869


Globe $33 trillion (Costanza et al. 1997)
$125 trillion (Costanza et al. 2014)
NWR System $27 billion (Ingraham and Foster 2008)
New Jersey $20 billion (Mates et al. 2007)
Delaware River $21 billion (Kauffman 2011)
Barnegat Bay $2.3 billion (Kauffman et al. 2012)

World $73 trillion
U.S. $16 trillion
Sweden $523 billion
New Jersey $508 billion
Norway $500 billion

1. Delaware 61,183
2. Alaska 61,156
3. North Dakota 55,250
4. Connecticut 54,925
5. Wyoming 54,305
6. Massachusetts 53,221 7. New York 53,067
8. New Jersey 49,430

1. Luxembourg $78,670
2. Quatar $98,814
3. Macau $77,607
4. Norway $54,947
5. Singapore $64,584
6. Kuwait $54,654
7. Brunei $53,431
8. U.S. $53,101
9. Hong Kong $52,722
10. New Jersey $49,430 49,430
11. Switzerland $46,430

State Supply Pop. Millions gpcd
1. VT 59
0.6 100
2. ME
130
1.3 100
3. ND 76
0.7 109
4. NH
141
1.3 109
5. WI
639
5.7 112
6. NC 1,082
9.5 114
7. DE
102
0.9 114
8. RI
126
1.1 115
9. MN
614
5.3 116
10. WV
222
1.9 117
11. NJ 1,037
8.8 118

Public Water Supply (2005) vs. GDP (2010)
y = 274.38x + 30053
R2 = 0.9409
-
500,000
1,000,000
1,500,000
2,000,000
2,500,000
0 2,000 4,000 6,000 8,000Water Use
GD
P (
$ m
illi
on
)

13,000 sq mi
8.2 million people
11th most populous state
Drinking water: 5% of U.S.
1st, 7th largest metro. economies
Del. (74% of pop.)
NJ (35% of pop.)
NY (55% of pop.)
Pa. (43% of pop.)
The Delaware River Basin

United States
President
Barack Obama
New York
Governor
Andrew Cuomo
Pennsylvania
Governor
Corbett
New Jersey
Governor
Chris Christie
Delaware
Governor
Jack Markell
Delaware River
Basin Commission
USDA
NRCS
USFS
Congress
25
Congressmen
8
SenatorsHomeland
Security
FEMA
Coast Guard
Interior
NPS
USFWS
USGS
EPA
Defense
USACOE
Commerce
NOAA
NWS
6 Countiies
New York City
35 Towns
17 Counties
Philadelphia
Allentown
125 Towns
Camden
Trenton
330 Towns
11 Counties
Wilmington
37 Towns
3 Counties
Del. Riverkeeper
Natural Lands Trust
Del. Estuary Program
Nature Conservancy
Sierra Club
WRADRB

Population Change
Delaware Basin, 2000-2010
80,155
843
94,752
3,708
313,485
492,942
0
100,000
200,000
300,000
400,000
500,000
600,000
Delaw
are
Mar
ylan
d
New
Jer
sey
New
Yor
k
Pen
nsylva
nia
Del. B
asin

1609


1961


Wastewater treatment 90% BOD removal: $95 M/year
463,000 acres of wetlands in Del. Estuary watershed
Treats 590 million lb waste/year (90% BOD removal)
Wetlands removal costs: $2.00/lb BOD/year
Wetlands replacement value: $1.18 billion/year

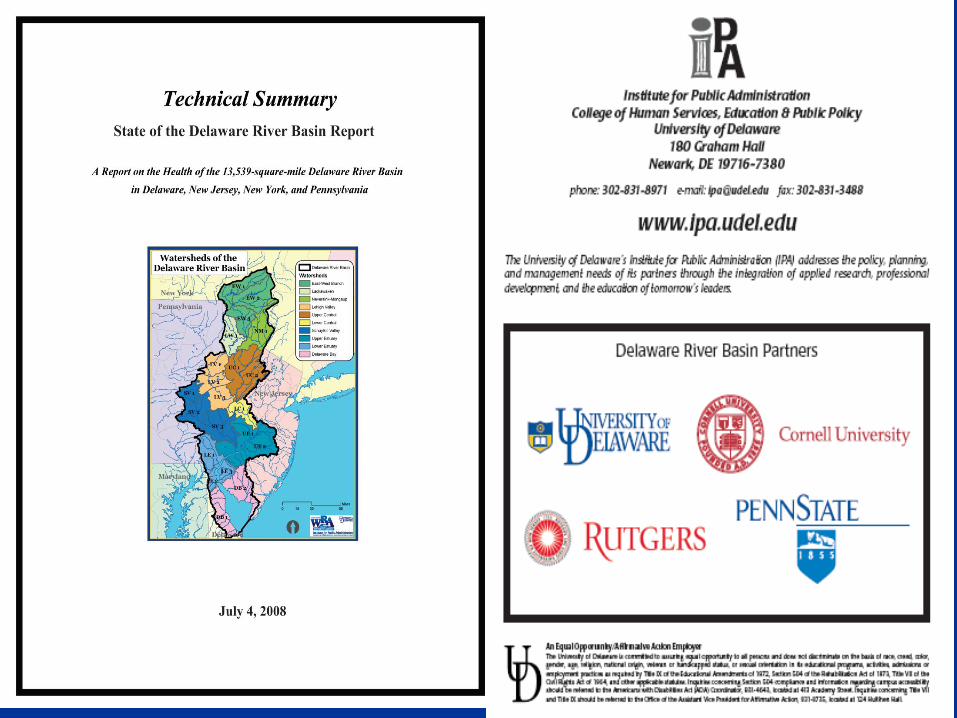
The Delaware River Basin
in Del., NJ, NY, and Pa. contributes:
1. $25 billion in annual economic value from recreation,
water quality, water supply, ecotourism, forest, agriculture, open space, and port benefits.
2. Ecosystem goods and services worth $21 billion per year, net present value (NPV) = $683 billion.
3. Over 600,000 jobs with $10 billion in wages.

$425
$1,220 $1,540
$1,830
$2,457 $2,621
$3,371
$3,818
$5,129
0
1,000
2,000
3,000
4,000
5,000
6,000
$ m
illi
on
Annual Economic BenefitsDelaware River Basin
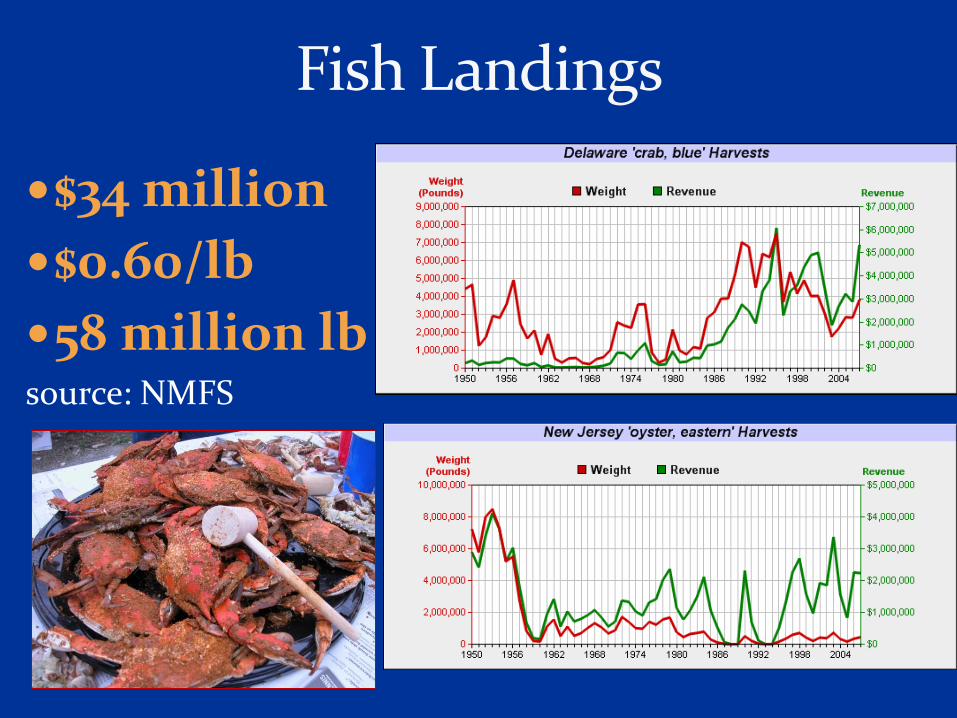
Fish Landings
$34 million
$0.60/lb
58 million lb source: NMFS

Skiing
$325 million 1,753 jobs 9 ski areas 1,005 acres 1 mgd 1.9 million ski visits source: PSAA 2010

Paddling
$362 million
4,226 jobs
Gear: $66 mil
Trips: $296 mil
620,860 paddlers
source: Outdoor Industry Assoc. 2006

Powerboating $395 million 232,000 registrations NY, Del., Pa., NJ
ranked 3rd, 7th, 17th, and 23rd in sales
source: National Marine Manufacturers Assoc. 2010
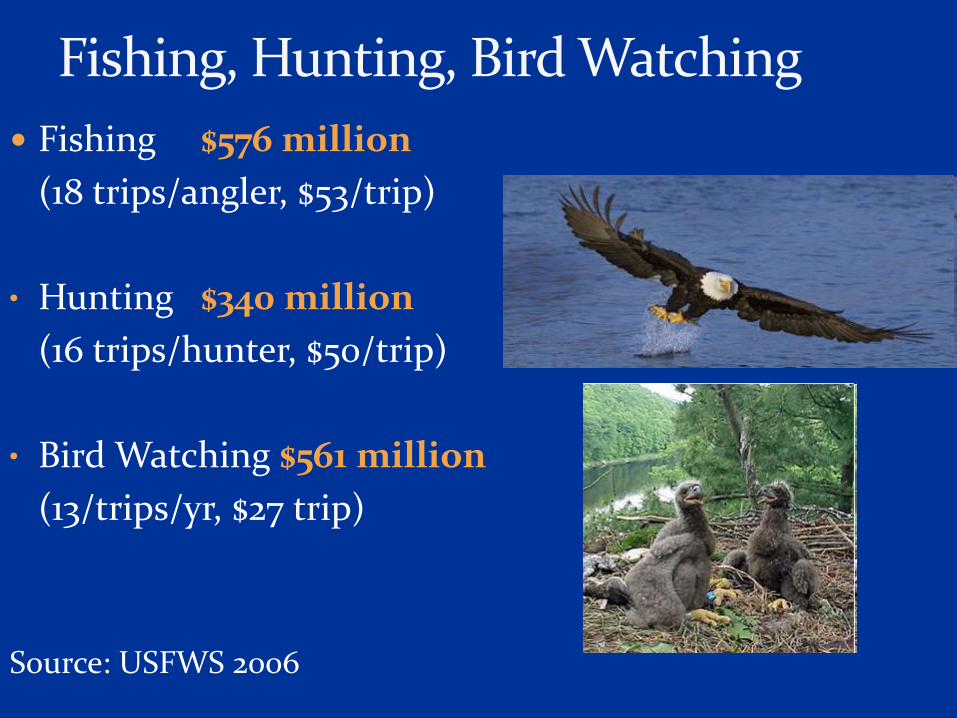
Fishing, Hunting, Bird Watching
Fishing $576 million
(18 trips/angler, $53/trip)
• Hunting $340 million
(16 trips/hunter, $50/trip)
• Bird Watching $561 million
(13/trips/yr, $27 trip)
Source: USFWS 2006

Shad Fishing
$6.5 million
63,000 trips
$102/trip
Pa. Fish & Boat Commission, 2011

Wild Trout Fishing
$29 million
350 jobs
(Maharaj, McGurrin, and Carpenter, 1998)
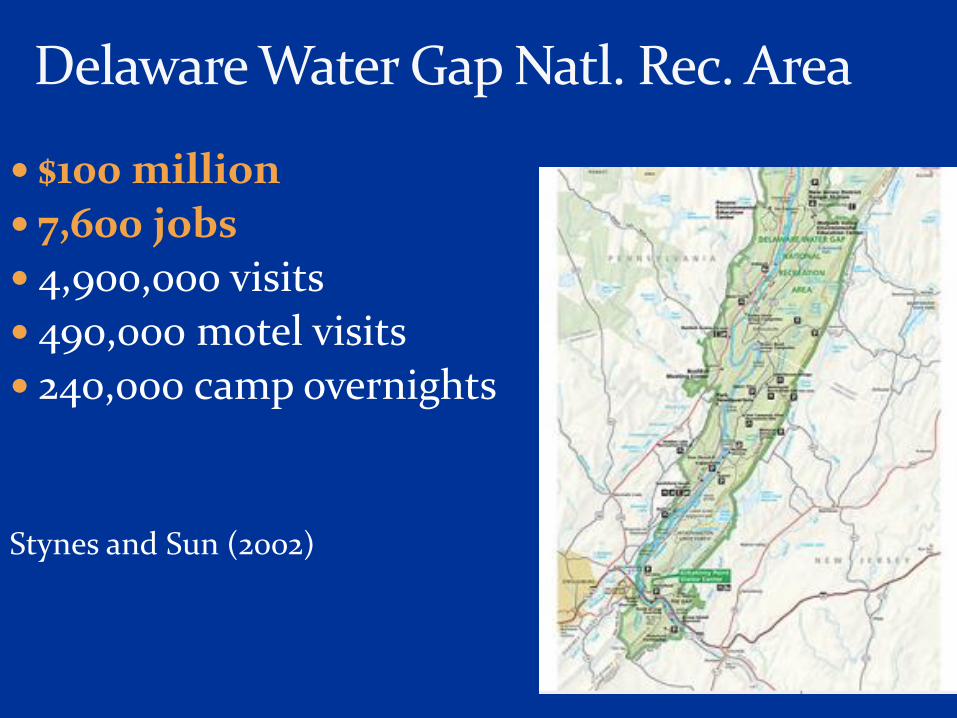
Delaware Water Gap Natl. Rec. Area
$100 million
7,600 jobs
4,900,000 visits
490,000 motel visits
240,000 camp overnights
Stynes and Sun (2002)
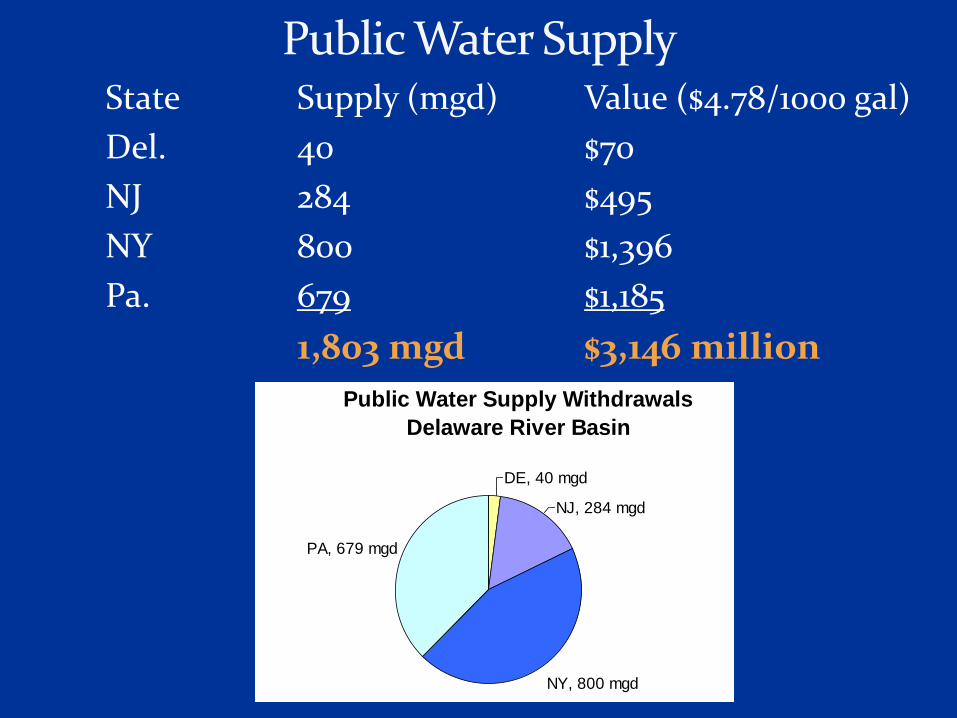
Public Water Supply State Supply (mgd) Value ($4.78/1000 gal)
Del. 40 $70
NJ 284 $495
NY 800 $1,396
Pa. 679 $1,185
1,803 mgd $3,146 million
Public Water Supply Withdrawals
Delaware River Basin
PA, 679 mgd
NY, 800 mgd
NJ, 284 mgd
DE, 40 mgd


Wetlands - $6.8 billion
Farms - $4.8 billion
Forests – $8.6 billion
Ecosystem Goods and Services
Ecosystem Services Value
Delaware River Basin
0
2
4
6
8
10
Del. NY NJ Pa.
$ b
illio
n/y
r

Natural Capital Value of Ecosystems
in the Delaware River Basin
$44 M $166 M $180 M $412 M$1,055 M
$4,823 M
$5,759 M
$8,591 M
0
2,000,000,000
4,000,000,000
6,000,000,000
8,000,000,000
10,000,000,000
Bea
ch/d
une
Mar
ine
Ope
n wat
er
Urb
an
Saltw
ater
wet
land
s
Farmland
Fresh
wat
er w
etland
s
Fores
t
$/y
r

Marine & Water-related Construction
Fishing & Aquaculture Ship/Boat Building Tourism/Recreation Marine Transportation Hunting/Fishing/Wildlife
Recreation-related Farming Water/Wastewater Utility Ports Watershed
Protection/Management
>600,000 jobs ($10 billion in wages)

0
100
200
300
400
500
600
0 1 2 3 4 5
Cap
ital an
d O
&M
Co
sts
($ m
illio
n)
Summer Average DO (mg/l)
Costs to Achieve DO Objectives (1975-1980)Delaware Estuary near Philadelphia
Max Cost Min Cost
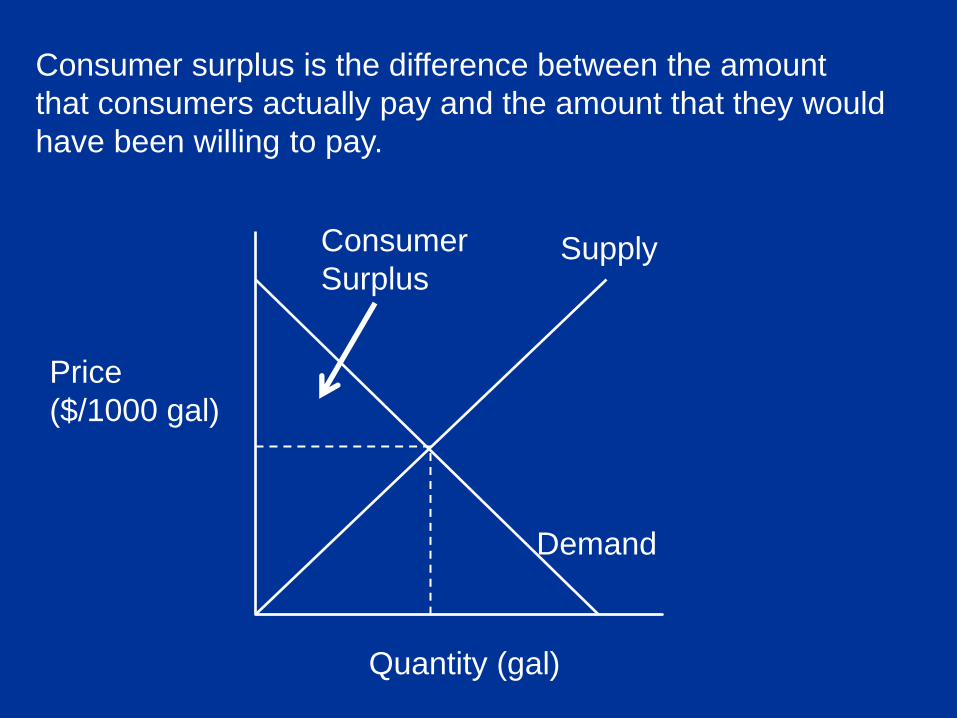
Consumer surplus is the difference between the amount
that consumers actually pay and the amount that they would
have been willing to pay.
Price
($/1000 gal)
Quantity (gal)
Demand
Supply Consumer
Surplus


$
D.O. (mg/l)
Marginal Benefits
(MB)
Marginal Costs
(MC)
qp

State Urban
(%)
Ag
(%)
Forest
(%)
NY 2% 11% 87%
PA 23% 20% 57%
NJ 17% 29% 54%
DE 25% 28% 46%
DRB 17% 20% 62%

Nitrogen Loads
Delaware River Basin
Agriculture
14,625 tons/yr
29%
Suburban/
Urban
7,073 tons/yr
14%
Atmospheric
Deposition
6,063 tons/yr
12%
Wastewater
23,241 tons/yr
45%


Per-Pound Costs of Reducing Nitrogen Pollution
in the Chesapeake Bay Region
$75.00
$27.65$21.90
$7.00 $4.70 $3.30 $3.20 $3.20 $3.10 $1.50 $1.20
$92.40
0
20
40
60
80
100
Sto
rmwat
er R
etro
fit
Sto
rmwat
er M
gmt.
New
Site
s
Airb
orne
NO
X re
ductio
n
WW
TP U
pgra
de (M
ean)
Nut
rient
Man
agem
ent P
lan
Oys
ter a
quac
ultu
re
Cov
er C
rops
Land
Ret
irem
ent
Con
serv
ation
Tilla
ge
Gra
ss B
uffe
rs
Fores
t Buf
fers
Res
tore
d W
etland
s
Fores
t Buf
fers
($/lb
N)

0
100
200
300
400
500
Co
sts
($/y
r)
Mill
ion
sCost by State for Median 32% Nitrogen Reduction
Delaware Basin
Agriculture
Urban/Suburban
Wastewater
Atmospheric NOX

Nitrogen Marginal Abatement Cost Curve
Delaware Basin
Agricultural
Conservation
0
10
20
30
40
50
0 100 200 300 400 500
Costs to Reduce N Loads by 32% ($ million)
N L
oad
Red
ucti
on
(millio
n lb
/yr)
Wastewater
Treatment
Atmospheric
Deposition
Urban/Suburban
Stormwater BMPs

0
10
20
30
40
50
1980 1985 1990 1995DO
(m
g/l x
10
) a
nd
Ca
tch
pe
r H
au
l
Catch per Haul vs. Dissolved OxygenDelaware River at Ben Branklin Bridge
Ben Franklin Br DO American Shad White Perch Striped Bass
American ShadCPH = 0.47(DO) - 3.27R2 = 0.66
White PerchCPH = 0.68(DO) - 2.29R2 = 0.46
Striped BassCPH = 0.13(DO) - 0.40
R2 = 0.53

Increased Property Value
Due to Improved Water Quality (EPA 1973)
0%
5%
10%
15%
20%
0 1000 2000 3000 4000 5000
Distance from Water (ft)
Inc
rea
se
d V
alu
e (
%)

Resources for the Future water quality ladder (Carson and Mitchell 1993)


0 0 7 2 8 012 13
56
15
76
8
130
46
0 2 416 16 17 17 24 27
68 74
115
188203
334
0
50
100
150
200
250
300
350
400
($ m
illi
on
/yr)
Annual Benefits of Improved Water Quality
in the Delaware River
Lower BoundUpper Bound

Viewing, Boating, Fishing, $68M, 6%
Boating, $334M, 30%
Recreational Fishing, $202M,
18%
Shad fishing,
$3.9M, 0%
Bird/Wildlife Watching, $33M, 3%
Waterfowl Hunting,
$1.6M, 0%
Swimming, 0, 0%
Beach Going, $16M,
2%
Commercial Fishing, $17M, 2%
Agriculture, $188M, 17%
Navigation, $16M, 2%
Property Value, $27M, 2%
Municipal Water Supply, $24M, 2%
Industrial Water Supply, $17M, 2%
Nonuse Benefits,
$115M, 10%
Annual Benefits of Improved Water Qualityin the Delaware River

0
200
400
600
800
1,000
1,200
3.0 3.5 4.0 4.5 5.0 5.5 6.0
$ m
illio
n/y
r
DO (mg/l)
Optimal Water Qualityin the Delaware River
Marginal Cost (Low) Median 32% N Reduction Marginal Cost (High) 75th Percentile
Marginal Benefits (Low) Marginal Benefits (High)
MB (High)
MB (Low)
MC (High)
MC (Low)

$2.8B
$4.8B
$403M
$917M
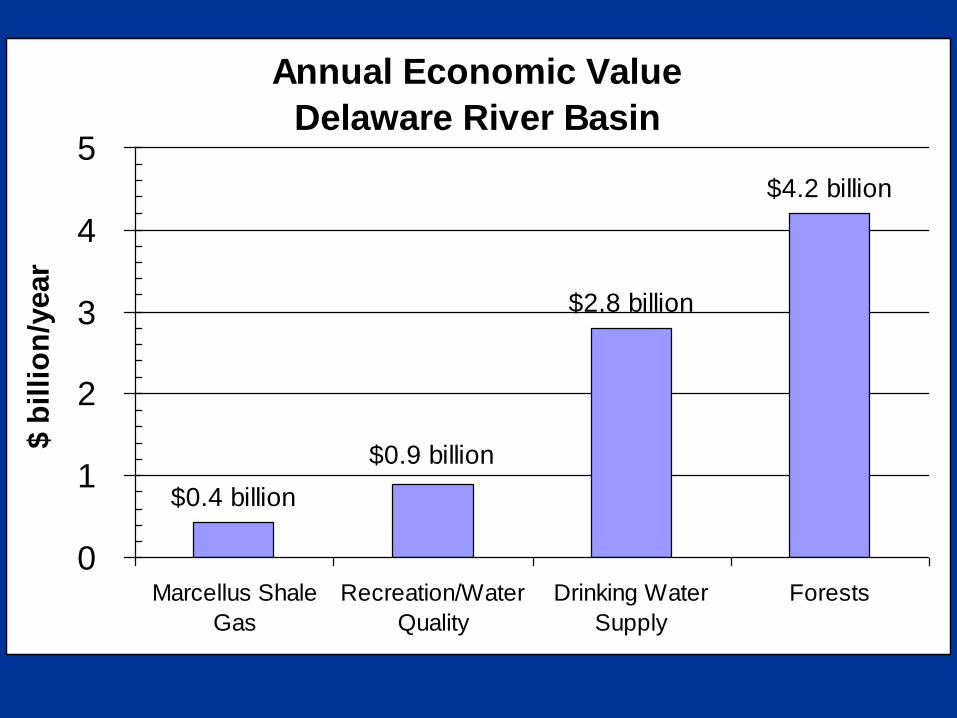
Annual Economic Value
Delaware River Basin
$4.2 billion
$2.8 billion
$0.9 billion
$0.4 billion
0
1
2
3
4
5
Marcellus Shale
Gas
Recreation/Water
Quality
Drinking Water
Supply
Forests
$ b
illi
on
/year
Annual Economic Value
Delaware River Basin
$4.2 billion
$2.8 billion
$0.9 billion
$0.4 billion
0
1
2
3
4
5
Marcellus Shale
Gas
Recreation/Water
Quality
Drinking Water
Supply
Forests
$ b
illi
on
/year
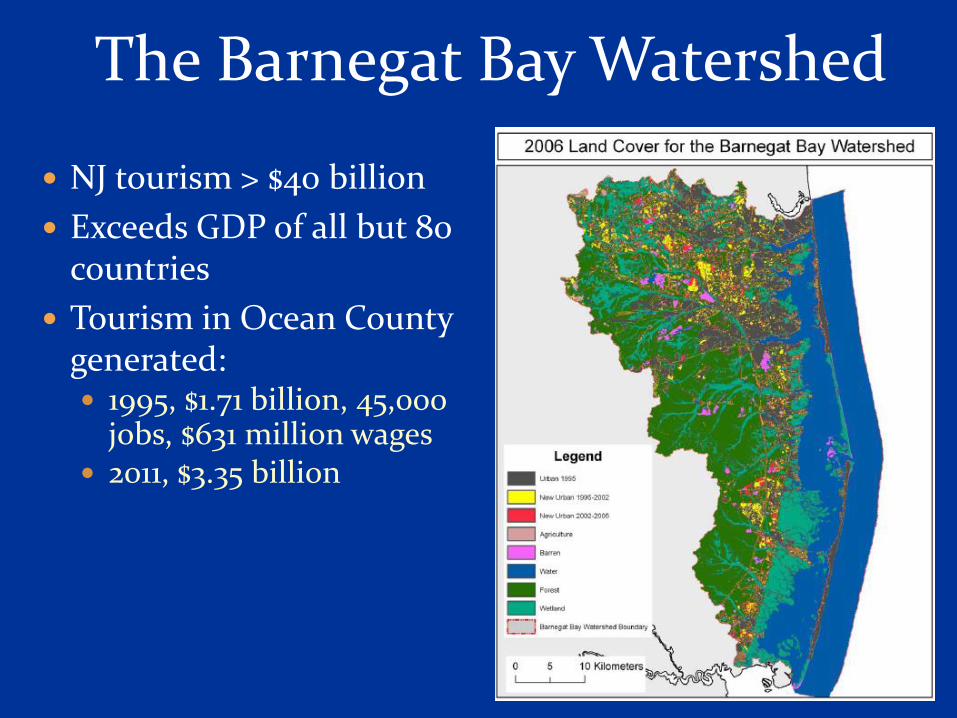
NJ tourism > $40 billion
Exceeds GDP of all but 80 countries
Tourism in Ocean County generated: 1995, $1.71 billion, 45,000
jobs, $631 million wages 2011, $3.35 billion
The Barnegat Bay Watershed

Barnegat Bay Watershed Population
576,567 (winter), 1,500,000 (summer)
2000 - 2010, Ocean Co. population grew by 59,992 (11.7%)
Ocean County, 2nd fastest growing county in NJ
Population Change in New Jersey Counties
2000-2010
0.2%0.6%1.1%2.0%
3.3%3.6%4.2%4.4%4.5%
5.1%5.1%6.1%6.5%
7.4%7.8%
9.4%
11.7%
13.1%
-1.9%-2.9%
-6.1%
-15%
-10%
-5%
0%
5%
10%
15%
Ca
pe
Ma
y
Esse
x
Hu
dso
n
Pa
ssa
ic
Un
ion
Be
rge
n
Ca
md
en
Sa
lem
Mo
rris
Me
rce
r
Mo
nm
ou
th
Su
sse
x
Bu
rlin
gto
n
Mid
dle
se
x
Hu
nte
rdo
n
Wa
rre
n
Atla
ntic
Cu
mb
erla
nd
So
me
rse
t
Oce
an
Glo
uce
ste
r
Po
pu
lati
on
Ch
an
ge (
%)

Water Quality $224 million
Water Supply $59 million
Fish/Wildlife $189 million
Recreation $1,583 million
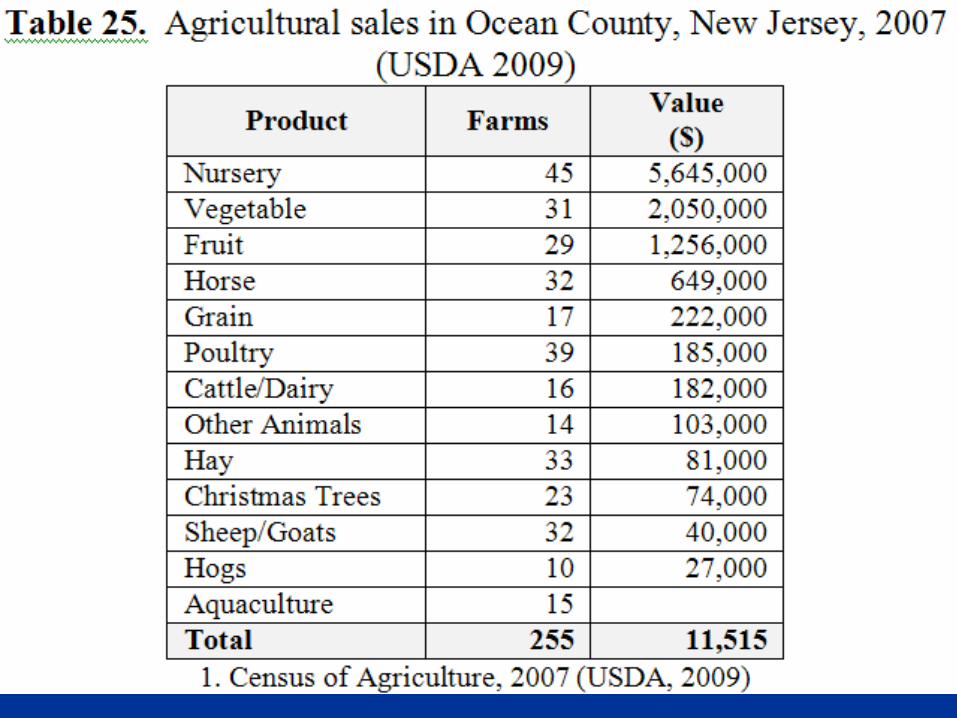
Agriculture $12 million
Forests $208 million
Public Parks $1,770 million
Total > $4 billion
Barnegat Bay Watershed
Annual Economic Activity

Willingness to Pay for Improved Water Quality
Barnegat Bay Watershed ($2010)
$0
$50,000,000
$100,000,000
$150,000,000
$200,000,000
$250,000,000
Viewing Boating Fishing Total
Water Quality Use Support
An
nu
al
WT
P (
$)
Low Value (Year-round population) High Value (Summer Population)
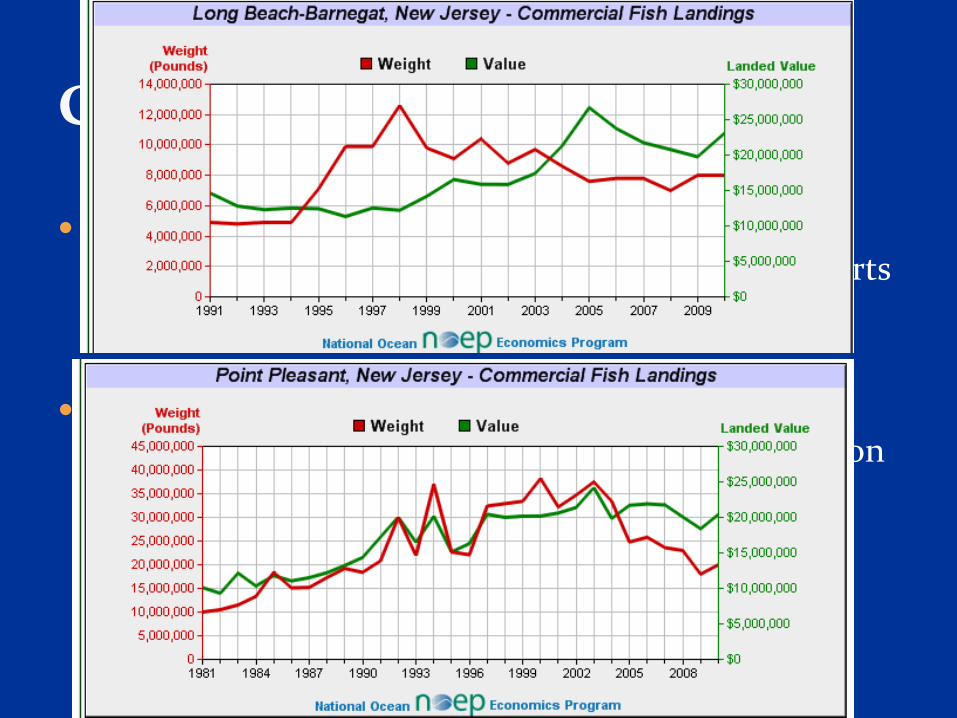
Commercial Fish Landings
Long Beach-Barnegat and Point Pleasant ports are 32nd and 36th most valuable commercial fishing ports in U.S. (NMFS and NOEP 2010)
Combined ports would be the 16th most valuable commercial fishing port in the U.S. with $48.6 million in annual fish landings.

Hard Clam Landings
Ocean County, New Jersey (NMFS)

Blue crab landings in the Barnegat Bay •23.5% of total New Jersey blue crab landings. •In 2007, 4.8 million pounds of blue crabs were harvested in NJ •Landed value of $5.5 million •Estimated value of the bay’s blue crab fishery is about $825,000.
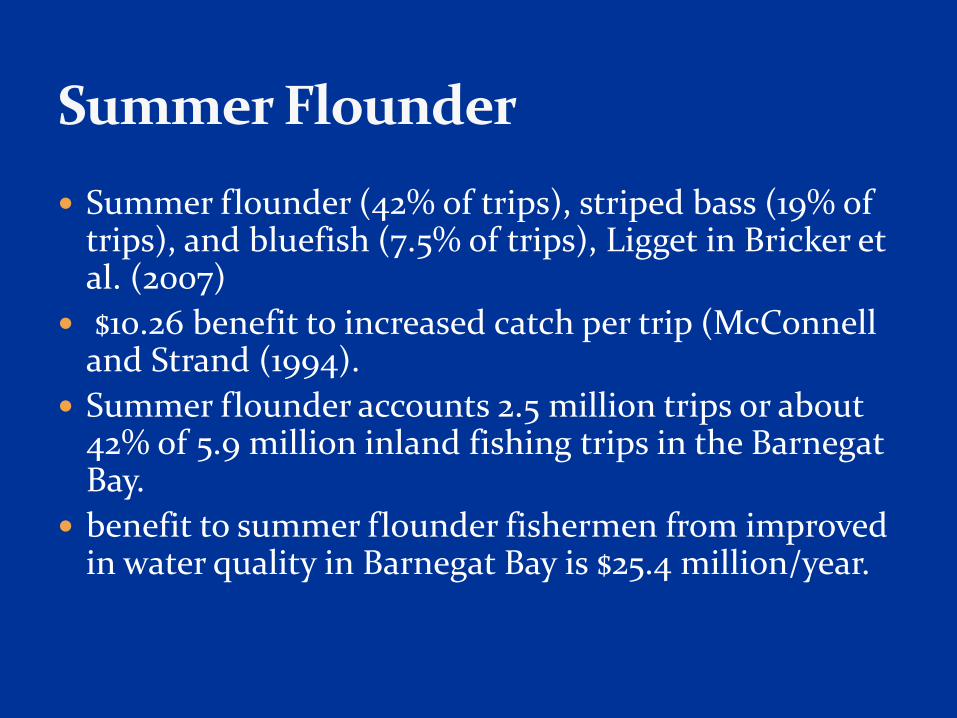
Summer Flounder
Summer flounder (42% of trips), striped bass (19% of trips), and bluefish (7.5% of trips), Ligget in Bricker et al. (2007)
$10.26 benefit to increased catch per trip (McConnell and Strand (1994).
Summer flounder accounts 2.5 million trips or about 42% of 5.9 million inland fishing trips in the Barnegat Bay.
benefit to summer flounder fishermen from improved in water quality in Barnegat Bay is $25.4 million/year.


Recreational Boating (
NJ boaters spent $2.1 billion in 2006, generated 18,000 jobs.
$2.1 billion in recreational boating expenditures.
Average cost of a boat trip was $273.
Boaters spent $6,340/yr
Barnegat Bay and Inlet ranked No.1 as most popular boating destination in the Garden State.
More Ocean Co. residents are registered boaters (22,505) than in any other county.
27.9% of all NJ boats are docked in Ocean Co.
Recreational boating contributes $590 million annually to the Barnegat Bay economy and responsible for 5,000 - 6,300 jobs.


State Parks
Mates and Reyes (2006), $21/visit, 14.2 million visitors /yr from 2000-2005 to the NJ state park and forest system
Contributed $304 to $347 million annually to the State economy and supported about 7,000 jobs.
In FY 2011,state parks recorded 18.8 million visitors.
State parks in Barnegat Bay watershed contribute $23 to $27 million and 539 jobs to the local economy.

Forests
Forests in the Barnegat Bay watershed (275.5 sq mi) have benefits of:
• Carbon storage ($146 million)
• Carbon sequestration ($5.1 million)
• Air-pollution removal ($47 million)
• Building-energy savings ($9.8 million)


Annual Economic Value
Barnegat Bay Watershed
1259
189 208 224
1,583
1,770
0
500
1,000
1,500
2,000A
gric
ultu
re
Wate
r S
uppl
y
Fis
h/W
ildlif
e
For
ests
Wate
r Q
ualit
y
Rec
reat
ion
Pub
lic P
arks
$ m
illi
on

Value of Natural Goods and Services in the
Barnegat Bay Watershed, 2006
$155,209,135
$75,155,098
$35,440,983 $3,035,462
$0
$908,934,190
$778,269,265
$282,038,938
$16,097,342
Freshwater wetlands
Marine
Forest
Saltwater wetland
Beach/dune
Urban
Farmland
Open water
Barren land

Sector Jobs Wages
($ million)
Direct Watershed-Related 25,630 851
Indirect Watershed-Related 30,756 681
Coastal 11,565 206
Farm 1,045 50
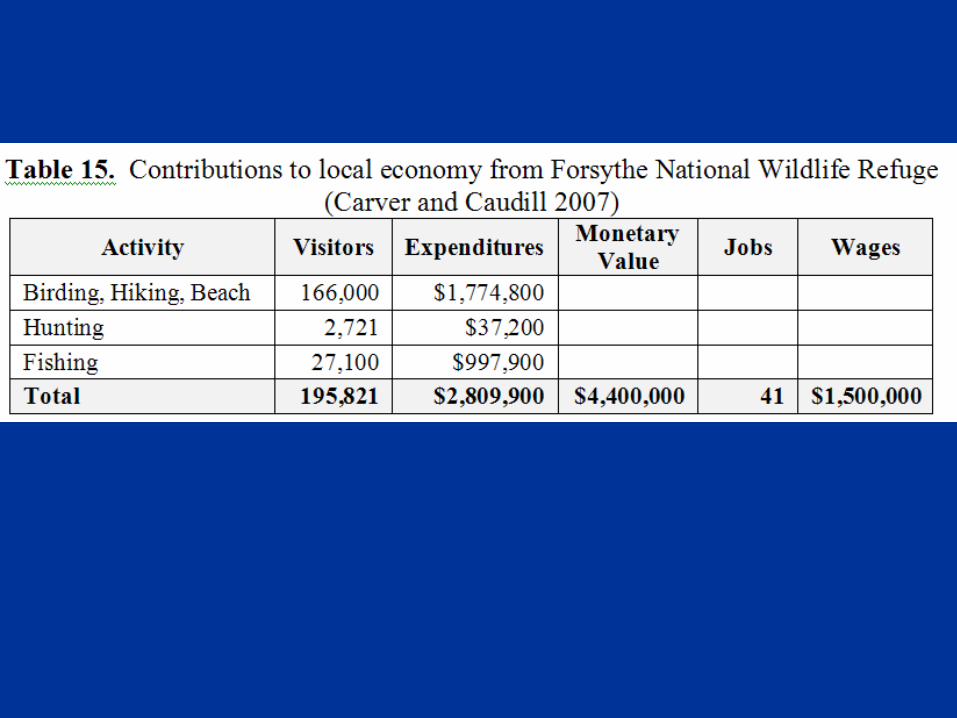
Fishing/Hunting/Birding 3,364 110
National Wildlife Refuge 41 1.5
Wetlands 360 23
Boating 5,000 200
Outdoor Recreation 3,029 150
State Parks 539 27
Watershed Organizations 50 2.4
Water Supply Utilities 535 30
Wastewater Utilities 50 3

The Barnegat Bay watershed in Ocean County and Monmouth County, New Jersey contributes:
1. $4 billion in annual economic value from recreation, water quality, water supply, ecotourism, forest, agriculture, parks benefits.
2. Ecosystem goods and services worth $2.3 billion per year, net present value (NPV) = $73.3 billion.
3. Over 60,000 jobs with $2 billion in wages.

Questions?