What Works Clearinghouse™ U.S. DEPARTMENT OF … · Accelerated Math® December 2017 Page 1 What...
38
Accelerated Math ® December 2017 Page 1 What Works Clearinghouse™ U.S. DEPARTMENT OF EDUCATION WWC Intervention Report A summary of findings from a systematic review of the evidence Primary Mathematics December 2017* Accelerated Math ® Intervention Description 1 Accelerated Math ® , published by Renaissance Learning, is a software tool that provides practice problems for students in grades K–12 and provides teachers with reports to monitor student progress. Accelerated Math ® creates individualized student assignments, scores the assignments, and generates reports on student progress. The software is typically used with the math curriculum being used in the classroom to add practice for students and help teachers differentiate instruction through the program’s progress-monitoring data. This review focuses on studies of Accelerated Math ® ’s use in kindergarten through pre-algebra classes. Research 2 The What Works Clearinghouse (WWC) identified six studies of Accelerated Math ® that both fall within the scope of the Primary Mathematics topic area and meet WWC group design standards. Two studies meet WWC group design standards without reservations, and four studies meet WWC group design standards with reservations. Together, these studies included 5,206 students in grades 2–9 in more than 223 classrooms across 27 states. According to the WWC review, the extent of evidence for Accelerated Math ® on the mathematics test scores of students in primary mathematics courses was medium to large for the mathematics achievement domain, the only domain examined for studies reviewed under the Primary Mathematics topic area. 3 (See the Effectiveness Summary on p. 5 for more details.) Effectiveness Accelerated Math ® had mixed effects on the mathematics test scores of students in primary mathematics courses. Table 1. Summary of findings 4 Improvement index (percentile points) Outcome domain Rating of effectiveness Average Range Number of studies Number of students Extent of evidence Mathematics achievement Mixed effects +5 –7 to +12 6 5,206 Medium to large Report Contents Overview p. 1 Intervention Information p. 2 Research Summary p. 3 Effectiveness Summary p. 5 References p. 7 Research Details for Each Study p. 15 Outcome Measures for Each Domain p. 27 Findings Included in the Rating for Each Outcome Domain p. 28 Supplemental Findings for Each Outcome Domain p. 30 Endnotes p. 32 Rating Criteria p. 34 Glossary of Terms p. 35 This intervention report presents findings from a systematic review of Accelerated Math conducted using the WWC Procedures and Standards Handbook (version 3.0), and the Primary Mathematics review protocol (version 3.1).
Transcript of What Works Clearinghouse™ U.S. DEPARTMENT OF … · Accelerated Math® December 2017 Page 1 What...
Accelerated Math® December 2017 Page 1
What Works Clearinghouse™ U.S. DEPARTMENT OF EDUCATION
WWC Intervention ReportA summary of findings from a systematic review of the evidence
Primary Mathematics December 2017*
Accelerated Math®
Intervention Description1
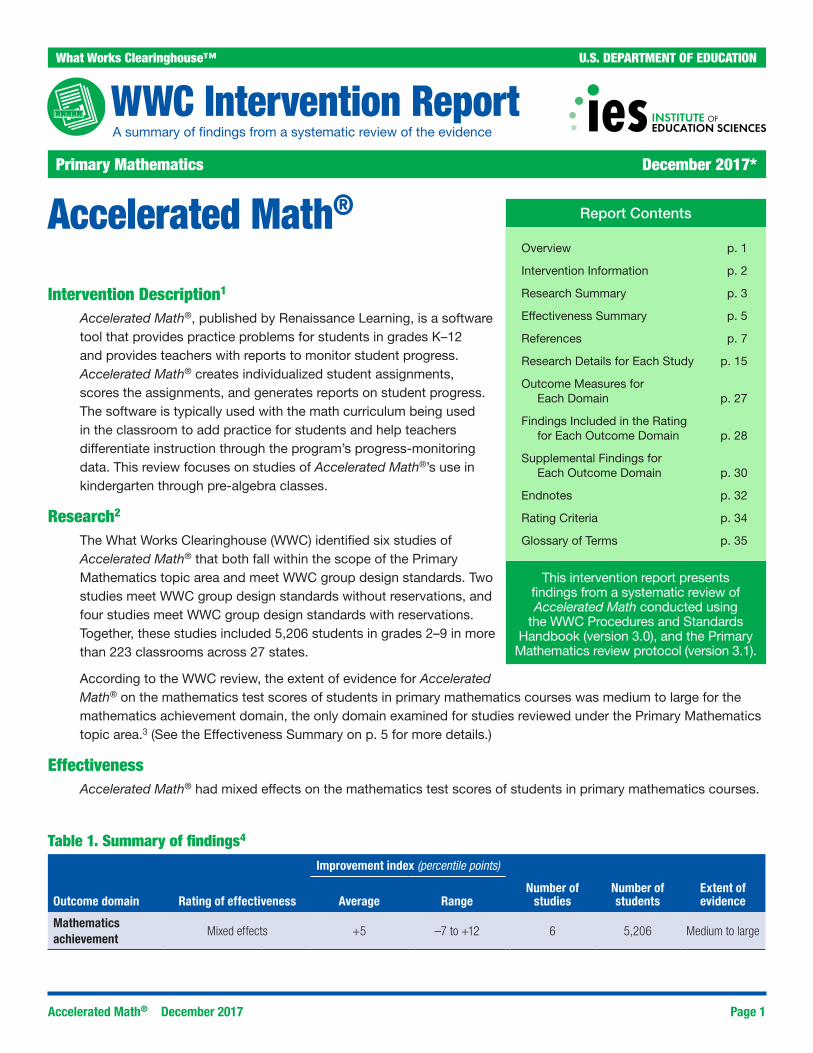
Accelerated Math®, published by Renaissance Learning, is a software tool that provides practice problems for students in grades K–12 and provides teachers with reports to monitor student progress. Accelerated Math® creates individualized student assignments, scores the assignments, and generates reports on student progress. The software is typically used with the math curriculum being used in the classroom to add practice for students and help teachers differentiate instruction through the program’s progress-monitoring data. This review focuses on studies of Accelerated Math®’s use in kindergarten through pre-algebra classes.
Research2 The What Works Clearinghouse (WWC) identified six studies of Accelerated Math® that both fall within the scope of the Primary Mathematics topic area and meet WWC group design standards. Two studies meet WWC group design standards without reservations, and four studies meet WWC group design standards with reservations. Together, these studies included 5,206 students in grades 2–9 in more than 223 classrooms across 27 states.
According to the WWC review, the extent of evidence for Accelerated Math® on the mathematics test scores of students in primary mathematics courses was medium to large for the mathematics achievement domain, the only domain examined for studies reviewed under the Primary Mathematics topic area.3 (See the Effectiveness Summary on p. 5 for more details.)
EffectivenessAccelerated Math® had mixed effects on the mathematics test scores of students in primary mathematics courses.
Table 1. Summary of findings4
Improvement index (percentile points)
Outcome domain Rating of effectiveness Average RangeNumber of
studiesNumber of students
Extent ofevidence
Mathematics achievement
Mixed effects +5 –7 to +12 6 5,206 Medium to large
Report Contents
Overview p. 1
Intervention Information p. 2
Research Summary p. 3
Effectiveness Summary p. 5
References p. 7
Research Details for Each Study p. 15
Outcome Measures for Each Domain p. 27
Findings Included in the Rating for Each Outcome Domain p. 28
Supplemental Findings for Each Outcome Domain p. 30
Endnotes p. 32
Rating Criteria p. 34
Glossary of Terms p. 35
This intervention report presents findings from a systematic review of Accelerated Math conducted using
the WWC Procedures and Standards Handbook (version 3.0), and the Primary
Mathematics review protocol (version 3.1).
Accelerated Math® December 2017 Page 2
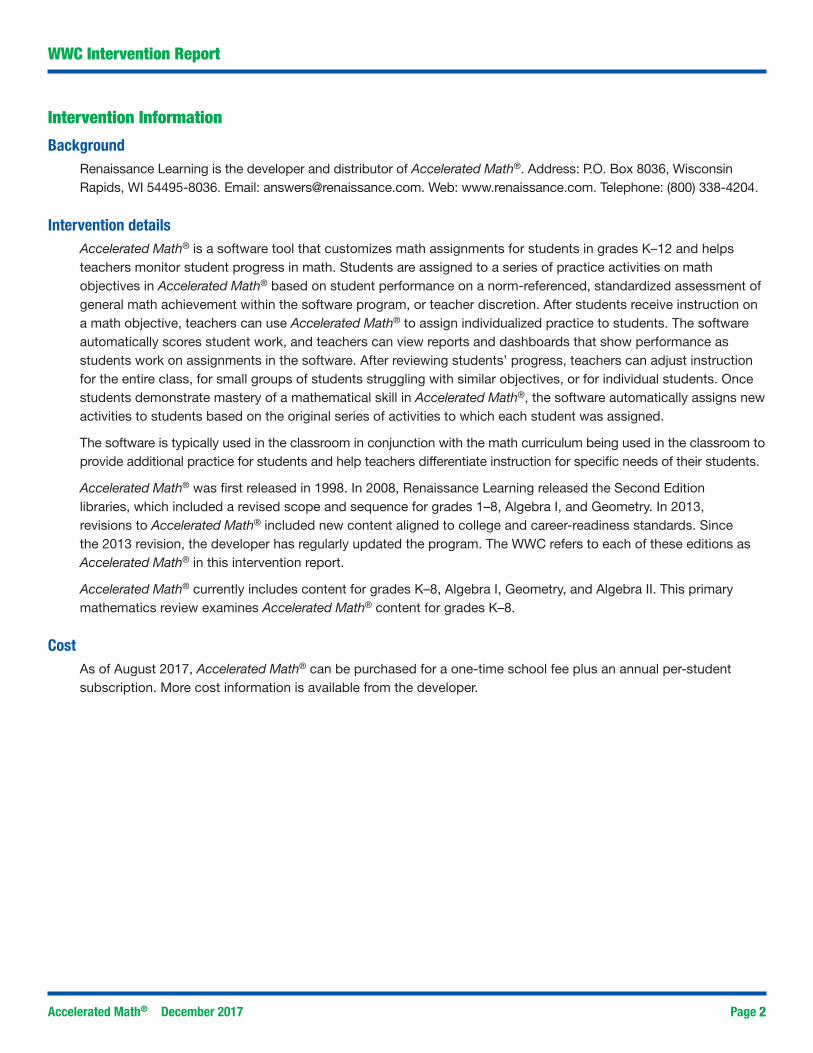
Intervention Information
BackgroundRenaissance Learning is the developer and distributor of Accelerated Math®. Address: P.O. Box 8036, Wisconsin Rapids, WI 54495-8036. Email: [email protected]. Web: www.renaissance.com. Telephone: (800) 338-4204.
Intervention detailsAccelerated Math® is a software tool that customizes math assignments for students in grades K–12 and helps teachers monitor student progress in math. Students are assigned to a series of practice activities on math objectives in Accelerated Math® based on student performance on a norm-referenced, standardized assessment of general math achievement within the software program, or teacher discretion. After students receive instruction on a math objective, teachers can use Accelerated Math® to assign individualized practice to students. The software automatically scores student work, and teachers can view reports and dashboards that show performance as students work on assignments in the software. After reviewing students’ progress, teachers can adjust instruction for the entire class, for small groups of students struggling with similar objectives, or for individual students. Once students demonstrate mastery of a mathematical skill in Accelerated Math®, the software automatically assigns new activities to students based on the original series of activities to which each student was assigned.
The software is typically used in the classroom in conjunction with the math curriculum being used in the classroom to provide additional practice for students and help teachers differentiate instruction for specific needs of their students.
Accelerated Math® was first released in 1998. In 2008, Renaissance Learning released the Second Edition libraries, which included a revised scope and sequence for grades 1–8, Algebra I, and Geometry. In 2013, revisions to Accelerated Math® included new content aligned to college and career-readiness standards. Since the 2013 revision, the developer has regularly updated the program. The WWC refers to each of these editions as Accelerated Math® in this intervention report.
Accelerated Math® currently includes content for grades K–8, Algebra I, Geometry, and Algebra II. This primary mathematics review examines Accelerated Math® content for grades K–8.
Cost As of August 2017, Accelerated Math® can be purchased for a one-time school fee plus an annual per-student subscription. More cost information is available from the developer.
2
WWC Intervention Report

Accelerated Math® December 2017 Page 3
Research SummaryThe WWC identified 24 eligible studies that investigated the effects of Accelerated Math® on the mathematics achievement of primary students. An additional 56 studies were identified but do not meet WWC eligibility criteria (see the Glossary of Terms in this document for a definition of this term and other commonly used research terms) for review in this topic area. Citations for all 80 studies are in the References section, which begins on p. 7.
The WWC reviewed the 24 eligible studies against group design standards. Two studies are randomized controlled trials (RCTs) that meet WWC group design standards without reservations, and four studies are randomized controlled trials or use quasi-experimental designs that meet WWC group design standards with reservations. This report summarizes those six studies. The remaining 18 studies do not meet WWC group design standards.
WWC Intervention Report
Table 2. Scope of reviewed research
Grades 2–9
Delivery method Whole class
Intervention type Supplement
Summary of studies meeting WWC group design standards without reservationsCaputo (2007) conducted a cluster, or group-based, RCT to examine the effects of Accelerated Math® on sixth-grade students in a suburban middle school in the 2006–07 school year. Within the one study school, two classrooms were randomly assigned to use Accelerated Math® and two to use another program, the Delaware Procedural Fluency Workbook (DPFW). Teachers used Accelerated Math® and the DPFW as supplements to each classroom’s existing math curriculum. The analysis included 38 Accelerated Math® students and 32 DPFW students. The study presented results on three sixth-grade mathematics outcome measures: the Delaware Student Testing Program (DSTP), the Northwest Evaluation Association Measures of Academic Progress (NWEA MAP), and the STAR Math test. The study did not specify the version of Accelerated Math® used.
Lambert et al. (2014) conducted a cluster, or group-based, RCT to examine the effects of Accelerated Math® on students in grades 2–5 in three elementary schools in the Midwest. The study did not indicate in which year data collection occurred. Eighteen classrooms were randomly assigned to use Accelerated Math® as a supplement to their existing math curriculum, and 18 other classrooms were randomly assigned to business-as-usual math instruction. The study used the STAR Math and Terra Nova Math tests to measure student mathematics achievement. For the STAR Math analysis, the sample included 337 Accelerated Math® students and 329 comparison students. For the Terra Nova analysis, the sample included 256 Accelerated Math® students and 248 comparison students. The study did not specify the version of Accelerated Math® used.
Summary of studies meeting WWC group design standards with reservationsLambert and Algozzine (2009) conducted a cluster, or group-based, RCT to examine the effects of Accelerated Math® on students in grades 7–9 in two middle schools. The study did not indicate in which year data collection occurred. Twenty-three classrooms (containing 314 students) were randomly assigned to use Accelerated Math® as a supplement to the existing math curriculum, and 23 other classrooms (containing 319 students) were assigned to business-as-usual math instruction. Random assignment of classrooms occurred within each school and class period, and each participating teacher taught both Accelerated Math® and comparison classes. The study experienced high attrition of students, but the analytic sample for the Terra Nova Math test demonstrates equivalence; therefore, the study meets WWC group design standards with reservations. The study did not specify the version of Accelerated Math® used.
Lehmann and Seeber (2005) conducted a cluster, or group-based, quasi-experimental study to examine the effects of Accelerated Math® on students in grades 4–6 in 14 schools in the German state of North Rhine-Westphalia. The study occurred from February through July 2004. Within grade in each of the 14 schools, classes were intentionally selected to use AM and matching classes served as the comparison group. The study sample included
Accelerated Math® December 2017 Page 4
WWC Intervention Report
47 classrooms (22 intervention and 25 comparison) and 1,131 students (518 intervention and 613 comparison) in grades 4–6. The study used the Hamburger Schulleistungstest (HST), a standardized German mathematics exam, to measure student achievement. The study schools used a German-language pilot version of Accelerated Math®.
Ysseldyke and Bolt (2007) conducted a cluster, or group-based, RCT in grades 2–5 across five schools in the 2003–04 school year.6 Within each participating elementary school and grade level, teachers were randomly assigned to use Accelerated Math® or a comparison group that did not use Accelerated Math®. The study involved 20 classrooms in each group, with the largest analytic sample including 700 students (355 Accelerated Math® and 345 comparison students). The study did not present information to assess attrition; the study demonstrates equivalence on the analytic sample and therefore meets WWC group design standards with reservations. The study used two assessments to measure mathematics achievement outcomes in grades 2–5: the STAR Math test and the Terra Nova Math test. The study did not specify the version of Accelerated Math® used.
Ysseldyke and Tardrew (2007) conducted a cluster, or group-based, RCT to examine the effects of Accelerated Math® on grade 3–6 student achievement in 27 schools and 125 classrooms in the second semester of the 2001–02 school year. The analytic sample comprised 2,006 students (1,038 Accelerated Math® and 968 comparison students).7 Principals were asked to randomly assign teachers to use Accelerated Math® or not; however, principals did not always randomly assign teachers, jeopardizing the integrity of the study’s random assignment. The study demonstrated equivalence of the analytic intervention and comparison group at baseline and therefore meets WWC group design standards with reservations. The study used the STAR Math test to measure student achievement. The study did not specify the version of Accelerated Math® used.
WWC Intervention Report

Accelerated Math® December 2017 Page 5
Effectiveness Summary
WWC Intervention Report
The WWC review of Accelerated Math® for the Primary Mathematics topic area includes student outcomes in one domain: mathematics achievement. The following findings present the authors’ estimates and WWC-calculated estimates of the size and statistical significance of the effects of Accelerated Math® on primary students. Additional comparisons are available as supplemental findings in Appendix D. The supplemental findings do not factor into the intervention’s rating of effectiveness. For a more detailed description of the rating of effectiveness and extent of evidence criteria, see the WWC Rating Criteria on p. 34.
Summary of effectiveness for the mathematics achievement domain
Table 3. Rating of effectiveness and extent of evidence for the mathematics achievement domainRating of effectiveness Criteria met
Mixed effectsEvidence of inconsistent effects.
In the six studies that reported findings, the estimated impact of the intervention on outcomes in the mathematics achievement domain was positive and statistically significant in one study and indeterminate in five studies.
Extent of evidence Criteria met
Medium to large Six studies that included 5,206 students in more than 223 classrooms in dozens of schools across 27 states reported evidence of effectiveness in the mathematics achievement domain.
Six studies that met WWC group design standards with or without reservations reported findings in the mathematics achievement domain.
Caputo (2007) reported, and the WWC confirmed, no statistically significant difference between Accelerated Math® and the comparison group in the mathematics achievement domain. The effect size was not large enough to be considered substantively important according to WWC criteria (that is, an effect size of at least 0.25). The WWC characterizes this study finding as an indeterminate effect.
Lambert et al. (2014) reported a positive and statistically significant difference between Accelerated Math® and the comparison group in the mathematics achievement domain on the STAR Math test. However, the measurement approach used by the study did not yield estimates that are consistent with WWC guidelines.8 The WWC calculated an estimate consistent with the WWC approach using data presented by the author and, after correcting for clustering, found that the difference was not statistically significant. In addition, the authors reported, and the WWC confirmed, no statistically significant difference between Accelerated Math® and the comparison group in the mathematics achievement domain on the Terra Nova Math test. The average effect size across both outcomes was not large enough to be considered substantively important according to WWC criteria (that is, an effect size of at least 0.25). The WWC characterizes this study finding as an indeterminate effect.
Lambert and Algozzine (2009) reported, and the WWC confirmed, no statistically significant difference between Accelerated Math® and the comparison group in the mathematics achievement domain. The effect size was not large enough to be considered substantively important according to WWC criteria (that is, an effect size of at least 0.25). The WWC characterizes this study finding as an indeterminate effect.
Lehman and Seeber (2005) compared Accelerated Math® to the comparison group separately in grades 4, 5, and 6 and reported a positive difference between Accelerated Math® and the comparison group in the mathematics achievement domain in grade 5. The authors did not report the statistical significance of this finding. The authors reported no difference between Accelerated Math® and the comparison group in grades 4 and 6. The WWC pooled the three grades together and found no statistically significant difference between Accelerated Math® and the comparison group. The effect size was not large enough to be considered substantively important according to WWC criteria (that is, an effect size of at least 0.25). The WWC characterizes this study finding as an indeterminate effect.
Accelerated Math® December 2017 Page 6
WWC Intervention Report
Ysseldyke and Bolt (2007) reported a positive and statistically significant difference between Accelerated Math® and the comparison group in the mathematics achievement domain on one outcome measure (STAR Math). However, after correcting for clustering, the WWC found that this difference was not statistically significant. The authors reported, and the WWC confirmed, no statistically significant difference on Terra Nova Math. The average effect size across both outcomes was not large enough to be considered substantively important according to WWC criteria (that is, an effect size of at least 0.25). The WWC characterizes this study finding as an indeterminate effect.
Ysseldyke and Tardrew (2007) compared Accelerated Math® to the comparison group by grade in grades 3–6 and reported a positive and statistically significant difference between Accelerated Math® and the comparison group in the mathematics achievement domain in each grade. For the purpose of providing an overall rating of effectiveness, the WWC pooled all four grades together and found a statistically significant difference between Accelerated Math® and the comparison group. The WWC characterizes this study finding as a statistically significant positive effect.
Thus, for the mathematics achievement domain, one study showed a statistically significant positive effect and five studies showed indeterminate effects. This results in a rating of mixed effects, with a medium to large extent of evidence.
WWC Intervention Report
Accelerated Math® December 2017 Page 7
WWC Intervention Report
References
Studies that meet WWC group design standards without reservationsCaputo, M. T. (2007). A comparison of the effects of the Accelerated Math program and the Delaware Procedural
Fluency Workbook program on academic growth in grade six at X middle school (Unpublished doctoral dissertation). Wilmington University, Wilmington, DE.
Lambert, R., Algozzine, B., & McGee, J. (2014). Effects of progress monitoring on math performance of at-risk students (Elementary school sample). British Journal of Education, Society and Behavioural Science, 4(4), 527–540. Additional source:Lambert, R., & Algozzine, B. (2009). Accelerated Math evaluation report (Elementary school sample).
Charlotte: Center for Educational Measurement and Evaluation, University of North Carolina at Charlotte.
Studies that meet WWC group design standards with reservationsLambert, R., & Algozzine, B. (2009). Accelerated Math evaluation report (Middle school sample)
Charlotte: Center for Educational Measurement and Evaluation, University of North Carolina at Charlotte. Additional source:Lambert, R., Algozzine, B., & McGee, J. (2014). Effects of progress monitoring on math performance of at-risk
students (Middle school sample). British Journal of Education, Society and Behavioural Science, 4(4), 527–540.
Lehmann, R. H., & Seeber, S. (2005). Accelerated Math in grades 4 through 6: Evaluation of an experimental program in 15 schools in North Rhine-Westphalia. Berlin: Humboldt University.Additional source:Lehmann, R. H., & Seeber, S. (2005). Accelerated Math in grades 4–6: Summary of a quasi-experimental study
in North Rhine-Westphalia, Germany. Wisconsin Rapids, WI: Renaissance Learning, Inc.Ysseldyke, J., & Bolt, D. M. (2007). Effect of technology-enhanced continuous progress monitoring on math
achievement. School Psychology Review, 36(3), 453–467. Retrieved from https://eric.ed.gov/?id=EJ788347Additional sources:Bolt, D. M., Ysseldyke, J., & Patterson, M. J. (2010). Students, teachers, and schools as sources of variability,
integrity, and sustainability in implementing progress monitoring. School Psychology Review, 39(4), 612–630. Retrieved from https://eric.ed.gov/?id=EJ910232
Ysseldyke, J., & Bolt, D. M. (2005). High implementers of Accelerated Math show significant gains over low- or non-implementers. Wisconsin Rapids, WI: Renaissance Learning, Inc.
Ysseldyke, J., & Tardrew, S. (2007). Use of a progress monitoring system to enable teachers to differentiate mathematics instruction. Journal of Applied School Psychology, 24(1), 1–28. Retrieved from https://eric.ed.gov/?id=EJ783511Additional sources:Renaissance Learning, Inc. (2003). Use of an instructional management system to enhance math instruction of
gifted and talented students. Wisconsin Rapids, WI: Author.Ysseldyke, J., Betts, J., Thill, T., & Hannigan, E. (2004). Use of an instructional management system to improve
mathematics skills for students in Title I programs. Preventing School Failure, 48(4), 10–14. Retrieved from https://eric.ed.gov/?id=EJ744581
Ysseldyke, J. E., & Tardrew, S. P. (2002). Differentiating math instruction: A large scale study of Accelerated Math (Final report). Wisconsin Rapids, WI: Renaissance Learning, Inc.
Ysseldyke, J. E., Tardrew, S. P., Betts, J., Thill, T., & Hannigan, E. (2004). Use of an instructional management system to enhance math instruction of gifted and talented students. Journal for the Education of the Gifted, 27(4), 293–310. Retrieved from https://eric.ed.gov/?id=EJ682720
Accelerated Math® December 2017 Page 8
WWC Intervention Report
Studies that do not meet WWC group design standardsAtkins, J. (2005). The association between the use of Accelerated Math and students’ math achievement
(Unpublished doctoral dissertation). East Tennessee State University, Johnson City. The study does not meet WWC group design standards because equivalence of the analytic intervention and comparison groups is necessary and not demonstrated.
Boys, C. J. (2003). Mastery orientation through task-focused goals: Effects on achievement and motivation (Unpublished doctoral dissertation). University of Minnesota, Minneapolis. The study does not meet WWC group design standards because the measures of effectiveness cannot be attributed solely to the intervention.
Brem, S. K. (2003). AM users outperform controls when exposure and quality of interactions are high: A two-year study of the effects of Accelerated Math on math performance in a Title I elementary school. Tempe: Arizona State University. The study does not meet WWC group design standards because equivalence of the analytic intervention and comparison groups is necessary and not demonstrated.Additional source: Sadusky, L. A., & Brem, S. K. (2002). The use of Accelerated Math in an urban Title I elementary school.
Tempe: Arizona State University. Burns, M. K., Klingbeil, D. A., & Ysseldyke, J. (2010). The effects of technology-enhanced formative evaluation on
student performance on state accountability math tests. Psychology in the Schools, 47(6), 582–591. Retrieved from https://eric.ed.gov/?id=EJ896153 The study does not meet WWC group design standards because equivalence of the analytic intervention and comparison groups is necessary and not demonstrated.
Forbush, D., Harris, M., Waddoups, J., & Carlson, R. (2001). Math Renaissance improves student achievement and attitudes in Idaho school (Renaissance Independent Research Report No. 35). Wisconsin Rapids, WI: Renaissance Learning, Inc. The study does not meet WWC group design standards because equivalence of the analytic intervention and comparison groups is necessary and not demonstrated.
Holmes, C. T., Brown, C. L., & Algozzine, B. (2006). Promoting academic success for all students. Academic Exchange Quarterly, 10(3), 141–147. The study does not meet WWC group design standards because equivalence of the analytic intervention and comparison groups is necessary and not demonstrated.Additional sources: Holmes, C. T., & Brown, C. L. (2003). A controlled evaluation of a total school improvement process, School
Renaissance. Athens: University of Georgia, Department of Educational Administration. Retrieved from https://eric.ed.gov/?id=ED474261
Renaissance Learning, Inc. (2007). Promoting academic success for all students with Accelerated Math and Accelerated Reader. Wisconsin Rapids, WI: Author.
Johnson-Scott, P. L. (2006). The impact of Accelerated Math on student achievement (Unpublished doctoral dissertation). Mississippi State University, Starkville. The study does not meet WWC group design standards because equivalence of the analytic intervention and comparison groups is necessary and not demonstrated.
Kariuki, P. N., & Gentry, C. J. (2010, November). The effects of Accelerated Math utilization on grade equivalency score at a selected elementary school. Paper presented at the annual conference of the Mid-South Educational Research Association, Mobile, AL. Retrieved from https://eric.ed.gov/?id=ED513432 The study does not meet WWC group design standards because the measures of effectiveness cannot be attributed solely to the intervention.
Nevada Department of Education and the Leadership and Learning Center. (2010). Innovation and remediation interim report: A collaborative project between the Nevada Department of Education and the Leadership and Learning Center. Englewood, CO: The Leadership and Learning Center. The study does not meet WWC group design standards because equivalence of the analytic intervention and comparison groups is necessary and not demonstrated.

Accelerated Math® December 2017 Page 9
WWC Intervention Report
Additional source: Renaissance Learning, Inc. (2010). Nevada Department of Education: Accelerated Math is a “high-gain
program.” Wisconsin Rapids, WI: Education Research Department, Renaissance Learning, Inc.Nunnery, J. A., & Ross, S. M. (2007). The effects of the School Renaissance program on student achievement
in reading and mathematics. Research in the Schools, 14(1), 40–59. The study does not meet WWC group design standards because the measures of effectiveness cannot be attributed solely to the intervention.Additional sources:Renaissance Learning, Inc. (2007). Use of Accelerated Reader and Accelerated Math shown to increase
student scores in Texas (Scientific Research: Quasi-experimental series). Wisconsin Rapids, WI: Author.Nunnery, J. A., Ross, S. M., & Goldfeder, E. (2003). The effect of School Renaissance on TAAS scores in the
McKinney ISD. Memphis, TN: Center for Research in Educational Policy. Retrieved from https://eric.ed.gov/?id=ED500027
Renaissance Learning, Inc. (1999). Accelerated Math and Math Renaissance improves math performance (Scientific Research: Quasi-experimental series). Wisconsin Rapids, WI: Author. The study does not meet WWC group design standards because the measures of effectiveness cannot be attributed solely to the intervention.
Renaissance Learning, Inc. (2000). Accelerated Math: Pilot schools report. Wisconsin Rapids, WI: Author. The study does not meet WWC group design standards because the measures of effectiveness cannot be attributed solely to the intervention.
Renaissance Learning, Inc. (2017). Special report: Trends in student outcome measures: The role of individualized math practice. Wisconsin Rapids, WI: Author. The study does not meet WWC group design standards because equivalence of the analytic intervention and comparison groups is necessary and not demonstrated.
Ross, S. M., Nunnery, J. A., Avis, A., & Borek, T. (2005). The effects of School Renaissance on student achievement in two Mississippi school districts: A longitudinal quasi-experimental study. Memphis, TN: Center for Research in Educational Policy. Retrieved from https://eric.ed.gov/?id=ED500028 The study does not meet WWC group design standards because equivalence of the analytic intervention and comparison groups is necessary and not demonstrated.Additional source:Ross, S. M., & Nunnery, J. A. (2005). The effect of School Renaissance on student achievement in two
Mississippi school districts. Memphis, TN: Center for Research in Educational Policy. Retreived from https://eric.ed.gov/?id=ED484275
Rudd, P., & Wade, P. (2006). Evaluation of Renaissance Learning mathematics and reading programs in UK specialist and feeder schools. Slough, UK: National Foundation for Educational Research. Retrieved from https://eric.ed.gov/?id=ED502474 The study does not meet WWC group design standards because equivalence of the analytic intervention and comparison groups is necessary and not demonstrated.
Stanley, A. M. (2011). Accelerated Mathematics and high-ability students’ math achievement in grades three and four (Doctoral dissertation). East Tennessee State University, Johnson City. Retrieved from https://eric.ed.gov/?id=ED532232 The study does not meet WWC group design standards because equivalence of the analytic intervention and comparison groups is necessary and not demonstrated.
Ysseldyke, J., Spicuzza, R., Kosciolek, S., Teelucksingh, E., Boys, C., & Lemkuil, A. (2003). Using a curriculum-based instructional management system to enhance math achievement in urban schools. Journal of Education for Students Placed at Risk, 8(2), 247–265. Retrieved from https://eric.ed.gov/?id=EJ669082 The study does not meet WWC group design standards because it only includes outcomes that are over aligned with the intervention or measured in a way that is inconsistent with the protocol.Additional sources:Renaissance Learning, Inc. (2001). Accelerated Math® leads to statistically significant growth on the Northwest
Achievement Levels Test. Students at all skill levels achieve more. (Scientific Research: Quasi-experimental series). Wisconsin Rapids, WI: Author.
Accelerated Math® December 2017 Page 10
WWC Intervention Report
Spicuzza, R., Ysseldyke, J., Lemkuil, A., McGill, S., Boys, C., & Teelucksingh, E. (2001). Effects of curriculum-based monitoring on classroom instruction and math achievement. Journal of School Psychology, 39(6), 521–542. Retrieved from https://eric.ed.gov/?id=EJ640489
Spicuzza, R., Ysseldyke, J. E., Lemkuil, A., Kosciolek, S., Boys, C., & Teelucksingh, E. (2001). Effects of using a curriculum-based monitoring system on the classroom instructional environment and math achievement. Minneapolis: National Center on Educational Outcomes, University of Minnesota
Ysseldyke, J., Spicuzza, R., Kosciolek, S., & Boys, C. (2003). Effects of a learning information system on mathematics achievement and classroom structure. Journal of Educational Research, 96(3), 163–173. Retrieved from https://eric.ed.gov/?id=EJ670579
Ysseldyke, J. E., Spicuzza, R., & McGill, S. (2000). Changes in mathematics achievement and instructional ecology resulting from implementation of a learning information system. Minneapolis: National Center on Educational Outcomes, University of Minnesota.
Zumwalt, D. B. (2001). The effectiveness of computer-aided instruction in eighth-grade pre-algebra classrooms in Idaho (Unpublished doctoral dissertation). Idaho State University, Pocatello. The study does not meet WWC group design standards because equivalence of the analytic intervention and comparison groups is necessary and not demonstrated.
Studies that are ineligible for review using the Primary Mathematics Evidence Review ProtocolBach, S. (2001). An evaluation of Accelerated Math in a seventh grade classroom. Wisconsin Rapids, WI:
Renaissance Learning, Inc. The study is ineligible for review because it is out of the scope of the protocol.Beyer, R. (2008). Curriculum-based monitoring with diagnostic analysis: A fourth grade homework intervention
(Unpublished doctoral dissertation). Saint Mary’s University of Minnesota, Minneapolis. The study is ineligible for review because it does not use an eligible design.
Burns, M. K., Kanive, R., & DeGrande, M. (2012). Effect of a computer-delivered math fact intervention as a supplemental intervention for math in third and fourth grades. Remedial and Special Education, 33(3), 184–191. Retrieved from https://eric.ed.gov/?id=EJ964991 The study is ineligible for review because it is out of the scope of the protocol.
Burns, M. K., Ysseldyke, J., Nelson, P. M., & Kanive, R. (2015). Number of repetitions required to retain single digit multiplication math facts for elementary students. School Psychology Quarterly, 30(3), 398–405. The study is ineligible for review because it is out of the scope of the protocol.
Cosenza, M. N. (2009). An evaluation of the Accelerated Math and Excel Math programs (Unpublished manuscript). California Lutheran University, Thousand Oaks. The study is ineligible for review because it does not use an eligible design.
Crawford, L. (2013). Effects of an online mathematics curriculum for English language learners. Computers in the Schools, 30(3), 248–270. The study is ineligible for review because it is out of the scope of the protocol.
Gaeddert, T. J. (2001). Using Accelerated Math to enhance student achievement in high school mathematics courses (Unpublished master’s thesis). Friends University, Wichita, KS. Retrieved from https://eric.ed.gov/?id=ED463177 The study is ineligible for review because it is out of the scope of the protocol.
Hongerholt, M. (2006). The effect of the Accelerated Math program on the Minnesota basic skills test scores of ninth graders (Unpublished master’s thesis). Winona State University, MN. The study is ineligible for review because it is out of the scope of the protocol.
Kanive, R., Nelson, P. M., Burns, M. K., & Ysseldyke, J. (2014). Comparison of the effects of computer-based practice and conceptual understanding interventions on mathematics fact retention and generalization. Journal of Educational Research, 107(2), 83–89. Retrieved from https://eric.ed.gov/?id=EJ1028446 The study is ineligible for review because it is out of the scope of the protocol.
Accelerated Math® December 2017 Page 11
WWC Intervention Report
Kerns, G. M. (2005). Moving from good to great: The evolution of learning information systems in Milford school district (Delaware). Dissertation Abstracts International 65(12A), 157-4416. The study is ineligible for review because it does not use an eligible design.
Kosciolek, S. A. (2003). Instructional factors related to mathematics achievement: Evaluation of a mathematics intervention (Doctoral dissertation). Available from ProQuest Dissertations and Theses database. (UMI No. 3107933) The study is ineligible for review because it does not use an eligible design.
Lekwa, A. J. (2012). Technology-enhanced formative assessment in mathematics for English language learners (Unpublished doctoral dissertation). University of Minnesota, Minneapolis. Retrieved from https://eric.ed.gov/?id=ED551876 The study is ineligible for review because it did not use an eligible design.Additional source: Renaissance Learning, Inc. (2014). Accelerated Math™ promotes math skills development for English learners.
Wisconsin Rapids, WI: Author.McDonald, N., Trautman, T., & Blick, L. (2005). Computer-assisted middle school mathematics remediation
intervention: An outcome study. Oklahoma City, OK: The American Education Corporation. The study is ineligible for review because it is out of the scope of the protocol.
Metcalf, E. B. (2005). Accelerated Math implementation and elementary student achievement and attitudes (Unpublished master’s thesis). University of North Carolina, Wilmington. The study is ineligible for review because it is out of the scope of the protocol.
Nobiensky, C., & Smith, A. (2005). Accelerated Math helps the Wisconsin Center for Academically Talented Youth rapidly advance mathematics skills of students in its accelerated learning program. Wisconsin Rapids, WI: Renaissance Learning, Inc. The study is ineligible for review because it did not use an eligible design.
Renaissance Learning, Inc. (2001). Accelerated Math: Canadian pilot schools report. Wisconsin Rapids, WI: Author. The study is ineligible for review because it does not use an eligible design.
Renaissance Learning, Inc. (2002). Accelerated Math Fluency™ leads to growth in computational fluency. Wisconsin Rapids, WI: Educational Research Department, Renaissance Learning. The study is ineligible for review because it is out of the scope of the protocol.
Renaissance Learning, Inc. (2002). Elementary school achieves big gains on Michigan educational assessment program. Wisconsin Rapids, WI: Educational Research Department, Renaissance Learning. The study is ineligible for review because it does not use an eligible design.
Renaissance Learning, Inc. (2002). Inner-city school more than doubles passing rates on North Carolina end-of-grade test. Wisconsin Rapids, WI: Educational Research Department, Renaissance Learning. The study is ineligible for review because it does not use an eligible design.
Renaissance Learning, Inc. (2004). Achievement gap at a Texas elementary school reduced by 88%. Wisconsin Rapids, WI: Educational Research Department, Renaissance Learning. The study is ineligible for review because it does not use an eligible design.
Renaissance Learning, Inc. (2004). Average number of students meeting Delaware state standards increases by more than 15 percentage points. Wisconsin Rapids, WI: Education Research Department, Renaissance Learning. The study is ineligible for review because it does not use an eligible design.
Renaissance Learning, Inc. (2004). First and second grade students demonstrate accelerated growth with Math Renaissance: Union County Primary School, Blairsville, Georgia. Wisconsin Rapids, WI: Author. The study is ineligible for review because it does not use an eligible design.
Renaissance Learning, Inc. (2004). Increased achievement on ITBS scores directly relates to the implementation level of math management software. Wisconsin Rapids, WI: Educational Research Department, Renaissance Learning. The study is ineligible for review because it does not use an eligible design.
Renaissance Learning, Inc. (2004). Percentage of students scoring “at or above grade level” on Minnesota Comprehensive Assessment increases 43.5 points. Wisconsin Rapids, WI: Educational Research Department, Renaissance Learning. The study is ineligible for review because it does not use an eligible design.
Accelerated Math® December 2017 Page 12
WWC Intervention Report
Renaissance Learning, Inc. (2005). Iowa school boosts Iowa Test of Basic Skills reading and math scores: Richardson Elementary School. Wisconsin Rapids, WI: Author. The study is ineligible for review because it does not use an eligible design.
Renaissance Learning, Inc. (2005). Washington school dramatically improves reading and math state test scores. Wisconsin Rapids, WI: Author. The study is ineligible for review because it does not use an eligible design.
Renaissance Learning, Inc. (2006). Iowa elementary school pairs best practices with student motivation and sees significant gains in Iowa Test of Basic Skills scores: Hawthorne Elementary School. Wisconsin Rapids, WI: Author. The study is ineligible for review because it does not use an eligible design.
Renaissance Learning, Inc. (2006). Reading and math state test scores climb at rural Texas school: Finley-Oates Elementary School. Wisconsin Rapids, WI: Author. The study is ineligible for review because it does not use an eligible design.
Renaissance Learning, Inc. (2007). Accelerated Math software and best practices: Key scientifically based research summary. Wisconsin Rapids, WI: Author. The study is ineligible for review because it does not use an eligible design.
Renaissance Learning, Inc. (2007). Junior high school credits impact of Renaissance tools with recognition in Texas accountability ratings. Wisconsin Rapids, WI: Author. The study is ineligible for review because it does not use an eligible design.
Renaissance Learning, Inc. (2007). Research summary: Renaissance Learning UK. London: Renaissance Learning UK Limited. The study is ineligible for review because it does not use an eligible design.
Renaissance Learning, Inc. (2007). Test scores on the rise and library growth skyrocketing at Indiana elementary school. Wisconsin Rapids, WI: Author. The study is ineligible for review because it does not use an eligible design.
Renaissance Learning, Inc. (2007). Texas junior high school makes extensive gains on the TAKS. Wisconsin Rapids, WI: Author. The study is ineligible for review because it does not use an eligible design.
Renaissance Learning, Inc. (2010). The Research Foundation for Accelerated Math for Intervention: Evidence-based strategies to help students struggling in mathematics. Wisconsin Rapids, WI: Author. The study is ineligible for review because it does not use an eligible design.
Renaissance Learning, Inc. (2011). The development of the Accelerated Math Second-Edition Libraries. Wisconsin Rapids, WI: Author. The study is ineligible for review because it does not use an eligible design.
Renaissance Learning, Inc. (2012). Arkansas schools awarded smallest improvement grants see biggest gains with Renaissance tools. Wisconsin Rapids, WI: Author. The study is ineligible for review because it does not use an eligible design.
Renaissance Learning, Inc. (2012). Using Renaissance Learning programs to support vocabulary development. Wisconsin Rapids, WI: Author. The study is ineligible for review because it does not use an eligible design.
Renaissance Learning, Inc. (2015). The Research Foundation for Accelerated Math Fluency: The critical role of automaticity in accelerating math achievement. Wisconsin Rapids, WI: Author. The study is ineligible for review because it is out of the scope of the protocol.
Renaissance Learning, Inc. (2016). The Research Foundation for Accelerated Math. Wisconsin Rapids, WI: Author. The study is ineligible for review because it does not use an eligible design.
Richter, M. P. (2006). The effect of a supplemental mathematics support class (Accelerated Math) on students’ academic achievement. Unpublished master’s thesis, California State University, Stanislaus. The study is ineligible for review because it is out of the scope of the protocol.
Rock, M. L. (2005). Use of strategic self-monitoring to enhance academic engagement, productivity, and accuracy of students with and without exceptionalities. Journal of Positive Behavior Interventions, 7(1), 3–17. Retrieved from https://eric.ed.gov/?id=EJ806870 The study is ineligible for review because it is out of the scope of the protocol.
Accelerated Math® December 2017 Page 13
WWC Intervention Report
Scott, A. M. (2005). A quantitative examination of Title I and non-Title I elementary schools in East Tennessee using fourth grade math and reading standardized test scores (Unpublished doctoral dissertation). East Tennessee State University, Johnson City. The study is ineligible for review because it is out of the scope of the protocol.
Shapiro, E. S., Dennis, M. S., & Fu, Q. (2015). Comparing computer adaptive and curriculum-based measures of math in progress monitoring. School Psychology Quarterly, 30(4), 470–487. Retrieved from https://eric.ed.gov/?id=EJ1083874 The study is ineligible for review because it is out of the scope of the protocol.
Shapiro, E. S., & Gebhardt, S. N. (2012). Comparing computer-adaptive and curriculum-based measurement methods of assessment. School Psychology Review, 41(3), 295–305. Retrieved from https://eric.ed.gov/?id=EJ1001214 The study is ineligible for review because it is out of the scope of the protocol.
Shields, J., Rapaport, A. S., Adachi, E., Montgomery, E. W., & Adams, L. J. (2007). Accelerated Reading Instruction/Accelerated Math Instruction (ARI/AMI) program: Updated performance review. Austin: Texas Education Agency. The study is ineligible for review because it does not use an eligible design.Additional sources: Adams, L. J., Sievert, J., & Rapaport, A. S. (2007). Evaluation of Accelerated Reading Instruction (ARI) and
Accelerated Math Instruction (AMI) program: 2005-2006 school year. Austin: Texas Education Agency. Castañeda, S., & Moellmer, A. (2005). Evaluation of the Accelerated Reading Instruction (ARI) and Accelerated
Math Instruction (AMI) program: 2003-2004 school year. Austin: Texas Education Agency.Wu, L., Winkler, A., Castañeda, S., & Green, A. (2006). Evaluation of Accelerated Reading Instruction (ARI) and
Accelerated Math Instruction (AMI) program: 2004-2005 school year. Austin: Texas Education Agency.Shirvani, H. (2010). The effects of using computer technology with lower-performing students: Technology and
student mathematics achievement. International Journal of Learning, 17(1), 143–154. The study is ineligible for review because it is out of the scope of the protocol.
Spicuzza, R., & Ysseldyke, J. E. (1999). Using Accelerated Math to enhance instruction in a mandated summer school program. Minneapolis, MN: Minneapolis Public Schools. The study is ineligible for review because it does not use an eligible design.
Springer, M. (2007). Using Accelerated Math for intervention with at-risk students (Unpublished master’s thesis). St. Mary’s College of California, Moraga. The study is ineligible for review because it is out of the scope of the protocol.
Springer, R. M., Pugalee, D., & Algozzine, B. (2007). Improving mathematics skills of high school students. Clearing House: A Journal of Educational Strategies, Issues and Ideas, 81(1), 37–44. Retrieved from https://eric.ed.gov/?id=EJ781748 The study is ineligible for review because it does not use a sample aligned with the protocol.Additional source: Semones, M., & Springer, R. M. (2005). Struggling high school students using Accelerated Math pass AIMS
test. Wisconsin Rapids, WI: Renaissance Learning, Inc. Stessman, M. (2006). Closing the economic achievement gap: A case study of a successful Kansas secondary
school (Unpublished master’s thesis). Wichita State University, KS. The study is ineligible for review because it is out of the scope of the protocol.
Stickney, E. M., Sharp, L. B., & Kenyon, A. S. (2012). Technology-enhanced assessment of math fact automaticity: Patterns of performance for low- and typically achieving students. Assessment for Effective Intervention, 37(2), 84–94. Retrieved from https://eric.ed.gov/?id=EJ955510 The study is ineligible for review because it is out of the scope of the protocol.Additional source: Renaissance Learning, Inc. (2012). Math facts practice pays off. Wisconsin Rapids, WI: Author.
Theisen, W. (2006). Will the implementation of individualized self-paced instruction via the Accelerated Math software program improve math competency for target math students? (Unpublished master’s thesis). Winona State University, MN. The study is ineligible for review because it is out of the scope of the protocol.
Accelerated Math® December 2017 Page 14
WWC Intervention Report
Vannatta, C. H. (2001). Integrating Accelerated Math into the high school classroom (Unpublished master’s thesis). Minot State University, ND. The study is ineligible for review because it is out of the scope of the protocol.
Walker Driesel, D. (2013). Mathematics interventions: A correlational study of the relationship between level of implementation of the Accelerated Math program and student achievement (Doctoral dissertation). Retrieved from https://eric.ed.gov/?id=ED564886 The study is ineligible for review because it does not use an eligible design.
West, M. D. (2005). The effectiveness of using Accelerated Math to increase student mathematical achievement and its impact on student and parent attitudes toward mathematics (Unpublished master’s thesis). University of Georgia, Athens. The study is ineligible for review because it is out of the scope of the protocol.
Ysseldyke, J., Thill, T., Pohl, J., & Bolt, D. (2005). Using MathFacts in a Flash to enhance computational fluency. Journal of Evidence Based Practices for Schools, 6(1), 59–89. The study is ineligible for review because it is out of scope of the protocol.
Accelerated Math® December 2017 Page 15
Appendix A.1: Research details for Caputo (2007)
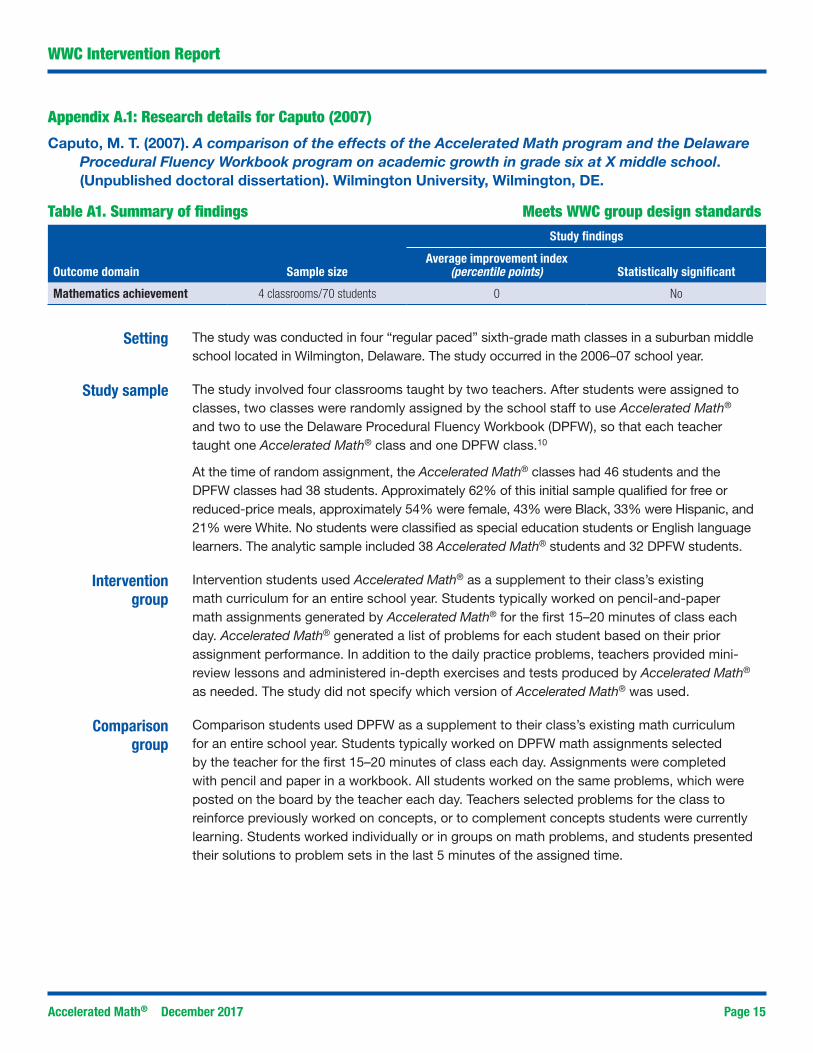
Caputo, M. T. (2007). A comparison of the effects of the Accelerated Math program and the Delaware Procedural Fluency Workbook program on academic growth in grade six at X middle school. (Unpublished doctoral dissertation). Wilmington University, Wilmington, DE.
Table A1. Summary of findings Meets WWC group design standardsStudy findings
Outcome domain Sample sizeAverage improvement index
(percentile points) Statistically significant
Mathematics achievement 4 classrooms/70 students 0 No
Setting The study was conducted in four “regular paced” sixth-grade math classes in a suburban middle school located in Wilmington, Delaware. The study occurred in the 2006–07 school year.
Study sample The study involved four classrooms taught by two teachers. After students were assigned to classes, two classes were randomly assigned by the school staff to use Accelerated Math® and two to use the Delaware Procedural Fluency Workbook (DPFW), so that each teacher taught one Accelerated Math® class and one DPFW class.10
At the time of random assignment, the Accelerated Math® classes had 46 students and the DPFW classes had 38 students. Approximately 62% of this initial sample qualified for free or reduced-price meals, approximately 54% were female, 43% were Black, 33% were Hispanic, and 21% were White. No students were classified as special education students or English language learners. The analytic sample included 38 Accelerated Math® students and 32 DPFW students.
Intervention group
Intervention students used Accelerated Math® as a supplement to their class’s existing math curriculum for an entire school year. Students typically worked on pencil-and-paper math assignments generated by Accelerated Math® for the first 15–20 minutes of class each day. Accelerated Math® generated a list of problems for each student based on their prior assignment performance. In addition to the daily practice problems, teachers provided mini-review lessons and administered in-depth exercises and tests produced by Accelerated Math® as needed. The study did not specify which version of Accelerated Math® was used.
Comparison group
Comparison students used DPFW as a supplement to their class’s existing math curriculum for an entire school year. Students typically worked on DPFW math assignments selected by the teacher for the first 15–20 minutes of class each day. Assignments were completed with pencil and paper in a workbook. All students worked on the same problems, which were posted on the board by the teacher each day. Teachers selected problems for the class to reinforce previously worked on concepts, or to complement concepts students were currently learning. Students worked individually or in groups on math problems, and students presented their solutions to problem sets in the last 5 minutes of the assigned time.
WWC Intervention Report

Accelerated Math® December 2017 Page 16
WWC Intervention Report
Outcomes and measurement
Student achievement was measured with three outcomes. The Delaware Student Testing Program (DSTP) for mathematics is a mandated statewide assessment that measures a student’s performance at their assigned grade level standards. The Northwest Evaluation Association Measures of Academic Progress (NWEA MAP) is a computer adaptive test, which aligns to the Delaware State Standards. The STAR Math test is a computer adaptive, norm-referenced test developed by Renaissance Learning. For the DSTP and STAR Math tests, the outcomes were measured using sixth-grade scale scores. For the NWEA MAP, the outcome was measured using sixth-grade Rasch Unit (RIT) scores. All students in the study were pre- and posttested using all three tests. The STAR Math and NWEA MAP pre- and posttests were administered at the beginning and end of the sixth-grade year (in September 2006 and May 2007), respectively. For DSTP, participating students’ fifth-grade March 2005 scores were used as the pretest, and the posttest was administered in March 2007. For a more detailed description of these outcome measures, see Appendix B.
Support for implementation
According to the study author, one of the study teachers used Accelerated Math® prior to the study, while the other had not. Neither teacher had previously used DPFW. The teachers received training on each program prior to the study pretest; however, no details about the training were provided. A substitute teacher took over one teacher’s classrooms for 2 months during the study. The substitute was supported by the regular classroom teacher via daily telephone calls and weekly class visits.
Accelerated Math® December 2017 Page 17
Appendix A.2: Research details for Lambert et al. (2014)
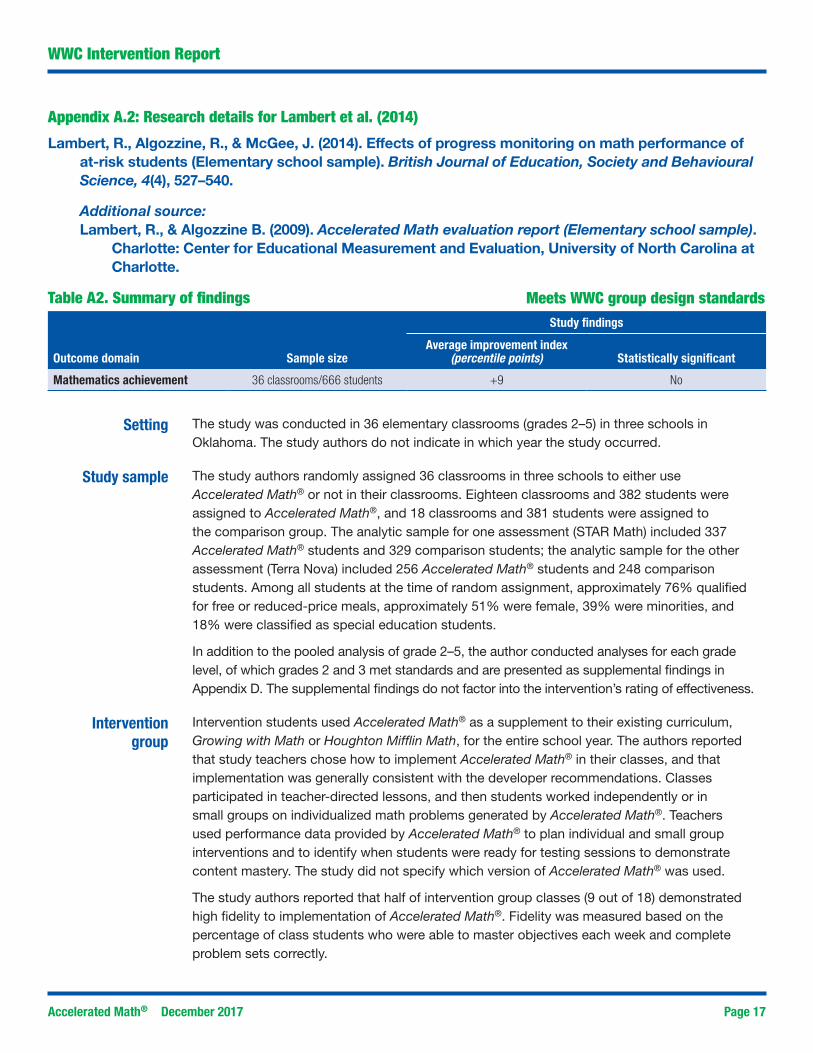
Lambert, R., Algozzine, R., & McGee, J. (2014). Effects of progress monitoring on math performance of at-risk students (Elementary school sample). British Journal of Education, Society and Behavioural Science, 4(4), 527–540.
Additional source:Lambert, R., & Algozzine B. (2009). Accelerated Math evaluation report (Elementary school sample).
Charlotte: Center for Educational Measurement and Evaluation, University of North Carolina at Charlotte.
Table A2. Summary of findings Meets WWC group design standardsStudy findings
Outcome domain Sample sizeAverage improvement index
(percentile points) Statistically significant
Mathematics achievement 36 classrooms/666 students +9 No
Setting The study was conducted in 36 elementary classrooms (grades 2–5) in three schools in Oklahoma. The study authors do not indicate in which year the study occurred.
Study sample The study authors randomly assigned 36 classrooms in three schools to either use Accelerated Math® or not in their classrooms. Eighteen classrooms and 382 students were assigned to Accelerated Math®, and 18 classrooms and 381 students were assigned to the comparison group. The analytic sample for one assessment (STAR Math) included 337 Accelerated Math® students and 329 comparison students; the analytic sample for the other assessment (Terra Nova) included 256 Accelerated Math® students and 248 comparison students. Among all students at the time of random assignment, approximately 76% qualified for free or reduced-price meals, approximately 51% were female, 39% were minorities, and 18% were classified as special education students.
In addition to the pooled analysis of grade 2–5, the author conducted analyses for each grade level, of which grades 2 and 3 met standards and are presented as supplemental findings in Appendix D. The supplemental findings do not factor into the intervention’s rating of effectiveness.
Intervention group
Intervention students used Accelerated Math® as a supplement to their existing curriculum, Growing with Math or Houghton Mifflin Math, for the entire school year. The authors reported that study teachers chose how to implement Accelerated Math® in their classes, and that implementation was generally consistent with the developer recommendations. Classes participated in teacher-directed lessons, and then students worked independently or in small groups on individualized math problems generated by Accelerated Math®. Teachers used performance data provided by Accelerated Math® to plan individual and small group interventions and to identify when students were ready for testing sessions to demonstrate content mastery. The study did not specify which version of Accelerated Math® was used.
The study authors reported that half of intervention group classes (9 out of 18) demonstrated high fidelity to implementation of Accelerated Math®. Fidelity was measured based on the percentage of class students who were able to master objectives each week and complete problem sets correctly.
WWC Intervention Report

Accelerated Math® December 2017 Page 18
WWC Intervention Report
Comparison group
Comparison students used a traditional math curriculum already in place in the schools, either Growing With Math or Houghton Mifflin Math. The authors do not report the number of classes using each text.
Outcomes and measurement
The study includes two outcomes that meet review requirements. The STAR Math test is a computer adaptive, norm-referenced test developed by Renaissance Learning. The Terra Nova Math test is a nationally normed, standardized test aligned with the National Assessment of Educational Progress (NAEP) standards. Outcome measures for both tests were standardized as Normal Curve Equivalent (NCE) scores, which provide common scaling of scores across grade levels. Students were assessed using a pretest in December and a posttest in May/June (the authors do not indicate in which years testing occurred). For a more detailed description of these outcome measures, see Appendix B.
Support for implementation
Renaissance Learning, the developer of the intervention, provided study teachers with professional development and periodic support in implementing Accelerated Math®. Details about this support were not provided by the authors.
Accelerated Math® December 2017 Page 19
Appendix A.3: Research details for Lambert and Algozzine (2009)
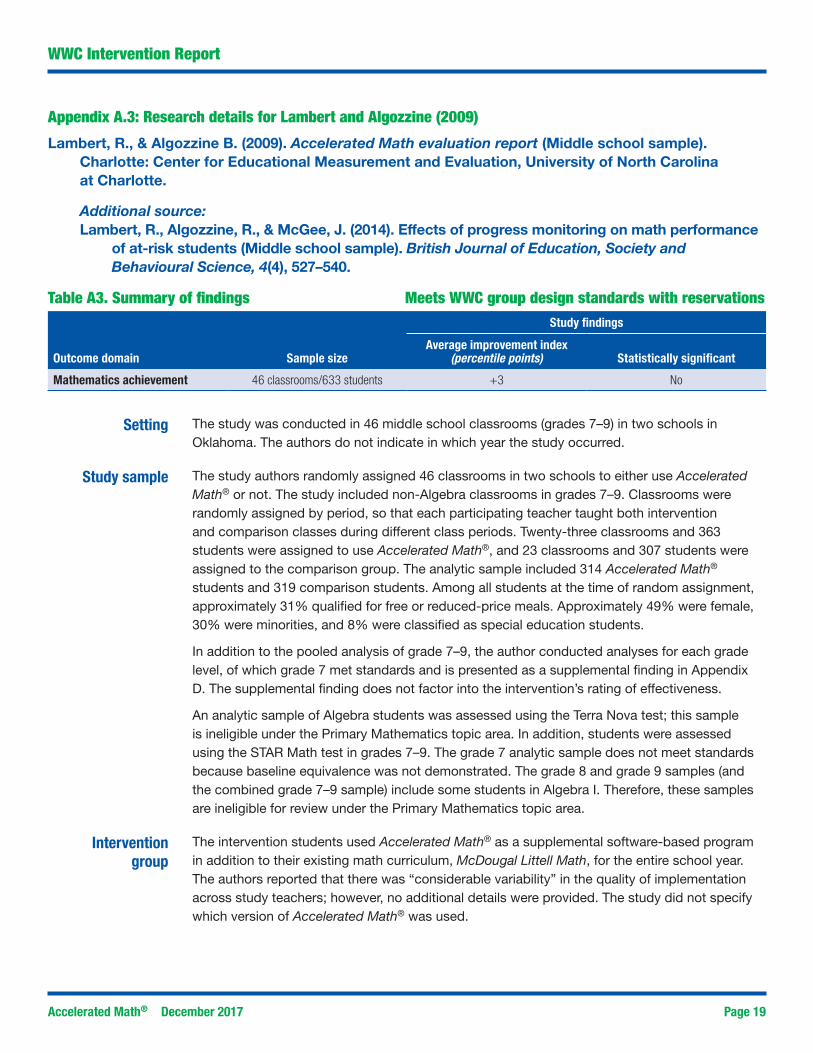
Lambert, R., & Algozzine B. (2009). Accelerated Math evaluation report (Middle school sample). Charlotte: Center for Educational Measurement and Evaluation, University of North Carolina at Charlotte.
Additional source:Lambert, R., Algozzine, R., & McGee, J. (2014). Effects of progress monitoring on math performance
of at-risk students (Middle school sample). British Journal of Education, Society and Behavioural Science, 4(4), 527–540.
Table A3. Summary of findings Meets WWC group design standards with reservationsStudy findings
Outcome domain Sample sizeAverage improvement index
(percentile points) Statistically significant
Mathematics achievement 46 classrooms/633 students +3 No
Setting The study was conducted in 46 middle school classrooms (grades 7–9) in two schools in Oklahoma. The authors do not indicate in which year the study occurred.
Study sample The study authors randomly assigned 46 classrooms in two schools to either use Accelerated Math® or not. The study included non-Algebra classrooms in grades 7–9. Classrooms were randomly assigned by period, so that each participating teacher taught both intervention and comparison classes during different class periods. Twenty-three classrooms and 363 students were assigned to use Accelerated Math®, and 23 classrooms and 307 students were assigned to the comparison group. The analytic sample included 314 Accelerated Math® students and 319 comparison students. Among all students at the time of random assignment, approximately 31% qualified for free or reduced-price meals. Approximately 49% were female, 30% were minorities, and 8% were classified as special education students.
In addition to the pooled analysis of grade 7–9, the author conducted analyses for each grade level, of which grade 7 met standards and is presented as a supplemental finding in Appendix D. The supplemental finding does not factor into the intervention’s rating of effectiveness.
An analytic sample of Algebra students was assessed using the Terra Nova test; this sample is ineligible under the Primary Mathematics topic area. In addition, students were assessed using the STAR Math test in grades 7–9. The grade 7 analytic sample does not meet standards because baseline equivalence was not demonstrated. The grade 8 and grade 9 samples (and the combined grade 7–9 sample) include some students in Algebra I. Therefore, these samples are ineligible for review under the Primary Mathematics topic area.
Intervention group
The intervention students used Accelerated Math® as a supplemental software-based program in addition to their existing math curriculum, McDougal Littell Math, for the entire school year. The authors reported that there was “considerable variability” in the quality of implementation across study teachers; however, no additional details were provided. The study did not specify which version of Accelerated Math® was used.
WWC Intervention Report

Accelerated Math® December 2017 Page 20
WWC Intervention Report
Comparison The comparison students used McDougal Littell Math, a traditional math curriculum already
group implemented in the district.
Outcomes and measurement
The outcome measure was the Terra Nova Math test, a nationally normed, standardized test aligned with the National Assessment of Educational Progress (NAEP) standards. The outcome was measured using NCE scores, which provide common scaling of scores across grade levels. Students in grades 7–9 were pre- and posttested in the fall and spring (the authors do not indicate in which months or years testing occurred). For a more detailed description of this outcome measure, see Appendix B.
Support for implementation
The study does not specify how much training or support intervention teachers received.

Accelerated Math® December 2017 Page 21
Appendix A.4: Research details for Lehmann and Seeber (2005)
Lehmann, R. H., & Seeber, S. (2005). Accelerated Mathematics in grades 4 through 6: Evaluation of an experimental program in 15 schools in North Rhine-Westphalia. Berlin: Humboldt University.
Additional source:Lehmann, R. H., & Seeber, S. (2005). Accelerated Mathematics in grades 4–6: Summary of a quasi-
experimental study in North Rhine-Westphalia, Germany. Madison, WI: Renaissance Learning, Inc.
Table A4. Summary of findings Meets WWC group design standards with reservationsStudy findings
Outcome domain Sample sizeAverage improvement index
(percentile points) Statistically significant
Mathematics achievement 47 classrooms/1,131 students +2 No
Setting The study included students in grades 4–6 in 14 schools in the German state of North Rhine-Westphalia. Data collection occurred between February and July of 2004.
Study sample Fourteen schools in the German state of North Rhine-Westphalia implemented a pilot version German adaptation of Accelerated Math® in 2004. Within grade in each of the 14 schools, classes were intentionally selected to use AM and matching classes served as the comparison group. The study involved primary schools and secondary schools with classes participating in fourth through sixth grade. The analytic sample, pooled by the WWC across grades 4–6, included 47 classrooms (22 Accelerated Math® and 25 comparison) and 1,131 students (518 Accelerated Math® and 613 comparison). The study does not provide demographic information about the sample.11
The authors conducted analyses separately by grade level, of which grades 5 and 6 met standards and are presented as supplemental findings in Appendix D. The supplemental findings do not factor into the intervention’s rating of effectiveness.
Intervention group
Intervention students implemented a pilot, German-language version of Accelerated Math® as a supplement to their existing math curriculum. In this pilot version of Accelerated Math®, student content and materials were translated into German while instructor materials were in English. Intervention students used Accelerated Math® for a minimum of 4 months prior to completing the posttest.
The study does not report how Accelerated Math® was used in the classroom; however, the authors report that there was significant variation in the quality of implementation. In grades 4 and 5, five classrooms out of 13 implemented the program only minimally or partially. The same information is not reported for grade 6. The study does not indicate how minimal or partial implementation was defined or measured.
Comparison group
Comparison students used their schools’ existing math curriculum. The study did not describe or name the curriculum.
WWC Intervention Report
Accelerated Math® December 2017 Page 22
WWC Intervention Report
Outcomes and measurement
The outcome measure was the Hamburger Schulleistungstest (HST). The HST is a standardized math exam in Germany, and the authors converted the raw test scores to proficiency scores using Item Response Theory (IRT). Parallel test forms were used at pretest and posttest. Students were assessed using a pretest in February/March and a posttest in June/July of 2004. For a more detailed description of this outcome measure, see Appendix B.
The study presents several outcomes that are ineligible for review under the Primary Mathematics review protocol, including an intelligence test (at pretest only) and surveys of teacher and student attitudes.
Support for implementation
The study does not specify how much training or support intervention teachers received.
Accelerated Math® December 2017 Page 23
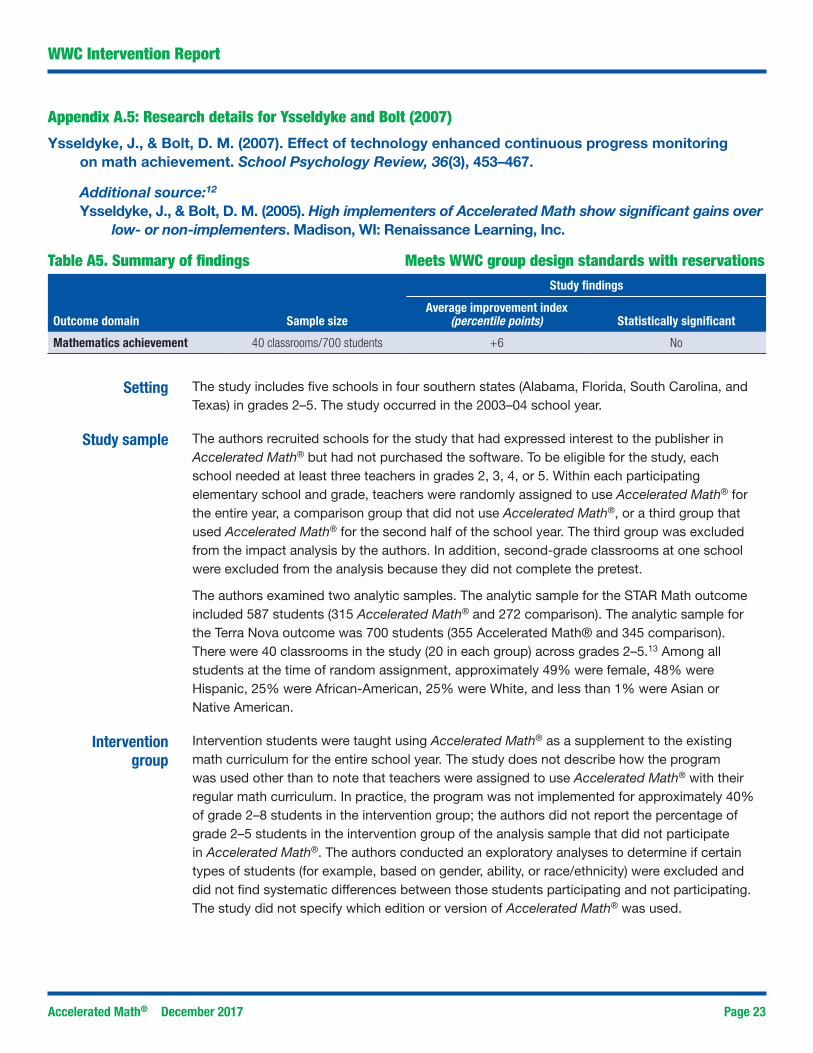
Appendix A.5: Research details for Ysseldyke and Bolt (2007)
Ysseldyke, J., & Bolt, D. M. (2007). Effect of technology enhanced continuous progress monitoring on math achievement. School Psychology Review, 36(3), 453–467.
Additional source:12 Ysseldyke, J., & Bolt, D. M. (2005). High implementers of Accelerated Math show significant gains over
low- or non-implementers. Madison, WI: Renaissance Learning, Inc.
Table A5. Summary of findings Meets WWC group design standards with reservationsStudy findings
Outcome domain Sample sizeAverage improvement index
(percentile points) Statistically significant
Mathematics achievement 40 classrooms/700 students +6 No
Setting The study includes five schools in four southern states (Alabama, Florida, South Carolina, and Texas) in grades 2–5. The study occurred in the 2003–04 school year.
Study sample The authors recruited schools for the study that had expressed interest to the publisher in Accelerated Math® but had not purchased the software. To be eligible for the study, each school needed at least three teachers in grades 2, 3, 4, or 5. Within each participating elementary school and grade, teachers were randomly assigned to use Accelerated Math® for the entire year, a comparison group that did not use Accelerated Math®, or a third group that used Accelerated Math® for the second half of the school year. The third group was excluded from the impact analysis by the authors. In addition, second-grade classrooms at one school were excluded from the analysis because they did not complete the pretest.
The authors examined two analytic samples. The analytic sample for the STAR Math outcome included 587 students (315 Accelerated Math® and 272 comparison). The analytic sample for the Terra Nova outcome was 700 students (355 Accelerated Math® and 345 comparison). There were 40 classrooms in the study (20 in each group) across grades 2–5.13 Among all students at the time of random assignment, approximately 49% were female, 48% were Hispanic, 25% were African-American, 25% were White, and less than 1% were Asian or Native American.
Intervention group
Intervention students were taught using Accelerated Math® as a supplement to the existing math curriculum for the entire school year. The study does not describe how the program was used other than to note that teachers were assigned to use Accelerated Math® with their regular math curriculum. In practice, the program was not implemented for approximately 40% of grade 2–8 students in the intervention group; the authors did not report the percentage of grade 2–5 students in the intervention group of the analysis sample that did not participate in Accelerated Math®. The authors conducted an exploratory analyses to determine if certain types of students (for example, based on gender, ability, or race/ethnicity) were excluded and did not find systematic differences between those students participating and not participating. The study did not specify which edition or version of Accelerated Math® was used.
WWC Intervention Report

Accelerated Math® December 2017 Page 24
WWC Intervention Report
Comparison Comparison students used their schools’ existing math curriculum, which was Harcourt
group Math or Silver Burdett Math in Alabama, Houghton Mifflin Math Central in Florida and South Carolina, and Sharon Wells Math or Harcourt Math in Texas.
Outcomes and measurement
The study included two outcome measures. The STAR Math test is a computer adaptive, norm-referenced test developed by Renaissance Learning. The Terra Nova Math test is a nationally normed, standardized test aligned with the National Assessment of Educational Progress (NAEP) standards. Outcome measures for both tests were standardized as NCE scores, which provide common scaling of scores across grade levels. Participating students were pretested in October 2003 and posttested in May 2004. Students in the intervention and comparison groups were compared using a linear regression analysis in which posttest scores were regressed on pretest scores (controlling for school effects). These results for students in grades 2–5 were provided to the WWC by the authors. For a more detailed description of these outcome measures, see Appendix B.
Support for implementation
Intervention teachers received three to five visits from a Renaissance Learning Math Consultant to help them implement Accelerated Math® in their classrooms. This support included help on the use of the software’s progress monitoring features, administration of the STAR Math test, and use of the test results to inform student placement. Teachers also had unlimited access to technical support through Renaissance Learning’s toll-free number.

Accelerated Math® December 2017 Page 25
Appendix A.6: Research details for Ysseldyke and Tardrew (2007)
Ysseldyke, J., & Tardrew, S. (2007). Use of a progress monitoring system to enable teachers to differentiate mathematics instruction. Journal of Applied School Psychology, 24(1), 1–28.
Additional source:14 Ysseldyke, J. E., & Tardrew, S. P. (2002). Differentiating math instruction: A large scale study of
Accelerated Math (Final report). Madison, WI: Renaissance Learning, Inc.
Table A6. Summary of findings Meets WWC group design standards with reservationsStudy findings
Outcome domain Sample sizeAverage improvement index
(percentile points) Statistically significant
Mathematics achievement At least 50 teachers/2,006 students
+11 Yes
Setting The study was conducted in 47 schools in 24 states. The eligible sample of students which is reviewed in this report includes grades 3–6. The study did not report the number of schools in this sample.15 The study occurred in the second semester of the 2001–02 school year.
Study sample Principals of the study schools were asked to randomly assign teachers by grade level to the intervention and comparison groups. The authors reported that in some cases, principals purposely selected certain teachers for the intervention; therefore, the integrity of the study’s random assignment was jeopardized. This review is based on an eligible sample of 2,006 students in grades 3–6 (1,038 Accelerated Math® students and 968 comparison students) which was pooled together across grades by the WWC. The study does not report how many teachers were represented in this sample. Among all students in the analytic sample in grades 3–6, approximately 17% qualified for free or reduced-price meals, 49% were female, 5% were learning disabled or in special education, and 3% were English language learners.
The authors conducted analyses separately by grade level in grades 3–6. These grade-level subgroups met standards and are presented as supplemental findings in Appendix D. In addition, the authors conducted a subgroup analysis of gifted and talented students which met standards, and this is presented as a supplemental finding in Appendix D. The supplemental findings do not factor into the intervention’s rating of effectiveness.
Intervention group
Intervention students used Accelerated Math® as a supplement to the existing math curriculum in the second semester of the school year (between January and May). The authors did not specify which version of Accelerated Math® was used.
Comparison group
Comparison students were taught using their school’s existing math curriculum. The authors did not describe or name the curriculum.
WWC Intervention Report
Accelerated Math® December 2017 Page 26
WWC Intervention Report
Outcomes and measurement
The STAR Math test is a computer adaptive, norm-referenced test developed by Renaissance Learning. Students were pretested in January 2002 and posttested in May 2002. Scores were converted to NCEs for the analysis. For a more detailed description of the outcome measure, see Appendix B.
The study presents several outcomes that are ineligible for review under the Primary Mathematics review protocol, including teacher and student attitudes, and teacher instructional practices.
Support for implementation
Intervention teachers participated in a 1-day training session conducted by Renaissance Learning. The training was designed to familiarize teachers with Accelerated Math® and to guide them in integrating it into the curriculum and instruction. Of the 68 Accelerated Math® teachers in the full sample of grades 3–10, 66 attended the training. Teachers faxed weekly reports generated by Accelerated Math® to Renaissance Learning which were used by the publisher to assess integrity of implementation. Analyses of these reports were used to guide phone consultations with teachers to support implementation during the school year. The study does not indicate how often these consultations occurred or whether all intervention group teachers participated.
Accelerated Math® December 2017 Page 27
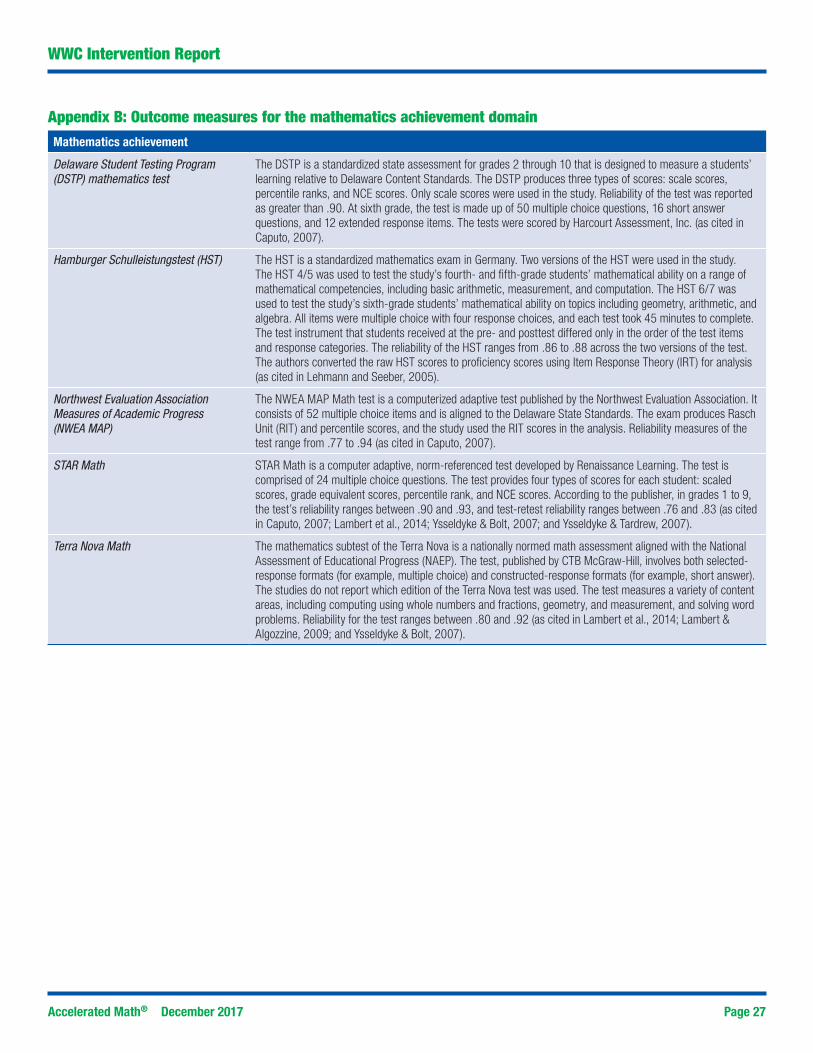
Appendix B: Outcome measures for the mathematics achievement domainMathematics achievement
Delaware Student Testing Program (DSTP) mathematics test
The DSTP is a standardized state assessment for grades 2 through 10 that is designed to measure a students’ learning relative to Delaware Content Standards. The DSTP produces three types of scores: scale scores, percentile ranks, and NCE scores. Only scale scores were used in the study. Reliability of the test was reported as greater than .90. At sixth grade, the test is made up of 50 multiple choice questions, 16 short answer questions, and 12 extended response items. The tests were scored by Harcourt Assessment, Inc. (as cited in Caputo, 2007).
Hamburger Schulleistungstest (HST) The HST is a standardized mathematics exam in Germany. Two versions of the HST were used in the study. The HST 4/5 was used to test the study’s fourth- and fifth-grade students’ mathematical ability on a range of mathematical competencies, including basic arithmetic, measurement, and computation. The HST 6/7 was used to test the study’s sixth-grade students’ mathematical ability on topics including geometry, arithmetic, and algebra. All items were multiple choice with four response choices, and each test took 45 minutes to complete. The test instrument that students received at the pre- and posttest differed only in the order of the test items and response categories. The reliability of the HST ranges from .86 to .88 across the two versions of the test. The authors converted the raw HST scores to proficiency scores using Item Response Theory (IRT) for analysis (as cited in Lehmann and Seeber, 2005).
Northwest Evaluation Association Measures of Academic Progress (NWEA MAP)
The NWEA MAP Math test is a computerized adaptive test published by the Northwest Evaluation Association. It consists of 52 multiple choice items and is aligned to the Delaware State Standards. The exam produces Rasch Unit (RIT) and percentile scores, and the study used the RIT scores in the analysis. Reliability measures of the test range from .77 to .94 (as cited in Caputo, 2007).
STAR Math STAR Math is a computer adaptive, norm-referenced test developed by Renaissance Learning. The test is comprised of 24 multiple choice questions. The test provides four types of scores for each student: scaled scores, grade equivalent scores, percentile rank, and NCE scores. According to the publisher, in grades 1 to 9, the test’s reliability ranges between .90 and .93, and test-retest reliability ranges between .76 and .83 (as cited in Caputo, 2007; Lambert et al., 2014; Ysseldyke & Bolt, 2007; and Ysseldyke & Tardrew, 2007).
Terra Nova Math The mathematics subtest of the Terra Nova is a nationally normed math assessment aligned with the National Assessment of Educational Progress (NAEP). The test, published by CTB McGraw-Hill, involves both selected-response formats (for example, multiple choice) and constructed-response formats (for example, short answer). The studies do not report which edition of the Terra Nova test was used. The test measures a variety of content areas, including computing using whole numbers and fractions, geometry, and measurement, and solving word problems. Reliability for the test ranges between .80 and .92 (as cited in Lambert et al., 2014; Lambert & Algozzine, 2009; and Ysseldyke & Bolt, 2007).
WWC Intervention Report
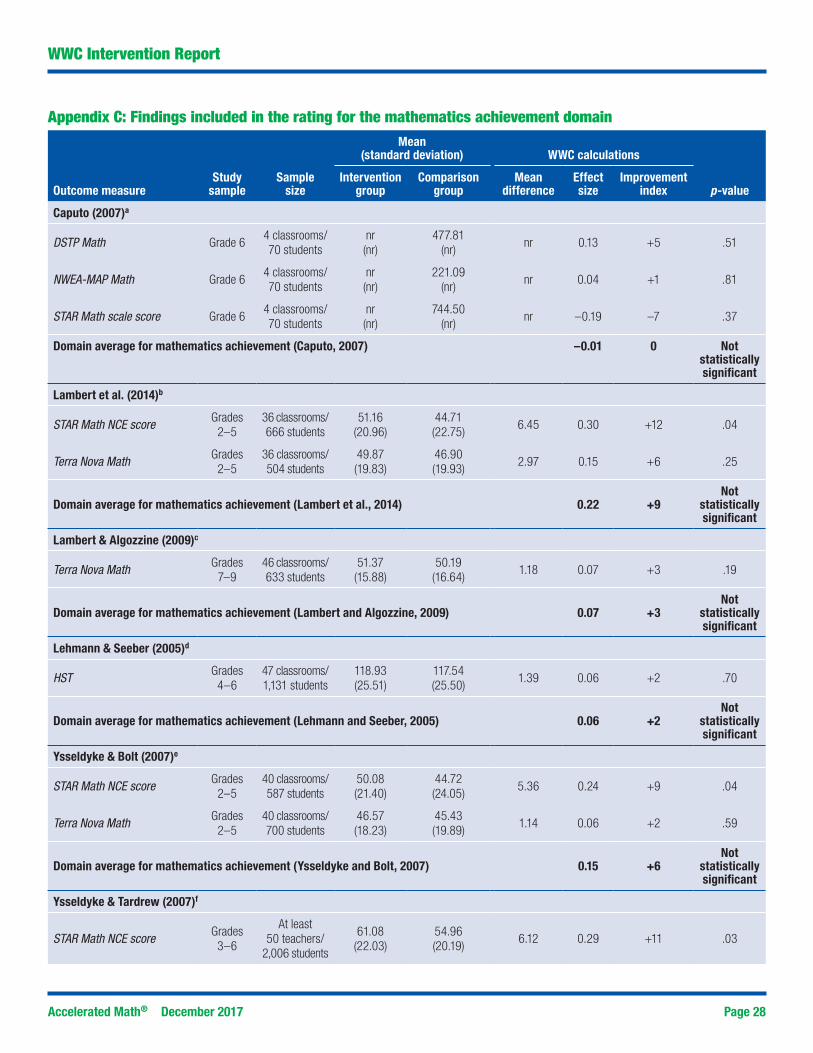
Accelerated Math® December 2017 Page 28
Appendix C: Findings included in the rating for the mathematics achievement domain
Mean(standard deviation) WWC calculations
Outcome measureStudy
sampleSample
sizeIntervention
groupComparison
groupMean
differenceEffect size
Improvement index p-value
Caputo (2007)a
DSTP Math Grade 64 classrooms/ 70 students
nr(nr)
477.81 (nr)
nr 0.13 +5 .51
NWEA-MAP Math Grade 64 classrooms/ 70 students
nr(nr)
221.09 (nr)
nr 0.04 +1 .81
STAR Math scale score Grade 64 classrooms/ 70 students
nr(nr)
744.50(nr)
nr –0.19 –7 .37
Domain average for mathematics achievement (Caputo, 2007) –0.01 0 Not statistically significant
Lambert et al. (2014)b
STAR Math NCE score Grades2–5
36 classrooms/ 666 students
51.16(20.96)
44.71(22.75)
6.45 0.30 +12 .04
Terra Nova Math Grades2–5
36 classrooms/ 504 students
49.87(19.83)
46.90(19.93)
2.97 0.15 +6 .25
Domain average for mathematics achievement (Lambert et al., 2014) 0.22 +9Not
statistically significant
Lambert & Algozzine (2009)c
Terra Nova Math Grades7–9
46 classrooms/ 633 students
51.37(15.88)
50.19(16.64)
1.18 0.07 +3 .19
Domain average for mathematics achievement (Lambert and Algozzine, 2009) 0.07 +3Not
statistically significant
Lehmann & Seeber (2005)d
HST Grades4–6
47 classrooms/ 1,131 students
118.93(25.51)
117.54(25.50)
1.39 0.06 +2 .70
Domain average for mathematics achievement (Lehmann and Seeber, 2005) 0.06 +2Not
statistically significant
Ysseldyke & Bolt (2007)e
STAR Math NCE score Grades2–5
40 classrooms/ 587 students
50.08(21.40)
44.72(24.05)
5.36 0.24 +9 .04
Terra Nova Math Grades2–5
40 classrooms/ 700 students
46.57(18.23)
45.43(19.89)
1.14 0.06 +2 .59
Domain average for mathematics achievement (Ysseldyke and Bolt, 2007) 0.15 +6Not
statistically significant
Ysseldyke & Tardrew (2007)f
STAR Math NCE score Grades 3–6
At least 50 teachers/
2,006 students
61.08(22.03)
54.96(20.19)
6.12 0.29 +11 .03
WWC Intervention Report

Accelerated Math® December 2017 Page 29
WWC Intervention Report
Domain average for mathematics achievement (Ysseldyke and Tardrew, 2007) 0.29 +11 Statistically significant
Domain average for mathematics achievement across all studies 0.13 +5 na
Table Notes: For mean difference, effect size, and improvement index values reported in the table, a positive number favors the intervention group and a negative number favors the comparison group. The effect size is a standardized measure of the effect of an intervention on outcomes, representing the average change expected for all individuals who are given the intervention (measured in standard deviations of the outcome measure). The improvement index is an alternate presentation of the effect size, reflecting the change in an average individual’s percentile rank that can be expected if the individual is given the intervention. The WWC-computed average effect size is a simple average rounded to two decimal places; the average improvement index is calculated from the average effect size. The statistical significance of each study’s domain average was determined by the WWC. Some statistics may not sum as expected due to rounding. NCE = Normal Curve Equivalent. na = not applicable. nr = not reported.a For Caputo (2007), the p-values presented here were reported in the original study from ANCOVA analyses using the pretest as a covariate. The comparison means are unadjusted means. The author did not report adjusted outcome means or outcome standard deviations. Intervention group means and the mean difference are not reported because the author did not provide information to calculate an adjusted intervention group mean. The effect sizes are calculated using the ANCOVA F-statistics and author-reported correlation between pre- and posttest for each test. This study is characterized as having an indeterminate effect because the estimated effect is neither statistically significant nor substantively important (0.25 standard deviations or larger). For more information, please refer to the WWC Procedures and Standards Handbook (version 3.0), p. 26.b For Lambert et al. (2014), the p-values presented here were reported in the original study. A correction for clustering was needed and resulted in a WWC-computed p-value of .08 for STAR Math; therefore, the WWC does not find the result to be statistically significant. For Terra Nova Math, the WWC calculated the intervention group mean using a difference-in-differences approach by adding the impact of the intervention (i.e., difference in mean gains between the intervention and comparison groups) to the unadjusted comparison group posttest means. A similar approach could not be used for the STAR Math outcome as the study did not report pretest means. Thus, for STAR Math, the unadjusted posttest means are presented. Please see the WWC Procedures and Standards Handbook (version 3.0), p. 23 for more information. This study is characterized as having an indeterminate effect because the estimated effect is neither statistically significant nor substantively important (0.25 standard deviations or larger). For more information, please refer to the WWC Procedures and Standards Handbook (version 3.0), p. 26.c For Lambert and Algozzine (2009), the p-values presented here were reported in the original study. The WWC calculated the intervention group mean using a difference-in-differences approach by adding the impact of the intervention (i.e., difference in mean gains between the intervention and comparison groups) to the unadjusted comparison group posttest means. Please see the WWC Procedures and Standards Handbook (version 3.0), p. 23 for more information. This study is characterized as having an indeterminate effect because the estimated effect is neither statistically significant nor substantively important (0.25 standard deviations or larger). For more information, please refer to the WWC Procedures and Standards Handbook (version 3.0), p. 26.d For Lehmann and Seeber (2005), the p-value presented here was computed by the WWC after applying a correction for clustering. The author reported unadjusted HST means and standard deviations separately for grades 4-6. The WWC pooled these grades together to estimate an overall effect size. The WWC calculated the intervention group mean using a difference-in-differences approach by adding the impact of the intervention (i.e., difference in mean gains between the intervention and comparison groups) to the unadjusted comparison group posttest means. Please see the WWC Procedures and Standards Handbook (version 3.0), p. 23 for more information. This study is characterized as having an indeterminate effect because the estimated effect is neither statistically significant nor substantively important (0.25 standard deviations or larger). For more information, please refer to the WWC Procedures and Standards Handbook (version 3.0), p. 26.e For Ysseldyke and Bolt (2007), the p-values presented here were reported in the original study. A correction for clustering was needed and resulted in a WWC-computed p-value of .14 for STAR Math; therefore, the WWC does not find the result to be statistically significant. The intervention group means were obtained by adding the OLS coefficient to the unadjusted comparison group means. These means were obtained from an OLS model controlling for pretest scores and school effects. The study authors provided the WWC with the OLS coefficients, unadjusted comparison group means, and standard deviations for the eligible grade 2–5 sample in response to an author query. The findings in this table differ from the prior Elementary School Math intervention report because that report used OLS results from a model that did not control for school effects. The study indicates that the model with school effects is preferred; thus, those results are used here. The use of an OLS model with school effects did not change the statistical significance or substantive importance of the study findings as compared to the prior report. This study is characterized as having an indeterminate effect because the estimated effect is neither statistically significant nor substantively important (0.25 standard deviations or larger). For more information, please refer to the WWC Procedures and Standards Handbook (version 3.0), p. 26.f For Ysseldyke and Tardrew (2007), the p-value presented here was computed by the WWC after applying a correction for clustering. The authors reported unadjusted means and standard deviations separately for grades 3-6. The WWC pooled these grades together to estimate an overall effect size. An adjustment for clustering was needed; however, the WWC was unable to perform an exact adjustment because the study did not report the number of teachers. However, when using the most conservative assumption that the study included 50 teachers (information obtained from the authors indicates that there were 50 teachers alone in grades 4 and 6), the WWC-computed p-value would be .03, and therefore statistically significant. The WWC calculated the intervention group mean using a difference-in-differences approach by adding the impact of the intervention (i.e., difference in mean gains between the intervention and comparison groups) to the unadjusted comparison group posttest means. Please see the WWC Procedures and Standards Handbook (version 3.0), p. 23 for more information. The WWC obtained unadjusted posttest means for each grade and teacher sample size for grades 4 and 6 through an author query (the teacher sample size was not available from the authors for grades 3 and 5). The findings in this table differ from the prior intervention reports for Accelerated Math®. The Elementary School Math intervention report presented grade 4 scale scores alone. The Middle School Math intervention report presented grade 6 scale scores (as well as grade 7 and 8, which included students in ineligible courses under the Primary Mathematics topic area). This intervention report uses pooled NCE scores across grades 3–6. This study is characterized as having a statistically significant positive effect because the estimated effect is positive and statistically significant. For more information, please refer to the WWC Procedures and Standards Handbook (version 3.0), p. 26.
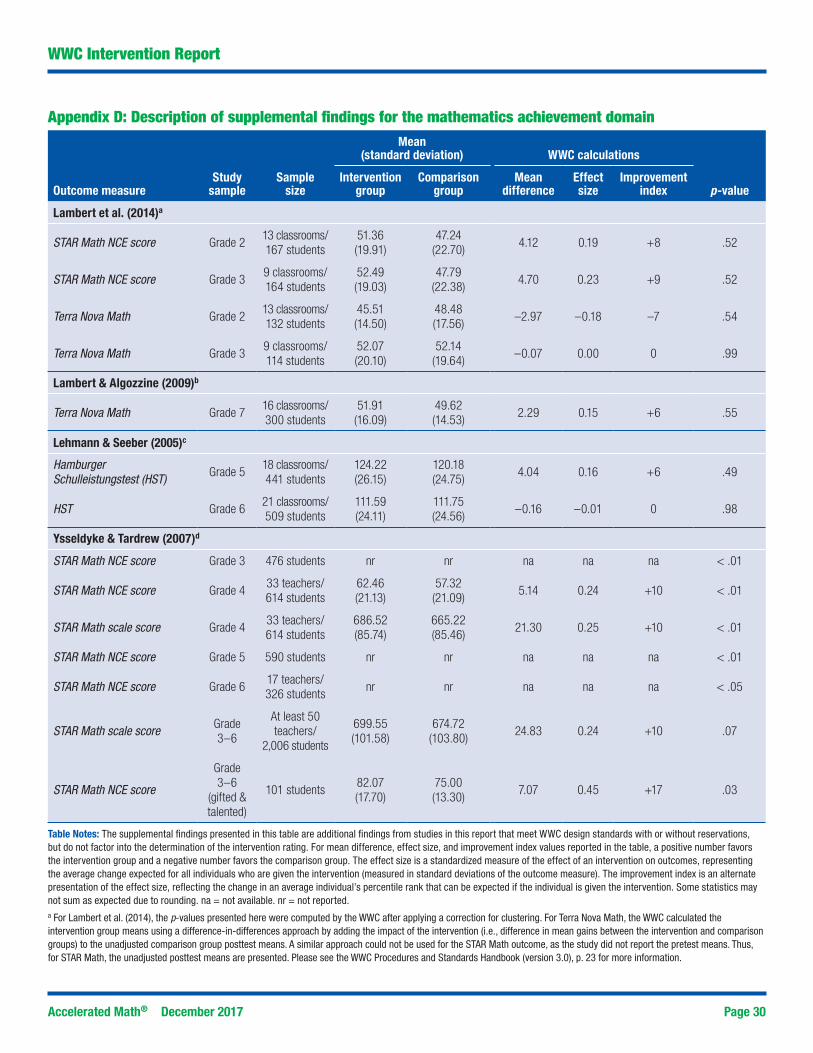
Accelerated Math® December 2017 Page 30
Appendix D: Description of supplemental findings for the mathematics achievement domain
WWC Intervention Report
Mean(standard deviation) WWC calculations
Outcome measureStudy
sampleSample
sizeIntervention
groupComparison
groupMean
differenceEffect size
Improvement index p-value
Lambert et al. (2014)a
STAR Math NCE score Grade 213 classrooms/ 167 students
51.36(19.91)
47.24(22.70)
4.12 0.19 +8 .52
STAR Math NCE score Grade 39 classrooms/ 164 students
52.49(19.03)
47.79(22.38)
4.70 0.23 +9 .52
Terra Nova Math Grade 213 classrooms/ 132 students
45.51(14.50)
48.48(17.56)
–2.97 –0.18 –7 .54
Terra Nova Math Grade 39 classrooms/ 114 students
52.07(20.10)
52.14(19.64)
–0.07 0.00 0 .99
Lambert & Algozzine (2009)b
Terra Nova Math Grade 716 classrooms/ 300 students
51.91(16.09)
49.62(14.53)
2.29 0.15 +6 .55
Lehmann & Seeber (2005)c
Hamburger Schulleistungstest (HST) Grade 5
18 classrooms/ 441 students
124.22(26.15)
120.18(24.75)
4.04 0.16 +6 .49
HST Grade 621 classrooms/ 509 students
111.59(24.11)
111.75(24.56)
–0.16 –0.01 0 .98
Ysseldyke & Tardrew (2007)d
STAR Math NCE score Grade 3 476 students nr nr na na na < .01
STAR Math NCE score Grade 433 teachers/614 students
62.46(21.13)
57.32(21.09)
5.14 0.24 +10 < .01
STAR Math scale score Grade 433 teachers/614 students
686.52(85.74)
665.22(85.46)
21.30 0.25 +10 < .01
STAR Math NCE score Grade 5 590 students nr nr na na na < .01
STAR Math NCE score Grade 617 teachers/326 students
nr nr na na na < .05
STAR Math scale score Grade 3–6
At least 50 teachers/
2,006 students
699.55(101.58)
674.72(103.80)
24.83 0.24 +10 .07
STAR Math NCE score
Grade 3–6
(gifted & talented)
101 students82.07(17.70)
75.00(13.30)
7.07 0.45 +17 .03
Table Notes: The supplemental findings presented in this table are additional findings from studies in this report that meet WWC design standards with or without reservations, but do not factor into the determination of the intervention rating. For mean difference, effect size, and improvement index values reported in the table, a positive number favors the intervention group and a negative number favors the comparison group. The effect size is a standardized measure of the effect of an intervention on outcomes, representing the average change expected for all individuals who are given the intervention (measured in standard deviations of the outcome measure). The improvement index is an alternate presentation of the effect size, reflecting the change in an average individual’s percentile rank that can be expected if the individual is given the intervention. Some statistics may not sum as expected due to rounding. na = not available. nr = not reported. a For Lambert et al. (2014), the p-values presented here were computed by the WWC after applying a correction for clustering. For Terra Nova Math, the WWC calculated the intervention group means using a difference-in-differences approach by adding the impact of the intervention (i.e., difference in mean gains between the intervention and comparison groups) to the unadjusted comparison group posttest means. A similar approach could not be used for the STAR Math outcome, as the study did not report the pretest means. Thus, for STAR Math, the unadjusted posttest means are presented. Please see the WWC Procedures and Standards Handbook (version 3.0), p. 23 for more information.
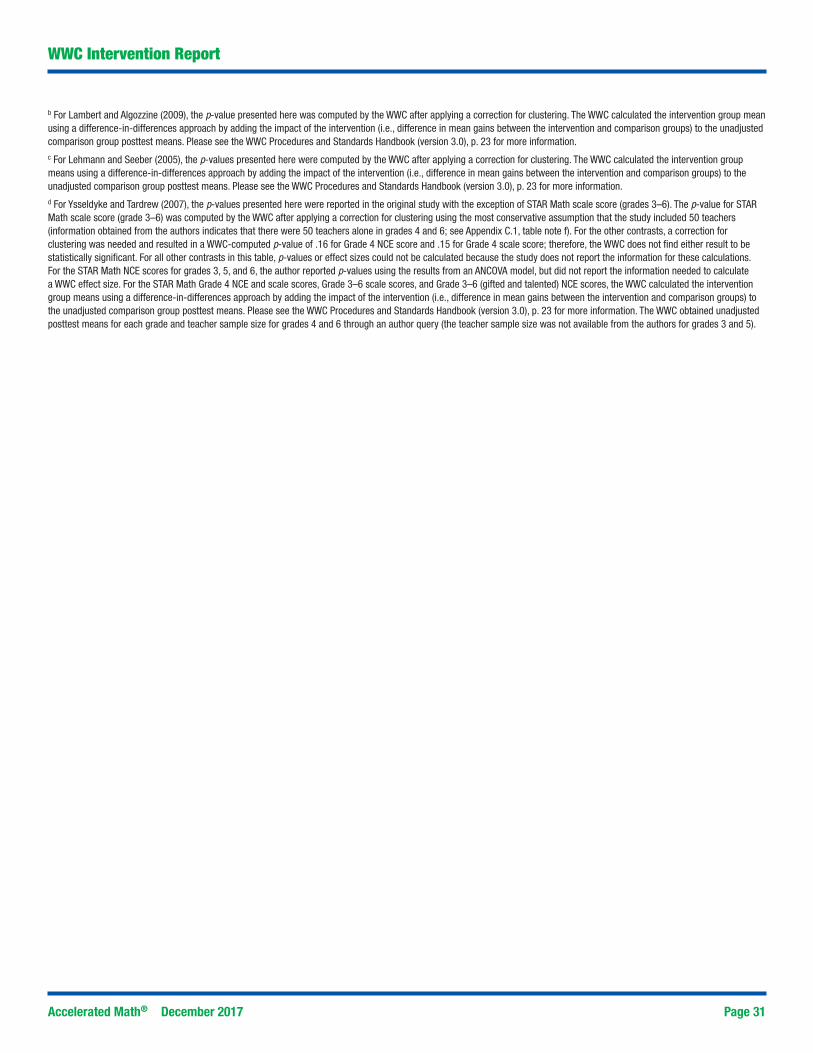
Accelerated Math® December 2017 Page 31
WWC Intervention Report
b For Lambert and Algozzine (2009), the p-value presented here was computed by the WWC after applying a correction for clustering. The WWC calculated the intervention group mean using a difference-in-differences approach by adding the impact of the intervention (i.e., difference in mean gains between the intervention and comparison groups) to the unadjusted comparison group posttest means. Please see the WWC Procedures and Standards Handbook (version 3.0), p. 23 for more information.c For Lehmann and Seeber (2005), the p-values presented here were computed by the WWC after applying a correction for clustering. The WWC calculated the intervention group means using a difference-in-differences approach by adding the impact of the intervention (i.e., difference in mean gains between the intervention and comparison groups) to the unadjusted comparison group posttest means. Please see the WWC Procedures and Standards Handbook (version 3.0), p. 23 for more information.d For Ysseldyke and Tardrew (2007), the p-values presented here were reported in the original study with the exception of STAR Math scale score (grades 3–6). The p-value for STAR Math scale score (grade 3–6) was computed by the WWC after applying a correction for clustering using the most conservative assumption that the study included 50 teachers (information obtained from the authors indicates that there were 50 teachers alone in grades 4 and 6; see Appendix C.1, table note f). For the other contrasts, a correction for clustering was needed and resulted in a WWC-computed p-value of .16 for Grade 4 NCE score and .15 for Grade 4 scale score; therefore, the WWC does not find either result to be statistically significant. For all other contrasts in this table, p-values or effect sizes could not be calculated because the study does not report the information for these calculations. For the STAR Math NCE scores for grades 3, 5, and 6, the author reported p-values using the results from an ANCOVA model, but did not report the information needed to calculate a WWC effect size. For the STAR Math Grade 4 NCE and scale scores, Grade 3–6 scale scores, and Grade 3–6 (gifted and talented) NCE scores, the WWC calculated the intervention group means using a difference-in-differences approach by adding the impact of the intervention (i.e., difference in mean gains between the intervention and comparison groups) to the unadjusted comparison group posttest means. Please see the WWC Procedures and Standards Handbook (version 3.0), p. 23 for more information. The WWC obtained unadjusted posttest means for each grade and teacher sample size for grades 4 and 6 through an author query (the teacher sample size was not available from the authors for grades 3 and 5).

Accelerated Math® December 2017 Page 32
Endnotes* Due to the 2015 restructuring of the Mathematics topic area from three areas (Elementary, Middle, and High School) to two areas (Primary and Secondary Mathematics), this is considered a new report, rather than an updated report. The information in this report combines the research examined in the prior reports and presents the conclusions differently.1 The descriptive information for this intervention comes from a publicly available source: the developer’s website (www.renaissance.com, downloaded May 2017). The WWC provided the developer with the intervention description in May 2017 and asked the developer to review it for accuracy from its perspective. The WWC subsequently incorporated feedback from the developer. Further verification of the accuracy of the descriptive information for this intervention is beyond the scope of this review. 2 The WWC previously released reports on Accelerated Math® under the Elementary School Mathematics (ESM) topic area in September 2010, the Middle School Mathematics (MSM) topic area in September 2008, and the High School Mathematics (HSM) topic area in July 2011. The prior review treated the study as a quasi-experimental design based on the author’s statement that the study used a “quasi-experimental” design, and the study did not present a measure of baseline equivalence. These two review areas are Primary Mathematics (which includes interventions in which math is presented through multi-topic materials and curricula, typically used in grades K–8) and Secondary Mathematics (which includes interventions organized by math content area [for example, algebra, geometry, and calculus], typically taught in grades 9–12). These two areas are replacing the prior ESM, MSM, and HSM topic areas, which were organized by student grade level. The WWC is updating and replacing intervention reports written under the prior topic areas.
The literature search reflects documents publicly available by February 2017. This updated report includes reviews of 41 studies that the previous WWC intervention reports for Accelerated Math® did not include. Of the additional studies, two were within the scope of the review protocol for the Primary Mathematics topic area and met WWC group design standards, eight were within the scope of the review protocol but did not meet WWC group design standards, and 31 were not within the scope of the review protocol. A complete list and disposition of all studies reviewed are available in the references.
The current report, which includes reviews of all previous studies that met WWC group design standards with or without reservations, resulted in a revised disposition for four studies.
Caputo (2007) is rated meets WWC group design standards without reservations in this report, whereas it previously received a rating of does not meet WWC group design standards in the MSM intervention report. The prior review treated the study as a quasi-experimental design, which did not present a measure of baseline equivalence. The prior determination that the study used a quasi-experimental design was based on the author’s statement that the study used a “quasi-experimental” design because students were not randomly assigned to group. However, the study methodology indicates that classrooms were randomly assigned to condition, which the WWC views as a cluster RCT. Because the study is a cluster RCT with low attrition and no other apparent design concerns, it is now rated meets WWC group design standards without reservations.
Lehmann and Seeber (2005) is rated meets WWC group design standards with reservations in this report, whereas it previously was ineligible for review in the MSM intervention report. The revised disposition is due to differences in review protocols. The prior review protocol (MSM, version 1.1) required studies be conducted in the United States. The Primary Mathematics review protocol (version 3.1) permits studies that are conducted outside the United States.
Nunnery and Ross (2007) is rated does not meet WWC group design standards in this report, whereas it previously received a rating of meets WWC group design standards with reservations in the ESM and MSM intervention reports. The current rating differs from the prior reviews because of a clarification in the version 3.0 standards of what constitutes a confounding factor. In this study, all of the intervention schools were located in one district that chose to implement Accelerated Math® districtwide. The comparison schools were located in nine other districts. Because factors aligned with the intervention district cannot be disentangled from the Accelerated Math® student outcomes, this review rated the study does not meet WWC group design standards because of the district-level confound.
Ysseldyke and Bolt (2007) is rated meets WWC group design standards with reservations in this report, whereas it had previously received a rating of meets WWC group design standards without reservations in the ESM and MSM intervention reports. The current rating is based on version 3.0 of the WWC Procedures and Standards Handbook, which provides new guidance on rating cluster, or group-based, RCTs. Student-level attrition cannot be assessed for this study because the authors did not provide counts of students in the classrooms at the time of random assignment. Furthermore, because the study is a cluster RCT that might have analyzed outcomes for students who were not present at the time of classroom random assignment, the integrity of the study’s random assignment was jeopardized. The study now meets WWC group design standards with reservations, which is the highest rating a cluster RCT with joiners can receive when the authors discuss the effects of the intervention on students. In addition, results for students in grades 6–8 were reported in the MSM intervention report. This sample included students in Algebra I classes and thus is not eligible for review under the Primary Mathematics review protocol.
WWC Intervention Report

Accelerated Math® December 2017 Page 33
WWC Intervention Report
Reviews of studies in this report used the standards from the WWC Procedures and Standards Handbook (version 3.0) and the Primary Mathematics review protocol (version 3.1). The evidence presented in this report is based on available research. Findings and conclusions may change as new research becomes available.3 Please see the Primary Mathematics Topic Area review protocol (version 3.1) for more information about the outcome domain.4 For criteria used to determine the rating of effectiveness and extent of evidence, see the WWC Rating Criteria on p. 34. These improvement index numbers show the average and range of individual-level improvement indices for all findings across the studies. 5 Lambert and Algozzine (2009) contains descriptions of two study samples: elementary students from three schools in grades 2–5 and junior high students from two schools in grades 7–9. These two samples are considered separate studies per WWC criteria because random assignment was conducted separately in the elementary and junior high schools, and the authors analyze the two samples separately. The sample of elementary students is reviewed separately in this report under Lambert et al. (2014). 6 For Ysseldyke and Bolt (2007), the initial study sample included students in grades 2–8 in nine schools. However, the eligible sample described in this report includes students in grades 2–5. Because some students in grades 6–8 might have been in Algebra classes, and the Algebra and non-Algebra students were not analyzed separately, the grades 6–8 students are ineligible for review in the Primary Mathematics topic area.7 For Ysseldyke and Tardrew (2007), the initial study sample included students in grades 3–10. However, the eligible sample described in this report includes students in grades 3–6. Because some students in grades 8–10 might have been in Algebra classes, and the Algebra and non-Algebra students were not analyzed separately, the grades 8–10 students are ineligible for review in the Primary Mathematics topic area. In addition, grade 7 students were pooled with grade 8 students for all eligible analyses, which means the grade 7 students might be analyzed with algebra students and are ineligible for review in the Primary Mathematics topic area.8 The author’s estimate of statistical significance is based on a growth model that simultaneously measures the impact of the intervention in multiple follow-up periods, whereas the WWC focuses on the impact of the intervention at a particular point in time.9 For Ysseldyke and Tardrew (2007), the characterization of the study finding differs from that reported in the prior ESM and MSM reports because this intervention report used data pooled across grades 3–6 (and uses Normal Curve Equivalent scores instead of scale scores), whereas the prior intervention reports presented outcomes for individual grades. In the prior ESM report, the study finding, considering only grade 4, was characterized as a substantively important positive effect. In the prior MSM report, the study finding, considering grade 6 and grades 7 and 8, separately, was characterized as an indeterminate effect.10 For Caputo (2007), only the analysis which compares students in Accelerated Math® to those in the comparison group, DPFW, is eligible for review. All other contrasts presented in the study do not use a valid comparison group design that focuses on the intervention of interest Accelerated Math®. 11 Lehmann and Seeber (2005) presents a supplementary analysis that is comprised of nine teachers that taught both an Accelerated Math® class and a comparison class in grades 5 and 6. This analytic sample is rated does not meet WWC group design standards because it does not demonstrate baseline equivalence as required. 12 The WWC identified one additional source related to Ysseldyke and Bolt (2007). This study does not contribute unique information to Appendix A.5 and is not listed here.13 Ysseldyke and Bolt (2007) also presents an analysis of middle school students in grades 6–8. The analytic sample included some students in Algebra I classes, and an analysis of students in pre-Algebra classes was not conducted separately. Thus, this analytic sample is ineligible for review under the Primary Mathematics review protocol.14 The WWC identified three additional sources related to Ysseldyke and Tardrew (2007). These studies do not contribute unique information to Appendix A.6 and are not listed here.15 Ysseldyke and Tardrew (2007) conducted their full study in 47 schools in 24 states and included students in grades 3–10. However, only the sample of students in grades 3–6 is eligible for review. Students in grades 8–10 may have been enrolled in Algebra I or more advanced courses. Thus, the sample using these students is ineligible for review in the Primary Mathematics topic area. In addition, results for grade 7 students were pooled with those in the ineligible grade 8. The 24 states participating in the full sample were: Alabama, Arkansas, California, Georgia, Idaho, Illinois, Indiana, Iowa, Kansas, Massachusetts, Michigan, Minnesota, Missouri, Montana, New Mexico, Ohio, Oklahoma, Oregon, Pennsylvania, Tennessee, Texas, Virginia, Washington, and Wisconsin.
Recommended CitationWhat Works Clearinghouse, Institute of Education Sciences, U.S. Department of Education. (2017, December).
Primary Mathematics intervention report: Accelerated Math®. Retrieved from https://whatworks.ed.gov
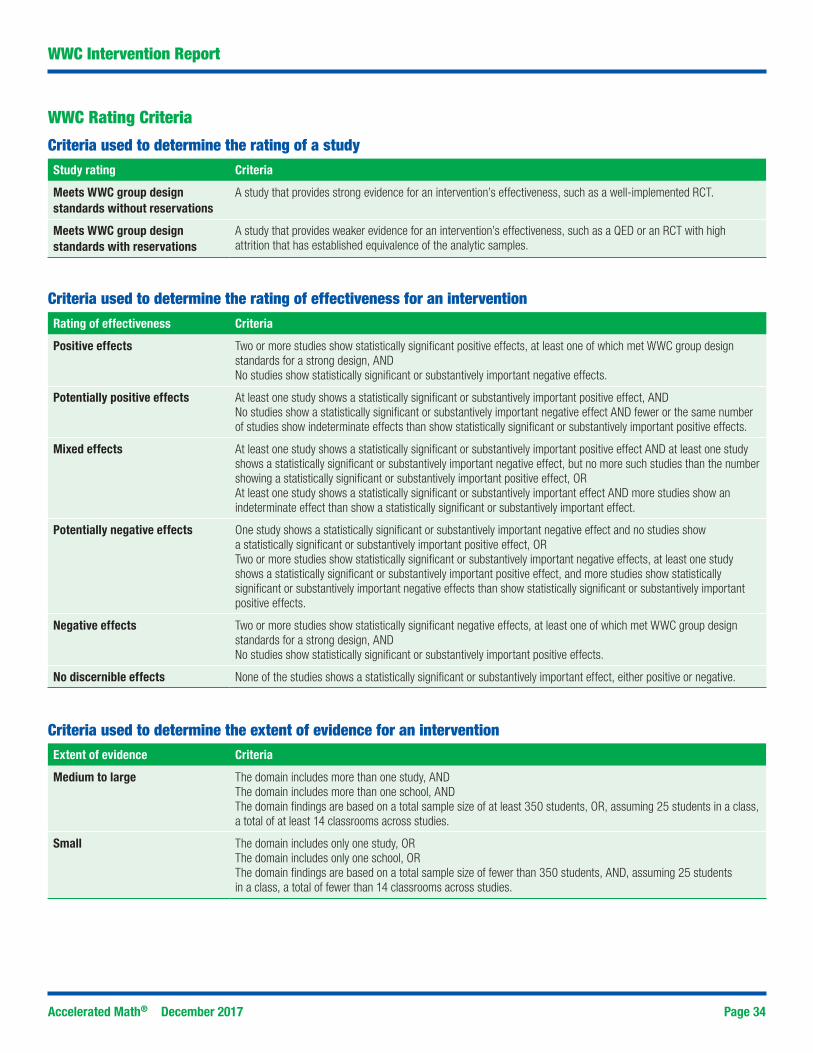
Accelerated Math® December 2017 Page 34
WWC Intervention Report
WWC Rating Criteria
Criteria used to determine the rating of a studyStudy rating Criteria
Meets WWC group design standards without reservations
A study that provides strong evidence for an intervention’s effectiveness, such as a well-implemented RCT.
Meets WWC group design standards with reservations
A study that provides weaker evidence for an intervention’s effectiveness, such as a QED or an RCT with high attrition that has established equivalence of the analytic samples.
Criteria used to determine the rating of effectiveness for an interventionRating of effectiveness Criteria
Positive effects Two or more studies show statistically significant positive effects, at least one of which met WWC group design standards for a strong design, AND No studies show statistically significant or substantively important negative effects.
Potentially positive effects At least one study shows a statistically significant or substantively important positive effect, AND No studies show a statistically significant or substantively important negative effect AND fewer or the same number of studies show indeterminate effects than show statistically significant or substantively important positive effects.
Mixed effects At least one study shows a statistically significant or substantively important positive effect AND at least one study shows a statistically significant or substantively important negative effect, but no more such studies than the number showing a statistically significant or substantively important positive effect, OR At least one study shows a statistically significant or substantively important effect AND more studies show an indeterminate effect than show a statistically significant or substantively important effect.
Potentially negative effects One study shows a statistically significant or substantively important negative effect and no studies show
a statistically significant or substantively important positive effect, ORTwo or more studies show statistically significant or substantively important negative effects, at least one study shows a statistically significant or substantively important positive effect, and more studies show statistically significant or substantively important negative effects than show statistically significant or substantively important positive effects.
Negative effects Two or more studies show statistically significant negative effects, at least one of which met WWC group design standards for a strong design, ANDNo studies show statistically significant or substantively important positive effects.
No discernible effects None of the studies shows a statistically significant or substantively important effect, either positive or negative.
Criteria used to determine the extent of evidence for an interventionExtent of evidence Criteria
Medium to large The domain includes more than one study, ANDThe domain includes more than one school, ANDThe domain findings are based on a total sample size of at least 350 students, OR, assuming 25 students in a class, a total of at least 14 classrooms across studies.
Small The domain includes only one study, ORThe domain includes only one school,
OR
The domain findings are based on a total sample size of fewer than 350 students, AND, assuming 25 students in a class, a total of fewer than 14 classrooms across studies.
Accelerated Math® December 2017 Page 35
WWC Intervention Report
Glossary of Terms
Attrition Attrition occurs when an outcome variable is not available for all subjects initially assigned to the intervention and comparison groups. If a randomized controlled trial (RCT) or regression discontinuity design (RDD) study has high levels of attrition, the validity of the study results can be called into question. An RCT with high attrition cannot receive the highest rating of Meets WWC Group Design Standards without Reservations, but can receive a rating of Meets WWC Group Design Standards with Reservations if it establishes baseline equivalence of the analytic sample. Similarly, the highest rating an RDD with high attrition can receive is Meets WWC RDD Standards with Reservations.
For single-case design research, attrition occurs when an individual fails to complete all required phases or data points in an experiment, or when the case is a group and individuals leave the group. If a single-case design does not meet minimum requirements for phases and data points within phases, the study cannot receive the highest rating of Meets WWC Pilot Single-Case Design Standards without Reservations.
Baseline A point in time before the intervention was implemented in group design research and in regression discontinuity design studies. When a study is required to satisfy the baseline equivalence requirement, it must be done with characteristics of the analytic sample at baseline. In a single-case design experiment, the baseline condition is a period during which participants are not receiving the intervention.
Clustering adjustment An adjustment to the statistical significance of a finding when the units of assignment and analysis differ. When random assignment is carried out at the cluster level, outcomes for individual units within the same clusters may be correlated. When the analysis is conducted at the individual level rather than the cluster level, there is a mismatch between the unit of assignment and the unit of analysis, and this correlation must be accounted for when assessing the statistical significance of an impact estimate. If the correlation is not accounted for in a mismatched analysis, the study may be too likely to report statistically significant findings. To fairly assess an intervention’s effects, in cases where study authors have not corrected for the clustering, the WWC applies an adjustment for clustering when reporting statistical significance.
Confounding factor A confounding factor is a component of a study that is completely aligned with one of the study conditions, making it impossible to separate how much of the observed effect was due to the intervention and how much was due to the factor.
Design The method by which intervention and comparison groups are assigned (group design and regression discontinuity design) or the method by which an outcome measure is assessed repeatedly within and across different phases that are defined by the presence or absence of an intervention (single-case design). Designs eligible for WWC review are randomized controlled trials, quasi-experimental designs, regression discontinuity designs, and single-case designs.
Effect size The effect size is a measure of the magnitude of an effect. The WWC uses a standardized measure to facilitate comparisons across studies and outcomes.
Eligibility A study is eligible for review and inclusion in this report if it falls within the scope of the review protocol and uses either an experimental or matched comparison group design.
Equivalence A demonstration that the analytic sample groups are similar on observed characteristics defined in the review area protocol.
Accelerated Math® December 2017 Page 36
WWC Intervention Report
Extent of evidence An indication of how much evidence from group design studies supports the findings in an intervention report. The extent of evidence categorization for intervention reports focuses on the number and sizes of studies of the intervention in order to give an indication of how broadly findings may be applied to different settings. There are two extent of evidence categories: small and medium to large.
• small: includes only one study, or one school, or findings based on a total sample size of less than 350 students and 14 classrooms (assuming 25 students in a class)
• medium to large: includes more than one study, more than one school, and findings based on a total sample of at least 350 students or 14 classrooms.
Gain scores The result of subtracting the pretest from the posttest for each individual in the sample. Some studies analyze gain scores instead of the unadjusted outcome measure as a method of accounting for the baseline measure when estimating the effect of an intervention. The WWC reviews and reports findings from analyses of gain scores, but gain scores do not satisfy the WWC’s requirement for a statistical adjustment under the baseline equivalence requirement. This means that a study that must satisfy the baseline equivalence requirement and has baseline differences between 0.05 and 0.25 standard deviations Does Not Meet WWC Group Design Standards if the study’s only adjustment for the baseline measure was in the construction of the gain score.
Group design A study design in which outcomes for a group receiving an intervention are compared to those for a group not receiving the intervention. Comparison group designs eligible for WWC review are randomized controlled trials and quasi-experimental designs.
Improvement index Along a percentile distribution of individuals, the improvement index represents the gain or loss of the average individual due to the intervention. As the average individual starts at the 50th percentile, the measure ranges from –50 to +50.
Intervention An educational program, product, practice, or policy aimed at improving student outcomes.
Intervention report A summary of the findings of the highest-quality research on a given program, product, practice, or policy in education. The WWC searches for all research studies on an intervention, reviews each against design standards, and summarizes the findings of those that meet WWC design standards.
Multiple comparison adjustment
An adjustment to the statistical significance of results to account for multiple comparisons in a group design study. The WWC uses the Benjamini-Hochberg (BH) correction to adjust the statistical significance of results within an outcome domain when study authors perform multiple hypothesis tests without adjusting the p-value. The BH correction is used in three types of situations: studies that tested multiple outcome measures in the same outcome domain with a single comparison group; studies that tested a given outcome measure with multiple comparison groups; and studies that tested multiple outcome measures in the same outcome domain with multiple comparison groups. Because repeated tests of highly correlated constructs will lead to a greater likelihood of mistakenly concluding that the impact was different from zero, in all three situations, the WWC uses the BH correction to reduce the possibility of making this error. The WWC makes separate adjustments for primary and secondary findings.
Outcome domain A group of closely-related outcomes. A domain is the organizing construct for a set of related outcomes through which studies claim effectiveness.

Accelerated Math® December 2017 Page 37
WWC Intervention Report
Quasi-experimental design (QED)
A quasi-experimental design (QED) is a research design in which study participants are assigned to intervention and comparison groups through a process that is not random.
Randomized controlled trial (RCT)
A randomized controlled trial (RCT) is an experiment in which eligible study participants are randomly assigned to intervention and comparison groups.
Rating of effectiveness For group design research, the WWC rates the effectiveness of an intervention in each domain based on the quality of the research design and the magnitude, statistical significance, and consistency in findings. For single-case design research, the WWC rates the effectiveness of an intervention in each domain based on the quality of the research design and the consistency of demonstrated effects. The criteria for the ratings of effectiveness are given in the WWC Rating Criteria on p. 34.
Regression discontinuity design
(RDD)
A design in which groups are created using a continuous scoring rule. For example, students may be assigned to a summer school program if they score below a preset point on a standardized test, or schools may be awarded a grant based on their score on an application. A regression line or curve is estimated for the intervention group and similarly for the comparison group, and an effect occurs if there is a discontinuity in the two regression lines at the cutoff.
Single-case design A research approach in which an outcome variable is measured repeatedly within and across different conditions that are defined by the presence or absence of an intervention.
Standard deviation The standard deviation of a measure shows how much variation exists across observations in the sample. A low standard deviation indicates that the observations in the sample tend to be very close to the mean; a high standard deviation indicates that the observations in the sample tend to be spread out over a large range of values.
Statistical significance Statistical significance is the probability that the difference between groups is a result of chance rather than a real difference between the groups. The WWC labels a finding statistically significant if the likelihood that the difference is due to chance is less than 5% (p < .05).
Study rating The result of the WWC assessment of a study. The rating is based on the strength of the evidence of the effectiveness of the educational intervention. Studies are given a rating of Meets WWC Design Standards without Reservations, Meets WWC Design Standards with Reservations, or Does Not Meet WWC Design Standards, based on the assessment of the study against the appropriate design standards. The WWC has design standards for group design, single-case design, and regression discontinuity design studies.
Substantively important A substantively important finding is one that has an effect size of 0.25 or greater, regardless of statistical significance.
Systematic review A review of existing literature on a topic that is identified and reviewed using explicit methods. A WWC systematic review has five steps: 1) developing a review protocol; 2) searching the literature; 3) reviewing studies, including screening studies for eligibility, reviewing the methodological quality of each study, and reporting on high quality studies and their findings; 4) combining findings within and across studies; and, 5) summarizing the review.
Please see the WWC Procedures and Standards Handbook (version 3.0) for additional details.
Accelerated Math® December 2017 Page 38
WWC Intervention Report
Intervention Report
Practice Guide
Quick Review
Single Study Review
An intervention report summarizes the findings of high-quality research on a given program, practice, or policy in education. The WWC searches for all research studies on an intervention, reviews each against evidence standards, and summarizes the findings of those that meet standards.
This intervention report was prepared for the WWC by Mathematica Policy Research under contract ED-IES-13-C-0010.