What We Know Today About the Venus Middle Atmosphere · 1/24/2013 · What We Know Today About the...
40
What We Know Today About the Venus Middle Atmosphere David Crisp Jet Propulsion Laboratory California Institute of Technology 24 January 2013 Venus Upper Atmosphere Investigations Science and Technical Interchange Meeting Copyright 2013 California Institute of Technology. Government sponsorship acknowledged.
Transcript of What We Know Today About the Venus Middle Atmosphere · 1/24/2013 · What We Know Today About the...
What We Know Today About the Venus Middle Atmosphere
David Crisp
Jet Propulsion Laboratory
California Institute of Technology
24 January 2013
Venus Upper Atmosphere Investigations Science and Technical Interchange Meeting
Copyright 2013 California Institute of Technology. Government sponsorship acknowledged.
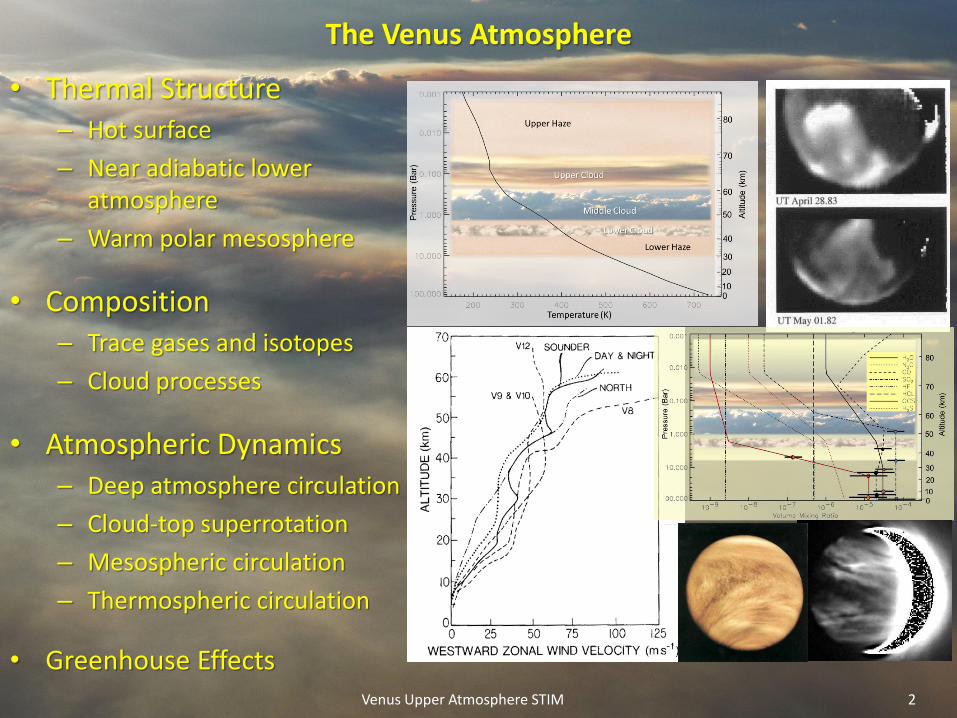
The Venus Atmosphere
Venus Upper Atmosphere STIM 2
• Thermal Structure – Hot surface
– Near adiabatic lower atmosphere
– Warm polar mesosphere
• Composition – Trace gases and isotopes
– Cloud processes
• Atmospheric Dynamics – Deep atmosphere circulation
– Cloud-top superrotation
– Mesospheric circulation
– Thermospheric circulation
• Greenhouse Effects
Thermal Structure and Cloud Distribution
3 Venus Upper Atmosphere STIM
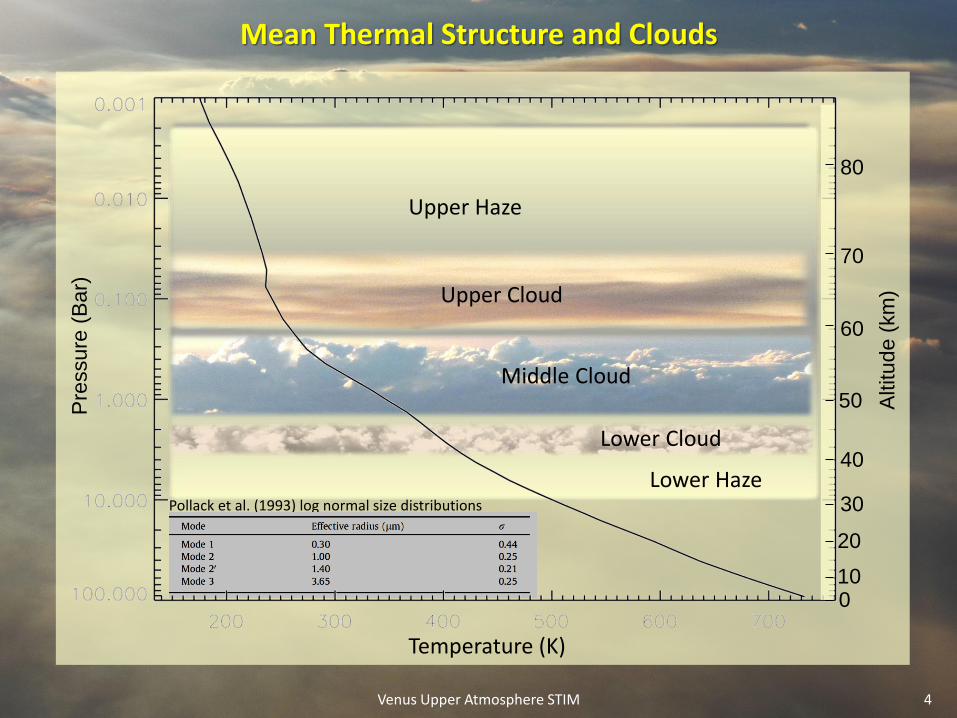
Mean Thermal Structure and Clouds
Venus Upper Atmosphere STIM 4
Temperature (K)
Pre
ssure
(B
ar)
Upper Cloud
Middle Cloud
Lower Cloud
Upper Haze
Lower Haze Pollack et al. (1993) log normal size distributions
50
40
30
20
10 0
60
70
80
Altitud
e (
km
)
170
180
190
200
210
220
250
270 290
220
20 30 40 50 60 70
Latitude
1
0.1
10-2
10-3
10-4
P (
bar
s)
50
60
70
80
90
100
Ap
pro
ximate A
ltitud
e
(km)
80
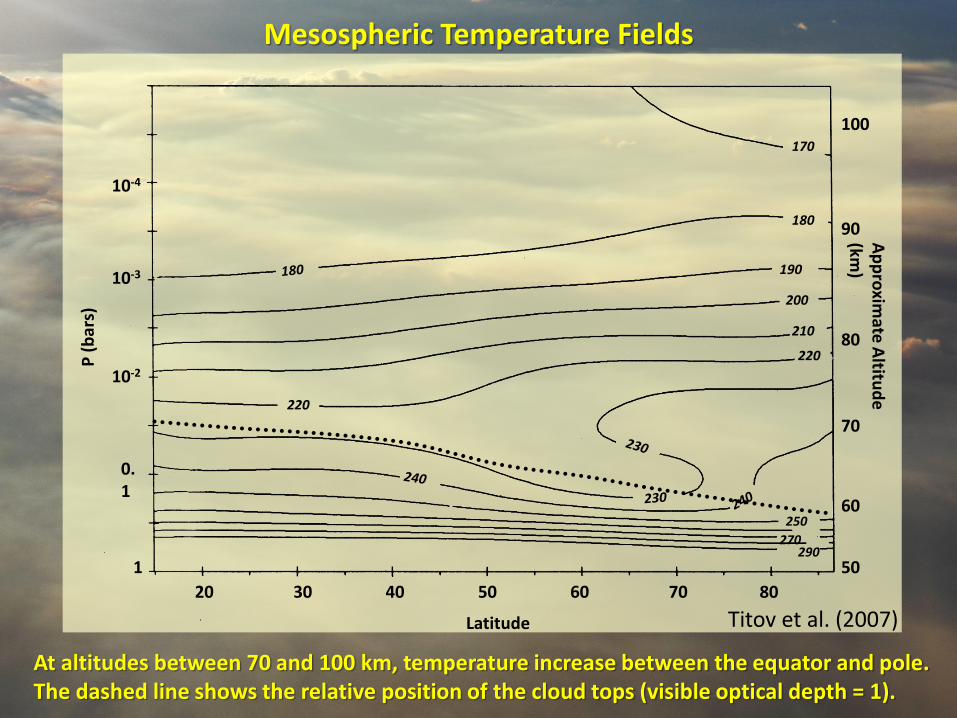
Titov et al. (2007)
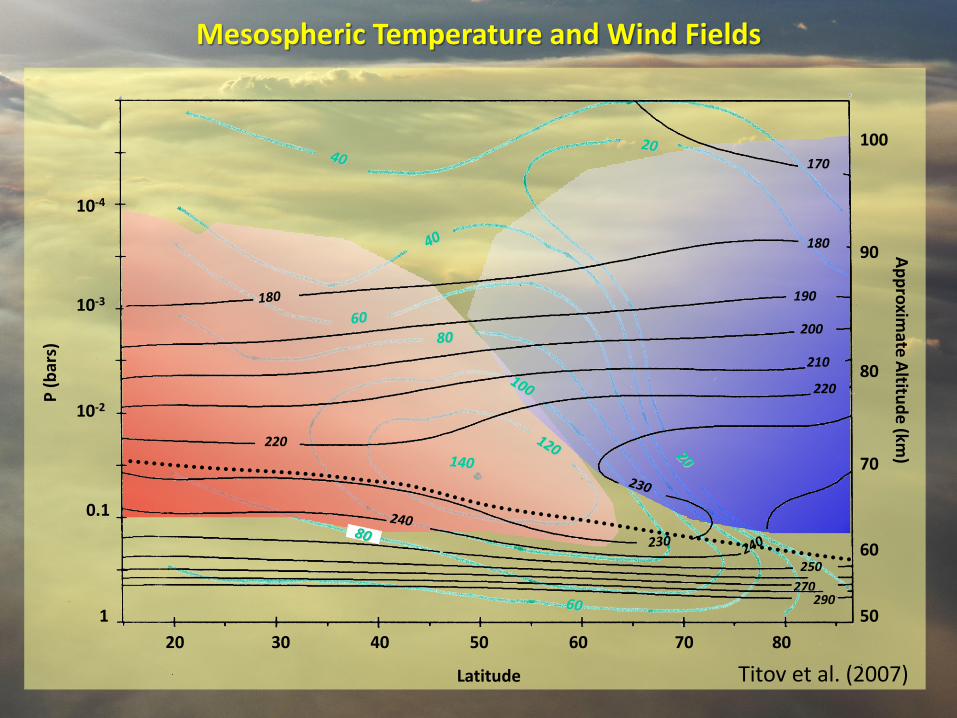
Mesospheric Temperature Fields
At altitudes between 70 and 100 km, temperature increase between the equator and pole. The dashed line shows the relative position of the cloud tops (visible optical depth = 1).
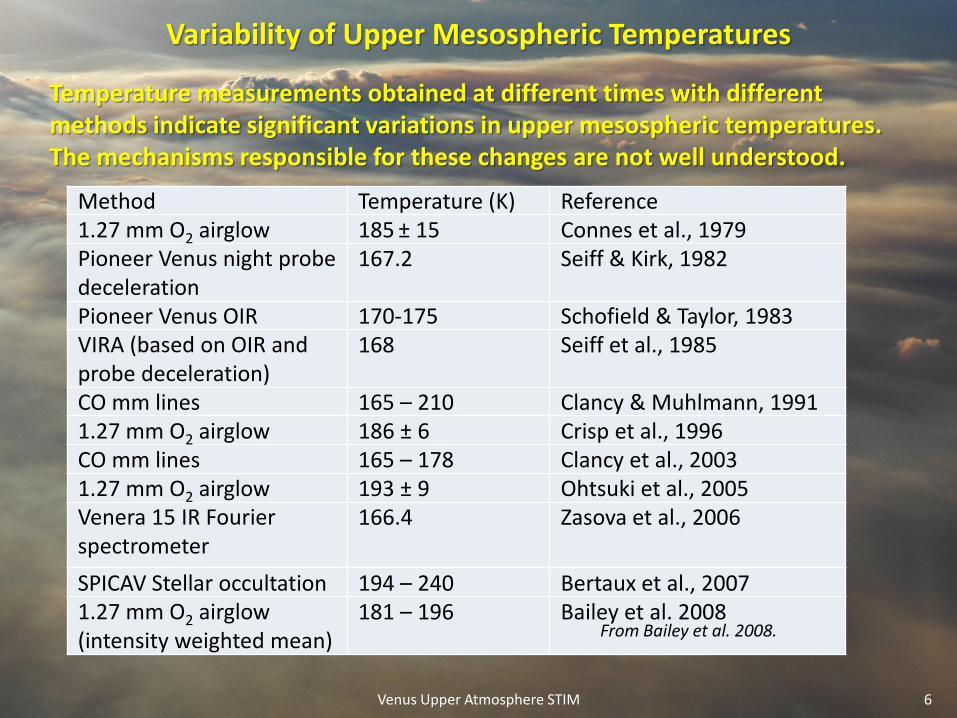
Variability of Upper Mesospheric Temperatures
Venus Upper Atmosphere STIM 6
Method Temperature (K) Reference
1.27 mm O2 airglow 185 ± 15 Connes et al., 1979
Pioneer Venus night probe deceleration
167.2 Seiff & Kirk, 1982
Pioneer Venus OIR 170-175 Schofield & Taylor, 1983
VIRA (based on OIR and probe deceleration)
168 Seiff et al., 1985
CO mm lines 165 – 210 Clancy & Muhlmann, 1991
1.27 mm O2 airglow 186 ± 6 Crisp et al., 1996
CO mm lines 165 – 178 Clancy et al., 2003
1.27 mm O2 airglow 193 ± 9 Ohtsuki et al., 2005
Venera 15 IR Fourier spectrometer
166.4 Zasova et al., 2006
SPICAV Stellar occultation 194 – 240 Bertaux et al., 2007
1.27 mm O2 airglow (intensity weighted mean)
181 – 196 Bailey et al. 2008
Temperature measurements obtained at different times with different methods indicate significant variations in upper mesospheric temperatures. The mechanisms responsible for these changes are not well understood.
From Bailey et al. 2008.
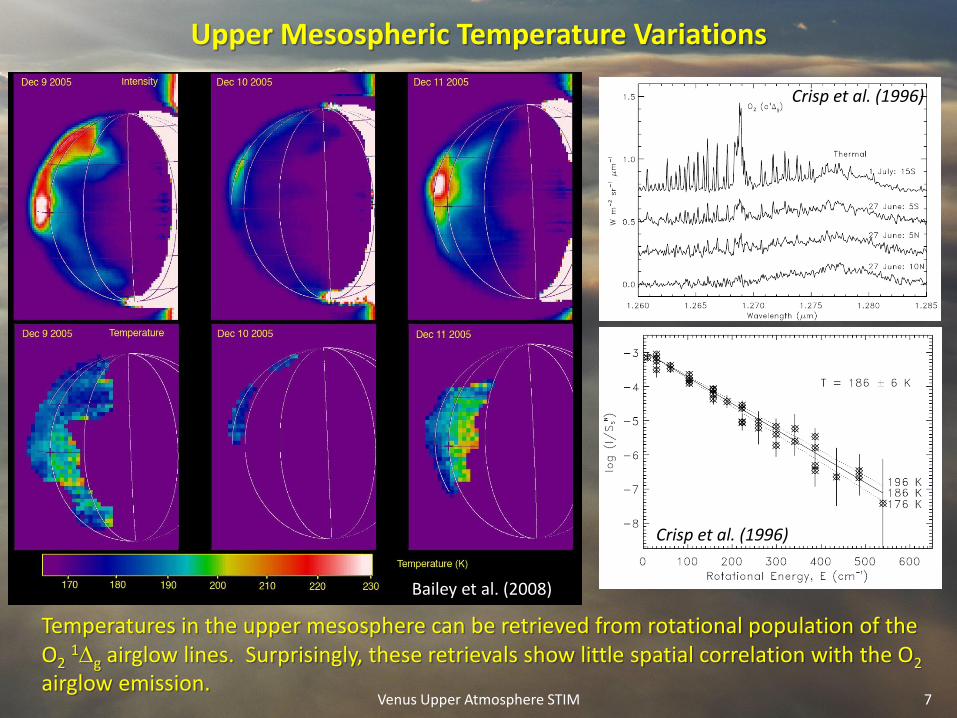
Upper Mesospheric Temperature Variations
Venus Upper Atmosphere STIM 7
Temperatures in the upper mesosphere can be retrieved from rotational population of the O2 1g airglow lines. Surprisingly, these retrievals show little spatial correlation with the O2 airglow emission.
Bailey et al. (2008)
Crisp et al. (1996)
Crisp et al. (1996)
The Venus Clouds • What we think we know about the clouds
– The main cloud deck extends from ~47 to 71 km altitude at low latitudes
– The altitude of the cloud decreases with increasing latitude
– Most measurements indicate that the main cloud deck consists of three distinct layers, separated by relatively clear regions near 49 and 58 km
– These clouds are composed primarily of spherical, concentrated (75% – 95%) sulfuric acid particles with a range of particle sizes
– A thin haze extends both above and below the cloud deck. Above the clouds, this haze is composed of 0.1 to 0.3 µm radius H2SO4 particles.
• A few things we don’t know about the clouds
– An unknown UV absorber is embedded within the upper cloud deck. It could be associated with absorbing particles or trace gases
– The composition of the haze within and below the middle and lower clouds is consistent with H2SO4, but is not known
– The composition and phase of the large “Mode 3” particles is still not known
– The physical processes that maintain the vertical structure of the clouds, and the three distinct cloud layers with gaps at 48 and 58 km are not well understood
– The distribution of cloud forming gases (H2O, SO2) within the clouds is unknown
8 Venus Upper Atmosphere STIM
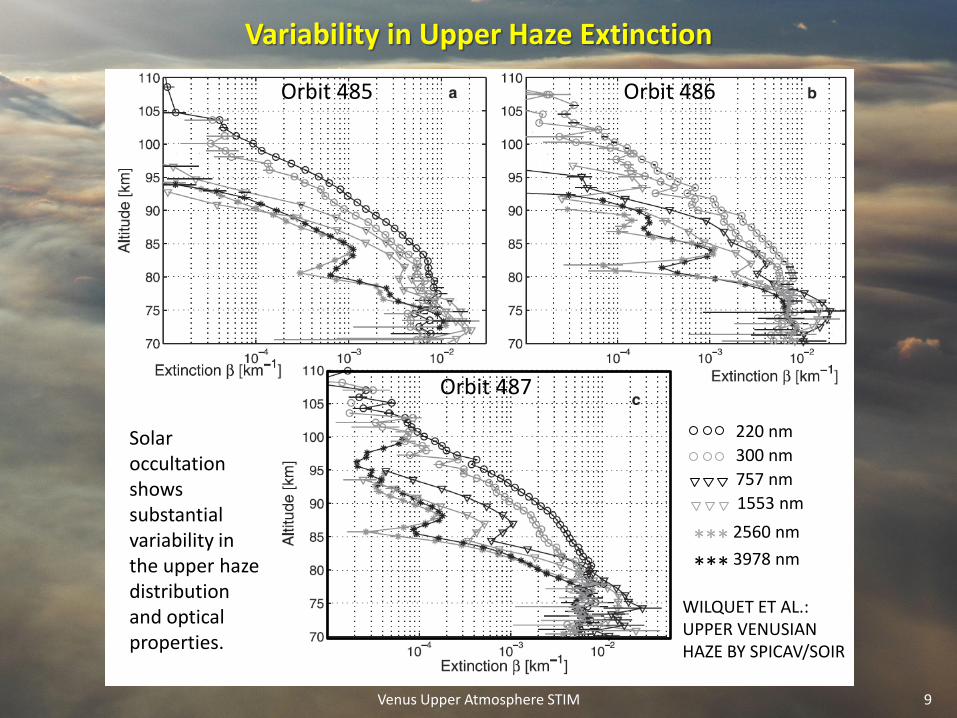
Variability in Upper Haze Extinction
Venus Upper Atmosphere STIM 9
220 nm
300 nm
757 nm
1553 nm
*** *** 2560 nm
3978 nm
Orbit 485 Orbit 486
Orbit 487
WILQUET ET AL.: UPPER VENUSIAN HAZE BY SPICAV/SOIR
Solar occultation shows substantial variability in the upper haze distribution and optical properties.
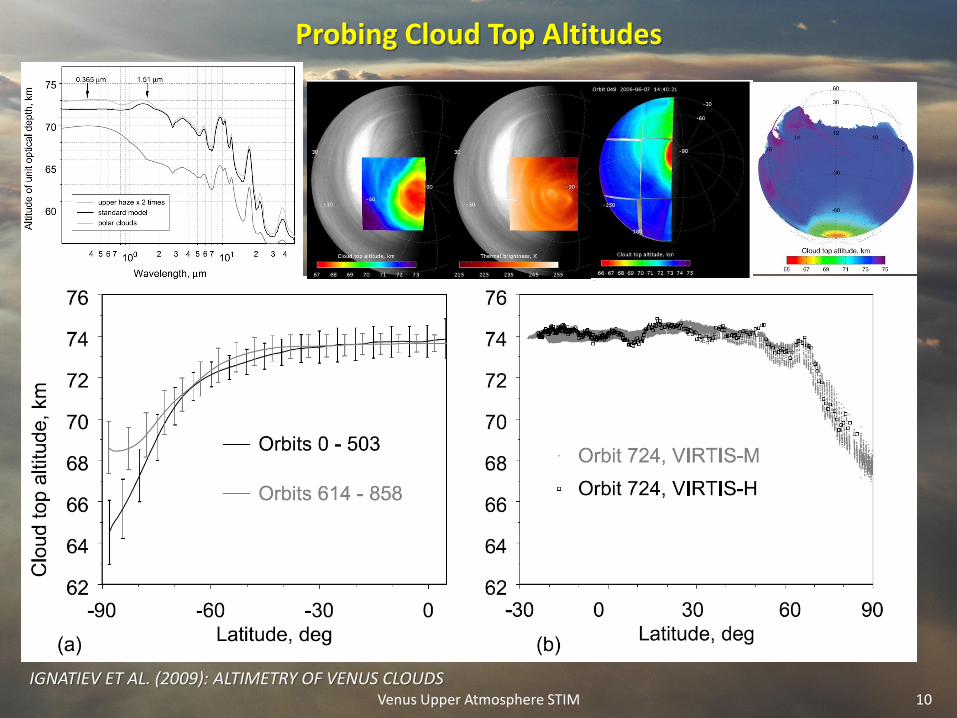
Probing Cloud Top Altitudes
Venus Upper Atmosphere STIM 10
IGNATIEV ET AL. (2009): ALTIMETRY OF VENUS CLOUDS
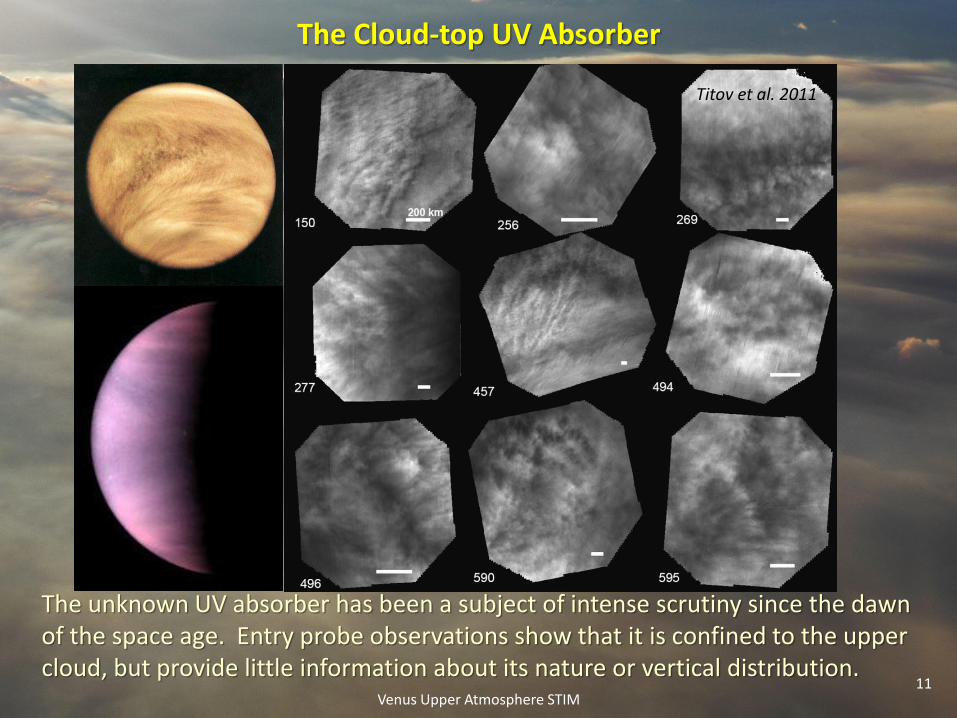
The Cloud-top UV Absorber
Venus Upper Atmosphere STIM 11
The unknown UV absorber has been a subject of intense scrutiny since the dawn of the space age. Entry probe observations show that it is confined to the upper cloud, but provide little information about its nature or vertical distribution.
Titov et al. 2011
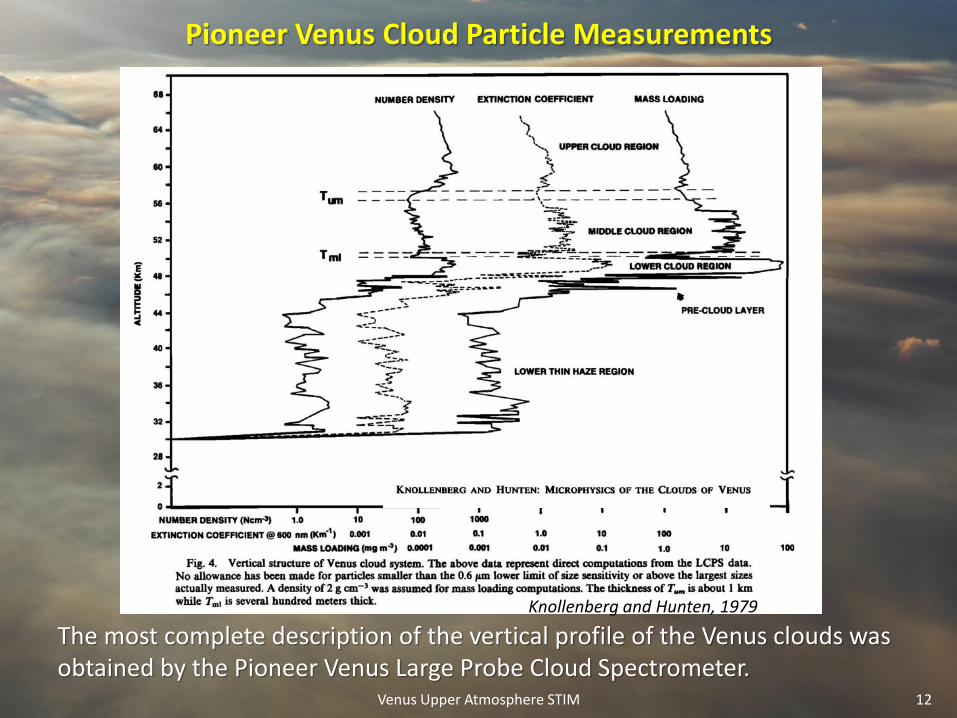
Pioneer Venus Cloud Particle Measurements
Venus Upper Atmosphere STIM 12
The most complete description of the vertical profile of the Venus clouds was obtained by the Pioneer Venus Large Probe Cloud Spectrometer.
Knollenberg and Hunten, 1979
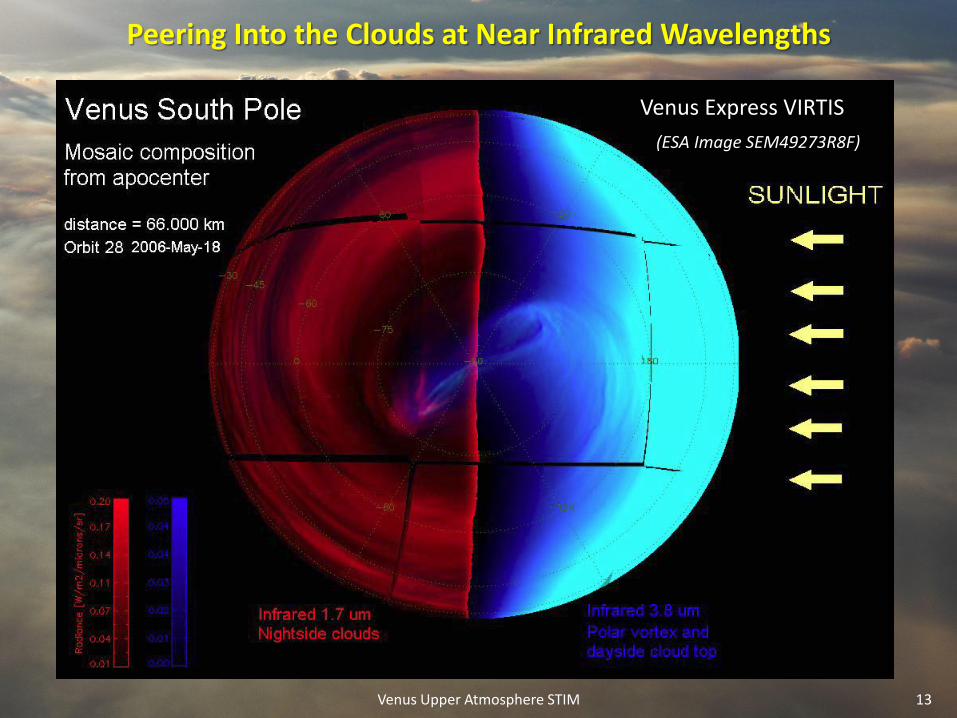
Peering Into the Clouds at Near Infrared Wavelengths
Venus Upper Atmosphere STIM 13
Venus Express VIRTIS
(ESA Image SEM49273R8F)
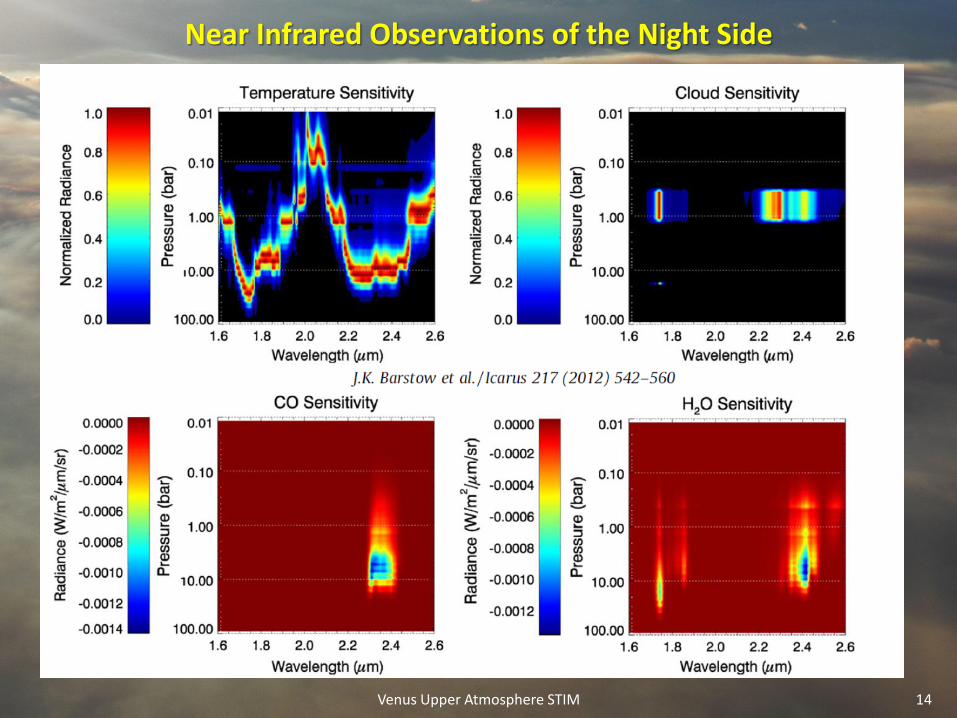
Near Infrared Observations of the Night Side
Venus Upper Atmosphere STIM 14
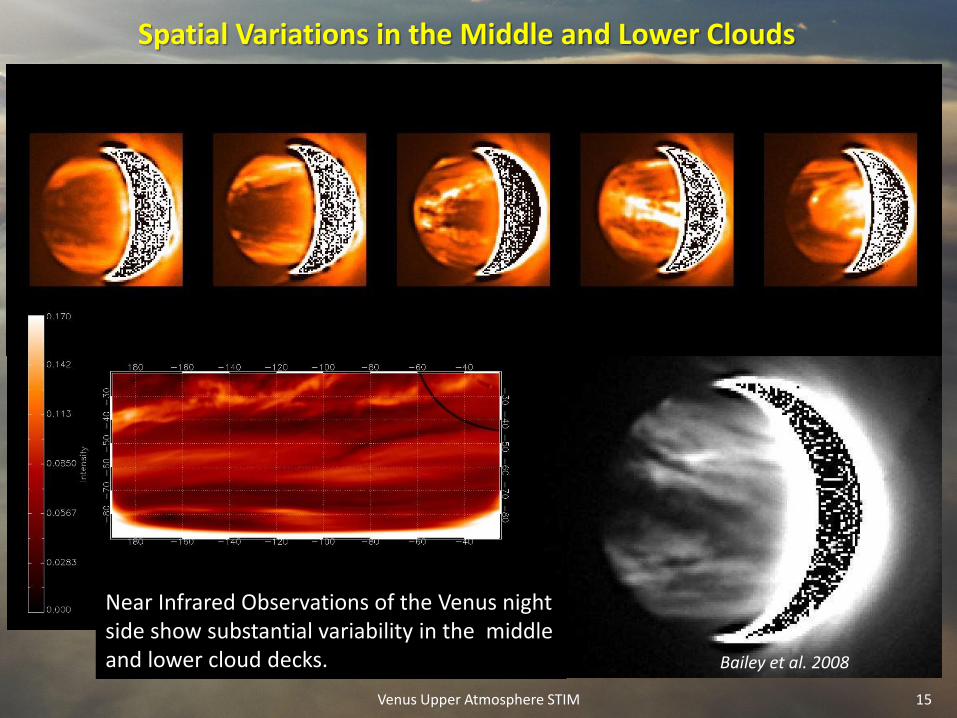
Spatial Variations in the Middle and Lower Clouds
Venus Upper Atmosphere STIM 15
Near Infrared Observations of the Venus night side show substantial variability in the middle and lower cloud decks. Bailey et al. 2008
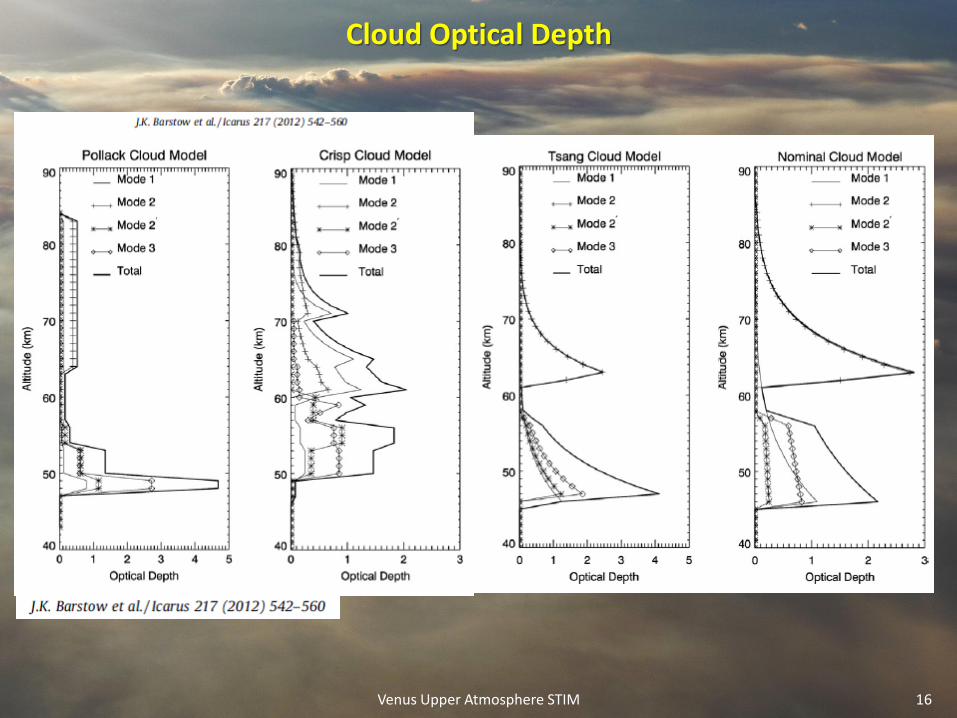
Cloud Optical Depth
Venus Upper Atmosphere STIM 16
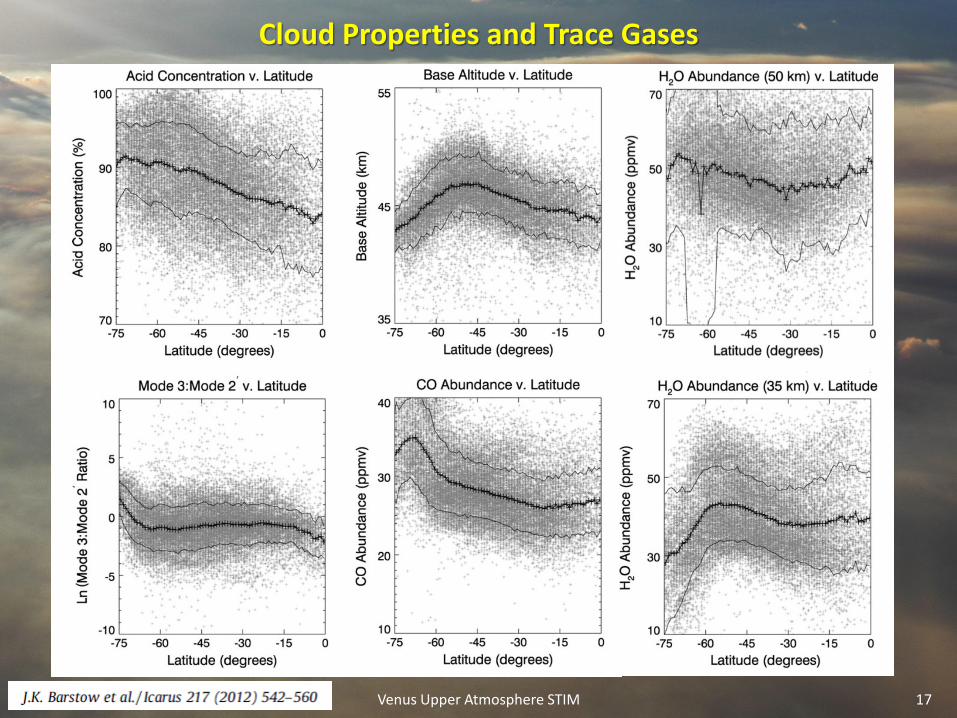
Cloud Properties and Trace Gases
Venus Upper Atmosphere STIM 17
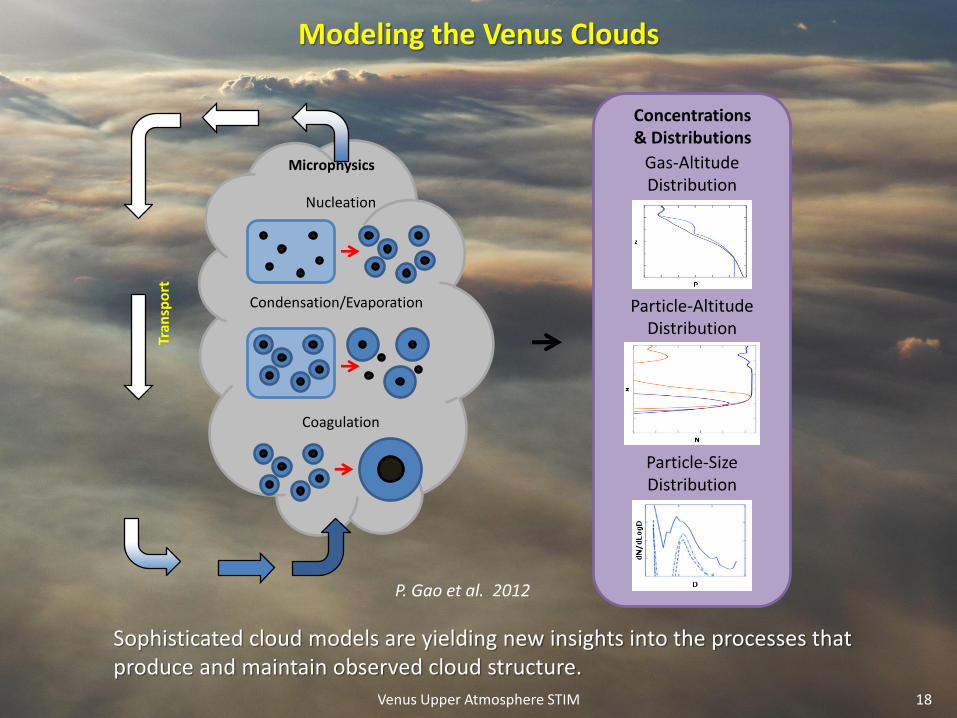
Modeling the Venus Clouds
Venus Upper Atmosphere STIM 18
Microphysics
Nucleation
Coagulation
Condensation/Evaporation
Tran
spo
rt
Concentrations & Distributions
Gas-Altitude Distribution
Particle-Altitude Distribution
Particle-Size Distribution
Sophisticated cloud models are yielding new insights into the processes that produce and maintain observed cloud structure.
P. Gao et al. 2012

Composition/Chemistry/Aerosols
19 Venus Upper Atmosphere STIM
• Major Constituents:
– CO2 (~96.4%) N2 (~3.5%)
• Major Trace Gases:
– SO2, OCS, H2S, H2O, CO, H2SO4
• Reactive Gases:
– HCl, HF, HBr, H2, SO3, OH
• Mysteries
– O2

Summary of Major Trace Gases
20
De Bergh et al. PSS, 2006
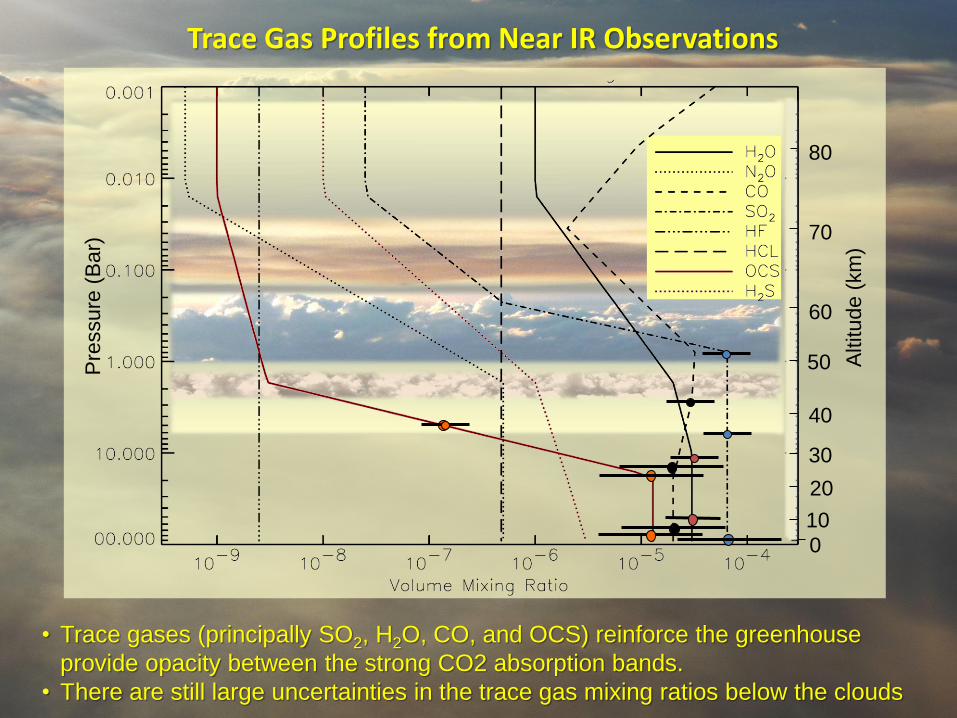
Trace Gas Profiles from Near IR Observations
• Trace gases (principally SO2, H2O, CO, and OCS) reinforce the greenhouse
provide opacity between the strong CO2 absorption bands.
• There are still large uncertainties in the trace gas mixing ratios below the clouds
50
40
30
20
10
0
60
70
80
Altitude (
km
)
Pre
ssure
(B
ar)

SO2 and H2O Variability Above the Cloud Tops
Venus Upper Atmosphere STIM 22
E. Marcq et al. / Icarus 211 (2011) 58–69
V. Cottini et al. / Icarus (2011)
SO2
H2O
Cloud Top Altitude
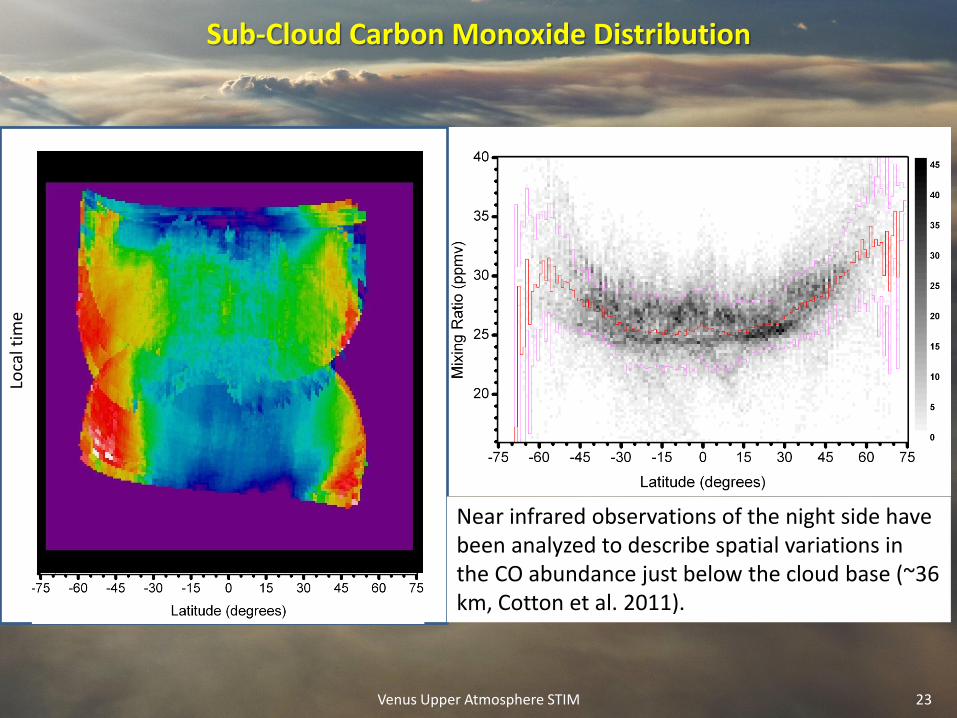
Sub-Cloud Carbon Monoxide Distribution
Venus Upper Atmosphere STIM 23
Loca
l tim
e
Near infrared observations of the night side have been analyzed to describe spatial variations in the CO abundance just below the cloud base (~36 km, Cotton et al. 2011).
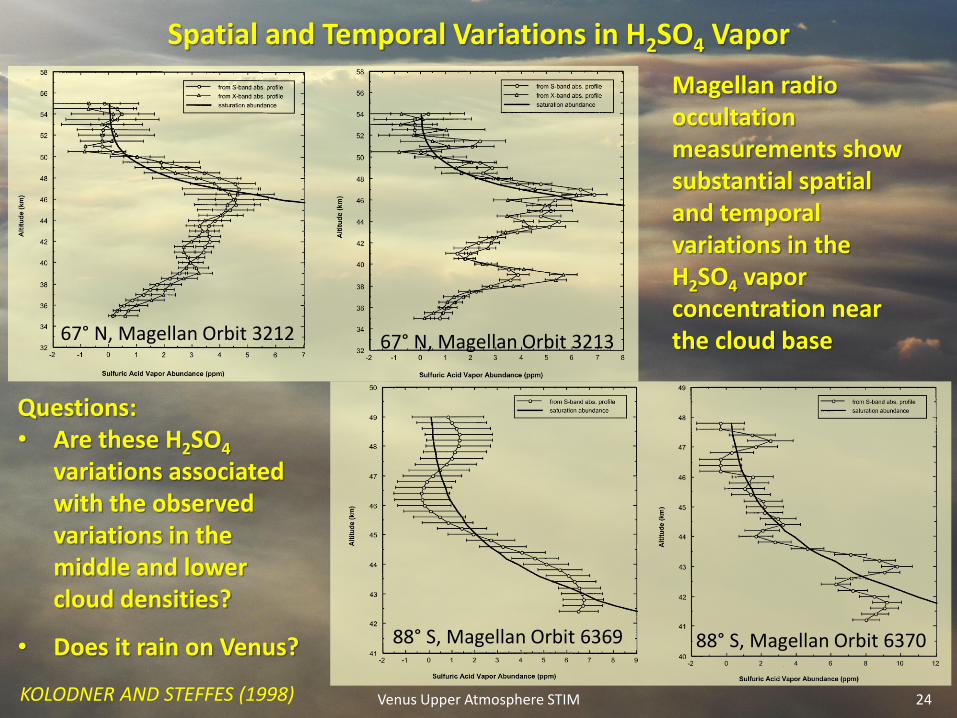
Spatial and Temporal Variations in H2SO4 Vapor
Venus Upper Atmosphere STIM 24
67° N, Magellan Orbit 3213 67° N, Magellan Orbit 3212
88° S, Magellan Orbit 6369 88° S, Magellan Orbit 6370
Magellan radio occultation measurements show substantial spatial and temporal variations in the H2SO4 vapor concentration near the cloud base
Questions: • Are these H2SO4
variations associated with the observed variations in the middle and lower cloud densities?
• Does it rain on Venus?
KOLODNER AND STEFFES (1998)

Atmospheric Circulation
Venus Upper Atmosphere STIM 25

The Large Scale Circulation
• The most prominent and perplexing feature of the Venus general circulation is a global atmospheric super-rotation
– Persistently “retrograde” (East to west) at all levels of the atmosphere between the surface and the mesopause
• Appears to be in “cyclostrophic balance” with the temperature field at these levels
– Largest wind velocities are seen at the cloud tops, where the entire atmosphere appears to rotate with a ~4-day period, almost 60 times as fast as the solid surface.
• The mechanisms responsible for maintaining the superrotation have remained elusive since its existence was confirmed in the late 1960’s
– Appears to be associated with the atmospheric thermal tides, as first proposed by Fels and Lindsen (1974), but the details of the wave-mean flow interactions have not yet been convincingly measured or modeled.
• Other features of the large scale circulation include:
– Polar vortices in both hemispheres
– A direct “Hadley” circulation in the lower atmosphere
– A thermodynamically-indirect circulation in the mesphere
26 Venus Upper Atmosphere STIM

The Venus Superrotation
Venus Upper Atmosphere STIM 27
Hueso et al. (2008)
Counselman et al. (1980)
Hueso et al. (2008)
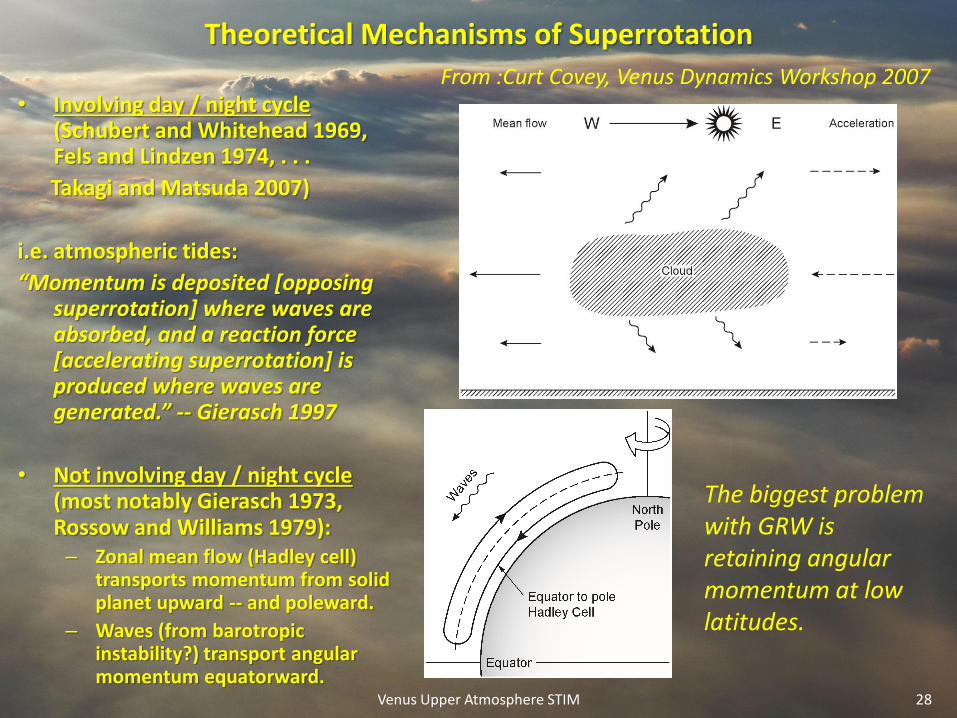
Theoretical Mechanisms of Superrotation
Venus Upper Atmosphere STIM 28
• Involving day / night cycle (Schubert and Whitehead 1969, Fels and Lindzen 1974, . . .
Takagi and Matsuda 2007)
i.e. atmospheric tides:
“Momentum is deposited [opposing superrotation] where waves are absorbed, and a reaction force [accelerating superrotation] is produced where waves are generated.” -- Gierasch 1997
• Not involving day / night cycle (most notably Gierasch 1973, Rossow and Williams 1979): – Zonal mean flow (Hadley cell)
transports momentum from solid planet upward -- and poleward.
– Waves (from barotropic instability?) transport angular momentum equatorward.
The biggest problem with GRW is retaining angular momentum at low latitudes.
From :Curt Covey, Venus Dynamics Workshop 2007

Early History of Venus GCMs
Ancient History: up to Eugenia Kalnay de Rivas (1973, 1975) • No superrotation, by assumption or by calculation
Middle Ages: Richard Young & James Pollack (1977) • Good news:
– Superrotation at model top for all latitudes – Plausible mechanism: weak GRW amplified by instability – 4-Earth-day planetary waves resembling cloud-top UV features
• Bad news: – Extremely lo-res by today’s standards: 4 wavenumbers, 16 levels – Vertical sub-gridscale diffusion doesn’t conserve momentum – No superrotation below 30 km altitude
Renaissance: Tony Del Genio et al. (1990s) • Slowly-rotating all-land Earth GCM • Hydrology, day / night and seasonal cycles all removed • Thick planetwide clouds assumed at 150 and 550 mbar levels • Superrotation via GRW at and below cloud tops (as observed) if:
– Higher levels nearly decoupled from lower levels (via assumed clouds) – New computer, double-precision arithmetic (momentum conservation) “weakly forced / weakly dissipated system”
29 Venus Upper Atmosphere STIM
From :Curt Covey, Venus Dynamics Workshop 2007

Recent History of Venus GCMs
Yamamoto and Takahashi (2003-): CCSR / NIES Model – Variant of Center for Climate System Research’s Earth GCM
– Prescribed solar heating in atmosphere; prescribed surface temperature
– Superrotation via GRW mechanism if solar heating is “larger than that in the real atmosphere below 55 km” and / or gradient of surface temperature is “used as a tunable parameter” to boost Hadley circulation
Lee et al. (2005-2006): Hadley Centre / Oxford Simplified Venus Model – Variant of UK Meteorological Office’s Earth GCM
– More realistic solar heating less realistic (slower) superrotation
Herrnstein and Dowling (2006): Venus EPIC Model – Variant of Explict Planetary Isentropic Coordinate outer-planets GCM
– Including topography even slower superrotation
Lebonnois et al. (2006-): LMD Venus GCM – Variant of Laboratoire de Meteorologie Dynamique’s Earth GCM
– Focus on radiative transfer
Lee et al. (2006-): Venus WRF – “Global planetary” variant Weather Research and Forecasting GCM
30 Venus Upper Atmosphere STIM
From :Curt Covey, Venus Dynamics Workshop 2007

Recent History of Venus GCMs (continued)
31 Venus Upper Atmosphere STIM
From :Curt Covey, Venus Dynamics Workshop 2007
• Hollingsworth et al. (2007) -- “Name your poison” for GRW mechanism:
Mean Zonal Wind (orange / red 70 m s-1)
The right superrotation with . . . or the wrong superrotation
the wrong heating rate . . .with the right (PV) heating rate.
• Takagi and Matsuda (2007) -- Atmospheric tides can initiate as well as maintain superrotation:
“. . . the downward propagaing semidiurnal tide . . . induces the mean zonal flow opposite to the Venus rotation in the lowest layer adjacent to the ground. Surface friction acting on this counter flow provides the atmosphere with the net angular momentum from the solid part of Venus.”
170
180
190
200
210
220
250
270 290
220
20 30 40 50 60 70
Latitude
1
0.1
10-2
10-3
10-4
P (
bar
s)
50
60
70
80
90
100
Ap
pro
ximate A
ltitud
e (km
)
80
Titov et al. (2007)
Mesospheric Temperature and Wind Fields
The Next Steps for Venus GCM’s
“To better constrain and help improve the GCMs, a crucial point is to be able to correctly reproduce the thermal environment in the 45-100 km region at any latitude. That means we need to know this temperature field (more and more data available from Virtis and VeRa), but also the opacity sources (particle distributions) and the radiative fluxes in solar radiation and in thermal emissions. Constraining the distribution of opacity sources is a key point to get the fluxes (and the temperatures) right in the GCMs. PFS is seriously missing, here.”
Sebastien Lebonnois , 24 January 2013
33 Venus Upper Atmosphere STIM
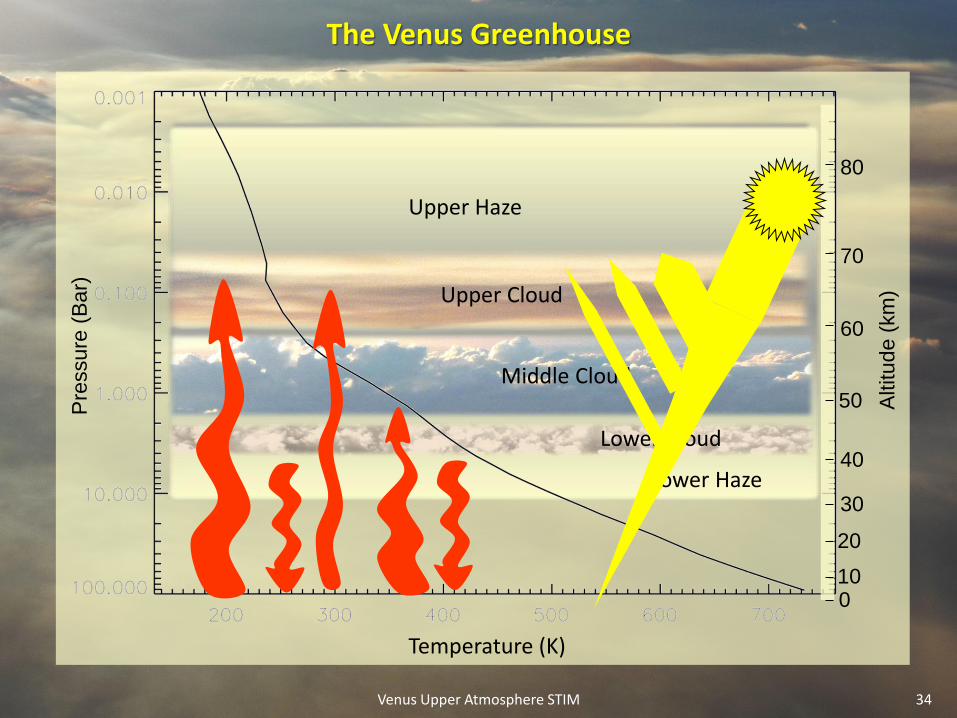
The Venus Greenhouse
Venus Upper Atmosphere STIM 34
Temperature (K)
Pre
ssure
(B
ar)
Upper Cloud
Middle Cloud
Lower Cloud
Upper Haze
Lower Haze
50
40
30
20
10 0
60
70
80
Altitud
e (
km
)
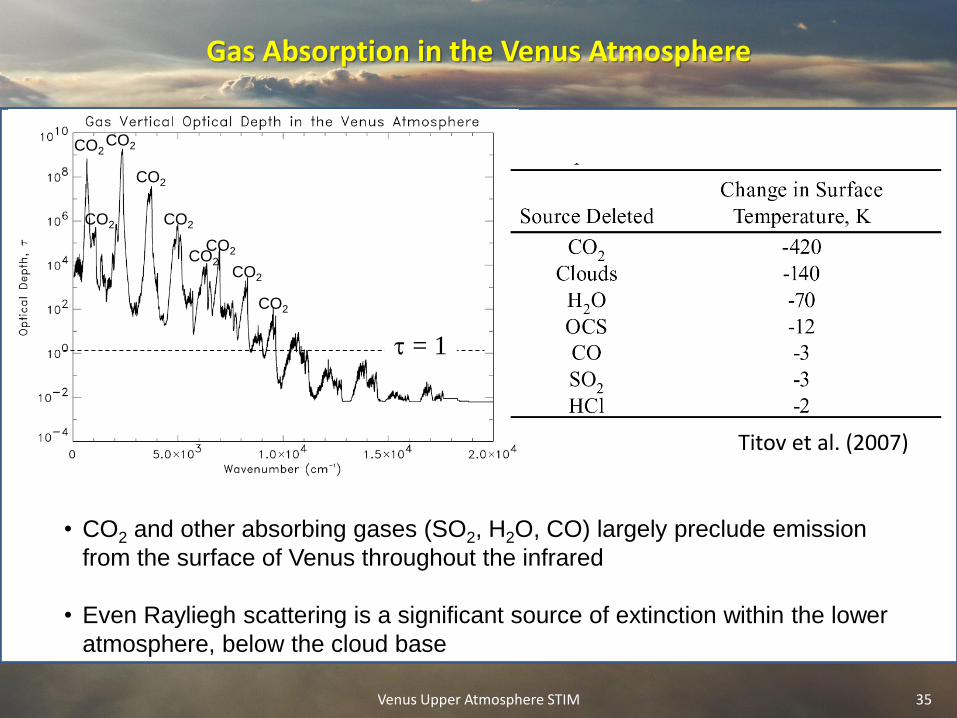
Gas Absorption in the Venus Atmosphere
Venus Upper Atmosphere STIM 35
• CO2 and other absorbing gases (SO2, H2O, CO) largely preclude emission
from the surface of Venus throughout the infrared
• Even Rayliegh scattering is a significant source of extinction within the lower
atmosphere, below the cloud base
= 1
CO2 CO2
CO2
CO2
CO2
CO2
CO2
CO2
CO2
Titov et al. (2007)

Venus Greenhouse Effect
• Although Venus receives almost twice as much solar radiation as Earth
– Its clouds reflect ~76% of the incident radiation
– Total available radiation is ~170 W/m2
• About half of the absorbed solar flux is deposited within or above the cloud tops (~65 km)
– Visible absorption by the unknown UV absorber,
– Near IR absorption by the H2SO4 clouds and CO2
• Only ~2.6% of the solar flux incident at the top of the atmosphere reaches the surface
– Solar flux at the surface is ~17 W/m2 (global avg.)
• Surface temperature of ~730 K maintained by an efficient atmospheric greenhouse mechanism
– Net downward thermal flux at surface ~15,000 W/m2
– There are no true atmospheric windows at IR wavelengths > 3 m
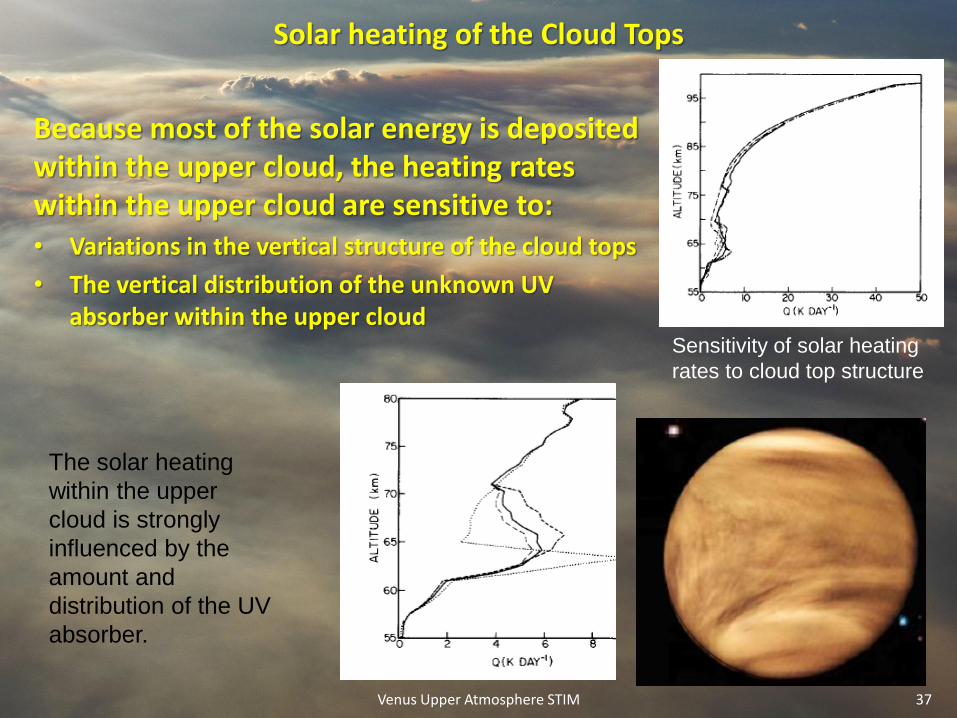
Solar heating of the Cloud Tops
Venus Upper Atmosphere STIM 37
Because most of the solar energy is deposited within the upper cloud, the heating rates within the upper cloud are sensitive to: • Variations in the vertical structure of the cloud tops
• The vertical distribution of the unknown UV absorber within the upper cloud
The solar heating
within the upper
cloud is strongly
influenced by the
amount and
distribution of the UV
absorber.
Sensitivity of solar heating
rates to cloud top structure

Impact of Spatial Variations in the Clouds
Venus Upper Atmosphere STIM 38
Spatial variations in the Middle and Lower Clouds associated with the Near-IR
features produce larger variations in the thermal cooling than in the solar heating
rates.
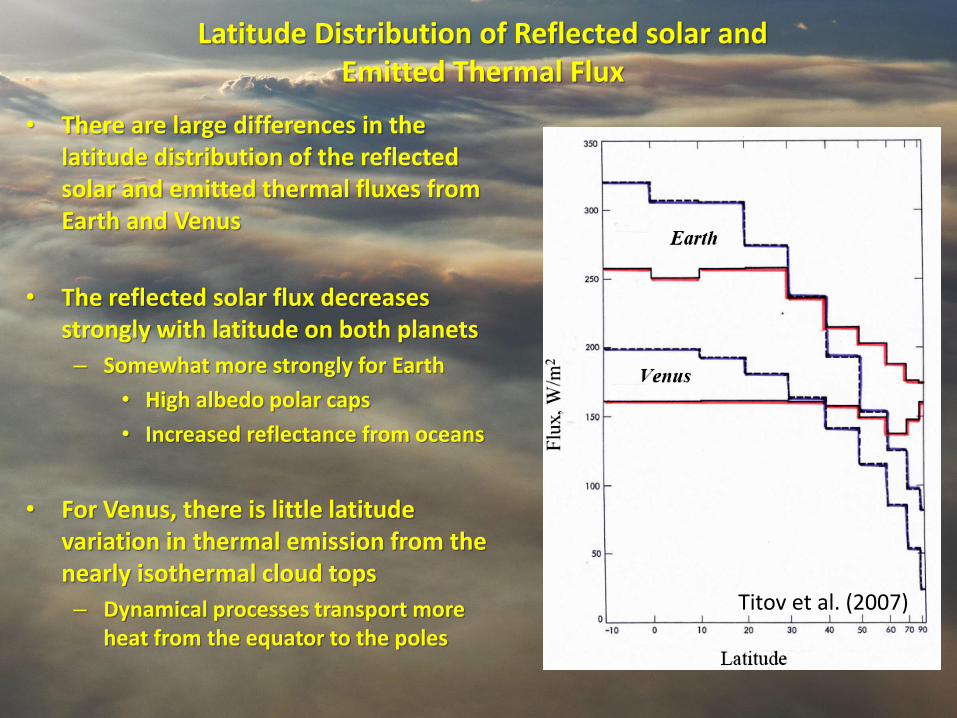
Latitude Distribution of Reflected solar and Emitted Thermal Flux
• There are large differences in the latitude distribution of the reflected solar and emitted thermal fluxes from Earth and Venus
• The reflected solar flux decreases strongly with latitude on both planets
– Somewhat more strongly for Earth
• High albedo polar caps
• Increased reflectance from oceans
• For Venus, there is little latitude variation in thermal emission from the nearly isothermal cloud tops
– Dynamical processes transport more heat from the equator to the poles
Titov et al. (2007)
Conclusions
• Existing ground-based, orbiter and entry probe measurements have provided substantial insight into some aspects of the atmospheric
– Thermal structure
– Composition and cloud distribution
– Atmospheric motions
– Greenhouse forcing of the thermal structure
• While these observations have provided intriguing clues into several aspects of the Venus environment, in many cases they have raised as many questions as they have answered
– What is the UV absorber
– What process maintains the cloud structure
– What processes drive the atmospheric superrotation
– and many more ….
• New observations from well-equipped entry probes and long-lived orbiters are needed to address these questions.
40 Venus Upper Atmosphere STIM