WHAT WE DON'T MEASURE ABOUT HUMAN RESOURCES:
110
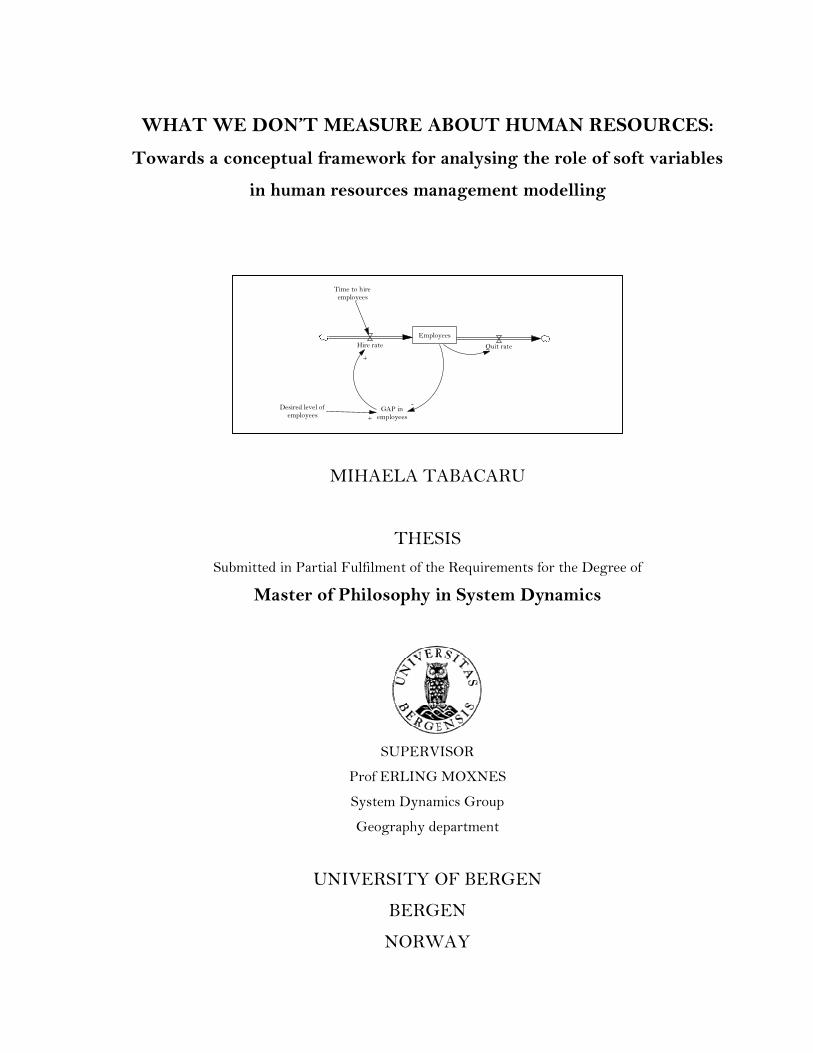
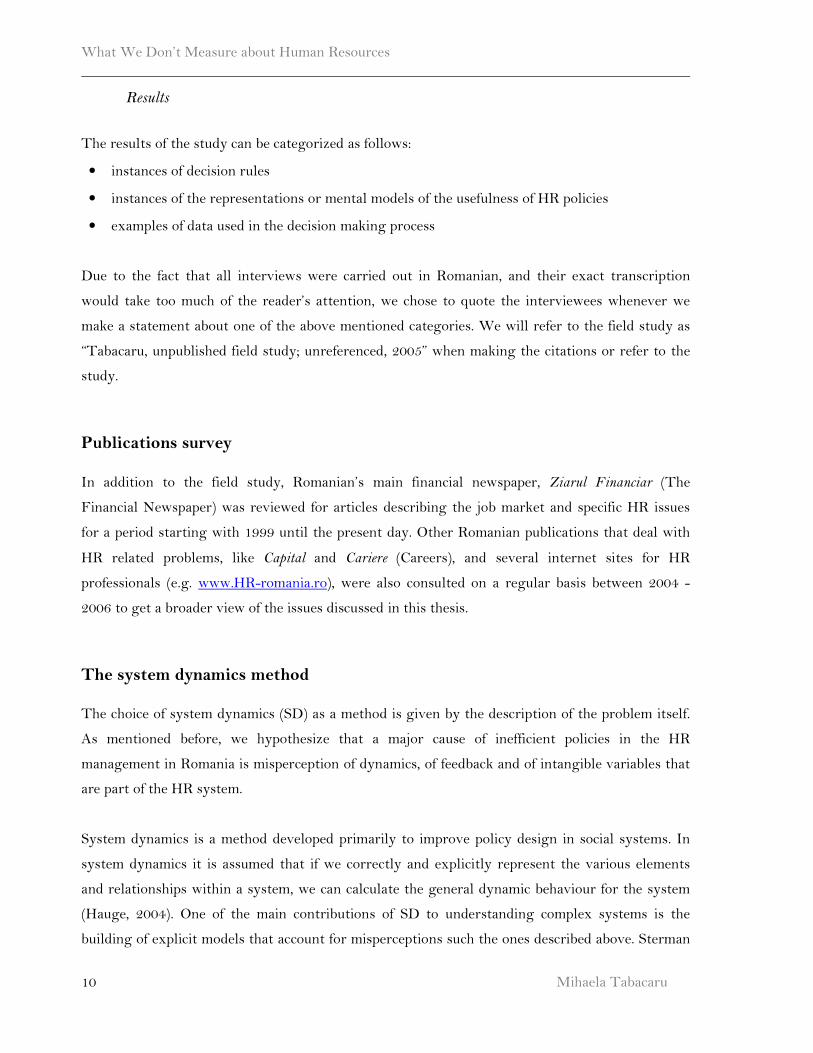
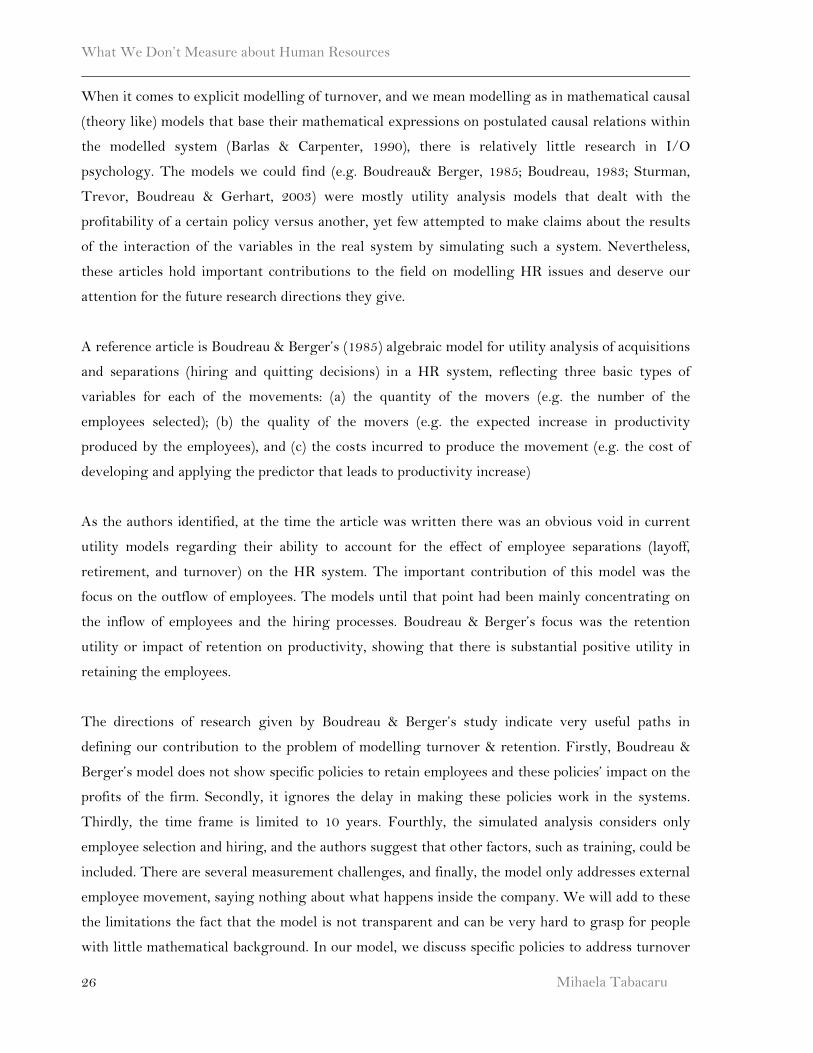
WHAT WE DON’T MEASURE ABOUT HUMAN RESOURCES: Towards a conceptual framework for analysing the role of soft variables in human resources management modelling MIHAELA TABACARU THESIS Submitted in Partial Fulfilment of the Requirements for the Degree of Master of Philosophy in System Dynamics SUPERVISOR Prof ERLING MOXNES System Dynamics Group Geography department UNIVERSITY OF BERGEN BERGEN NORWAY Employees Hire rate Quit rate Desired level of employees GAP in employees + - Time to hire employees +
Transcript of WHAT WE DON'T MEASURE ABOUT HUMAN RESOURCES:
WHAT WE DON’T MEASURE ABOUT HUMAN RESOURCES:
Towards a conceptual framework for analysing the role of soft variables
in human resources management modelling
MIHAELA TABACARU
THESIS
Submitted in Partial Fulfilment of the Requirements for the Degree of
Master of Philosophy in System Dynamics
SUPERVISOR
Prof ERLING MOXNES
System Dynamics Group
Geography department
UNIVERSITY OF BERGEN
BERGEN
NORWAY
Employees
Hire rate Quit rate
Desired level ofemployees
GAP inemployees+
-
Time to hireemployees
+

What We Don’t Measure about Human Resources
Mihaela Tabacaru 3
Table of contents
Abstract............................................................................................................................................ 5
1. INTRODUCTION .................................................................................................................... 6
2. METHOD................................................................................................................................. 8
Fieldwork ................................................................................................................................... 8
Subjects .................................................................................................................................... 8
Procedure................................................................................................................................. 8
Results .................................................................................................................................... 10
Publications survey................................................................................................................... 10
The system dynamics method ................................................................................................... 10
3. LITERATURE REVIEW ....................................................................................................... 13
The HR department - a strategic partner?.................................................................................. 13
Work related attitudes and “soft” variables in HR management ................................................ 14
Attitudes as stocks................................................................................................................... 14
The relation between attitudes and behaviour ......................................................................... 17
Measuring intangibles: the accessibility of data bias ................................................................. 17
Causal search and attribution................................................................................................. 18
Salience of quantitative data ................................................................................................... 19
Current policies description ...................................................................................................... 20
Normative policies ................................................................................................................... 23
Previous modelling of HR processes......................................................................................... 25
Psychology literature.............................................................................................................. 25
System dynamics literature ..................................................................................................... 27
Summary.................................................................................................................................. 30
4. MODEL BUILDING.............................................................................................................. 31
Reference mode........................................................................................................................ 31
Model overview........................................................................................................................ 34
Causal loop diagrams (CLD).................................................................................................. 34
Stock and flow diagrams......................................................................................................... 37
Job Satisfaction (JS) ................................................................................................................. 40
Definition ............................................................................................................................... 40
Determinants of JS.................................................................................................................. 41
Measuring JS.......................................................................................................................... 42
Relationship job satisfaction - turnover................................................................................... 43
Relation of job satisfaction to productivity and performance................................................... 43
Model building ......................................................................................................................... 45
Model boundary...................................................................................................................... 46
Time horizon........................................................................................................................... 47
The general employee framework ........................................................................................... 47
Job satisfaction....................................................................................................................... 50
HR quality .............................................................................................................................. 59
Productivity ............................................................................................................................ 65
Summary.................................................................................................................................. 67
5. VALIDATION ....................................................................................................................... 68
Direct structure test .................................................................................................................. 68
Structure oriented behaviour test............................................................................................... 69
Extreme conditions ................................................................................................................. 69
What We Don’t Measure about Human Resources
Mihaela Tabacaru
4
Behaviour sensitivity .............................................................................................................. 71
Integration error .................................................................................................................... 73
Behaviour reproduction.......................................................................................................... 74
Boundary adequacy test.......................................................................................................... 76
Summary...................................................................................................................................77
6. POLICY ANALYSIS............................................................................................................. 78
Reference case ..........................................................................................................................78
Base case - current policies .......................................................................................................78
Is job satisfaction really ignored?........................................................................................... 80
Alternatives to the “Buy” policy................................................................................................81
Policy 1: promote ................................................................................................................... 81
Policy 2: promote AND reward .............................................................................................. 84
Alternative to the “Train” policy ...............................................................................................87
Policy 3: promote AND reward AND coach ........................................................................... 87
Summary...................................................................................................................................89
7. CONCLUSIONS.................................................................................................................... 90
Further research ........................................................................................................................91
References ..................................................................................................................................... 92
Web resources ........................................................................................................................ 98
ANNEX ......................................................................................................................................... 99
List of equations........................................................................................................................99
What We Don’t Measure about Human Resources
Mihaela Tabacaru 5
Abstract
Low retention of valuable employees and difficulties in finding qualified candidates for recruitment
are two issues managers face in Romania, but are a growing concern around the world (Deloitte,
2004; Holton & Naquin, 2004). High turnover of specialists disrupts organizational continuity
(Lum, et al,1998) and the current policies don’t seem to have the expected results, according to the
field study of the author. We suspect that the cause of inefficient policies lies in a misperception of
dynamics, ignorance of feedback loops and of intangible stocks, like the job satisfaction of
employees. Although well documented in psychology literature (Lichenstein, 1998), the influence of
job satisfaction on turnover seems to be ignored by the policy makers. We test policies that account
for the determinants of job satisfaction and show that the outcome of such policies is better than
the current ones. Implications for HR policy design and directions for future research are indicated.
KEY WORDS: Human resources; Job satisfaction; Intangible variables; Misperception; Policy
design; Attitudes
What We Don’t Measure about Human Resources
Mihaela Tabacaru
6
1. INTRODUCTION
Low retention of valuable employees and difficulties in finding qualified candidates for recruitment
are two issues managers face in the high growth markets, like the banking and telecom industries,
in Romania today. While this thesis addresses issues in the Romanian human resources (HR)
market, it also reflects a growing concern among consultants around the world about retention of
talents in companies (Deloitte, 2004; Holton & Naquin, 2004).
External HR consultants and managers in Romania are complaining about the difficulties of
making long term plans for their firms because of the high turnover of specialists. Literature
indicates that functional turnover, that separates the poor performers in the company, is efficient
for the companies (Hollenbeck& Williams, 1986; Dalton, Krackhardt & Porter, 1981). Yet
consultants are complaining that the best, not the poorest performers are leaving. Thus turnover
represents a problem because it entails greater costs than benefits and it disrupts organizational
continuity (Lum et al, 1998).
The turnover is just a symptom, and the problem, in the eye of the managers and policy makers, is
that employees are not motivated enough and that they need higher salaries or training in order to
stay (Tabacaru, unpublished field study; unreferenced, 2005). The current solutions to the problem
are the “buy” strategy, in which companies are attracting highly qualified employees by setting
high salaries, even higher than those of the people currently employed on the same position, and
the “train” strategy, meant to both increase the quality of the employees and increase their job
satisfaction. Yet the policies are not yielding the expected results, and our aim is to show why.
We suspect that the current Romanian HR policies are inefficient because of the misperception of
employee work related attitudes when designing policies addressing retention. Although literature
shows the training does not directly influence job satisfaction, the current policies falsely assume a
causal link between the two. Furthermore, we give evidence that the policy makers focus mainly on
hiring policies to replace the loss of specialists, but they ignore, or they don’t measure, the real
causes behind the turnover. Literature (Sterman, 2004; Moxnes, 2004) shows that people stop
searching when they have found one possible cause for the behaviour they observe, and that they
misperceive even the simplest dynamic systems. The policy makers’ focus is on the easy-to-measure
What We Don’t Measure about Human Resources
Mihaela Tabacaru 7
data, like turnover and number of employees, thus misperceiving “soft” variables like the work
attitudes. The intention to quit, job satisfaction and organizational commitment are three key
employee attitudes that influence the turnover. (Ostroff et al, 2003; O’Reilly, Chatman, & Caldwell,
1991; Carmeli, 2005). Commitment should be built by improving these attitudes.
Even though work related attitudes are not easily measured, that does not mean that they are not
quantifiable. The so called “soft”, or difficult-to-measure, factors are powerful drivers of growth and
decline in the tangible resources that determine performance (Warren, 2000; Sveiby, 1997; Sveiby,
Linard & Dvorsky, 2002). Thus understanding performance and evaluating the impact of policies
over time requires that these soft factors too be evaluated and dealt with rigorously.
The present paper is based on both a fieldwork carried out by the author in 2005 in Romania, and
on the experience the author has in working in HR departments in Romanian based multinational
companies. Starting from the realities of the Romanian market and building on the psychology
literature related to work attitudes like job satisfaction, we construct a model that explicitly shows
the influence of these attitudes in the HR policy design and we test policies addressing the
improvement of job satisfaction. We show that the policies that account for the real determinants of
job satisfaction yield better results than the current policies.
The thesis is organized as follows. The second chapter presents an overview of the methodology
used to investigate the turnover phenomenon in Romania, the structure of the interviews and the
subjects of the fieldwork, and it introduces the system dynamics method and its contribution to
understanding complex systems and policy design. Chapter 3 is a literature review about current
and normative policies and about the misperception of dynamics and feedback in complex systems.
The fourth and fifth chapter represent the modelling part. Chapter 4 presents the model we build
and the psychology literature its variables are based on, assessing the validity of the model by
direct comparison with knowledge and information about the real system (Forrester and Senge,
1980). The following chapter, the fifth, presents the validation process and its results. Chapter 6
represents the main contribution of the thesis, the policy analysis, where different policies are
tested and their results and impacts on the main indicators of the firm are discussed. Finally, in the
last chapter, implications for policy making are discussed and directions are given for future
research.
What We Don’t Measure about Human Resources
Mihaela Tabacaru
8
2. METHOD
This chapter presents an overview of the method used to investigate the specialists’ turnover
phenomenon in Romania. It presents the structure of the interviews, the subjects and the procedure
of the fieldwork and it goes on by presenting the system dynamics method and its contribution to
understanding complex systems and policy design in these systems.
Fieldwork
The research this thesis is based on is a fieldwork carried out by the author in the period June -
August 2005, in two cities in Romania, Bucharest and Cluj-Napoca. The choice of the interview as
an investigation method was motivated by the need to gather qualitative data and its importance in
developing system dynamics models (Forrester, 1992).
Subjects
The participants were, on the one hand, managers in multinational companies (mostly banking and
telecom), and on the other hand, external HR consultants that had more than 7 years experience on
the Romanian job market. The reason for choosing to interview both managers and consultants
was to have a broader view and to confirm, partially, that what the consultants were saying is what
actually happens in the companies. The age range of the subjects was between 25 and 45 years old.
All the subjects were very cooperative. The author’s 6 years experience as an HR consultant in
different companies in Romania was a mediating factor in the access to the pool of subjects. Most
subjects were known to the author from before hand; however the same set of questions was
applied to all of them.
Procedure
The interviews were semi-structured and contained a set of questions that were asked to all
participants, as a basis for discussion. The “semi structured” interview is somewhat in the middle of
a continuum that has on one end the “structured” interview, in which the interviewer determines
the precise form and direction of questions in advance, and at the other end the “unstructured”
interview, with no line of question prepared, but in which the interviewer decides what questions to
What We Don’t Measure about Human Resources
Mihaela Tabacaru 9
ask from moment to moment depending on the information given by the respondent (Dyer, 1995).
The questions were aimed at discovering the set of policies most commonly used in companies and
the indicators used in making the decisions. As Hauge (2004) suggests, the policy analysis
investigation should concentrate on the operational goals decision makers have, on the rules
guiding decisions (standard operating procedures), on the structural maps and on the control
structures for choosing the policy type.
The language used was Romanian. All interviews were recorded and are available upon request in
“.wma” format. All interviews were carried out at the premises of the interviewee. This practice
facilitates the remembering of items and decisions made because of the similarity of the context in
which the events actually take place (Smith, Osherson, Rips & Keane, 1988, cited in Miclea, 1999).
The following questions were asked to all managers from companies. The same kind of questions,
but asking subjects to relate in general to the clients they have, were asked to the external HR
consultants:
1. How much of your time would you say you spend on HR related activities? What are those
activities? Give me an example from the past month.
2. Describe the HR processes in your department/company, what do you do. Report a success
case and a failure of an HR policy.
3. What do you say best describes the end result of HR policies?
4. What do you report about HR to your superiors? What is the data you measure? How do
you measure HR policies effectiveness?
5. How do you decide when a person needs training or receives coaching?
6. Try to sketch, in a graphical form, the relation between training and employee retention or
commitment.
7. What are other policies that the company has adopted in order to ensure that people stay
within the firm; give specific examples.
The drawbacks of interviewing, as pointed out in the literature (Dyer, 1995) and that we tried to
counteract throughout the process, were the social desirability effect, very frequent in interviewing;
general statements rather than specific examples; mistrusting the interviewer; and the
“confidentiality” clause for not giving specific information from the firm.
What We Don’t Measure about Human Resources
Mihaela Tabacaru
10
Results
The results of the study can be categorized as follows:
• instances of decision rules
• instances of the representations or mental models of the usefulness of HR policies
• examples of data used in the decision making process
Due to the fact that all interviews were carried out in Romanian, and their exact transcription
would take too much of the reader’s attention, we chose to quote the interviewees whenever we
make a statement about one of the above mentioned categories. We will refer to the field study as
“Tabacaru, unpublished field study; unreferenced, 2005” when making the citations or refer to the
study.
Publications survey
In addition to the field study, Romanian’s main financial newspaper, Ziarul Financiar (The
Financial Newspaper) was reviewed for articles describing the job market and specific HR issues
for a period starting with 1999 until the present day. Other Romanian publications that deal with
HR related problems, like Capital and Cariere (Careers), and several internet sites for HR
professionals (e.g. www.HR-romania.ro), were also consulted on a regular basis between 2004 -
2006 to get a broader view of the issues discussed in this thesis.
The system dynamics method
The choice of system dynamics (SD) as a method is given by the description of the problem itself.
As mentioned before, we hypothesize that a major cause of inefficient policies in the HR
management in Romania is misperception of dynamics, of feedback and of intangible variables that
are part of the HR system.
System dynamics is a method developed primarily to improve policy design in social systems. In
system dynamics it is assumed that if we correctly and explicitly represent the various elements
and relationships within a system, we can calculate the general dynamic behaviour for the system
(Hauge, 2004). One of the main contributions of SD to understanding complex systems is the
building of explicit models that account for misperceptions such the ones described above. Sterman
What We Don’t Measure about Human Resources
Mihaela Tabacaru 11
(2000) sees system dynamics as a method to enhance learning in complex systems. As an
interdisciplinary method, SD is concerned with the behaviour of complex systems, and even if it is
grounded in the theory of nonlinear dynamics and feedback control developed in mathematics,
physics and engineering, it applies these tools to the behaviour of humans, drawing on cognitive
and social psychology, economics and other social sciences.
The building blocks of system dynamics are the following concepts:
• Stock and flow
Stocks, as accumulations, represent the state of the system and generate the information upon
which the decisions and actions are based. Stocks accumulate the difference between the inflow to a
process and its outflow (Sterman, 2000, p.192). According to Mass (1980, cited in Sterman 2000),
stock are also critical in generating the dynamics of systems because they provide systems with
inertia and memory, being the source of delays and creating disequilibrium dynamics by decoupling
rates of flow. Examples of such structures are ubiquitous in our lives: the bank account is a stock
and the deposits and withdrawals from that account represent inflows and outflows, respectively;
the stock of employees in a company increases with the inflow of hiring and decreases with the
outflow of quitting or firing; a company’s stock of customers increases with new acquisitions
(inflow) and decreases with churn (outflow).
• Feedback
Feedback is a pervasive component in learning about complex systems. We gather information
feedback about the world around us, and then use this information in altering the world through
the decisions we are making. However, feedback is often difficult to see and, as Sterman (2000, p.12)
says, “…much of the art of system dynamics modelling is discovering and representing feedback
processes”. Moxnes (2004) has shown that we have problems managing the simplest feedback
systems even when we have the complete information about the variables. Other experiments show
that the misperceptions of feedback are robust to experience, financial incentives, and the presence
of market institutions (Diehl and Sterman, 1993; Paich and Sterman, 1993; Kampmann and
Sterman, 1998). An example of misperceived feedback in our problem system is the influence of the
“buy” hiring policies (paying very high salaries for newly acquired employees), designed for
fighting against the loss of specialists: the difference in salaries influences the distributive justice
perception of current employees, which decreases the employees’ job satisfaction, which in turn,
increases the specialists’ turnover, thus rendering the policy inefficient.
What We Don’t Measure about Human Resources
Mihaela Tabacaru
12
• Delay
A delay is a process whose output, or result, falls behind its input in some way. A good example of
delay is hiring people in a company. The input to the delay is the rate at which vacancies or
positions are created. The result, or output, is the rate at which people are being hired. In between
these two delays is the stock of vacancies that need to be filled in the recruitment process. Other
examples are alcohol in taking, CO2 absorption in the atmosphere, and the supply or distribution
chain. Delays may seem easy to understand, but they are very frequently ignored in making
decisions, often leading to oscillations (see, for example, the Beer Distribution Game, Sterman,
1989). The delay in training new employees until they become fully productive or the delay
involved in the set up of a promotion system in the company are other instances of delays in the
system we are describing.
• Nonlinear relationship
It is very rare that effects are proportional to the cause (linear relationship), and what characterizes
a relationship at the beginning may not characterize it towards the end of the time frame. For
example, working overtime may be efficient for increasing the productivity in the beginning, but, as
tiredness accumulates, the worker becomes less productive (the worker burnout model by Homer,
1985, gives a good example of the effects of this nonlinearity). Similarly, when investing in
training, there is no direct increase in quality, unless coaching is provided, and the effect of
coaching saturates after a while, meaning that the relationship levels off after the maximum
absorption threshold is reached, showing a diminishing marginal return behaviour.
The building of explicit models and the use of simulations are very useful when solving policy
issues. The purpose of modelling is to gain insight into the problem, because, as Simon (1977)
demonstrates, people are not rational beings, weighing all possible outcomes of decisions and
analyzing all probabilities. Often the policies decision makers are choosing give counterintuitive
results (Sterman, 2000). This ability to explicitly simulate decisions and learn from this process is a
very good argument in favour of choosing system dynamics as a tool for investigating our problem.
What We Don’t Measure about Human Resources
Mihaela Tabacaru 13
3. LITERATURE REVIEW
This literature review is about the human resources (HR) department as a strategic department,
and about the misperception of intangible variables and the psychology concepts they are based on.
It also includes a section about current and normative policies applied to turnover issues. It finally
reviews previous literature about HR issues modelling and draws attention to the attitude concept
in psychology and why we think it is important for our problem description.
The HR department - a strategic partner?
The purpose of the HR department has always been to improve the performance of the system in
which it is embedded and which provides the resources to support it (Swanson and Arnold, 1997).
This statement points to the dynamics of the HR subsystem: investment in HR increases
performance, yields growth, which in turn gives more resources to other investment initiatives.
More specific to the training process, Hinrichs (1976) comments:
”The nature of the training process, when reviewed as a series of procedures to foster skill acquisition, immediately
suggests an open system model of what’s involved. Components of the model should be readily apparent to those with
even a brushing acquaintance with the systems theory: inputs (trainees, organizational resources), some type of system
operator (individual learning process, the ’training program’), and outputs (skilled personnel, organizational success).
Systems feedback occurs through the training evaluation procedures, either research based or informal” (page 834)
However, many organizations, especially small businesses, fail to take the HR strategies into
account when planning the firm activity. Their ‘do-nothing’ policies often result in a permanent
crisis management producing lay-offs and early retirement incentives that produce long-term
problems, such as shortages of high-qualified personnel (London, 1985). Too often the HR
subsystem operates in isolation from other subsystem of the firm in reactive functions.
Employee retention is an important issue, particularly in high growth markets, yet the companies
don’t seem to always make the right steps towards achieving a high retention goal. Deloitte
consulting, in a report (2004) about the acquisition and retention strategies affecting corporations
around the world in the next 4 years, show that the typical US company spends fifty times more on
recruitment of a 100.000 $ professional than it invests in his annual training after he has been
What We Don’t Measure about Human Resources
Mihaela Tabacaru
14
hired. The average cost to replace an employee is one and half times one average yearly salary.
New employees can take a year or more to master their jobs. Moreover, a company that focuses on
external talent, but does not breed from within, can erode the commitment of internal candidates.
Employee retention is a complex construct, not just one variable (Lynard & Dvorsky, 2003) and it
is affected by several factors, among which are: work overload, role ambiguity and job satisfaction
(the overall degree in which a person likes his job). It would seem obvious that these intangible
factors are the ones companies need to manipulate and integrate into their long term strategies if
they want to keep their valuable employees. Yet too few companies even consider such issues.
Intangible variables often create measurement difficulties, but that does not mean they are not
quantifiable. We believe it would be very useful to make managers see the impact of these
intangibles on the turnover, on the quality of employees and on the profits of the company. We will
review, in what follows, why we believe the attitudes are central to our problem and some of the
reasons for the difficulty of grasping intangibles.
Work related attitudes and “soft” variables in HR management
Attitudes as stocks
Why talk about attitudes in relation to human resources problems and to their system dynamics
modelling? The majority of organizational scientists would agree that attitudes play the central
role in their discipline. Attitude is defined as “a psychological tendency that is expressed by
evaluating a particular entity with some degree of favour or disfavour” (Eagly & Chaiken, 1993).
Olson and Zanna (1993, p.119) note that most attitude theorists would agree that :
“…(a) evaluation constitutes a central, perhaps predominant, aspect of attitudes; (b) attitudes are represented in the
memory; and (c) affective cognitive and behavioural antecedents of attitudes can be distinguished, as can affective,
cognitive, and behavioural consequences of attitudes”
What We Don’t Measure about Human Resources
Mihaela Tabacaru 15
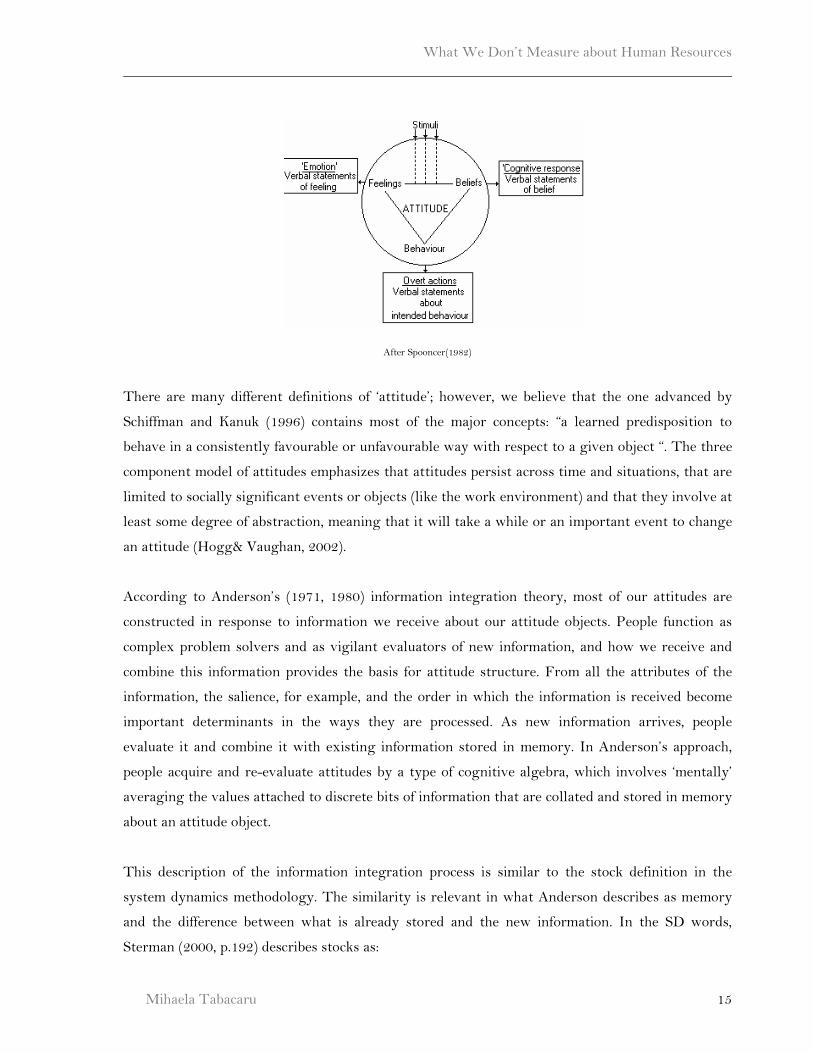
After Spooncer(1982)
There are many different definitions of ‘attitude’; however, we believe that the one advanced by
Schiffman and Kanuk (1996) contains most of the major concepts: “a learned predisposition to
behave in a consistently favourable or unfavourable way with respect to a given object “. The three
component model of attitudes emphasizes that attitudes persist across time and situations, that are
limited to socially significant events or objects (like the work environment) and that they involve at
least some degree of abstraction, meaning that it will take a while or an important event to change
an attitude (Hogg& Vaughan, 2002).
According to Anderson’s (1971, 1980) information integration theory, most of our attitudes are
constructed in response to information we receive about our attitude objects. People function as
complex problem solvers and as vigilant evaluators of new information, and how we receive and
combine this information provides the basis for attitude structure. From all the attributes of the
information, the salience, for example, and the order in which the information is received become
important determinants in the ways they are processed. As new information arrives, people
evaluate it and combine it with existing information stored in memory. In Anderson’s approach,
people acquire and re-evaluate attitudes by a type of cognitive algebra, which involves ‘mentally’
averaging the values attached to discrete bits of information that are collated and stored in memory
about an attitude object.
This description of the information integration process is similar to the stock definition in the
system dynamics methodology. The similarity is relevant in what Anderson describes as memory
and the difference between what is already stored and the new information. In the SD words,
Sterman (2000, p.192) describes stocks as:
What We Don’t Measure about Human Resources
Mihaela Tabacaru
16
“Stocks are accumulations. They characterize the state of the system and generate the information upon which
decisions and actions are based. Stocks give systems inertia and provide them with memory”.
We believe that attitudes are a very good indicator of the state of the system. The goal of the
attitude, that of maximum value, against which actions are weighed, is constantly re-evaluated in
the light of the information regarding the work environment changes.
One might very well ask: why show the variables that represent people’s attitudes, since they are so
hard to measure? And since the instances preceding them have, in the end, an influence on
turnover, why not link the precedents directly to turnover and show a mathematical formula of the
relation that will encompass the mediating factors (that is the attitudes) in its formulation?
When people ignore accumulations in their structural maps, they reduce the time span of their
thinking (Hauge, 2004; Sterman, 2000). Many actions have consequences that materialize after a
long time. The Beer-game is a well-known management example of what happens when people
ignore the orders that they have sent, but where they not yet have received the goods ordered. The
goods on order can be represented as a stock, and when people order more goods because they only
ordered an amount of goods last time period, and not look at their total amount of orders, they
experience systems that have tendencies to overshoot and collapse (Sterman, 2000).
The purpose of this thesis is to show the managers what are the things that they are excluding
from their decisions. This can only be done by explicitly showing the delays and the stocks they are
ignoring, because SD research has been striving to show that explicit representations of the
instances we consider when making decisions, are powerful instruments in improving decision
making. As Sveilby, Linard and Dvorsky state (2005):
“To the extent that qualitative variables are perceived to be relevant to the problem under review, and would
otherwise implicitly be factors into managerial decision making, it is far better to confront the choice values openly
and explicitly rather than allow them to be hidden. In this way, decision makers and stakeholders are better able to
identify the implications of the qualitative assumptions and to challenge their usage or valuation if this seems
desirable.”
What We Don’t Measure about Human Resources
Mihaela Tabacaru 17
The relation between attitudes and behaviour
The relation between attitudes and behaviour has been long studied in social psychology (for a
comprehensive review on the attitudes’ research see Azjen, 1991; Azjen and Fishbein, 1980). Current
research views attitudes as a construct that precedes behaviour and guides our choices and decisions
for action, even though it is not something directly observable (Hogg& Vaughan, 2002). The word
“attitude” comes from the Latin word aptus which means “fit and ready for action”. Describing the
relation, Azjen (1991) notes that:
“Intentions to perform behaviours of different kinds can be predicted with high accuracy from attitudes toward the
behaviour, subjective norms, and perceived behavioural control; and these intentions, together with perceptions of
behavioural control, account for considerable variance in actual behaviour.”
The literature shows that attitudes are predictors of what people will do, so it is worth measuring
them from that perspective. In the broadest sense of functionality, attitudes facilitate adaptation to
the environment (Eagly & Chaiken 1993). A word of caution, however: establishing a correlation
does not establish causation, though it often provides evidence about causation. To establish
causation, other reasons must be ruled out. For example, sending people to training and increasing
retention may correlate, but it is not necessarily true that one causes the other. In other words,
caution is required if we want to demonstrate a relation between attitude and behaviour, both have
to be measured appropriately and for a longer period of time to avoid confounding factors
(Furnham, 1997). This is exactly what the organizations are not doing: they are measuring
behaviour, but not attitude. Why is it so hard to take into account such intangible variables as the
attitudes, although there it least some recognition of their importance?
Measuring intangibles: the accessibility of data bias
The importance of these “soft” indicators that we are stressing is not obvious to the decision
makers, even though literature, especially the industrial and organizational psychology literature,
has a long history of research on how satisfaction influences turnover and productivity. What we
have here is a problem of VISIBILITY. We will try to build on psychology literature to support
the inclusion of the “soft” variables in our model.
What We Don’t Measure about Human Resources
Mihaela Tabacaru
18
Causal search and attribution
Many of our beliefs concern the relation between one quantity and another and we are concerned
with such relationships because we want to decide whether to manipulate one thing in order to
affect another (Barron, 1995). What is the relation between the amount of money I invest in
training and the performance improvements I get? How about the job satisfaction and the training
opportunities? Over the long term, how do my recruiting efforts reflect the quality of the people I
have in the firm? The normative theory points towards statistical correlation, but people
systematically violate this normative view.
Correlations are very often confused, in everyday reasoning, with causal relationships (Barron,
1995). Research about the probability heuristics shows that people have a bias towards correlating
two instances simply by associating the presence of two, and ignore the combination of
probabilities of one or both being absent (Smedslund, 1963). Subjects typically attend to the
probability of the outcome given the “present” cue only. In a case of associating the probability of a
disease with the presence of one symptom for example, Smedslund shows that 85% of the nurses
investigated stated there is relation between the two, even though the number of times when the
symptom was absent and the disease present was almost as high as when both are present. This is
very relevant in organizations, when associating instances in the surrounding environment and
picking up the present cues helps develop very simple cause and effect relationships, which lead to
the misperception of dynamics.
Documentation of attributional activity is, from an experimenter’s point of view, a difficult task to
explore. However, there is reasonable consensus (Weiner, 1985) that search for a cause is elicited
by either an unexpected event or by a failure in an otherwise familiar and successful task. In other
words, policy designers will only look for a cause if something goes wrong or unexpected, and then
stop looking when they will have found a first possible cause to explain that. Vandenbosch &
Higgins (1996) found that as long as companies were doing satisfactorily, they made little effort to
improve their decision rules. As Hauge (2004) reports, a search activity’s success or failure is
evaluated based on short-term feedback, and an activity’s past record of accomplishment
determines its likelihood to be used the next time the search procedure is implemented. The search
procedure, therefore, controls the adaptation of the policies, the learning techniques, and the key
organizational goals. Vandenbosch & Higgins (1996) found that scanning behaviour, more often
than other types of information acquisition, led the policy designer to find new and challenging
information that contributed to mental model building. Sometimes, however, policy designers are
What We Don’t Measure about Human Resources
Mihaela Tabacaru 19
not able to perceive new and unusual information, and in such cases, scanning behaviour will result
in mental model maintenance. This may very well be the case of the ignored soft variables.
Salience of quantitative data
An important factor that influences the choice of policies is the salience and relative easiness of
collecting quantitative data, versus the more unquantifiable variables. In an experiment by
Feldman (2004) about the culture of objectivity at NASA, it is shown that misunderstanding
leading to the explosion of Challenger and Columbia spaceships resulted from two general aspects
of NASA's culture: (i) an over-confidence in quantitative data went hand-in-hand with a
marginalization of no quantifiable data, leading to an insensitivity to uncertainty and a loss of
organizational memory; and (ii) problem definition and solution creation were constructed as if
they were independent of organizational goals, resulting in an inaccurate estimation of risk.
This over-confidence in quantitative data is specific to a broader context: accessibility of
information—the ease (or effort) with which particular mental contents come to mind. This is a
well documented phenomenon (Tversky & Kahneman, 1974; Kahneman, 2003). Kahneman is
arguing that the accessibility of a thought is determined jointly by the characteristics of the
cognitive mechanisms that produce it and by the characteristics of the stimuli and events that
evoke it. Among others, the determinants of accessibility subsume the notions of stimulus salience,
selective attention, specific training, associative activation, and priming. Because quantitative data
is more salient than qualitative data, it is highly likely to observe a bias towards the first type.
Muller (2001) also shows that more complex decision tasks lead to a higher deviation rate and that
in the presence of differences between the numbers of outcomes, subjects prefer the simpler
alternatives.
The bias towards salient data needs to be documented in the case of complex decision making in
HR policies. We believe that the process of building up positive work related attitudes, like job
satisfaction, is one that is limitedly transparent. We define “limitedly transparent” as containing
“variables that cannot be observed directly, either because we are only capable of observing the
symptoms, or because the system contains so many variables that we have to concentrate on the
few that we regard as the key ones in the system” (Hauge, 2004, p 29). Career opportunities,
distributive justice and job satisfaction are just some examples where only their effects on
productivity are easily observable. The way in which they influence, however, are most often not
What We Don’t Measure about Human Resources
Mihaela Tabacaru
20
measured or unclear, and thus unattended to. We will show, in what follows, the current policies
used in Romania, and why we believe they are inefficient.
Current policies description
Companies have a clear and growing bias to build human capital through organization-sponsored,
formal training (Davenport, 1999). The main solution to a wide range of problems is training:
expensive training, team buildings outside the company, in mountain or seaside resorts, training
that enchants the eye and makes the employees believe that the company cares for them.
Companies spend small fortunes on training, but fail to measure their impact. As a leading company
in training and consulting in Romania says, “there are extremely few clients that are interested in
the impact of their training session on anything: employee morale, turnover, retention” (Tabacaru,
unpublished field study; unreferenced, 2005). As long as it is done, they have a load off their back,
they have done something. If it doesn’t work, it must be the external conditions of the market that
are to blame. But if training is done isolated from the real problem, what good will this do?
Holton and Naquin (2004) show that human resources development (HRD) initiatives are often too
expensive or too difficult to measure and that has led to a credibility and accountability gap with
regard to development. The investment in training, only one of the activities aimed at improving
the employees’ job performance, represents a huge financial expenditure, as high as the hiring costs.
As Baldwin and Ford (1988) point out, only as little as 10% of all expenditure is projected to pay off
in performance improvements resulting from the transfer of knowledge to the job, mainly because
people do not transfer their knowledge in the real work situations. Training represents the HRD
activity with the smallest chance of the person actually learning the point, compared to other
activities, such as group learning through joint task assignment, doing your own research or even
asking a colleague for help (Deloitte, 2004).
The current policies to address the specialists’ turnover in Romania are two: the “buy” and the
“train” strategy or policy. The “buy” strategy means that companies are attracting highly qualified
employees by setting high salaries, even higher than those of the people currently employed on the
same position. The “train” strategy is meant to increase the quality of the employees and give them
an impression that the company cares for them, but it also acts as a motivation tool per se, as often
it is done without any relation to the training need (Tabacaru, unpublished field study;
unreferenced, 2005):”If employees ask for training, the managers give them training because
otherwise they will leave. It is fashionable to give training these days, but managers don’t care
What We Don’t Measure about Human Resources
Mihaela Tabacaru 21
what type of training they give”, says one external HR consultant (Tabacaru, unpublished field
study; unreferenced, 2005).
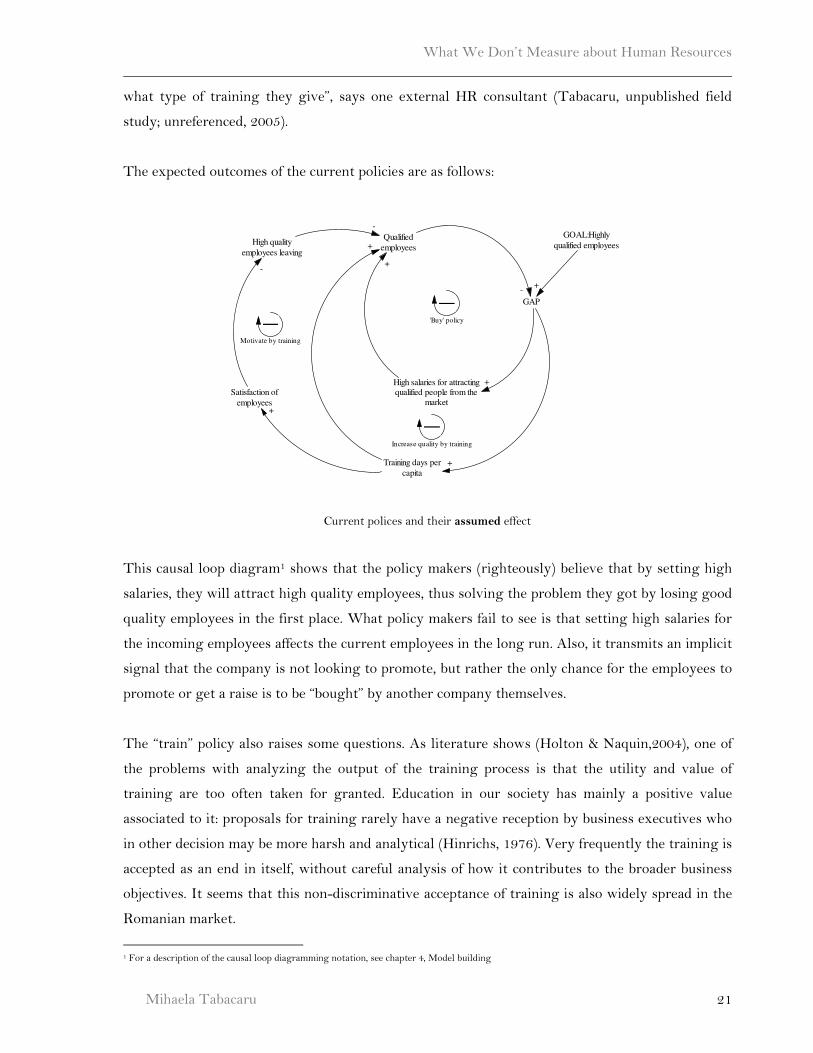
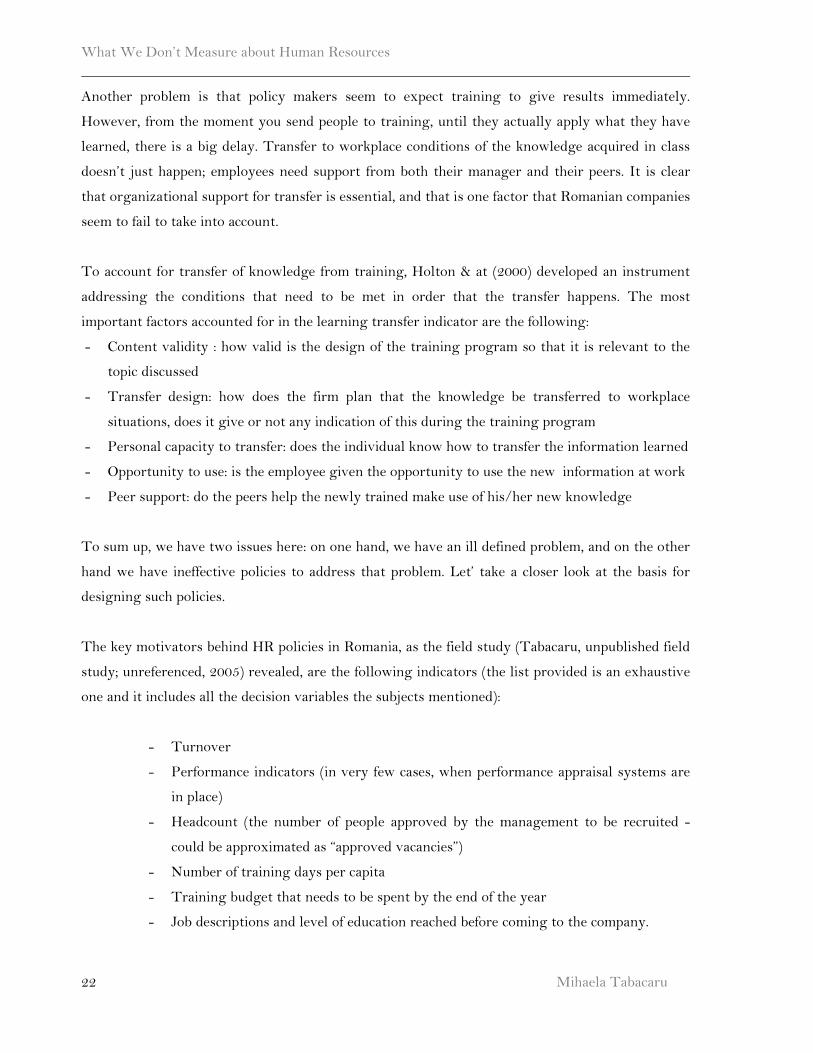
The expected outcomes of the current policies are as follows:
Current polices and their assumed effect
This causal loop diagram1 shows that the policy makers (righteously) believe that by setting high
salaries, they will attract high quality employees, thus solving the problem they got by losing good
quality employees in the first place. What policy makers fail to see is that setting high salaries for
the incoming employees affects the current employees in the long run. Also, it transmits an implicit
signal that the company is not looking to promote, but rather the only chance for the employees to
promote or get a raise is to be “bought” by another company themselves.
The “train” policy also raises some questions. As literature shows (Holton & Naquin,2004), one of
the problems with analyzing the output of the training process is that the utility and value of
training are too often taken for granted. Education in our society has mainly a positive value
associated to it: proposals for training rarely have a negative reception by business executives who
in other decision may be more harsh and analytical (Hinrichs, 1976). Very frequently the training is
accepted as an end in itself, without careful analysis of how it contributes to the broader business
objectives. It seems that this non-discriminative acceptance of training is also widely spread in the
Romanian market.
1 For a description of the causal loop diagramming notation, see chapter 4, Model building
Qualified
employees
GOAL:Highly
qualified employees
GAP
High salaries for attractingqualified people from the
market
Training days per
capita
-
+
+
+
High quality
employees leaving
-
Satisfaction of
employees
-
'Buy' policy
+
+
Motivate by training
+
Increase quality by training
What We Don’t Measure about Human Resources
Mihaela Tabacaru
22
Another problem is that policy makers seem to expect training to give results immediately.
However, from the moment you send people to training, until they actually apply what they have
learned, there is a big delay. Transfer to workplace conditions of the knowledge acquired in class
doesn’t just happen; employees need support from both their manager and their peers. It is clear
that organizational support for transfer is essential, and that is one factor that Romanian companies
seem to fail to take into account.
To account for transfer of knowledge from training, Holton & at (2000) developed an instrument
addressing the conditions that need to be met in order that the transfer happens. The most
important factors accounted for in the learning transfer indicator are the following:
- Content validity : how valid is the design of the training program so that it is relevant to the
topic discussed
- Transfer design: how does the firm plan that the knowledge be transferred to workplace
situations, does it give or not any indication of this during the training program
- Personal capacity to transfer: does the individual know how to transfer the information learned
- Opportunity to use: is the employee given the opportunity to use the new information at work
- Peer support: do the peers help the newly trained make use of his/her new knowledge
To sum up, we have two issues here: on one hand, we have an ill defined problem, and on the other
hand we have ineffective policies to address that problem. Let’ take a closer look at the basis for
designing such policies.
The key motivators behind HR policies in Romania, as the field study (Tabacaru, unpublished field
study; unreferenced, 2005) revealed, are the following indicators (the list provided is an exhaustive
one and it includes all the decision variables the subjects mentioned):
- Turnover
- Performance indicators (in very few cases, when performance appraisal systems are
in place)
- Headcount (the number of people approved by the management to be recruited -
could be approximated as “approved vacancies”)
- Number of training days per capita
- Training budget that needs to be spent by the end of the year
- Job descriptions and level of education reached before coming to the company.
What We Don’t Measure about Human Resources
Mihaela Tabacaru 23
A quick evaluation of these indicators shows that they are based on quantitative measures, which
say very little about why people are not motivated. In SD terms, the companies are treating the lack
of motivation as an exogenous influence that is not affected by conditions internal to the
companies. Perhaps, then, they are measuring the wrong indicators, and adopting the wrong
policies in response to those measured.
By building a model to explicitly address the understanding of work related attitudes and their
determinants, and designing policies taking into consideration the above described variables, we
believe we will obtain better results for three indicators: turnover, profits and quality of employees.
Normative policies
The literature shows that decision makers often oversimplify complex dynamic problems in the
direction of static systems, with the result that chosen policies are not only inaccurate but also
systematically biased. Misperception of dynamics and a faulty mental model can prevent the
managers from seeing the real problems (Sterman, 2004; Moxnes, 2000, 2004). If people do not
have the correct representation of stock and flow, it’s very likely that they will either ignore one
flow (Warren, 2002), or they underestimate the value of a stock (Hauge, 2004). As Warren (2002,
p.32) shows, “(…) having the right information is vital for understanding what is happening
through time. A regular report on staff members is useful, but a report separating gains and losses
(meaning separating inflows and outflows, n.a.) is much more valuable, in the sense of indicating where
action is needed”.
The lack of measurement of the HR contribution to the system makes the investment in this area
chaotic and short term oriented. We believe this might probably be leading to some sort of over- or
under-evaluation of key stocks. As Hauge (2004) suggests it, this can be modelled as a
misperception of accumulation of stocks, because if you can’t manage what you can’t measure, you
surely can’t measure what you can’t describe (Norton, 2001 cited in Linard & Dvorsky, 2003).
Hauge made an analysis and tested different (hypothetical) outcomes from policies that were
ignoring the feedback loops, the accumulations, the delays in the system and the non-linear
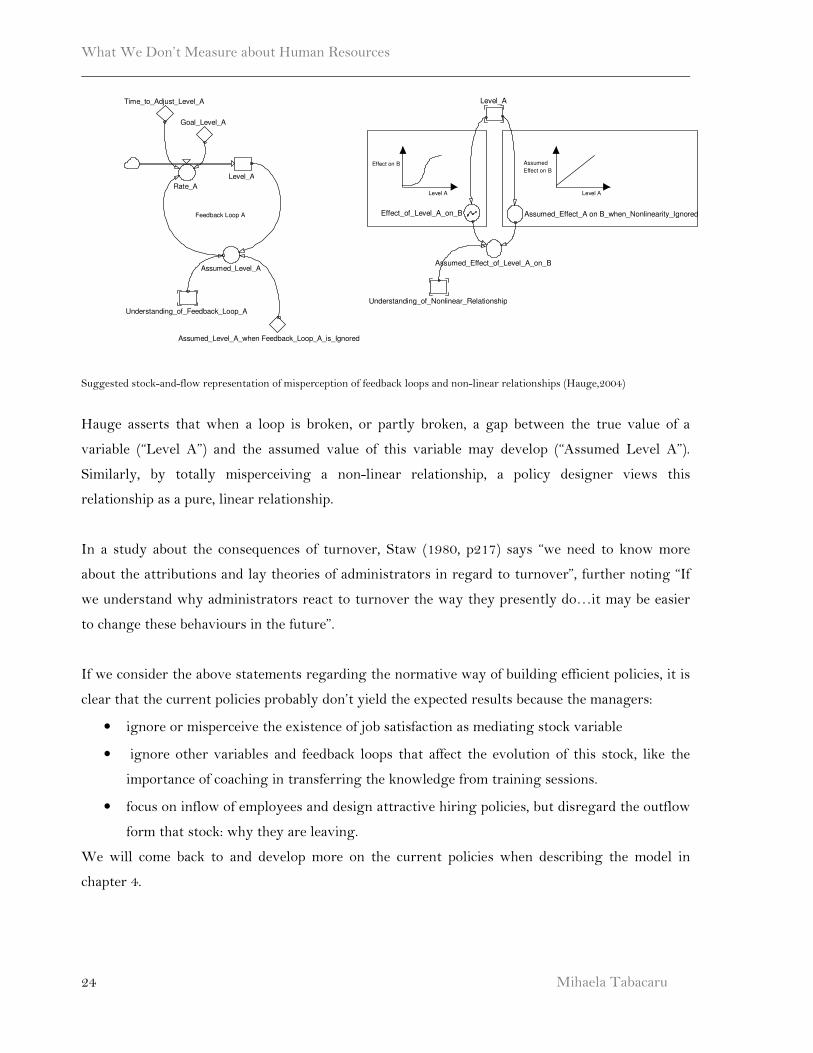
relationships. A representation of her assumptions is given in the next figures. 2
2 For an explanation of the stock and flow diagramming notation, see Chapter 4, Model Building
What We Don’t Measure about Human Resources
Mihaela Tabacaru
24
Suggested stock-and-flow representation of misperception of feedback loops and non-linear relationships (Hauge,2004)
Hauge asserts that when a loop is broken, or partly broken, a gap between the true value of a
variable (“Level A”) and the assumed value of this variable may develop (“Assumed Level A”).
Similarly, by totally misperceiving a non-linear relationship, a policy designer views this
relationship as a pure, linear relationship.
In a study about the consequences of turnover, Staw (1980, p217) says “we need to know more
about the attributions and lay theories of administrators in regard to turnover”, further noting “If
we understand why administrators react to turnover the way they presently do…it may be easier
to change these behaviours in the future”.
If we consider the above statements regarding the normative way of building efficient policies, it is
clear that the current policies probably don’t yield the expected results because the managers:
• ignore or misperceive the existence of job satisfaction as mediating stock variable
• ignore other variables and feedback loops that affect the evolution of this stock, like the
importance of coaching in transferring the knowledge from training sessions.
• focus on inflow of employees and design attractive hiring policies, but disregard the outflow
form that stock: why they are leaving.
We will come back to and develop more on the current policies when describing the model in
chapter 4.
Effect on B
Level A
Assumed Effect on B
Level A
Effect_of_Level_A_on_B Assumed_Effect_A on B_when_Nonlinearity_Ignored
Level_A
Assumed_Effect_of_Level_A_on_B
Understanding_of_Nonlinear_Relationship
Feedback Loop A
Level_A
Assumed_Level_A
Rate_A
Goal_Level_A
Time_to_Adjust_Level_A
Assumed_Level_A_when Feedback_Loop_A_is_Ignored
Understanding_of_Feedback_Loop_A
What We Don’t Measure about Human Resources
Mihaela Tabacaru 25
The real problem is the high cost of inefficient policies directed at reducing the turnover. As the
managers claim, it is easier to take a man that is already a specialist than to invest in a rookie and
grow him yourself over the years, pointing to the fact that they may not invest much in developing
employees in the company. If managers are misperceiving the real causes of turnover, and direct
their spending in the wrong direction, the policies are not yielding the expected results. We
challenge the current policies because we believe they are mostly a fire fighting solution. We assert
that taking into consideration employee attitudes would help improve the policy design by making
it more effective in terms of both results of and costs associated with the policy implementation.
Previous modelling of HR processes
Psychology literature
Turnover has been a highly researched issue in Industrial/Organisational (I/O) psychology and it
has not lacked controversy. Although it is generally agreed that high turnover is detrimental for
the organisation, Dalton, Todor and Krackhardt (1982) have highlighted the need to distinguish
between turnover frequencies (i.e. the number of separations) and turnover functionality (i.e. the
nature of separations). The authors found that 42% of the voluntary turnover among bank teller
was actually functional, as poorer performers were leaving the bank. Boudreau (1983) and
Boudreau and Berger (1985) have argued that utility models, which emphasize the retention,
should focus on the flow of employees who enter and leave the organisations.
The need to separate between the poor and good performers is essential, as the quitting of 10 good
performers is more damaging to the organizations than of the poor performers. In our situation
however, it seems that the problem is that the good performers leave, and that the companies are
worried both by turnover frequency and by losing key employees, even if they don’t measure
functional turnover properly. Dalton, Todor and Krackhardt (1982) believe that future research on
turnover needs to identify variables that are associated to turnover functionality. Factors believed
to affect motivation, such as contingent reward structures, goal setting and feedback and training
need to be examined with respect to functional turnover. To respond to these issues, our model
addresses the goal setting & communication and training in the broader context of turnover
determinants.
What We Don’t Measure about Human Resources
Mihaela Tabacaru
26
When it comes to explicit modelling of turnover, and we mean modelling as in mathematical causal
(theory like) models that base their mathematical expressions on postulated causal relations within
the modelled system (Barlas & Carpenter, 1990), there is relatively little research in I/O
psychology. The models we could find (e.g. Boudreau& Berger, 1985; Boudreau, 1983; Sturman,
Trevor, Boudreau & Gerhart, 2003) were mostly utility analysis models that dealt with the
profitability of a certain policy versus another, yet few attempted to make claims about the results
of the interaction of the variables in the real system by simulating such a system. Nevertheless,
these articles hold important contributions to the field on modelling HR issues and deserve our
attention for the future research directions they give.
A reference article is Boudreau & Berger’s (1985) algebraic model for utility analysis of acquisitions
and separations (hiring and quitting decisions) in a HR system, reflecting three basic types of
variables for each of the movements: (a) the quantity of the movers (e.g. the number of the
employees selected); (b) the quality of the movers (e.g. the expected increase in productivity
produced by the employees), and (c) the costs incurred to produce the movement (e.g. the cost of
developing and applying the predictor that leads to productivity increase)
As the authors identified, at the time the article was written there was an obvious void in current
utility models regarding their ability to account for the effect of employee separations (layoff,
retirement, and turnover) on the HR system. The important contribution of this model was the
focus on the outflow of employees. The models until that point had been mainly concentrating on
the inflow of employees and the hiring processes. Boudreau & Berger’s focus was the retention
utility or impact of retention on productivity, showing that there is substantial positive utility in
retaining the employees.
The directions of research given by Boudreau & Berger’s study indicate very useful paths in
defining our contribution to the problem of modelling turnover & retention. Firstly, Boudreau &
Berger’s model does not show specific policies to retain employees and these policies’ impact on the
profits of the firm. Secondly, it ignores the delay in making these policies work in the systems.
Thirdly, the time frame is limited to 10 years. Fourthly, the simulated analysis considers only
employee selection and hiring, and the authors suggest that other factors, such as training, could be
included. There are several measurement challenges, and finally, the model only addresses external
employee movement, saying nothing about what happens inside the company. We will add to these
the limitations the fact that the model is not transparent and can be very hard to grasp for people
with little mathematical background. In our model, we discuss specific policies to address turnover
What We Don’t Measure about Human Resources
Mihaela Tabacaru 27
and simulate their result, we incorporate delays, we expand the simulation over a period of 15
years, we include training in the process, and we show what is going on inside the company when
each of the policies are tested. Finally, by using system dynamics as a modelling methodology, we
show all of the above in a transparent and easy to understand modelling language.
In a recent article on utility analysis, Sturman, Trevor, Boudreau & Gerhart (2003) demonstrate
how, through integrating turnover and compensation research, the Boudreau and Berger (1985)
staffing utility framework can be used to address the retention issue of key employees. They
estimate the effects of incentive pay on employee separation patterns at various performance levels,
and then use the utility framework to evaluate the financial consequences of incentive pay as an
employee retention vehicle. However, they do not discuss the impact of job satisfaction or other
work related attitudes that influence the turnover. Rosenblatt & Sheaffer(2001) suggest that the
organizational and environmental predecessors in the “brain drain” phenomenon, or the loss of
specialists, are the labour market opportunities, internal career opportunities, unbalanced workload,
and undifferentiated retention strategies, thus pointing to more “soft” variables .Even though
Rosenblatt & Sheaffer (2001) base their case on literature describing the turnover of specialists,
they do not provide any implantable model to test its hypothesis.
Finally, Maertz and Campion (2004) distinguish between process models of turnover, which have a
focus on how people quit; and content models, which focus on why people leave. Their results
suggest that process-content integration is a fruitful direction for turnover research. We will model
explicitly how each variable influences the turnover, pointing both to the process and to the
content of this phenomenon.
System dynamics literature
There is very little SD modelling on the HR subsystem and its link with the endogenous structural
conditions of a business, although the labour is an important part of most SD models. As Sveiby,
Linard and Dvorsky (2002, p.1) show in their comprehensive review of HR related literature in the
SD field:
“Despite the fact that simple human resources (HR) capacity models have been stock-in trade for system dynamics
software manuals and training courses for over a decade (…) there are surprisingly few published papers that focus
specifically on the personnel or workforce dimensions of the system dynamics of organisational value creation”.
What We Don’t Measure about Human Resources
Mihaela Tabacaru
28
Most SD models show the processes in the HR subsystem just as the transition from one stock of
rookies to the stock of experienced, and more often the level of skills or quality that needs to be
attained. There are several exceptions that we will draw our research upon: Achi & Mott (1982),
Hirsch (1965), Sveiby, Linard and Dvorsky(2005).
In the model developed by Achi & Mott (1982), the authors investigate the performance dynamics
in a consulting firm, dynamics created by the interaction between the expectation and perceptions
of the professional staff, the planning and control policies of the firm and the market place. They
define job satisfaction as depending on overload assessment, work mix (repetitive, basic work
versus project, creative work) and fraction of manager allocated time for staff development.
Another important soft variable they consider is perceived career opportunities, depending on the
promotion rate and the career opportunities from growth in client attractiveness. We will also
consider the perceived career opportunities from the market.
The average staff quality in Achi & Mott’s view is exogenous. In the words of the authors:
”[…] the firm may attempt to improve the performance of its professionals by means of training programs designed to
increase professional competence, but its key leverage point is its ability to recruit the highest quality individuals in the
system”.
Thus, by increasing the manager allocated time to recruitment, the firm automatically increases the
new recruit quality, finally increasing the quality of its employees. We believe that the training
variable is endogenously determined in our case, since it is often a policy undertaken as a result of
the turnover crisis.
Finally, management time allocation is set in order of priorities as time for engagements, time for
recruiting, time for staff development, time for selling/ specific job tasks. The managers’ time is
also dependant on perceived partnership attractiveness on time. An interesting point is that Achi &
Mott see the time allocated to development of employees a result of the employees’ satisfaction, and
not its determinant. The explanation is that the satisfied employees take the proactive stance
necessary to gain the full benefit of the managers’ time. This may as well be the case of the specific
company that the authors are modelling; however, we think this formulation needs to be restated
for a more general analysis, as the one we are attempting and in line with the psychology literature
on job satisfaction (Agho, Price & Mueller, 1993)
What We Don’t Measure about Human Resources
Mihaela Tabacaru 29
In a paper describing a system dynamics model of professional performance, Hirsch (1965) defines
motivation as the central drive to work:
“Motivation to work refers to the professional’s desire to perform work in the interests of the […] company.”(p. 22)
He believes that people are motivated to stay in a company not directly due to the performance, but
because incentives influence their motivation to work. There are different other influences:
motivation from pressure, motivation from group cohesion, motivation from position increase,
motivation from salary increase. These are all predecessors of motivation and contribute to its
variation over time. Hirsch approximates motivation to job satisfaction, but does not present
convincing literature supporting his claim.
A major drawback of the two models discussed, Achi& Mott (1982) and Hirsch (1965), is that they
are built in Dynamo, one of the first SD software for simulation. We could not reproduce the
models and run them in order to test other policies than the ones suggested by the authors, even
though the formulations of soft variables are interesting and useful to our problem description.
More recent modelling efforts are concentrated on other aspects that deal with the HR subsystem,
like the intellectual capital (Bianchi & Bivona, 2005), the group learning processes going on in a
company (Lizeo 2005), the broader unemployment problem (Nanda, Rao and Vizayakumar, 2005),
the retirement plan ( Labedz and Stalker, 2005) or the training (Bajracharya et al 2000). These
models do not tackle the endogenous aspects of retention or turnover and most of them do not
quantify intangible variables like work related attitudes, though they mention their importance.
Furthermore, Sveiby, Linard and Dvorsky (2002) argue that in the papers presented until that
moment in the most representative instance of the SD society, the annual System Dynamics
conference, the definition of the “soft” variables in HR was vague and unclear. In response to these
critiques, we intend to clearly define our “soft” or intangible variables basing our case on
psychology literature about work related attitudes, and attempt to represent the structure behind
the behaviour of turnover.
The interest towards SD modelling of human resources problems is increasingly relevant these
days since more and more firms are now employing human resources information systems (HRIS)
to help decision making and policy enforcement. A HRIS is defined as “a system used to acquire,
store, manipulate, analyze, retrieve, and distribute pertinent information about an organization’s
human resources” (Tannenbaum, 1990). As useful as a HRIS can be, the results it yields are mainly
descriptive, in the form of reports. Examples of data that a HRIS report contains are number of
What We Don’t Measure about Human Resources
Mihaela Tabacaru
30
employees, days or hours worked, holidays taken, number of people hired or quitting, days of
training per capita, etc. As Haines and Petit (1997) show, “The ideal assessment of HRIS success
would probably include data from a return on investment or utility analysis.” We believe that a
system dynamics model could provide simulations to show the effectiveness of certain policies and
help decision making.
Summary
In this chapter we reviewed literature showing the importance of the human resources system in
the strategic view of a firm, and we argued the contribution of attitudes into the broader
perspective of our problem definition. The misperceptions of intangible variables in dealing with
HR issues were discussed and the current and normative policies employed in order to fight
turnover reviewed. We tried to build on previous attempts, both in I/O psychology and system
dynamics literature, which modelled HR policy making decisions.
Some of the directions for research we identified were:
a) policy makers seem to ignore the importance of work related attitudes in solving the
turnover problem, thus a solution for a better understanding of the problem is
required;
b) there is a need for formal, transparent and user-friendly models and analysis for the
turnover problem in order to show managers the impact of their policies and help
them design better ones;
c) in the SD community, there is a need to show the interaction of “soft” variables in
the HR system.
In the next chapter we present our model and explicitly show how we believe its components
influence each other.
What We Don’t Measure about Human Resources
Mihaela Tabacaru 31
4. MODEL BUILDING
In the previous chapters we have presented the motivation for this study, the method we employed
in our research and we have reviewed literature helping us to build our case. This chapter presents
an important part of our contribution: the model and the psychology literature the model’s
variables are based on, thus assessing the validity of the model through direct comparison with
knowledge and information about the real system (Forrester and Senge, 1980). First, we present
the reference mode and the assumptions it is based on. We continue with a model overview meant
to help the reader grasp the basic dynamics involved in the retention problem. The main variables
of the model are then presented and the assumptions behind each relation made explicit.
Reference mode
We chose to model a single company, and not the aggregated economy, since it will have more
impact on the individual client we will (hopefully) be using this model for. We will refer to the
company throughout the modelling chapter in singular, as “the company”. This company reflects
the banking and telecom businesses, which experience the highest problem in retaining valuable
employees (Ziarul Financiar, March 24th 2006). As the system dynamics practice imposes, we had
to find a relevant stock and observe its behaviour over time; this procedure gives us the reference
mode and the dynamic hypothesis that encompasses it.
Since there is no available historical data for our problem, we have developed a number of
hypothetical reference modes, the validity of which we will now seek to establish (Randers, 1976).
We decided to concentrate on:
• the stock of profits of a company
• the stock of quality of employees
• the turnover indicator (because this is an important decision variable in the current practice
of the decision makers and also a useful indicator of the efficiency of retention policies,
ceteribus paribus)
We believe that the real problem is policy makers’ misperception or ignorance of the work related
attitudes (stocks) and feedback loops affecting both their decision variables and the expected
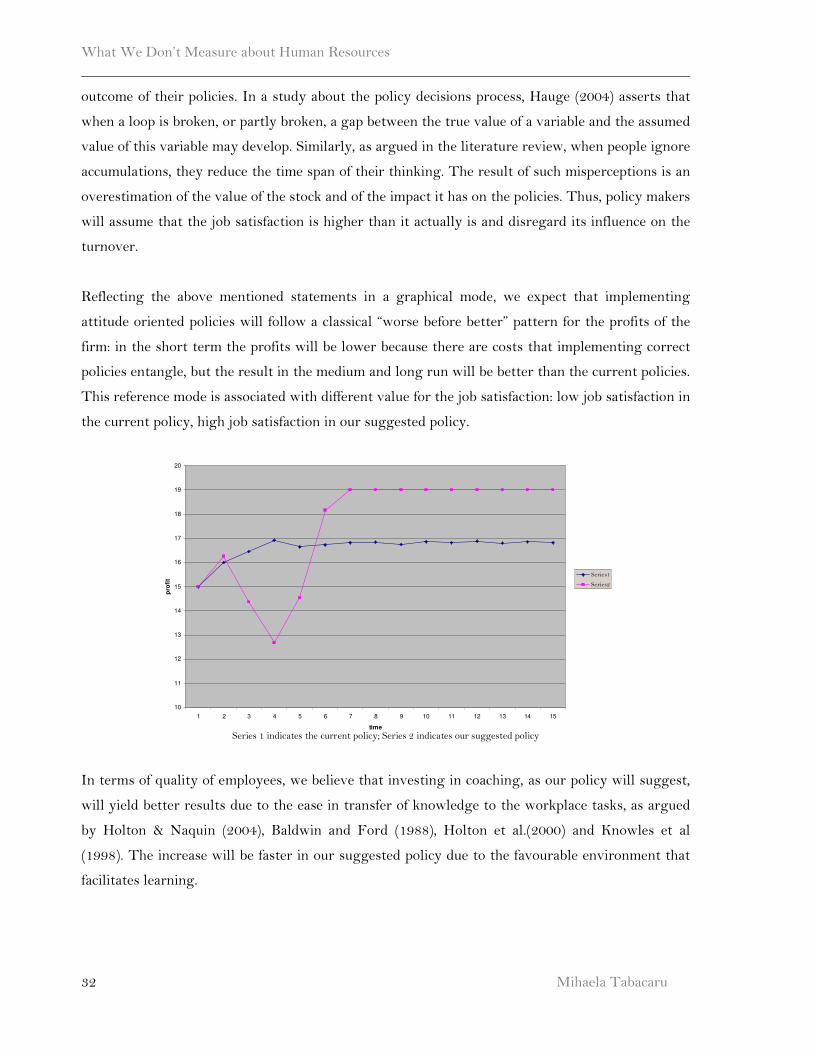
What We Don’t Measure about Human Resources
Mihaela Tabacaru
32
outcome of their policies. In a study about the policy decisions process, Hauge (2004) asserts that
when a loop is broken, or partly broken, a gap between the true value of a variable and the assumed
value of this variable may develop. Similarly, as argued in the literature review, when people ignore
accumulations, they reduce the time span of their thinking. The result of such misperceptions is an
overestimation of the value of the stock and of the impact it has on the policies. Thus, policy makers
will assume that the job satisfaction is higher than it actually is and disregard its influence on the
turnover.
Reflecting the above mentioned statements in a graphical mode, we expect that implementing
attitude oriented policies will follow a classical “worse before better” pattern for the profits of the
firm: in the short term the profits will be lower because there are costs that implementing correct
policies entangle, but the result in the medium and long run will be better than the current policies.
This reference mode is associated with different value for the job satisfaction: low job satisfaction in
the current policy, high job satisfaction in our suggested policy.
Series 1 indicates the current policy; Series 2 indicates our suggested policy
In terms of quality of employees, we believe that investing in coaching, as our policy will suggest,
will yield better results due to the ease in transfer of knowledge to the workplace tasks, as argued
by Holton & Naquin (2004), Baldwin and Ford (1988), Holton et al.(2000) and Knowles et al
(1998). The increase will be faster in our suggested policy due to the favourable environment that
facilitates learning.
10
11
12
13
14
15
16
17
18
19
20
1 2 3 4 5 6 7 8 9 10 11 12 13 14 15
time
pro
fit
Series1
Series2
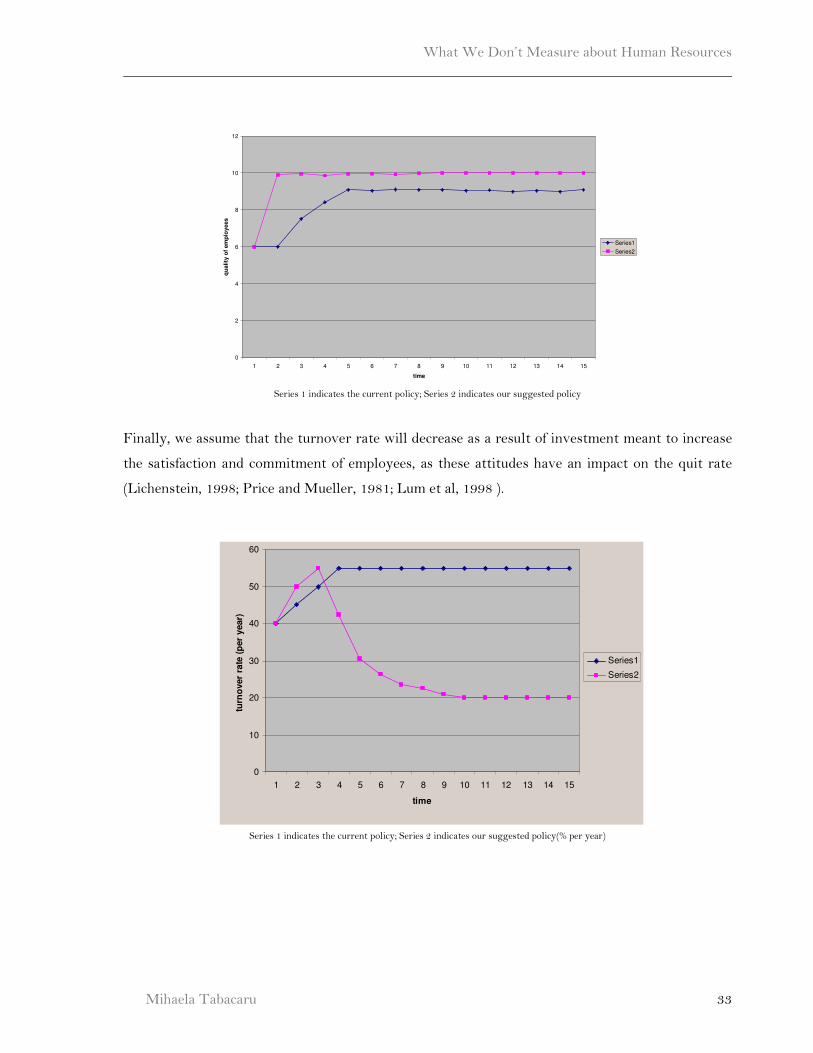
What We Don’t Measure about Human Resources
Mihaela Tabacaru 33
Series 1 indicates the current policy; Series 2 indicates our suggested policy
Finally, we assume that the turnover rate will decrease as a result of investment meant to increase
the satisfaction and commitment of employees, as these attitudes have an impact on the quit rate
(Lichenstein, 1998; Price and Mueller, 1981; Lum et al, 1998 ).
Series 1 indicates the current policy; Series 2 indicates our suggested policy(% per year)
0
2
4
6
8
10
12
1 2 3 4 5 6 7 8 9 10 11 12 13 14 15
time
qu
ality
of
em
plo
yees
Series1
Series2
0
10
20
30
40
50
60
1 2 3 4 5 6 7 8 9 10 11 12 13 14 15
time
turn
over
rate
(p
er
year)
Series1
Series2
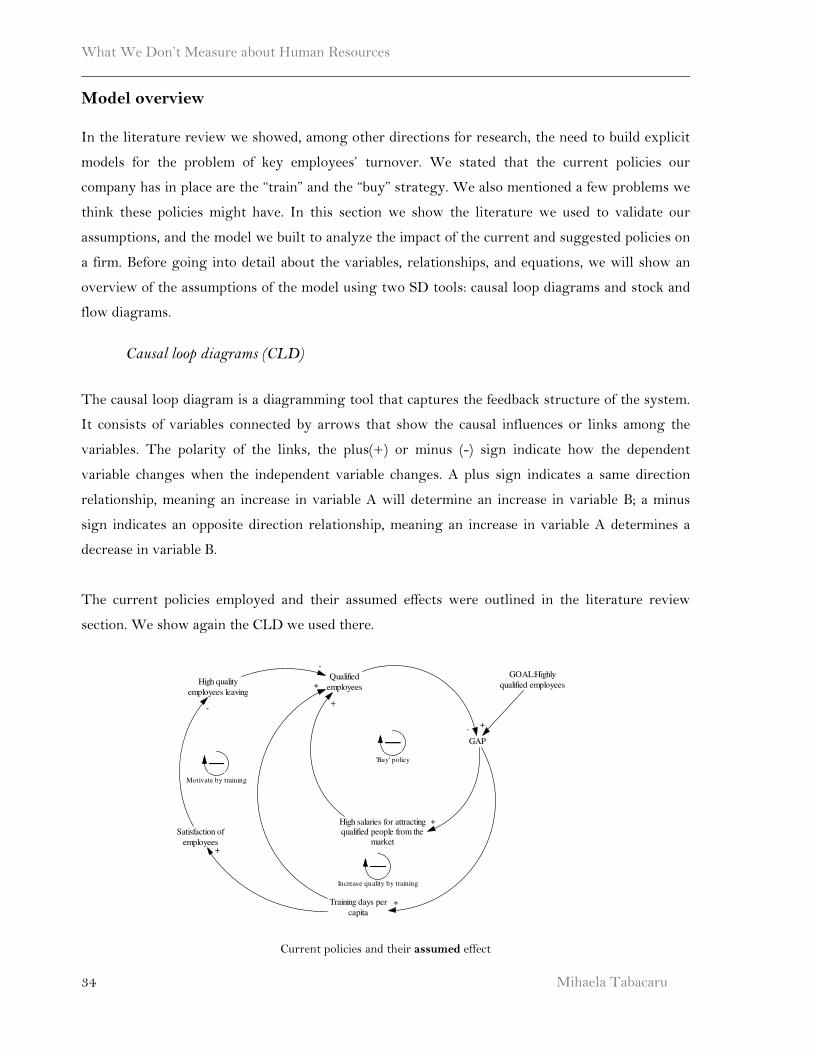
What We Don’t Measure about Human Resources
Mihaela Tabacaru
34
Model overview
In the literature review we showed, among other directions for research, the need to build explicit
models for the problem of key employees’ turnover. We stated that the current policies our
company has in place are the “train” and the “buy” strategy. We also mentioned a few problems we
think these policies might have. In this section we show the literature we used to validate our
assumptions, and the model we built to analyze the impact of the current and suggested policies on
a firm. Before going into detail about the variables, relationships, and equations, we will show an
overview of the assumptions of the model using two SD tools: causal loop diagrams and stock and
flow diagrams.
Causal loop diagrams (CLD)
The causal loop diagram is a diagramming tool that captures the feedback structure of the system.
It consists of variables connected by arrows that show the causal influences or links among the
variables. The polarity of the links, the plus(+) or minus (-) sign indicate how the dependent
variable changes when the independent variable changes. A plus sign indicates a same direction
relationship, meaning an increase in variable A will determine an increase in variable B; a minus
sign indicates an opposite direction relationship, meaning an increase in variable A determines a
decrease in variable B.
The current policies employed and their assumed effects were outlined in the literature review
section. We show again the CLD we used there.
Current policies and their assumed effect
Qualified
employees
GOAL:Highly
qualified employees
GAP
High salaries for attractingqualified people from the
market
Training days per
capita
-
+
+
+
High quality
employees leaving
-
Satisfaction of
employees
-
'Buy' policy
+
+
Motivate by training
+
Increase quality by training
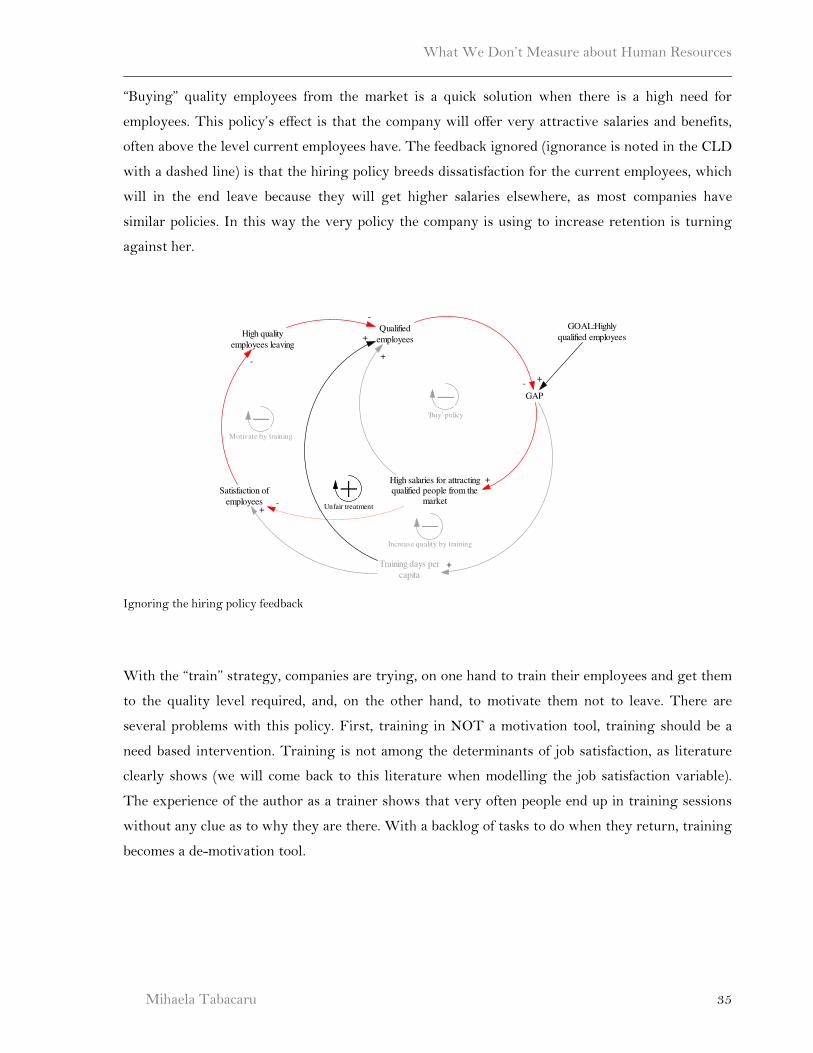
What We Don’t Measure about Human Resources
Mihaela Tabacaru 35
“Buying” quality employees from the market is a quick solution when there is a high need for
employees. This policy’s effect is that the company will offer very attractive salaries and benefits,
often above the level current employees have. The feedback ignored (ignorance is noted in the CLD
with a dashed line) is that the hiring policy breeds dissatisfaction for the current employees, which
will in the end leave because they will get higher salaries elsewhere, as most companies have
similar policies. In this way the very policy the company is using to increase retention is turning
against her.
Ignoring the hiring policy feedback
With the “train” strategy, companies are trying, on one hand to train their employees and get them
to the quality level required, and, on the other hand, to motivate them not to leave. There are
several problems with this policy. First, training in NOT a motivation tool, training should be a
need based intervention. Training is not among the determinants of job satisfaction, as literature
clearly shows (we will come back to this literature when modelling the job satisfaction variable).
The experience of the author as a trainer shows that very often people end up in training sessions
without any clue as to why they are there. With a backlog of tasks to do when they return, training
becomes a de-motivation tool.
Qualified
employees
GOAL:Highly
qualified employees
GAP
High salaries for attractingqualified people from the
market
Training days per
capita
-
+
+
+
High quality
employees leaving
-
Satisfaction of
employees
-
'Buy' policy
Unfair treatment
+
+
Motivate by training
+
Increase quality by training
-
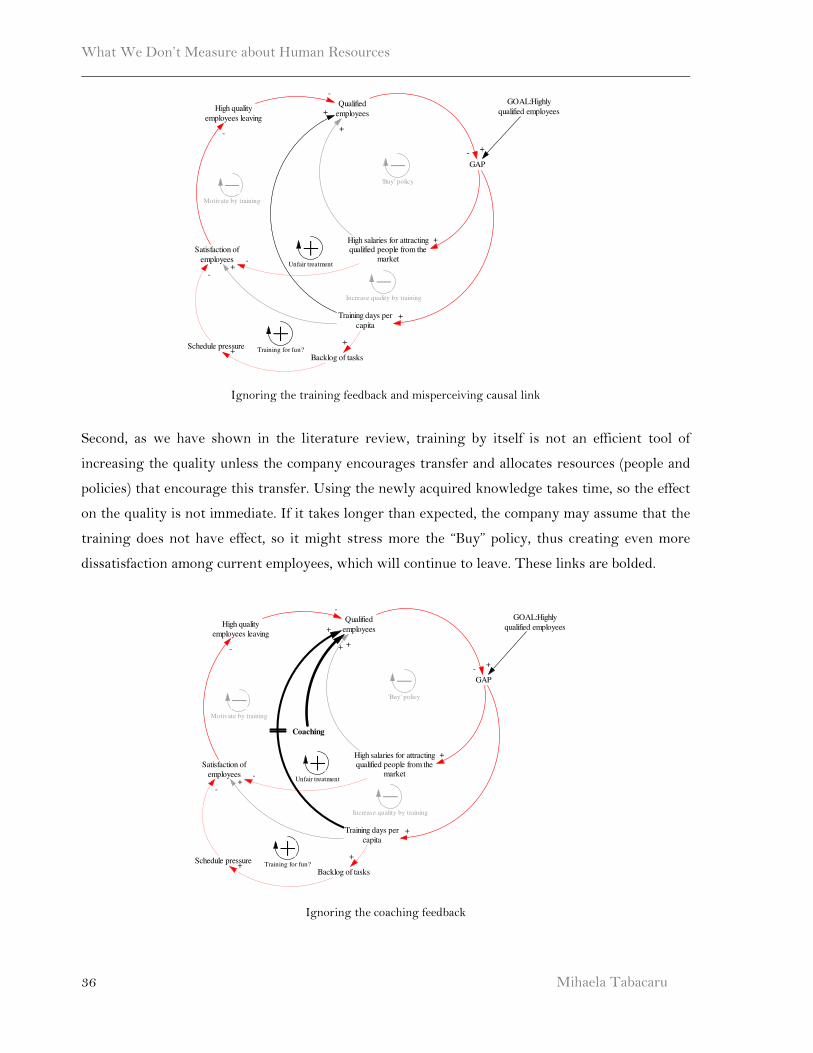
What We Don’t Measure about Human Resources
Mihaela Tabacaru
36
Ignoring the training feedback and misperceiving causal link
Second, as we have shown in the literature review, training by itself is not an efficient tool of
increasing the quality unless the company encourages transfer and allocates resources (people and
policies) that encourage this transfer. Using the newly acquired knowledge takes time, so the effect
on the quality is not immediate. If it takes longer than expected, the company may assume that the
training does not have effect, so it might stress more the “Buy” policy, thus creating even more
dissatisfaction among current employees, which will continue to leave. These links are bolded.
Ignoring the coaching feedback
Qualified
employees
GOAL:Highly
qualified employees
GAP
High salaries for attractingqualified people from the
market
Training days per
capita
-
+
+
+
High quality
employees leaving
-
Satisfaction of
employees
-
'Buy' policy
Unfair treatment
+
+
Motivate by training
+
Increase quality by training
Backlog of tasks
Schedule pressure+
+
-
Training for fun?
-
Qualified
employees
GOAL:Highly
qualified employees
GAP
High salaries for attractingqualified people from the
market
Training days per
capita
-
+
+
+
High quality
employees leaving
-
Satisfaction of
employees
-
'Buy' policy
Unfair treatment
+
+
Motivate by training
+
Increase quality by training
Backlog of tasks
Schedule pressure+
+
-
Training for fun?
Coaching
+
-
What We Don’t Measure about Human Resources
Mihaela Tabacaru 37
We modelled the coaching effect as external because it represents the effort the employees make to
help their colleagues or subordinates transfer the knowledge acquired in training. This is not an
automatic process and it involves training of its own kind. We are not referring here to on-the-job
training, but to something that requires something else: an open attitude towards feedback giving
and receiving, about overt communication concerning performance, etc.
To make it clearer, let’s take the example of an employee who goes to, say, a communication skills
training. He spends 3 days learning about effective ways to communicate, to give and receive
constructive feedback, to avoid being defensive when receiving critiques, etc. This should definitely
improve the quality of his work, no matter what that work is, since communicating better avoids
misunderstandings, re-work, and saves time. Now imagine this employee comes back to the office
and tries to apply some of the things he has learned, but his colleagues mock him, his boss doesn’t
care and he has no chance whatsoever to apply his new knowledge. He will surely forget it quickly.
An effort concentrated on HR development reflects an open attitude towards learning. This is not
very costly, it just implies proper training, and, most important of all, it implies an organizational
climate that encourages transfer of learning. It is the author’s experience that such learning and
development policies encourage people to seek development themselves, and feel very rewarded
when they are sent to training, because they have desired this. It is not so easy to model this
complex network of decisions that finally lead to the employee feeling that the company cares for
him, but it surely takes much more than just sending people to training.
Besides ignoring the above outlined feedbacks, it seems, from the CLDs, that the policy makers
have a misrepresentation of the determinants of job satisfaction. We will review literature about job
satisfaction later in this chapter, in order to build confidence in the validity of our claims.
Stock and flow diagrams
As shown in the methodology chapter, the stock and flow structures account for the state of the
system over time and for any changes that might occur in this state. The notation we will use when
discussing about stocks originates from Forrester (1961) and is based on the hydraulic metaphor –
the flow of water into and out of reservoirs.
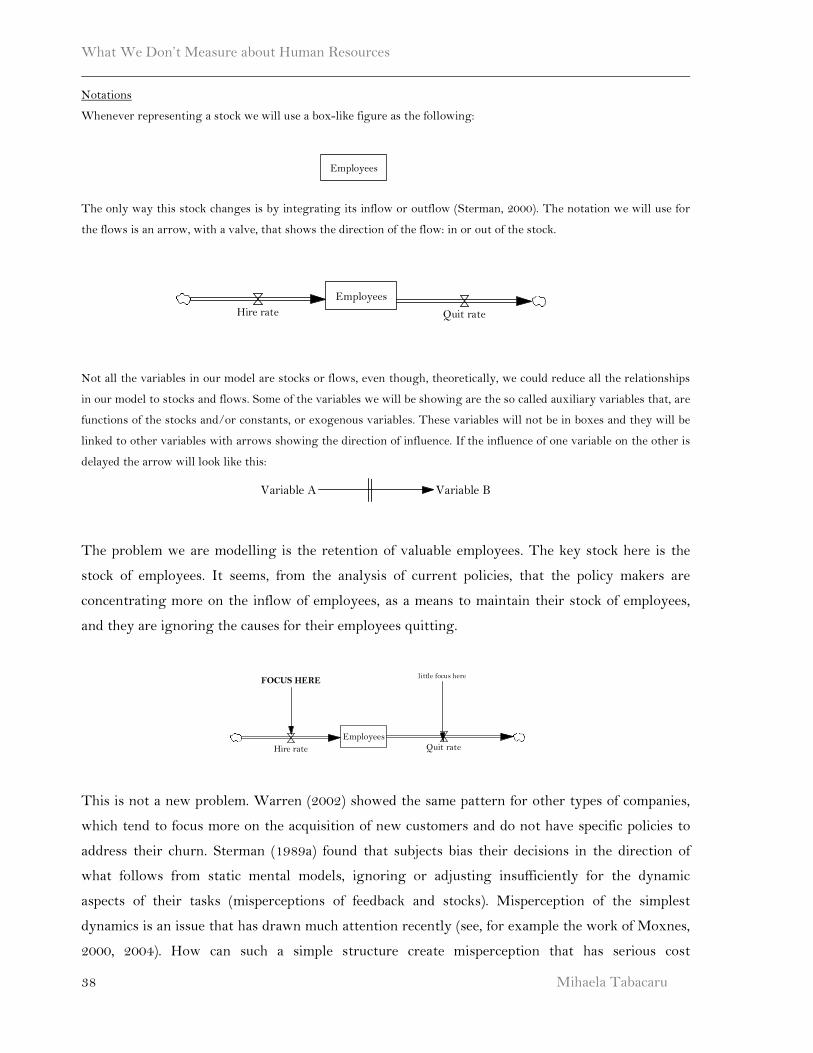
What We Don’t Measure about Human Resources
Mihaela Tabacaru
38
Notations
Whenever representing a stock we will use a box-like figure as the following:
The only way this stock changes is by integrating its inflow or outflow (Sterman, 2000). The notation we will use for
the flows is an arrow, with a valve, that shows the direction of the flow: in or out of the stock.
Not all the variables in our model are stocks or flows, even though, theoretically, we could reduce all the relationships
in our model to stocks and flows. Some of the variables we will be showing are the so called auxiliary variables that, are
functions of the stocks and/or constants, or exogenous variables. These variables will not be in boxes and they will be
linked to other variables with arrows showing the direction of influence. If the influence of one variable on the other is
delayed the arrow will look like this:
The problem we are modelling is the retention of valuable employees. The key stock here is the
stock of employees. It seems, from the analysis of current policies, that the policy makers are
concentrating more on the inflow of employees, as a means to maintain their stock of employees,
and they are ignoring the causes for their employees quitting.
This is not a new problem. Warren (2002) showed the same pattern for other types of companies,
which tend to focus more on the acquisition of new customers and do not have specific policies to
address their churn. Sterman (1989a) found that subjects bias their decisions in the direction of
what follows from static mental models, ignoring or adjusting insufficiently for the dynamic
aspects of their tasks (misperceptions of feedback and stocks). Misperception of the simplest
dynamics is an issue that has drawn much attention recently (see, for example the work of Moxnes,
2000, 2004). How can such a simple structure create misperception that has serious cost
Employees
Employees
Hire rate Quit rate
Variable A Variable B
EmployeesQuit rateHire rate
FOCUS HERElittle focus here
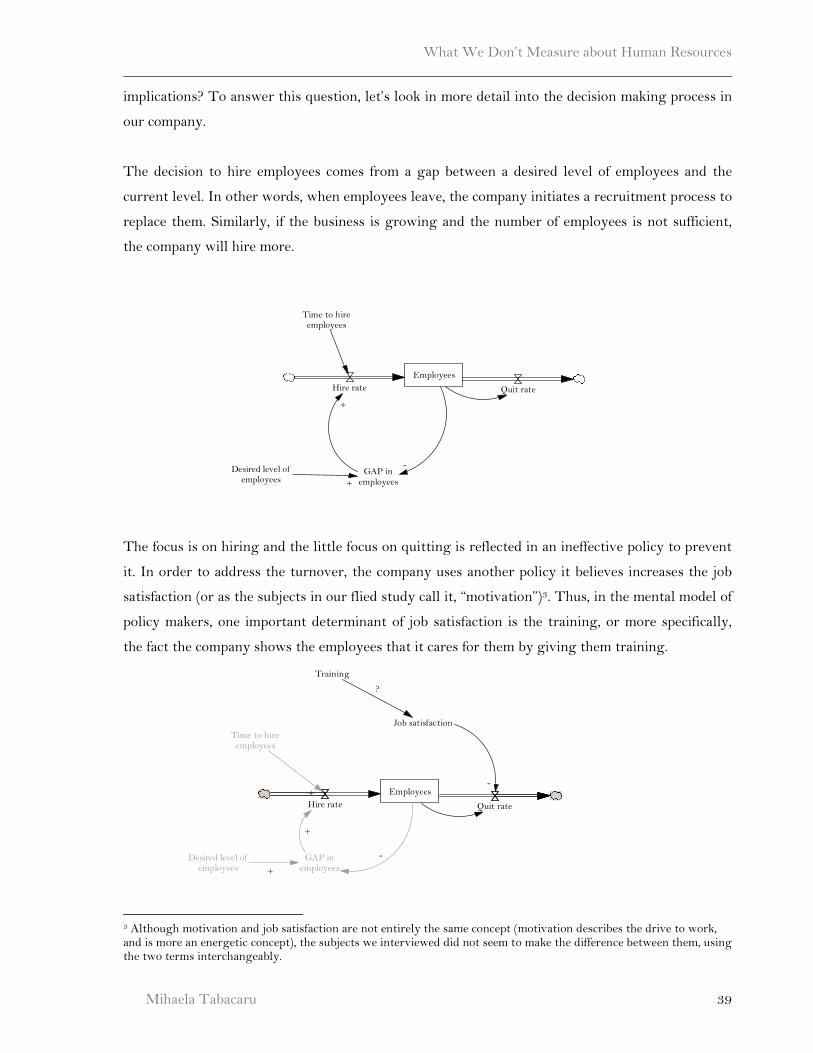
What We Don’t Measure about Human Resources
Mihaela Tabacaru 39
implications? To answer this question, let’s look in more detail into the decision making process in
our company.
The decision to hire employees comes from a gap between a desired level of employees and the
current level. In other words, when employees leave, the company initiates a recruitment process to
replace them. Similarly, if the business is growing and the number of employees is not sufficient,
the company will hire more.
The focus is on hiring and the little focus on quitting is reflected in an ineffective policy to prevent
it. In order to address the turnover, the company uses another policy it believes increases the job
satisfaction (or as the subjects in our flied study call it, “motivation”)3. Thus, in the mental model of
policy makers, one important determinant of job satisfaction is the training, or more specifically,
the fact the company shows the employees that it cares for them by giving them training.
3 Although motivation and job satisfaction are not entirely the same concept (motivation describes the drive to work, and is more an energetic concept), the subjects we interviewed did not seem to make the difference between them, using the two terms interchangeably.
Employees
Hire rate Quit rate
Desired level ofemployees
GAP inemployees+
-
Time to hireemployees
+
Employees
Hire rate Quit rate
Time to hireemployees
+
Job satisfaction
-
GAP inemployees
+
Desired level ofemployees +
-
Training
?
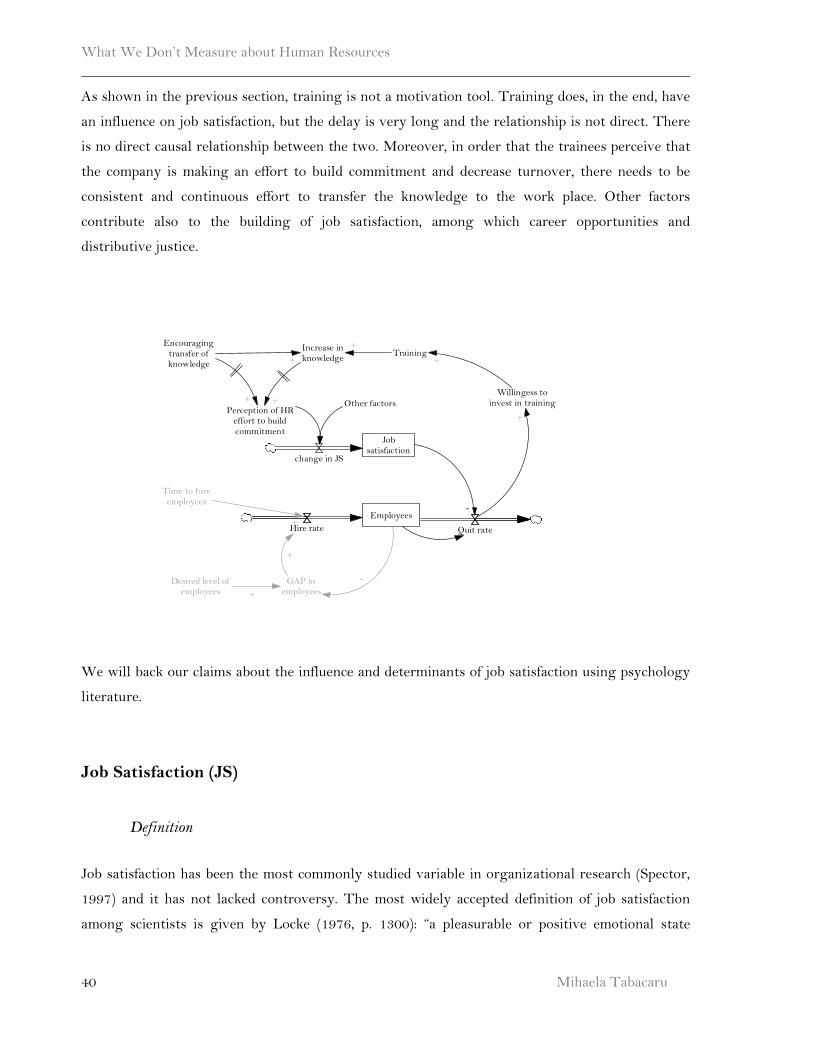
What We Don’t Measure about Human Resources
Mihaela Tabacaru
40
As shown in the previous section, training is not a motivation tool. Training does, in the end, have
an influence on job satisfaction, but the delay is very long and the relationship is not direct. There
is no direct causal relationship between the two. Moreover, in order that the trainees perceive that
the company is making an effort to build commitment and decrease turnover, there needs to be
consistent and continuous effort to transfer the knowledge to the work place. Other factors
contribute also to the building of job satisfaction, among which career opportunities and
distributive justice.
We will back our claims about the influence and determinants of job satisfaction using psychology
literature.
Job Satisfaction (JS)
Definition
Job satisfaction has been the most commonly studied variable in organizational research (Spector,
1997) and it has not lacked controversy. The most widely accepted definition of job satisfaction
among scientists is given by Locke (1976, p. 1300): “a pleasurable or positive emotional state
Employees
Hire rate Quit rate
Time to hireemployees
+
Jobsatisfaction
-
GAP inemployees
+
Desired level ofemployees +
-
Training
Willingess toinvest in training
Encouragingtransfer ofknowledge
Increase inknowledge+
Perception of HReffort to buildcommitment
+
+
+
+
+ Other factors
change in JS
What We Don’t Measure about Human Resources
Mihaela Tabacaru 41
resulting from the appraisal of one's job or job experiences”. By the time Locke wrote this
definition, 30 years ago (!), he had identified more than 3300 studies on this subject.
Determinants of JS
According to the Price Mueller revised model of job satisfaction (Agho, Price, Mueller, 1993), the
major predecessors of, leading to a change in, job satisfaction are the following (with the definitions
given by the authors, p 1012):
• Opportunity: availability of alternative jobs in the organization’s environment
• Autonomy: degree to which employees have freedom to act independently on the job
• Distributive justice: degree to which rewards and punishments are related to
performance inputs
• Internal labour market: extent to which the organization job structure is
characterized by job ladders, entry limited to the bottom and upward mobility which is
accompanied by a progressive development of skill and knowledge
• Integration: extent to which employees have close friends in their immediate work
unit
• Pay: money and its equivalent received by employees for their services
• Routinization: degree to which a job is repetitive
• Work motivation: belief in the centrality of the work role in one’s life
• Personality factors
The two factors which we will model explicitly are the distributive justice and the career
opportunity, as encompassing both the concept of opportunity and the internal market as expressed
by Agho, Price and Mueller (1993). We will describe them in detail later in this chapter.
The extent to which satisfaction might be determined by relatively stable personality variables,
such as negative affectivity and positive affectivity (in the above model referred to as “personality
factors”) is one of the things largely accounted for in the literature (Staw & Ross, 1985; Staw et al,
1986; Watson & Clark, 1984; Brief et al., 1988; Agho, Mueller & Price, 1993). Although we
recognize that this research is important and that it is an important predictor for job satisfaction,
we have to relate to our client: our problem description addresses the actions of managers in order
to retain their employees. As Sterman (2000) shows, we should model the things that the decision
makers cannot change through policies, so we will no go into detail about personality.
What We Don’t Measure about Human Resources
Mihaela Tabacaru
42
Measuring JS
Although measuring job satisfaction may seem like a big challenge, there are several ways to do it.
One of the most popular instruments is the Minnesota Satisfaction Questionnaire (MSQ),
measuring more than 20 facets of job satisfaction. Other measures are the Job Satisfaction Survey
(JSS), Job Satisfaction Inventory (JSI), etc. The most typical measure of job satisfaction found in an
organization is the so called “employee opinion survey”(EOS), that measures the overall satisfaction
with several aspects of the firm. Although this is far from a standardized instrument, it is a first
step in measuring attitudes. An example of the type of questions asked in such a EOS is given in
the following (Connoly & Connoly, 2005)
1. My job makes good use of my skills and abilities. 2. I receive the training I need to do my job. 3. I am given opportunities to improve my skills in this organization. 4. My job is challenging and interesting. 5. I am doing something I consider satisfying and worthwhile in my job. 6. My job offers me the opportunity to gain work experience in challenging new areas. 7. I like my job at this organization. 8. I understand the link between what I do and the organization's objectives. 9. The work I do is very important to the success of my organization. 10. I am doing something I consider really worthwhile. 11. I really feel I accomplish something each day. 12. I have personal control over the way my work must be done. 13. I feel the amount of work required of me is about right.
Each of the items is a statement that is either favourable or unfavourable about an aspect of the job.
Respondents are asked to choose a number, typically from 1 (totally disagree) to 6 (totally agree),
that corresponds to their agreement or disagreement about each item. We use a similar scale to
measure job satisfaction in our model.
As we do not have a standardized unit of measure for job satisfaction, we modelled it as a capability
and put a unit of measure called “job satisfaction unit”. The range of variation is from 1, indicating
a low job satisfaction to 10, which shows a high job satisfaction. Especially important here is the
delay with which this attitude is forming, set to 12 months. We consider the job satisfaction to be
similar to an information delay, because it is similar to the “perception of” a variable, formed in
time. According to Azjen (2001), although people can form many different beliefs about an object, it
is assumed that only beliefs that are readily accessible in memory influence attitude at any given
moment. “Readily accessible” suggests that the weight on recent events is higher than on past
events. It implies that if the company has adopted a set of HRD policies it cannot expect their effect
to last forever, but must constantly make sure that they are reinforced and acted upon accordingly,
hence the long delay chosen.
What We Don’t Measure about Human Resources
Mihaela Tabacaru 43
Relationship job satisfaction - turnover
The job satisfaction is widely cited in the literature as a determinant of turnover (Lichenstein,
1998) and thus has a crucial influence in retention. We expect that policies addressing job
satisfaction will also influence the turnover. One of the models of organizational turnover (Price &
Mueller, 1986) has job satisfaction embedded as the first mediating variable in a system of causal
linkages that produce turnover. Job satisfaction has been identified as the single most important
reason why nurses leave their jobs (Lum et al, 1998). Some authors (Price & Mueller, 1981) say
that the effect of job satisfaction on turnover is not direct, but mediated through the intention to
leave. Hulin et al (1985), consistent with Fishbein and Azjen’s work (1975) work on formation of
attitudes, says that the availability of alternative job opportunities affects satisfaction, which in
turn, influences behavioural intentions to quit and, through these intentions, quitting.
The process of social comparison (Festinger, 1954) constitutes a major determinant of job
satisfaction, because the process of satisfaction results from the distance between two perceptions
concerning aspects of the job which an individual values (Igalens & Roussel, 1998). In other words,
the employee makes a mental calculus between what he/she thinks that the job satisfaction should
be, and what it is at a particular point in time. We chose to model this influence on turnover as the
difference between the maximum value of job satisfaction and the current value: the bigger the
difference, the higher the intention to leave, so the higher the probability of turnover. There are of
course other reasons why employees quit, that are not related to job dissatisfaction, like family
relocation, acceptance into higher education, etc., factors that the employer cannot control, so we
chose not to include them in our boundary.
Relation of job satisfaction to productivity and performance
In a qualitative and quantitative meta-analysis of the literature on the relationship between job
satisfaction and job performance (Judge, Thoresen, Bono & Patton, 2001), the authors investigated
7 models and looked over 312 samples with a combined N of 54,417. Their research indicates that
the overall mean true correlation between the job satisfaction and performance was 0.30. This
study shows that there are other determinants important to job performance that account for 0.7 of
the job performance that are mostly related to the organizational culture and individual
determinants. The authors describe a series of mediators and moderators that affect the relation
between the two concepts, among them norms, autonomy, personality, intentions performance
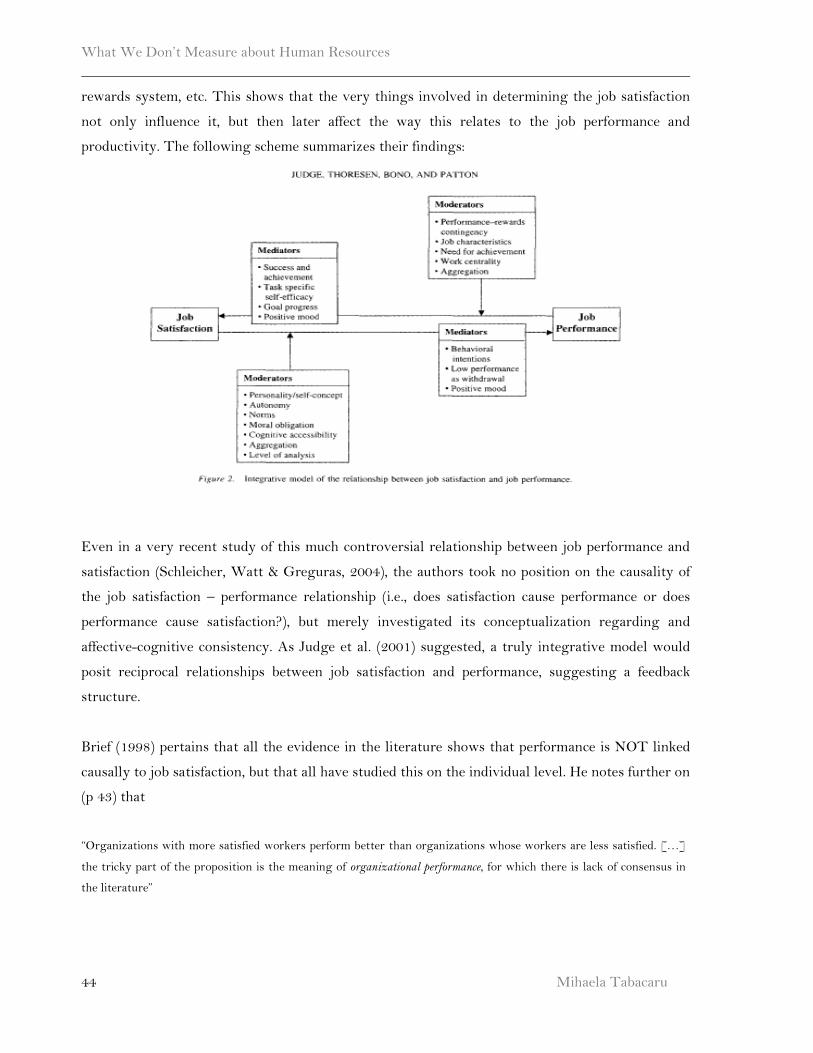
What We Don’t Measure about Human Resources
Mihaela Tabacaru
44
rewards system, etc. This shows that the very things involved in determining the job satisfaction
not only influence it, but then later affect the way this relates to the job performance and
productivity. The following scheme summarizes their findings:
Even in a very recent study of this much controversial relationship between job performance and
satisfaction (Schleicher, Watt & Greguras, 2004), the authors took no position on the causality of
the job satisfaction – performance relationship (i.e., does satisfaction cause performance or does
performance cause satisfaction?), but merely investigated its conceptualization regarding and
affective-cognitive consistency. As Judge et al. (2001) suggested, a truly integrative model would
posit reciprocal relationships between job satisfaction and performance, suggesting a feedback
structure.
Brief (1998) pertains that all the evidence in the literature shows that performance is NOT linked
causally to job satisfaction, but that all have studied this on the individual level. He notes further on
(p 43) that
“Organizations with more satisfied workers perform better than organizations whose workers are less satisfied. […]
the tricky part of the proposition is the meaning of organizational performance, for which there is lack of consensus in
the literature”
What We Don’t Measure about Human Resources
Mihaela Tabacaru 45
There is a difference between the evaluation of overall job performance and a task-level assessment
of job satisfaction, that yields different, though related, results (Taber & Alliger, 1995): global and
facet measures were found to be consistent with, but only partly predictable from, individual task
properties. Thus a study of the organizational level of job satisfaction would be very useful in
clearing up this issue and we intend to model just that.
As shown by Brief (1998), there is a negative relation between job satisfaction and the turnover
intention, that leads to the turnover behaviour. The relation is weaker, however, than the relation
between job satisfaction and other so called “withdrawal behaviours” (frequent interruptions,
absenteeism, lateness to work, wasting time while on duty, etc.). Hulin (1991) argues that this
relation is stronger because the individuals cannot always afford to leave, so they develop what he
calls “adaptive” behaviours, that influence drastically the productivity. These behaviours are bad
for the organization, but seldom result in layoff - which would be bad for the employee This is
especially relevant in the Romanian society, still under the influence of communist times, where the
norm was that the employee was paid anyway, no matter how much effort he put into his work. We
can interpret this as an influence on the productivity of the employee: if he cannot afford to leave,
he will be less productive if his satisfaction is low.
What is very clear about job satisfaction (Brief, 1998) is that it is a result of interpretations of job
circumstances (e.g. perceived adequacy, fairness of pay, internal job market, etc.) As Rice et al (1989)
show, the “have-want” discrepancies have the power to predict and explain job satisfaction very
well. We modelled and integrated the concepts regarding job satisfaction in a SD model that shows
endogenous causal links as part of a larger system, in other words, on an organizational scale, thus
following both Brief’s (1998) and Judge et al. (2001) suggestions of future research.
Model building
We will present in what follows the components and assumptions of our model. We will not
present all the equations in the model, but we will explain the reasons and the literature that made
us include specific variables in the model. A list with all the equations of the model is attached in
Appendix 1.
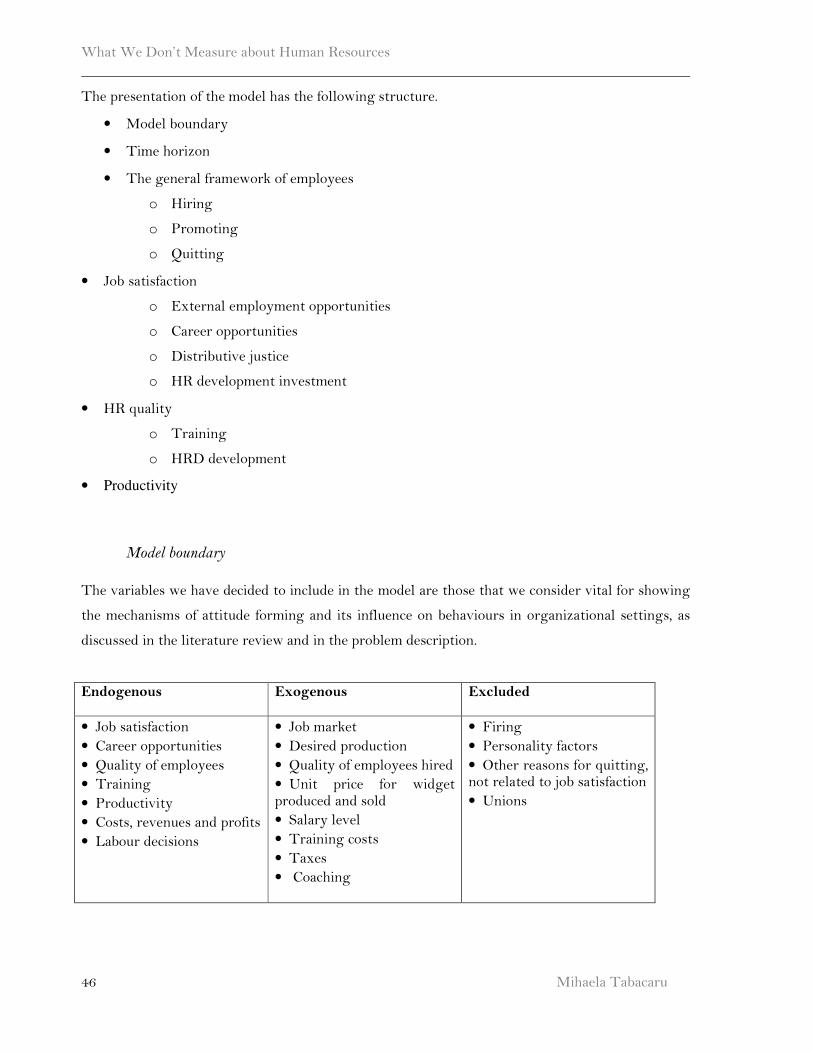
What We Don’t Measure about Human Resources
Mihaela Tabacaru
46
The presentation of the model has the following structure.
• Model boundary
• Time horizon
• The general framework of employees
o Hiring
o Promoting
o Quitting
• Job satisfaction
o External employment opportunities
o Career opportunities
o Distributive justice
o HR development investment
• HR quality
o Training
o HRD development
• Productivity
Model boundary
The variables we have decided to include in the model are those that we consider vital for showing
the mechanisms of attitude forming and its influence on behaviours in organizational settings, as
discussed in the literature review and in the problem description.
Endogenous Exogenous Excluded
• Job satisfaction
• Career opportunities
• Quality of employees
• Training
• Productivity
• Costs, revenues and profits
• Labour decisions
• Job market
• Desired production
• Quality of employees hired
• Unit price for widget produced and sold
• Salary level
• Training costs
• Taxes
• Coaching
• Firing
• Personality factors
• Other reasons for quitting, not related to job satisfaction
• Unions
What We Don’t Measure about Human Resources
Mihaela Tabacaru 47
We assume not to be able to influence directly the job market, since it is determined largely by
macro economical factors that we are not modelling. To make the model simpler, we chose the
desired production to be exogenous, so we are not showing any demand and supply in the market.
Also, we assume that everything our company produces, it sells, but in accordance with a certain
demand. This may seem as an over simplification, but our model’s purpose is to show the
mechanisms of work related attitudes in relation to the indicators companies are using as a basis for
their HR policies, and show that even in the case of perfect stability they produce dynamics in the
system.
Firing is very difficult on the Romanian market, even for the poor performers. The labour law,
similar to the Norwegian one, states that a poor performer needs to have several chances to receive
training and get coached, mechanisms which we explicitly showed in our model. Thus, the firing
decision is reduced to a negative value of the adjustment for labour, meaning that the organization
will not fire its employees, but hire less if there is a drop in production. We do not show the
performance evaluation process entirely, we just show the goal setting in the distributive justice
component.
Time horizon
As most consultants agree (Tabacaru, unpublished field study; unreferenced, 2005; www.HR-
Romania.ro ), the current HR practices in Romania started in 2000, partly due to the transfer of
knowledge from the expatriates in Romanian companies. Thus the time frame we chose is 15 years,
from 2000 to 2015.
The general employee framework
We assume three stocks of employees: rookies, mid-levels and seniors. We chose to split the labour
force in 3 in order to show the promotion system from one stock to another. We could have chosen
just a 2 stock model, but we believed important to distinguish between the mid-level employees,
that form the core of a telecom or banking company that we are modelling, and the seniors, who
are either top level managers or very qualified specialists. This split is also justified by the
representation of the double ladder promotion system (Hallenberg, 1970), because one might argue
that not everybody should be promoted in a company. Dual ladder-systems provide that employees
can follow two different types of paths after spending some time in the organization: one path is a
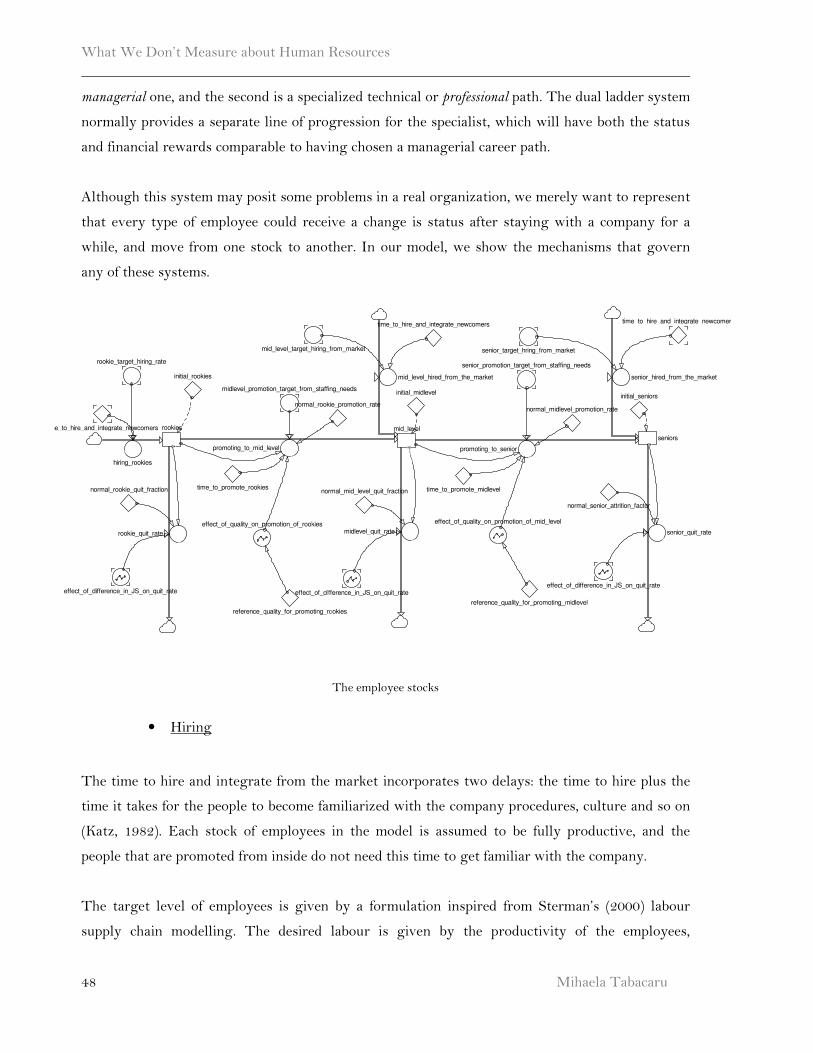
What We Don’t Measure about Human Resources
Mihaela Tabacaru
48
managerial one, and the second is a specialized technical or professional path. The dual ladder system
normally provides a separate line of progression for the specialist, which will have both the status
and financial rewards comparable to having chosen a managerial career path.
Although this system may posit some problems in a real organization, we merely want to represent
that every type of employee could receive a change is status after staying with a company for a
while, and move from one stock to another. In our model, we show the mechanisms that govern
any of these systems.
The employee stocks
• Hiring
The time to hire and integrate from the market incorporates two delays: the time to hire plus the
time it takes for the people to become familiarized with the company procedures, culture and so on
(Katz, 1982). Each stock of employees in the model is assumed to be fully productive, and the
people that are promoted from inside do not need this time to get familiar with the company.
The target level of employees is given by a formulation inspired from Sterman’s (2000) labour
supply chain modelling. The desired labour is given by the productivity of the employees,
promoting_to_senior
reference_quality_for_promoting_midlevel
effect_of_quality_on_promotion_of_rookies effect_of_quality_on_promotion_of_mid_level
midlevel_promotion_target_from_staffing_needs
promoting_to_mid_level
effect_of_difference_in_JS_on_quit_rateeffect_of_difference_in_JS_on_quit_rate
reference_quality_for_promoting_rookies
initial_rookies
initial_midlevel
mid_level
initial_seniors
seniors
normal_rookie_quit_fraction normal_mid_level_quit_fraction
normal_senior_attrition_factor
rookies
senior_target_hring_from_market
time_to_promote_rookies time_to_promote_midlevel
time_to_hire_and_integrate_newcomerstime_to_hire_and_integrate_newcomers
hiring_rookies
mid_level_hired_from_the_market senior_hired_from_the_market
mid_level_target_hiring_from_market
effect_of_difference_in_JS_on_quit_rate
rookie_quit_rate midlevel_quit_rate senior_quit_rate
normal_rookie_promotion_ratenormal_midlevel_promotion_rate
time_to_hire_and_integrate_newcomers
rookie_target_hiring_ratesenior_promotion_target_from_staffing_needs
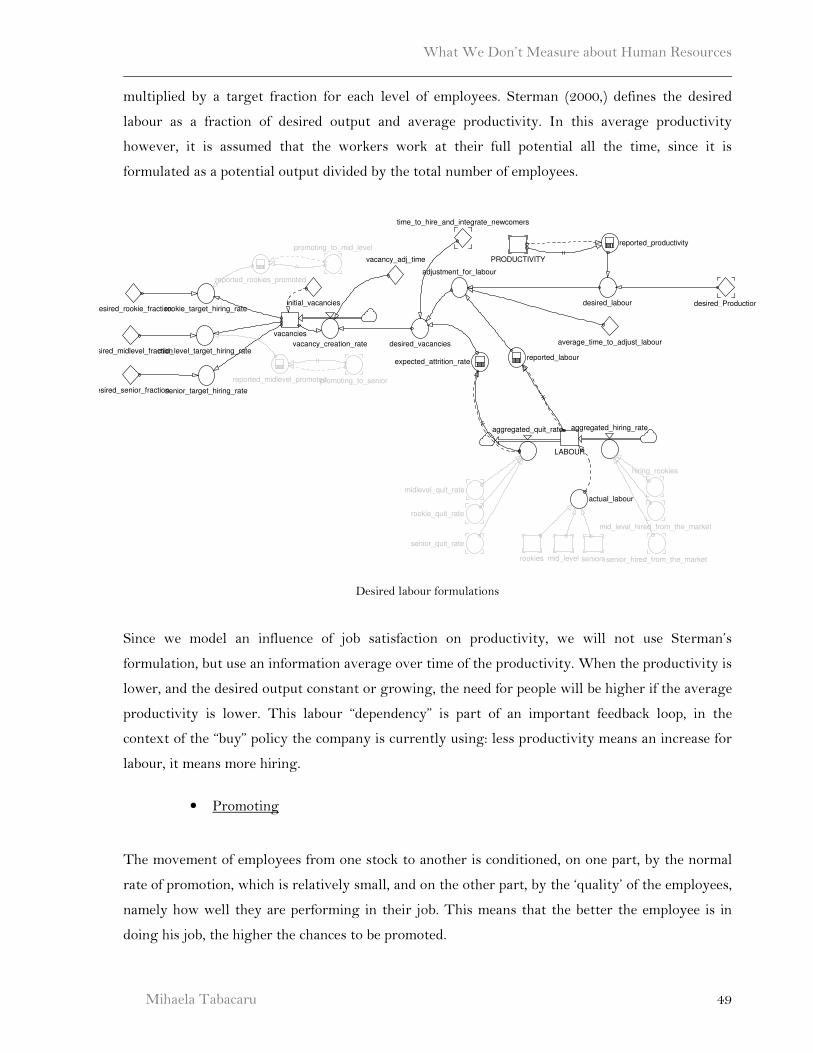
What We Don’t Measure about Human Resources
Mihaela Tabacaru 49
multiplied by a target fraction for each level of employees. Sterman (2000,) defines the desired
labour as a fraction of desired output and average productivity. In this average productivity
however, it is assumed that the workers work at their full potential all the time, since it is
formulated as a potential output divided by the total number of employees.
Labour decisions
Desired labour formulations
Since we model an influence of job satisfaction on productivity, we will not use Sterman’s
formulation, but use an information average over time of the productivity. When the productivity is
lower, and the desired output constant or growing, the need for people will be higher if the average
productivity is lower. This labour “dependency” is part of an important feedback loop, in the
context of the “buy” policy the company is currently using: less productivity means an increase for
labour, it means more hiring.
• Promoting
The movement of employees from one stock to another is conditioned, on one part, by the normal
rate of promotion, which is relatively small, and on the other part, by the ‘quality’ of the employees,
namely how well they are performing in their job. This means that the better the employee is in
doing his job, the higher the chances to be promoted.
rookie_quit_rate
rookies mid_level
senior_quit_rate
seniors
actual_labour
aggregated_hiring_rate
reported_productivity
PRODUCTIVITY
mid_level_target_hiring_rate
senior_target_hiring_rate
aggregated_quit_rate
midlevel_quit_rate
vacancies
rookie_target_hiring_rate
vacancy_adj_time
desired_midlevel_fraction
desired_rookie_fraction
average_time_to_adjust_labour
reported_labourexpected_attrition_rate
vacancy_creation_rate
initial_vacancies
senior_hired_from_the_market
mid_level_hired_from_the_market
time_to_hire_and_integrate_newcomers
desired_labour
adjustment_for_labour
desired_vacancies
reported_midlevel_promoted
reported_rookies_promoted
promoting_to_mid_level
promoting_to_senior
desired_Production
desired_senior_fraction
LABOUR
hiring_rookies
What We Don’t Measure about Human Resources
Mihaela Tabacaru
50
promoting to mid level = ((rookies*normal_rookie_promotion_rate+midlevel_promotion_target_from_staffing_needs)*effect of
quality on promotion of rookies)/time to promote rookies
People are also promoted because there are employees who are leaving. This promotion is a
measure that relates to the company’s policy: does it promote or does it hire from outside when an
employee leaves? The decision to hire from outside or promote from within is given by a certain
fraction of the people for each level, that takes values from 0 to 1, where 0 means that there is no
hiring and that the only way to fill in the need for mid-level and senior employees is to hire, and 1
means that there is no promotion. This reflects the “make or buy” policy choice, underlined by
Morrison & Adams (1991) and also noticed in our field study (Tabacaru, unpublished field study;
unreferenced, 2005). We estimated that recruiting from outside leads to faster results than
promoting from inside (short-term orientation vs. long term), and also yields more tangible results,
because developing a person is something you measure very hard if you don’t have a skills
inventory or clear career path put in place. The fraction for promotion is given by “1- the fraction”
for the hiring from the market.
midlevel promotion target from staffing needs = (1-fraction_of_target_hiring_from_the_market)*mid level target hiring rate
• Quitting
We assume there is a normal rate of quitting; however, this rate increases with job dissatisfaction.
This is our main point of intervention and it is represented by the effect of job satisfaction (better
said, the difference from the expected job satisfaction and the actual job satisfaction) on quitting.
rookie_quit_rate = rookies*normal_rookie_quit_fraction*effect_of_difference_in_JS_on_quit_rate
Job satisfaction
We chose to model job satisfaction as a stock having the determinants as outlined in the Price
Mueller (1993) model. However, there are a few notable changes.
The factors influencing job satisfaction that we have chosen to model are the distributive justice,
the career opportunity, the quality of the employee, and the job opportunities on the market. We
define quality as the capital brought in by the employees in the form of knowledge, skills and
abilities (well known as K.S.A. in the personnel psychology). The job opportunities on the market
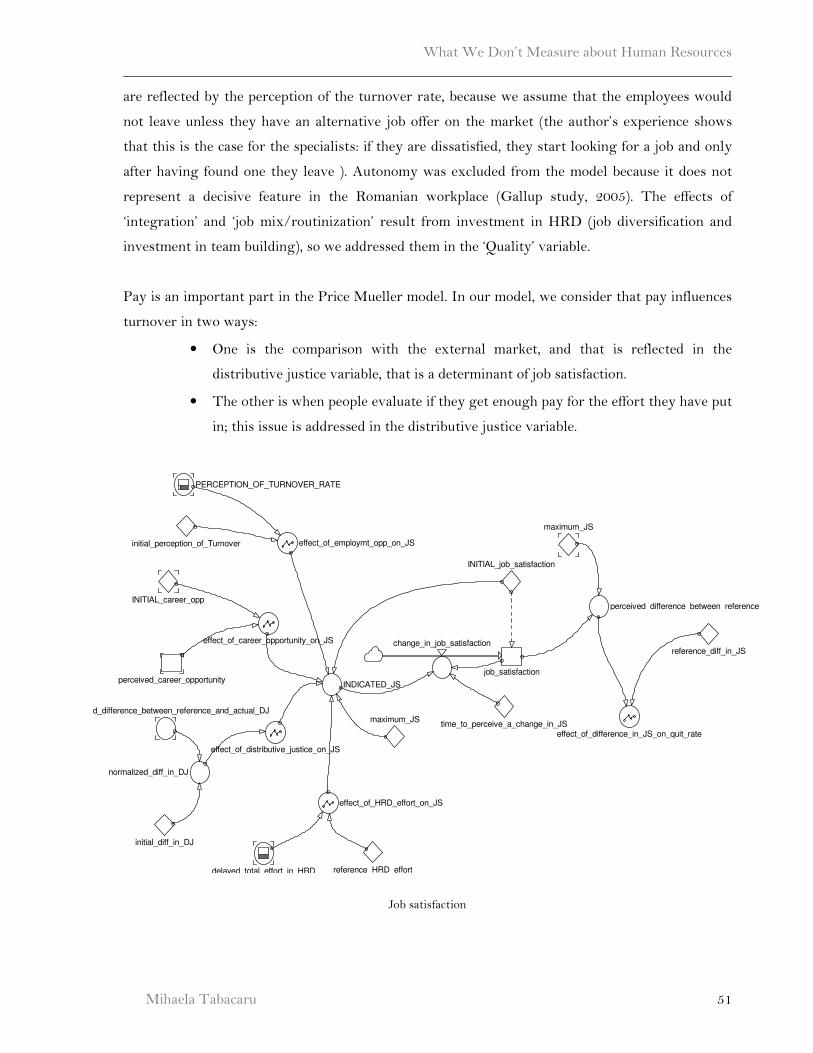
What We Don’t Measure about Human Resources
Mihaela Tabacaru 51
are reflected by the perception of the turnover rate, because we assume that the employees would
not leave unless they have an alternative job offer on the market (the author’s experience shows
that this is the case for the specialists: if they are dissatisfied, they start looking for a job and only
after having found one they leave ). Autonomy was excluded from the model because it does not
represent a decisive feature in the Romanian workplace (Gallup study, 2005). The effects of
‘integration’ and ‘job mix/routinization’ result from investment in HRD (job diversification and
investment in team building), so we addressed them in the ‘Quality’ variable.
Pay is an important part in the Price Mueller model. In our model, we consider that pay influences
turnover in two ways:
• One is the comparison with the external market, and that is reflected in the
distributive justice variable, that is a determinant of job satisfaction.
• The other is when people evaluate if they get enough pay for the effort they have put
in; this issue is addressed in the distributive justice variable.
Job satisfaction
delayed_total_effort_in_HRD
maximum_JS
effect_of_distributive_justice_on_JS
effect_of_HRD_effort_on_JS
perceived_difference_between_reference_and_actual_JS
time_to_perceive_a_change_in_JS
perceived_career_opportunity
normalized_diff_in_DJ
initial_diff_in_DJ
reference_HRD_effort
INDICATED_JS
change_in_job_satisfaction
effect_of_employmt_opp_on_JS
effect_of_career_opportunity_on_JS
INITIAL_career_opp
perceived_difference_between_reference_and_actual_DJ
maximum_JS
INITIAL_job_satisfaction
job_satisfaction
reference_diff_in_JS
effect_of_difference_in_JS_on_quit_rate
initial_perception_of_Turnover
PERCEPTION_OF_TURNOVER_RATE
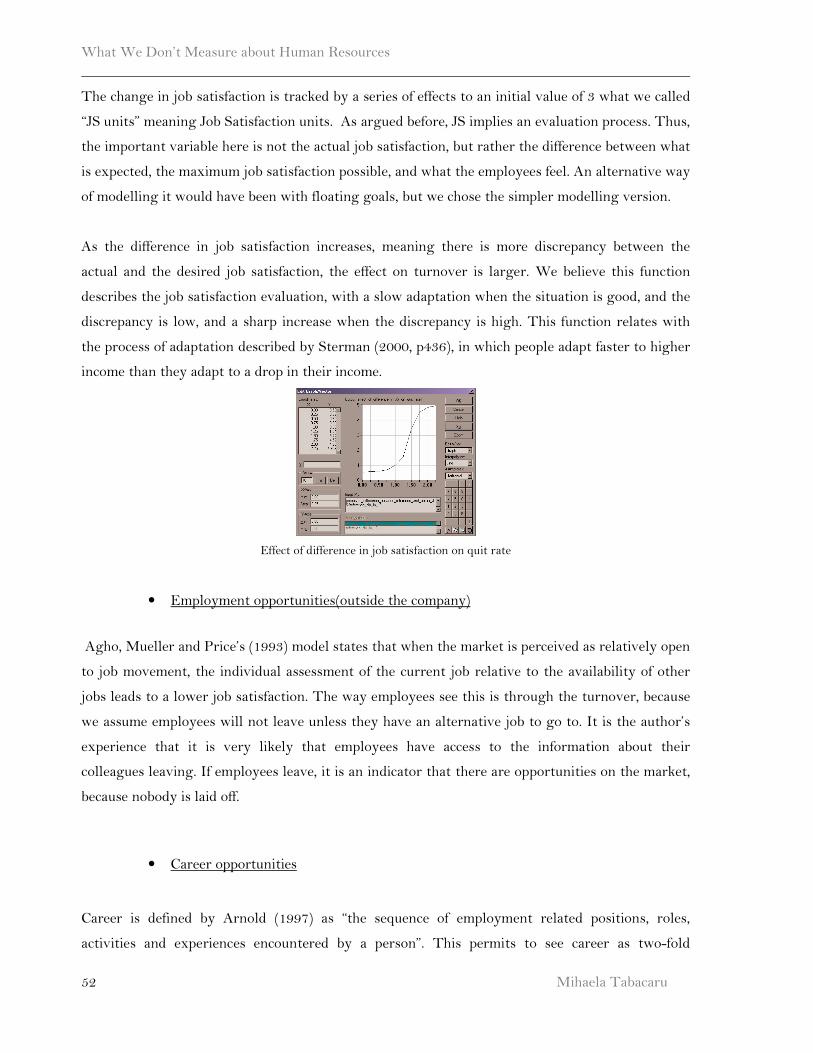
What We Don’t Measure about Human Resources
Mihaela Tabacaru
52
The change in job satisfaction is tracked by a series of effects to an initial value of 3 what we called
“JS units” meaning Job Satisfaction units. As argued before, JS implies an evaluation process. Thus,
the important variable here is not the actual job satisfaction, but rather the difference between what
is expected, the maximum job satisfaction possible, and what the employees feel. An alternative way
of modelling it would have been with floating goals, but we chose the simpler modelling version.
As the difference in job satisfaction increases, meaning there is more discrepancy between the
actual and the desired job satisfaction, the effect on turnover is larger. We believe this function
describes the job satisfaction evaluation, with a slow adaptation when the situation is good, and the
discrepancy is low, and a sharp increase when the discrepancy is high. This function relates with
the process of adaptation described by Sterman (2000, p436), in which people adapt faster to higher
income than they adapt to a drop in their income.
Effect of difference in job satisfaction on quit rate
• Employment opportunities(outside the company)
Agho, Mueller and Price’s (1993) model states that when the market is perceived as relatively open
to job movement, the individual assessment of the current job relative to the availability of other
jobs leads to a lower job satisfaction. The way employees see this is through the turnover, because
we assume employees will not leave unless they have an alternative job to go to. It is the author’s
experience that it is very likely that employees have access to the information about their
colleagues leaving. If employees leave, it is an indicator that there are opportunities on the market,
because nobody is laid off.
• Career opportunities
Career is defined by Arnold (1997) as “the sequence of employment related positions, roles,
activities and experiences encountered by a person”. This permits to see career as two-fold
What We Don’t Measure about Human Resources
Mihaela Tabacaru 53
oriented: one is inside the company, where a person can evolve either horizontally, by making
his/her job more interesting, or vertically, by climbing up the so called ‘career ladder’ or hierarchy
in the organization, and the second one a person’s lifetime succession of jobs, from one company to
another. We are concerned with the first type of mobility, inside one company. Among the most
frequently used organizational interventions that regard career management are: internal vacancy
notification, horizontal mobility, career paths, special projects, coaching/mentoring, individual
counselling, training opportunities, succession planning, skills inventory, promotion/demotion,
personal development plans, etc.
Why talk about career opportunities? When shortages resulting from a growth strategy are
identified, the cost of employing, orienting, and training the additional personnel and the reduced
productivity of present employees while the new employees are developed should be calculated
(Morrison& Adams, 1991). If the mix of skills is inappropriate, it is possible to assess human
resource costs for a strategy alternative using either a “make” or a “buy” career development
strategy. This has been revealed by most of the consultants in our field study (Tabacaru,
unpublished field study; unreferenced, 2005) and is also highlighted by Morrison& Adams (1991).
A buy strategy would mean that the new skills that the company needs will be bought from the
outside market, assuming the resulting effect of lower morale on retention and possibly
productivity. On the other hand, a make strategy would require assessing and re-training
employees to provide them with the knowledge required to work in the areas of the strategy.
In the field study we did, the single item that kept arising in every discussion with the consultants
was the lack of career path in organizations. People enter the firm full of energy and willingness to
work, to find out that there is no formal system to recognize their abilities and that the only way up
is to leave to another firm, on a higher position. In fact, there seems to be a norm in multinational
companies that are striving for good employees that almost nobody stays in a firm longer than 3-4
years (Tabacaru, unpublished field study; unreferenced, 2005). In this context of hopping from one
firm to another, the employee has a lot to gain, since he is advancing in position or/and salary, but
the firms are losing important intellectual capital. Yet they seem to prefer to import it rather than
develop it, thus increasing even more their cost of HR management.
Holton et al (2004, p.71) suggest that one of the indicators of a successful development process in
the organization is the measure of internal hiring:
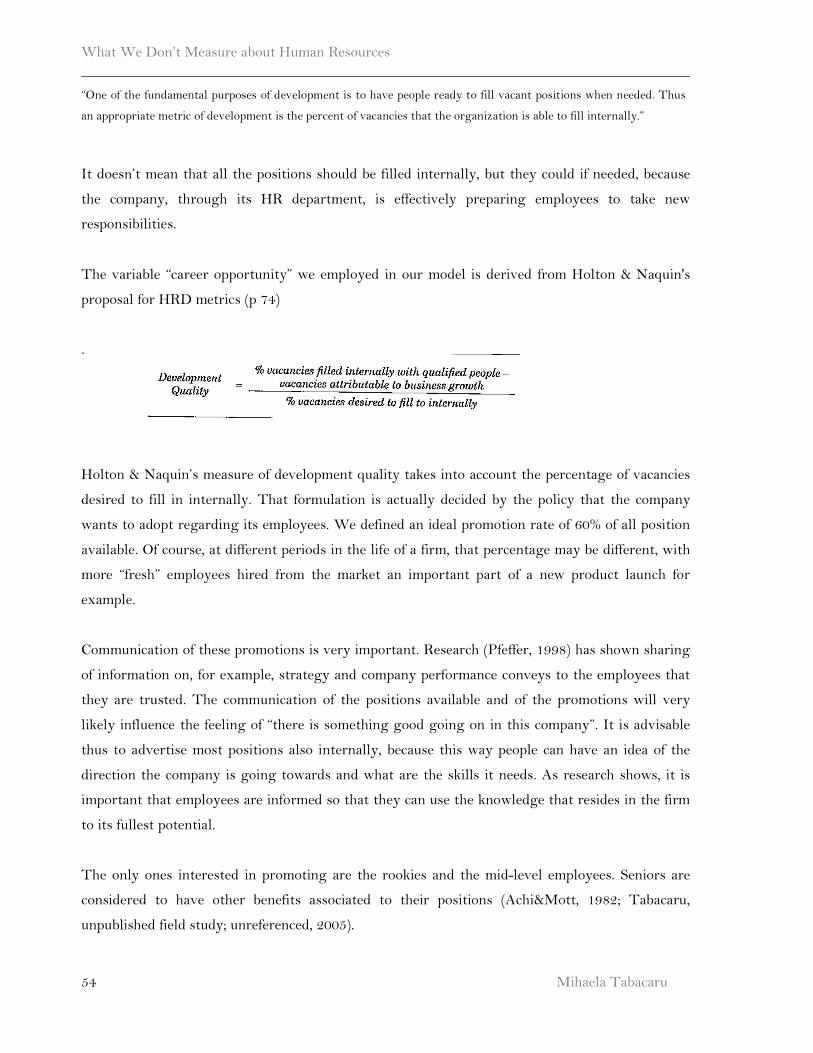
What We Don’t Measure about Human Resources
Mihaela Tabacaru
54
“One of the fundamental purposes of development is to have people ready to fill vacant positions when needed. Thus
an appropriate metric of development is the percent of vacancies that the organization is able to fill internally.”
It doesn’t mean that all the positions should be filled internally, but they could if needed, because
the company, through its HR department, is effectively preparing employees to take new
responsibilities.
The variable “career opportunity” we employed in our model is derived from Holton & Naquin's
proposal for HRD metrics (p 74)
.
Holton & Naquin’s measure of development quality takes into account the percentage of vacancies
desired to fill in internally. That formulation is actually decided by the policy that the company
wants to adopt regarding its employees. We defined an ideal promotion rate of 60% of all position
available. Of course, at different periods in the life of a firm, that percentage may be different, with
more “fresh” employees hired from the market an important part of a new product launch for
example.
Communication of these promotions is very important. Research (Pfeffer, 1998) has shown sharing
of information on, for example, strategy and company performance conveys to the employees that
they are trusted. The communication of the positions available and of the promotions will very
likely influence the feeling of “there is something good going on in this company”. It is advisable
thus to advertise most positions also internally, because this way people can have an idea of the
direction the company is going towards and what are the skills it needs. As research shows, it is
important that employees are informed so that they can use the knowledge that resides in the firm
to its fullest potential.
The only ones interested in promoting are the rookies and the mid-level employees. Seniors are
considered to have other benefits associated to their positions (Achi&Mott, 1982; Tabacaru,
unpublished field study; unreferenced, 2005).
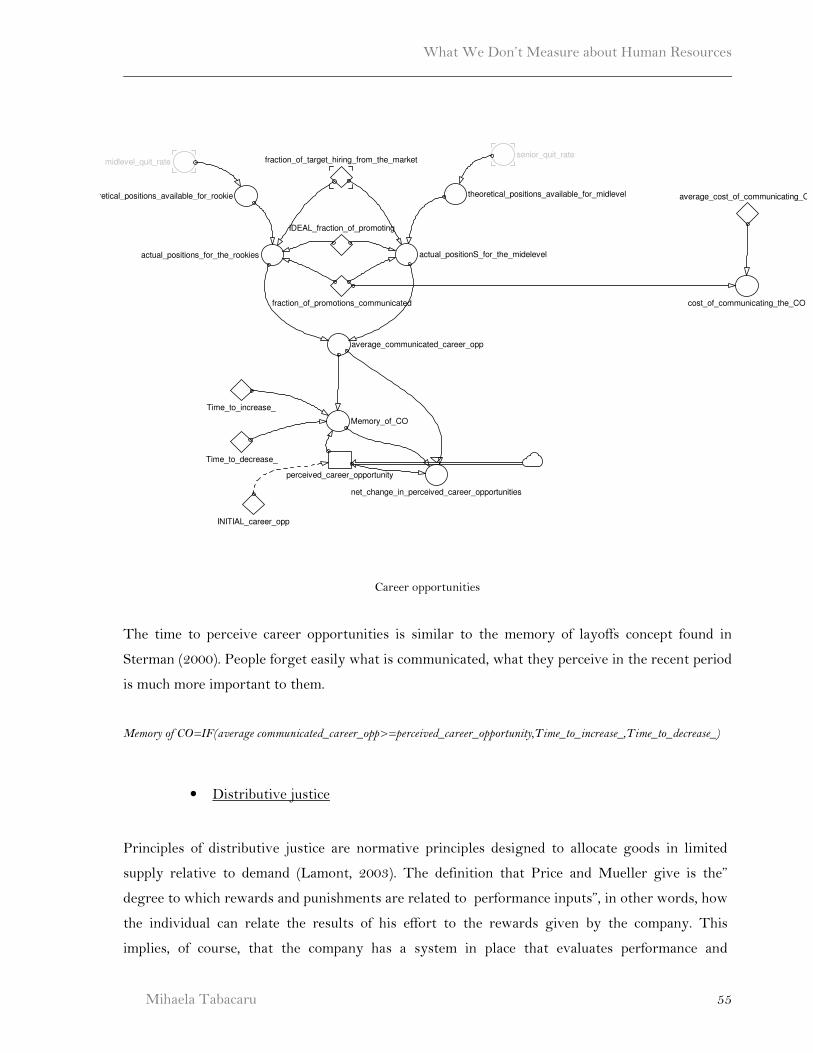
What We Don’t Measure about Human Resources
Mihaela Tabacaru 55
Career opportunities
The time to perceive career opportunities is similar to the memory of layoffs concept found in
Sterman (2000). People forget easily what is communicated, what they perceive in the recent period
is much more important to them.
Memory of CO=IF(average communicated_career_opp>=perceived_career_opportunity,Time_to_increase_,Time_to_decrease_)
• Distributive justice
Principles of distributive justice are normative principles designed to allocate goods in limited
supply relative to demand (Lamont, 2003). The definition that Price and Mueller give is the”
degree to which rewards and punishments are related to performance inputs”, in other words, how
the individual can relate the results of his effort to the rewards given by the company. This
implies, of course, that the company has a system in place that evaluates performance and
senior_quit_ratemidlevel_quit_rate
theoretical_positions_available_for_midleveltheoretical_positions_available_for_rookie
perceived_career_opportunity
Memory_of_CO
Time_to_increase_
Time_to_decrease_
cost_of_communicating_the_CO
actual_positionS_for_the_midelevel
fraction_of_target_hiring_from_the_market
fraction_of_promotions_communicated
actual_positions_for_the_rookies
average_communicated_career_opp
net_change_in_perceived_career_opportunities
INITIAL_career_opp
IDEAL_fraction_of_promoting
average_cost_of_communicating_CO
What We Don’t Measure about Human Resources
Mihaela Tabacaru
56
distributes rewards and punishments accordingly. There are several ways one can do that, and we
will refer to that of performance management, that implies feedback to the employee about his
performance.
The performance management concept goes a step further than simple productivity measures and
encompasses the Total Quality Management concept (Waldman, 1994). Defining clear objectives,
and having a clear job description are essential for the employee in clarifying his/her role in the
organization and identifying his/her own goals with the ones that the employer wants, thus
achieving a high distributive justice evaluation. Therefore a system that formalizes the performance
evaluation is crucial to attaining this goal. As Argyris (1962) points out, the formal organizations
are very inclined to have control over their activities, as in measuring data on how well the firm is
going, comparing it with the forecasted values, but they very often do this separating the
performance of the job from its evaluation. The separation of these two leads to the individual not
feeling responsible for the quality of his work.
The performance management process provides an opportunity for the employee and performance
manager to discuss development goals and jointly create a plan for achieving those goals.
Development plans should contribute to organizational goals and the professional growth of the
employee. The process has several steps that have to be followed (Davis, 1995):
1. Job description& essential functions; annual goals
First, the employee has to know exactly what one has to do and how does one’s work help achieve
the organizational goals. This gives meaning to one’s work and puts in the larger context of the
organization.
2. Standards of performance
After deciding what the employee has to do, the supervisor together with the employee decide the
standards of performance that need to be attained and how the job will be evaluated as good or bad,
as specific as possible. Another point to be decided on is the time period for evaluation and also
some intermediate meetings to discuss progress. This should give the employee the sense of
involvement in his work and should provide an open communication channel between the
supervisor and the employee.
3. Observation and feedback
This is a continuous process from both employee and supervisor. It is recommended that the
process is documented in writing, so both parties have a common ground of discussion in the
performance evaluation meetings.
What We Don’t Measure about Human Resources
Mihaela Tabacaru 57
4. Performance appraisal
This regards a formal bi-annual or annual meeting in which the standards of performance are
discussed and an evaluation is given. A plan for future improvement of the skills that have not
received a very good evaluation is made.
5. Performance development
The skills and knowledge that have been agreed on in the previous steps are developed and checked
for transfer.
It is very important to underline that this process is not governed by the manager or supervisor,
but it is a joint result of both parts: employer- employee. Brinkerhoff& Dressler (1990, p 46)
underline that an effective measurement of productivity should consider the following 4 criteria:
a) quality: the measure must define and reflect quality of production and services
b) mission and goals: the measure must define and assess only the outputs and services that are
integrated with the organizational mission and strategic goals
c) rewards and incentives: measures must be integrated with performance incentives, rewards
systems and practices
d) employee involvement: in order to have buy-in form the employees, they have to be
involved in the measurement
How is performance management related to productivity and how are they influenced by the
attitudes? The theory of planned behaviour by Azjen (1989) suggests that predicting behaviour
from an attitude measure is improved if people believe that they have control over that behaviour.
Similarly, even if an employee wants to perform better, it makes it much easier if he knows how
well he is appreciated or how valuable his work is to the organization.
We tried to capture the communication of performance goals by what we called a “PM indicator”,
meaning the indicator of the performance management process described earlier, even though it
only captures the first two steps of this process: the mutual agreement on the goals to be followed
and the communication of the expectations of performance.
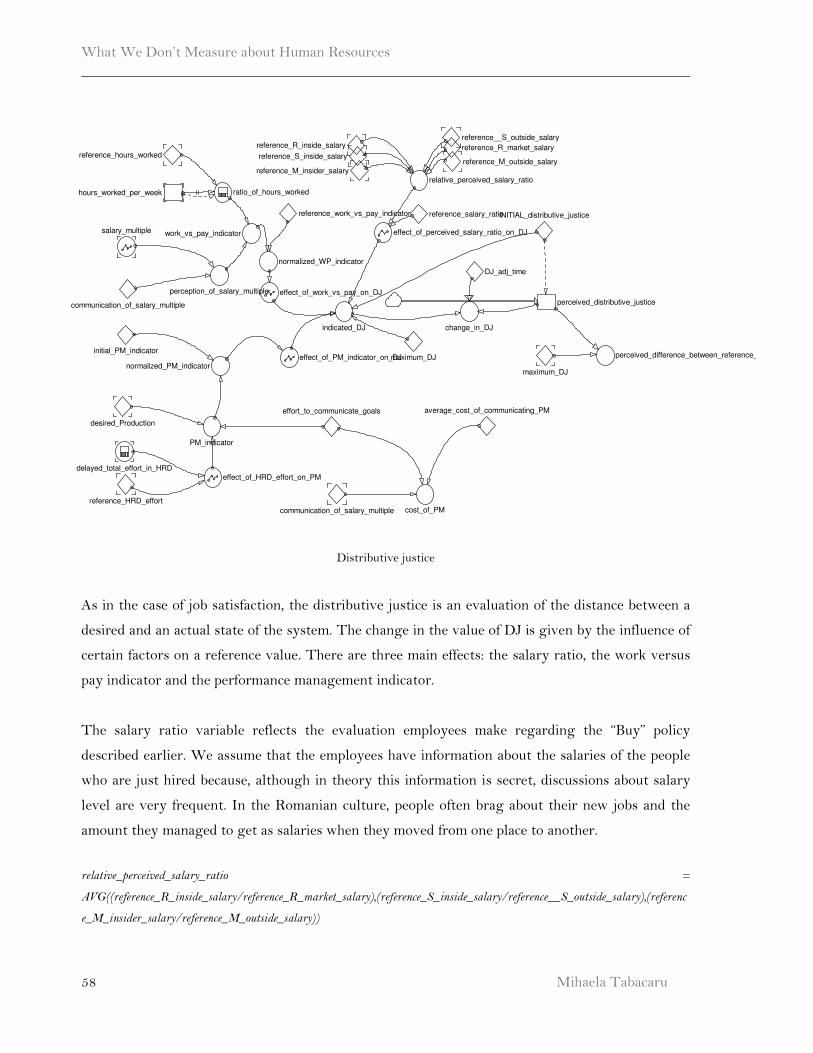
What We Don’t Measure about Human Resources
Mihaela Tabacaru
58
Distributive justice
As in the case of job satisfaction, the distributive justice is an evaluation of the distance between a
desired and an actual state of the system. The change in the value of DJ is given by the influence of
certain factors on a reference value. There are three main effects: the salary ratio, the work versus
pay indicator and the performance management indicator.
The salary ratio variable reflects the evaluation employees make regarding the “Buy” policy
described earlier. We assume that the employees have information about the salaries of the people
who are just hired because, although in theory this information is secret, discussions about salary
level are very frequent. In the Romanian culture, people often brag about their new jobs and the
amount they managed to get as salaries when they moved from one place to another.
relative_perceived_salary_ratio =
AVG((reference_R_inside_salary/reference_R_market_salary),(reference_S_inside_salary/reference__S_outside_salary),(referenc
e_M_insider_salary/reference_M_outside_salary))
perceived_distributive_justice
ratio_of_hours_worked
perception_of_salary_multiple
work_vs_pay_indicator
normalized_WP_indicator
change_in_DJ
salary_multiple
desired_Production
average_cost_of_communicating_PM
normalized_PM_indicator
delayed_total_effort_in_HRD
PM_indicator
effect_of_HRD_effort_on_PM
communication_of_salary_multiple cost_of_PMreference_HRD_effort
maximum_DJ perceived_difference_between_reference_and_actual_DJ
maximum_DJ
INITIAL_distributive_justice
communication_of_salary_multiple
effect_of_PM_indicator_on_DJ
effort_to_communicate_goals
initial_PM_indicator
hours_worked_per_week
reference_hours_worked
reference_work_vs_pay_indicator
effect_of_work_vs_pay_on_DJ
DJ_adj_time
reference_S_inside_salary
reference_M_insider_salary
reference__S_outside_salary
reference_M_outside_salary
reference_R_inside_salary
relative_perceived_salary_ratio
reference_R_market_salary
effect_of_perceived_salary_ratio_on_DJ
reference_salary_ratio
indicated_DJ
What We Don’t Measure about Human Resources
Mihaela Tabacaru 59
Another influence on the distributive justice describes how the individual relates the results of his
effort to the rewards given by the company, a central point in the concept of distributive justice. In
our model, we used a salary multiple to show the influence of the profit on the normal salary of
employees, relating it to a sort of bonus system (cited in Linard & Dvorsky, 2004). The “work vs
pay indicator” shows the mental calculus people do: what I have worked overtime, versus what the
company has paid me extra. If the company pays according to the effort employees have put in,
then the indicator is good, otherwise not. In order to capture this, we are weighing the amount of
overtime employees are doing with the increase in their salaries. In Romania, in the industries we
are describing (the banking and telecom business), the common practice, unfortunately, is that
overtime is not paid. To avoid the legal hassles such a practice entangles, the companies say to
their employees that they are not paid for the time they spend working, but by tasks performed in a
day, and that the “usual” working hours are 8 per day, but they are expected to stay until they
finish what they have to do. Thus, any overtime that is done to perform tasks that are required in a
day, is usually not paid. There are other forms of compensation however, which are the increases or
bonuses in the salary if the company goes well and makes enough profit.
work_vs_pay_indicator = ratio_of_hours_worked DIVZ0 perception_of_salary_multiple
As discussed earlier, it is important to represent explicitly the fact that people should know what is
expected from them. If the effort to communicate goals is 1, it means that the goals are
communicated and everybody knows what is expected of them.
HR quality
Quality of the employees is understood in terms of KSA (Knowledge, Skills and Abilities) that an
employee has. The literature shows (Holton at el, 2000; Knowles et al 1998) that just sending an
employee to training is not a guarantee that he/she will actually use the information, or KSA,
gained there. Organizations wishing to enhance their return on investment from learning-training
investments must understand the factors that affect transfer of learning, and then try to improve
the factors inhibiting transfer. We think that it is important therefore to assume that people do not
readily transfer what they have learned into their daily job tasks, but that there are factors
influencing it.
Baldwin and Ford (1988) and more recently Holton et al.(2000) have identified three major factors
influencing transfer of knowledge from training: climate (such as performance expectations,
What We Don’t Measure about Human Resources
Mihaela Tabacaru
60
openness to change, performance coaching), job utility (which comprises factors like content
validity of the training program, opportunity to use learning, transfer design or peer support) and
rewards (which can be identified with external motivation, but also covers personal outcomes as
prestige and absence of sanctions from the supervisor).
The adult learning literature suggests that adults need several conditions be met in order for them
to actually benefit from a training program. Knowles et al (1998), in a revised version of the well
known theory of andragogy, identified 6 adult learning principles: learner's need to know, self
concept of the learner, prior experience of the learner, readiness to learn, orientation to learning
and motivation to learn. In addition to this, Holton et al (2000) argue that from learning to
transferring the knowledge to the specific work settings of each organization there are things to be
done. In the instrument developed by the authors, named the "Learning Transfer Indicator”, the
authors identify the factors mediating transfer. Among the most important:
- “Transfer design”, how does the firm plan that the knowledge be transferred to
workplace situations, does it give or not any indication of this during the training
program;
- “Opportunity to use”, if the employee is given the opportunity to use the new
information at work ;
- “Peer support”: do the peers help the newly trained make use of his/her new knowledge,
- “Learner readiness”: Is the employee ready to learn, does he/she find it important that
he participates in this training program,;
- “Motivation to transfer”: is the employee motivated to transfer the knowledge;
- “Supervisor support”: does the direct supervisor encourage the employee to use the new
knowledge, does he/she offer any opportunity to use the knowledge; and
- “Personal outcomes”: will one be better evaluated, will he gain anything at salary or in
status for using the knowledge.
In SD language, the above mentioned factors are mediating factors, meaning that they have an
effect on the inflow that builds the quality capability. Thus, if the environment, the people and the
rewards are favourable, the effect will be positive, adding up to the quality; if the environment is
hostile, then no matter how good the training was, the transfer will not be complete. We define
this influence using a nonlinear function.
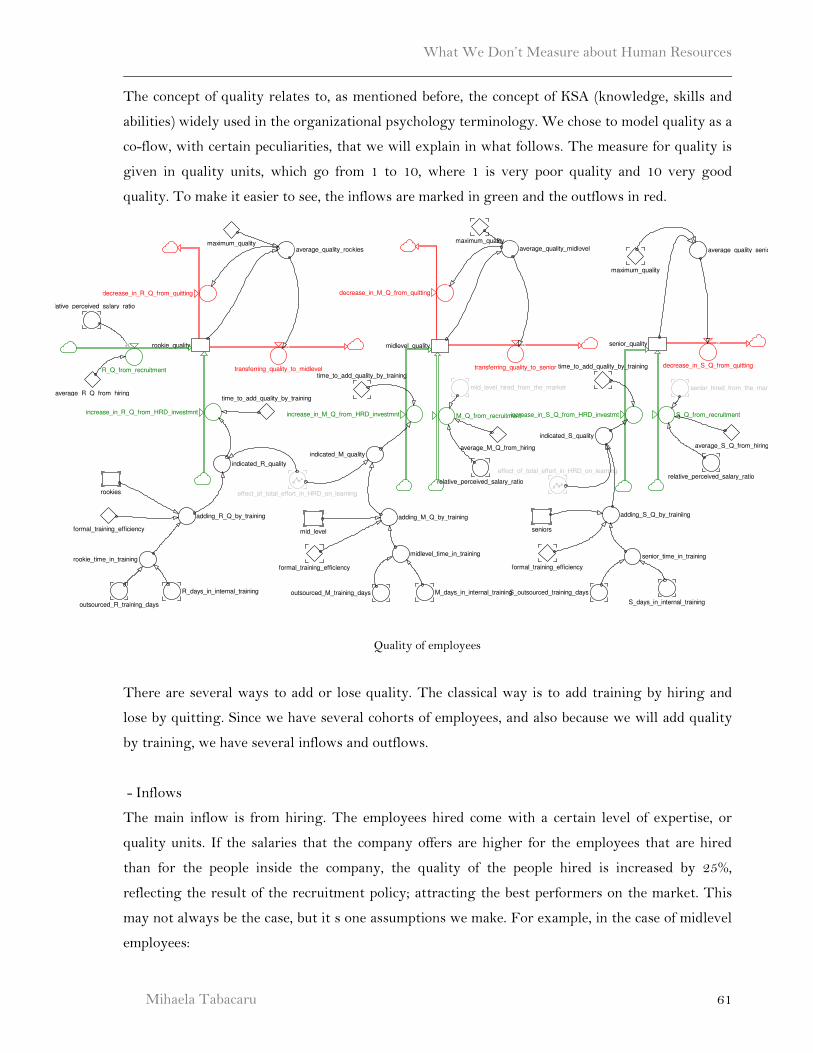
What We Don’t Measure about Human Resources
Mihaela Tabacaru 61
The concept of quality relates to, as mentioned before, the concept of KSA (knowledge, skills and
abilities) widely used in the organizational psychology terminology. We chose to model quality as a
co-flow, with certain peculiarities, that we will explain in what follows. The measure for quality is
given in quality units, which go from 1 to 10, where 1 is very poor quality and 10 very good
quality. To make it easier to see, the inflows are marked in green and the outflows in red.
Quality of employees
There are several ways to add or lose quality. The classical way is to add training by hiring and
lose by quitting. Since we have several cohorts of employees, and also because we will add quality
by training, we have several inflows and outflows.
- Inflows
The main inflow is from hiring. The employees hired come with a certain level of expertise, or
quality units. If the salaries that the company offers are higher for the employees that are hired
than for the people inside the company, the quality of the people hired is increased by 25%,
reflecting the result of the recruitment policy; attracting the best performers on the market. This
may not always be the case, but it s one assumptions we make. For example, in the case of midlevel
employees:
average_quality_midlevel average_quality_seniors
maximum_quality
maximum_quality
time_to_add_quality_by_training
time_to_add_quality_by_training
indicated_S_quality
time_to_add_quality_by_training
average_quality_rookies
average_M_Q_from_hiring
indicated_R_quality
mid_level_hired_from_the_market senior_hired_from_the_market
average_S_Q_from_hiring
rookie_time_in_training
R_days_in_internal_training
rookies
formal_training_efficiency
adding_R_Q_by_training
midlevel_time_in_training
outsourced_M_training_days M_days_in_internal_training
outsourced_R_training_days
adding_M_Q_by_training
relative_perceived_salary_ratio
midlevel_qualityrookie_quality senior_quality
relative_perceived_salary_ratio
average_R_Q_from_hiring
formal_training_efficiency
mid_level
effect_of_total_effort_in_HRD_on_learning
effect_of_total_effort_in_HRD_on_learningrelative_perceived_salary_ratio
senior_time_in_training
S_outsourced_training_days
S_days_in_internal_training
indicated_M_quality
adding_S_Q_by_trainiing
seniors
formal_training_efficiency
R_Q_from_recruitment
decrease_in_R_Q_from_quitting
increase_in_R_Q_from_HRD_investmnt
transferring_quality_to_midlevel
increase_in_M_Q_from_HRD_investmnt M_Q_from_recruitment
decrease_in_M_Q_from_quitting
transferring_quality_to_senior decrease_in_S_Q_from_quitting
increase_in_S_Q_from_HRD_investmt S_Q_from_recruitment
maximum_quality
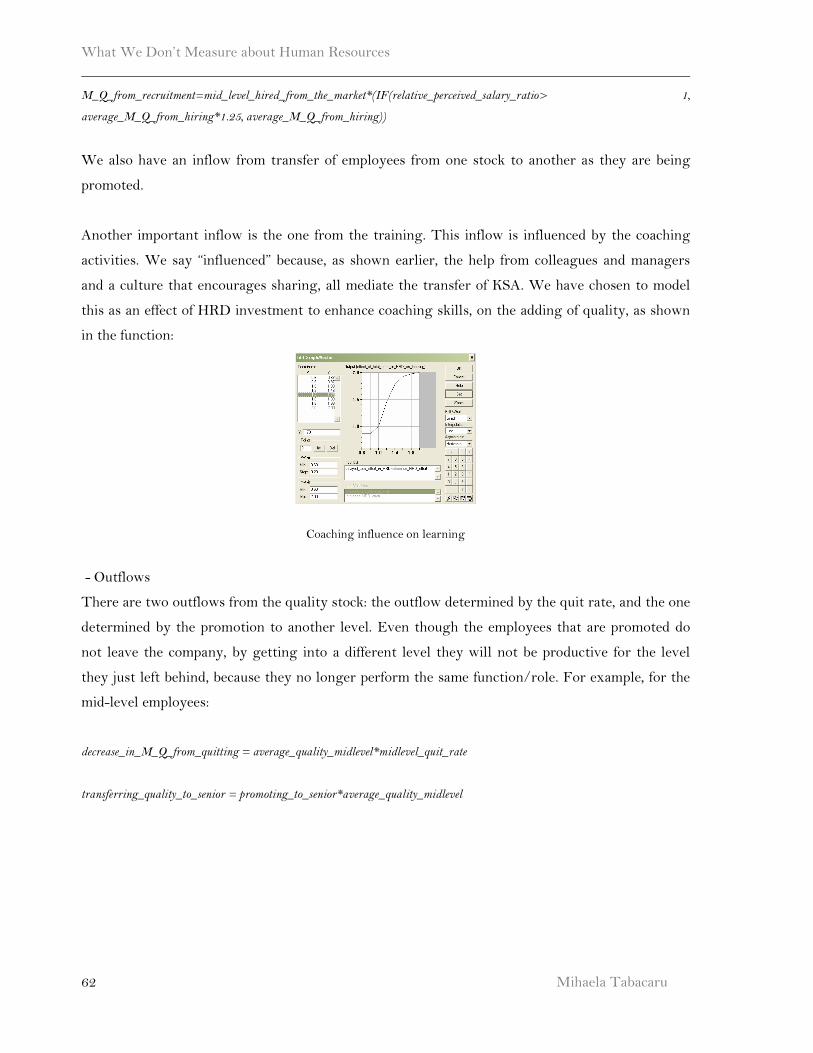
What We Don’t Measure about Human Resources
Mihaela Tabacaru
62
M_Q_from_recruitment=mid_level_hired_from_the_market*(IF(relative_perceived_salary_ratio> 1,
average_M_Q_from_hiring*1.25, average_M_Q_from_hiring))
We also have an inflow from transfer of employees from one stock to another as they are being
promoted.
Another important inflow is the one from the training. This inflow is influenced by the coaching
activities. We say “influenced” because, as shown earlier, the help from colleagues and managers
and a culture that encourages sharing, all mediate the transfer of KSA. We have chosen to model
this as an effect of HRD investment to enhance coaching skills, on the adding of quality, as shown
in the function:
Coaching influence on learning
- Outflows
There are two outflows from the quality stock: the outflow determined by the quit rate, and the one
determined by the promotion to another level. Even though the employees that are promoted do
not leave the company, by getting into a different level they will not be productive for the level
they just left behind, because they no longer perform the same function/role. For example, for the
mid-level employees:
decrease_in_M_Q_from_quitting = average_quality_midlevel*midlevel_quit_rate
transferring_quality_to_senior = promoting_to_senior*average_quality_midlevel
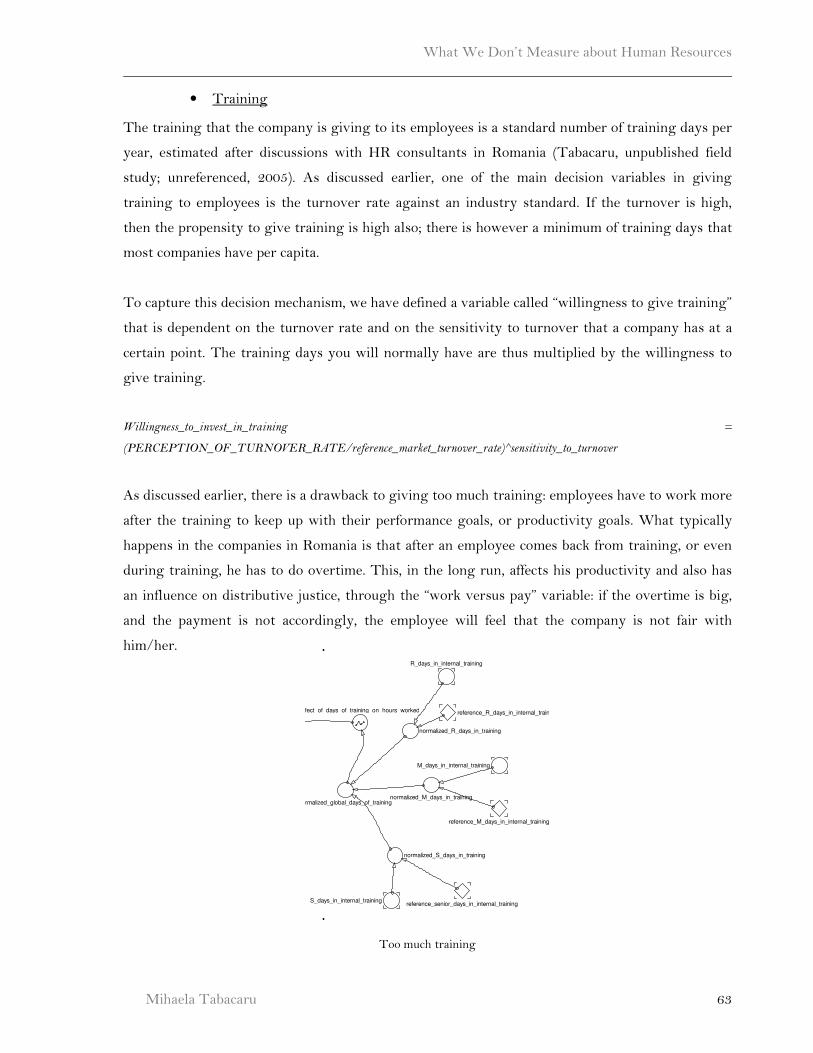
What We Don’t Measure about Human Resources
Mihaela Tabacaru 63
• Training
The training that the company is giving to its employees is a standard number of training days per
year, estimated after discussions with HR consultants in Romania (Tabacaru, unpublished field
study; unreferenced, 2005). As discussed earlier, one of the main decision variables in giving
training to employees is the turnover rate against an industry standard. If the turnover is high,
then the propensity to give training is high also; there is however a minimum of training days that
most companies have per capita.
To capture this decision mechanism, we have defined a variable called “willingness to give training”
that is dependent on the turnover rate and on the sensitivity to turnover that a company has at a
certain point. The training days you will normally have are thus multiplied by the willingness to
give training.
Willingness_to_invest_in_training =
(PERCEPTION_OF_TURNOVER_RATE/reference_market_turnover_rate)^sensitivity_to_turnover
As discussed earlier, there is a drawback to giving too much training: employees have to work more
after the training to keep up with their performance goals, or productivity goals. What typically
happens in the companies in Romania is that after an employee comes back from training, or even
during training, he has to do overtime. This, in the long run, affects his productivity and also has
an influence on distributive justice, through the “work versus pay” variable: if the overtime is big,
and the payment is not accordingly, the employee will feel that the company is not fair with
him/her.
Too much training
S_days_in_internal_training
normalized_S_days_in_training
R_days_in_internal_training
reference_R_days_in_internal_training
reference_M_days_in_internal_training
M_days_in_internal_training
reference_senior_days_in_internal_training
normalized_global_days_of_trainingnormalized_M_days_in_training
normalized_R_days_in_training
effect_of_days_of_training_on_hours_worked
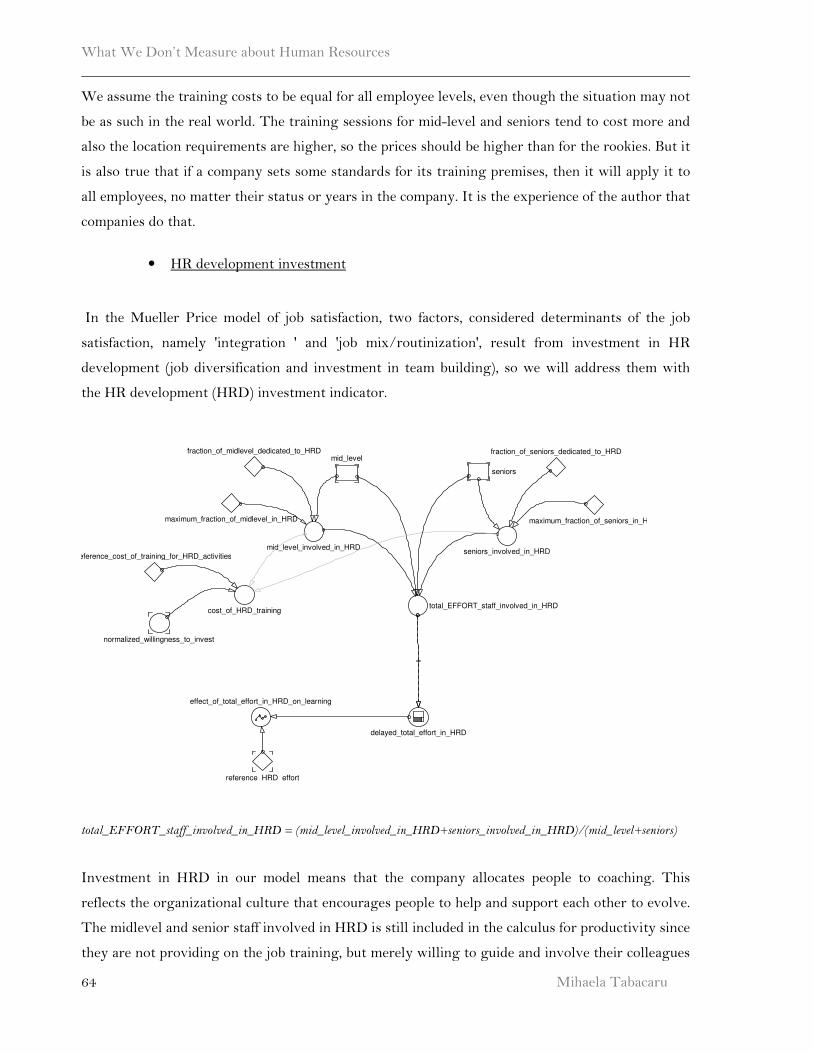
What We Don’t Measure about Human Resources
Mihaela Tabacaru
64
We assume the training costs to be equal for all employee levels, even though the situation may not
be as such in the real world. The training sessions for mid-level and seniors tend to cost more and
also the location requirements are higher, so the prices should be higher than for the rookies. But it
is also true that if a company sets some standards for its training premises, then it will apply it to
all employees, no matter their status or years in the company. It is the experience of the author that
companies do that.
• HR development investment
In the Mueller Price model of job satisfaction, two factors, considered determinants of the job
satisfaction, namely 'integration ' and 'job mix/routinization', result from investment in HR
development (job diversification and investment in team building), so we will address them with
the HR development (HRD) investment indicator.
HRD effort
total_EFFORT_staff_involved_in_HRD = (mid_level_involved_in_HRD+seniors_involved_in_HRD)/(mid_level+seniors)
Investment in HRD in our model means that the company allocates people to coaching. This
reflects the organizational culture that encourages people to help and support each other to evolve.
The midlevel and senior staff involved in HRD is still included in the calculus for productivity since
they are not providing on the job training, but merely willing to guide and involve their colleagues
maximum_fraction_of_seniors_in_HRD
seniors
mid_level
maximum_fraction_of_midlevel_in_HRD
seniors_involved_in_HRDmid_level_involved_in_HRD
delayed_total_effort_in_HRD
fraction_of_midlevel_dedicated_to_HRD fraction_of_seniors_dedicated_to_HRD
reference_HRD_effort
cost_of_HRD_trainingtotal_EFFORT_staff_involved_in_HRD
normalized_willingness_to_invest
reference_cost_of_training_for_HRD_activities
effect_of_total_effort_in_HRD_on_learning
What We Don’t Measure about Human Resources
Mihaela Tabacaru 65
in a corporative effort to improve the overall HR quality, like inviting to meetings, delegating and
encouraging project work.
Productivity
Productivity results as a function of effort (Brinkerhoff& Dressler, 1990) and we chose to define it
as a ratio between the outputs of an effort, divided by the inputs required doing the output: labour,
energy, etc. Of course there are many more methods of measuring productivity (for a
comprehensive review, see Neal & Hesketh, 2001). The terms “effectiveness” or “efficient”
associated to productivity measurements reflect a process that produces the desired results. On the
other hand, the term “performance” is used to refer to the proficiency with which individuals carry
out behaviours or activities that are relevant to the organization (Motowidlo et al, 1997). We shall
use henceforth “productivity” to refer to the measure of the employees’ work effort, influenced by
the attitudes of the employees, as described earlier.
Productivity is influenced by the good quality of employees, and, as we have shown, by their job
satisfaction. The good quality of employees means a good level of job related skills, and as
literature shows, acquisition and development of new skills can explain up to 23% of the increase in
productivity (Patterson, West, Lawthom, Nickell, 1998). Further more, organizations design
performance evaluation and reward systems in order to (Lawler, 1977):
a) induce individuals to join the organization
b) motivate attendance and performance effectiveness
c) reinforce the organizational structure by signalling to employees the instrumentalities of
various outcomes
As we saw earlier, the relation between performance and job satisfaction defines a positive feedback
loop: on one hand, the distributive justice, meaning the employees’ impression of their performance
evaluation, partly determines their job satisfaction. On the other hand, their job satisfaction
influences productivity, especially if they are dissatisfied, as in the case of withdrawal behaviours
earlier explained.
We modelled productivity as a stock because we believe it represents a state of the system at a
certain point in time. The effects of the reference productivity are given by the influence of job
satisfaction and quality, already discussed, and the influence of overtime. We assume, in this simple
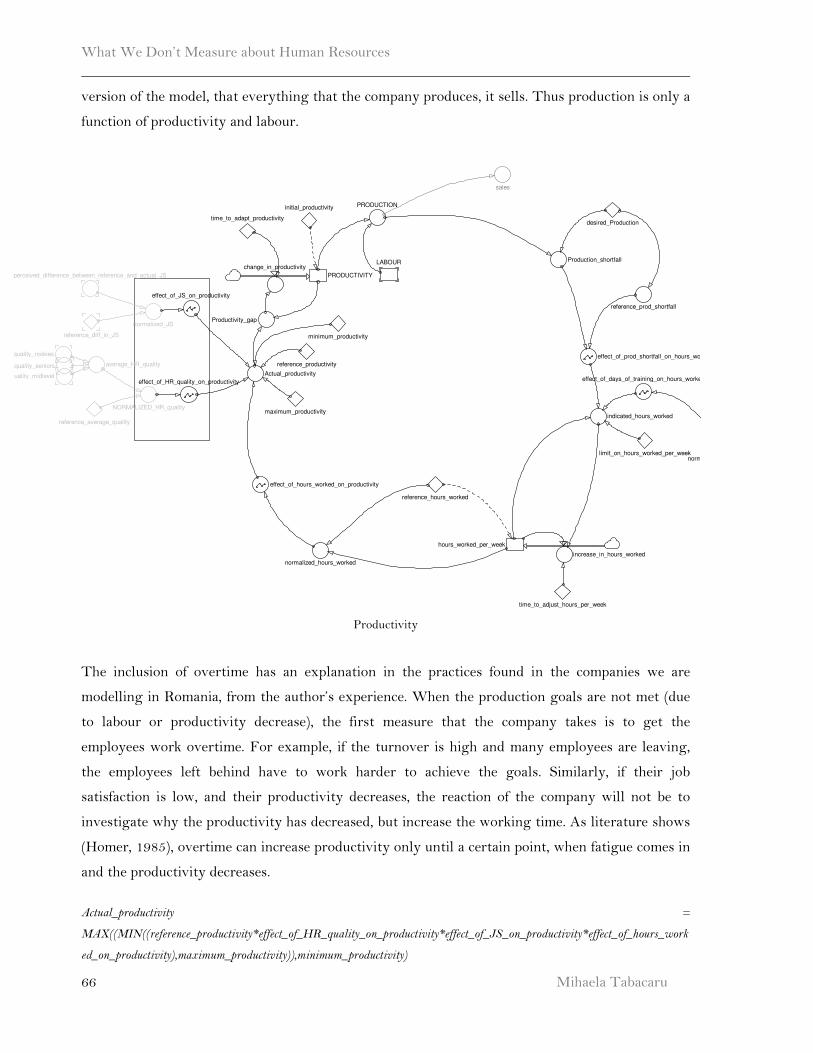
What We Don’t Measure about Human Resources
Mihaela Tabacaru
66
version of the model, that everything that the company produces, it sells. Thus production is only a
function of productivity and labour.
Productivity
The inclusion of overtime has an explanation in the practices found in the companies we are
modelling in Romania, from the author’s experience. When the production goals are not met (due
to labour or productivity decrease), the first measure that the company takes is to get the
employees work overtime. For example, if the turnover is high and many employees are leaving,
the employees left behind have to work harder to achieve the goals. Similarly, if their job
satisfaction is low, and their productivity decreases, the reaction of the company will not be to
investigate why the productivity has decreased, but increase the working time. As literature shows
(Homer, 1985), overtime can increase productivity only until a certain point, when fatigue comes in
and the productivity decreases.
Actual_productivity =
MAX((MIN((reference_productivity*effect_of_HR_quality_on_productivity*effect_of_JS_on_productivity*effect_of_hours_work
ed_on_productivity),maximum_productivity)),minimum_productivity)
reference_prod_shortfall
hours_worked_per_week
Production_shortfall
limit_on_hours_worked_per_week
increase_in_hours_worked
average_quality_seniors
time_to_adjust_hours_per_week
average_HR_quality
average_quality_rookies
average_quality_midlevel
normalized_JS
normalized_hours_worked
effect_of_hours_worked_on_productivity
perceived_difference_between_reference_and_actual_JS
LABOUR
PRODUCTION
Productivity_gap
change_in_productivity
time_to_adapt_productivity
reference_diff_in_JS
reference_average_quality
reference_hours_worked
effect_of_prod_shortfall_on_hours_worked
indicated_hours_worked
PRODUCTIVITY
NORMALIZED_HR_quality
effect_of_HR_quality_on_productivity
reference_productivity
maximum_productivity
minimum_productivity
sales
desired_Production
initial_productivity
Actual_productivity
effect_of_JS_on_productivity
normalized_global_days_of_training
effect_of_days_of_training_on_hours_worked
What We Don’t Measure about Human Resources
Mihaela Tabacaru 67
A decrease in productivity will influence the desired labour. If people fail to perform according to
standard, the company will hire more people to reach its indicated productivity, thus increasing its
cost.
Summary
This chapter has presented the building of the model, from the first causal loop diagrams that
defined the problem, the hypothetical reference mode, to the structure that we have built using
Powersim software to test our policy (a complete list of equations is listed in the appendix of this
paper). We tried to build confidence in our model by reviewing literature about job satisfaction, its
determinants and the relationship with turnover and productivity, and also about the other
variables in the model. We will now go on with showing a few validation points for the model.
What We Don’t Measure about Human Resources
Mihaela Tabacaru
68
5. VALIDATION
Most of the system dynamics scholars agree that validating a model is not an easy task and that the
validation issue has been among the most controversial issues, even more crucial as new and
complex modelling tools have emerged in recent years (Barlas & Carpenter, 1990). Greenberger et
al (1976) note that:
“No model has ever been or ever will be thoroughly validated. …‘Useful,’ ‘illuminating,’ or ‘inspiring confidence’ are
more apt descriptors applying to models than ‘valid’”.
Validation and verification are impossible (Sterman, 2000) because models are simplifications of
what is going on in the real world. Following Forrester (1973) and Forrester and Senge (1980), we
”validate” the model by trying to build confidence in the soundness and usefulness of our model.
We have taken some steps towards this goal by building on psychology literature to show the
misperception of the job satisfaction, and also by reviewing literature when building the model. We
will perform several other tests recommended in the literature (Sterman, 2000; Barlas, 1989, 1996).
Direct structure test
As described earlier, this test aims to assess the validity of the model by direct comparison with
knowledge and information about the real system (Forrester and Senge, 1980) and it consists of
structural and parameter confirmation tests.
The structure and the causal relationships we presented are based on literature describing the
importance of attitudes, especially job satisfaction, its determinants and consequences. Another
validation point is that the current policies were elicited both after interviewing the real world
actors, and by direct experience of the author participating in the system processes. Literature
showing the relatively easy ignorance of intangible or soft factors was also reviewed. Considerable
effort was put in to assess the most relevant studies in the domain, using the citation index of the
ISI knowledge base.
The parameters we used in the model have real counter parts in most cases, except for the soft
factors; we have showed however that there several ways to measure intangible concepts. The
recommendation of Sterman (2000) is that parameter values are consistent with relevant

What We Don’t Measure about Human Resources
Mihaela Tabacaru 69
descriptive and numerical knowledge of the system, and they are assessed based on interviews,
expert opinion or direct experience. The values chosen for the model were based both on the field
study (Tabacaru, unpublished field study; unreferenced, 2005), and also estimated by the direct
experience of the author, working as a HR consultant in Romania for over 5 years. All parameters
were checked for dimensional consistency.
Structure oriented behaviour test
Extreme conditions
This test is meant to asses the plausibility of the model in response to extreme policies, shocks and
parameters. Although some of these values parameters may never occur in the real world, the
model should be robust when subject to extreme shocks and parameters (Peterson and Eberlein,
1994). All the divisions in the model were tested for 0 values at the denominator; we will not
present all the results of the tests here. We will concentrate on two indicators: the desired
production and the quality level. We compared the values of the extreme testing with the values of
the model in equilibrium.
• Desired production = 0
If the desired production drops, it means that the firms’ products are no longer demanded on the
market. We expect that, as a consequence, the firm will no longer be willing to hire, even though it
will not fire people, so the labour will drop radically. We also expect that the job satisfaction will
remain as low as in the initial condition, since in our model its determinants are not related to the
firms’ performance on the market.
The model behaves as expected: labour and production drop to 0; profits drop to zero, and job
satisfaction stabilizes at a low level.
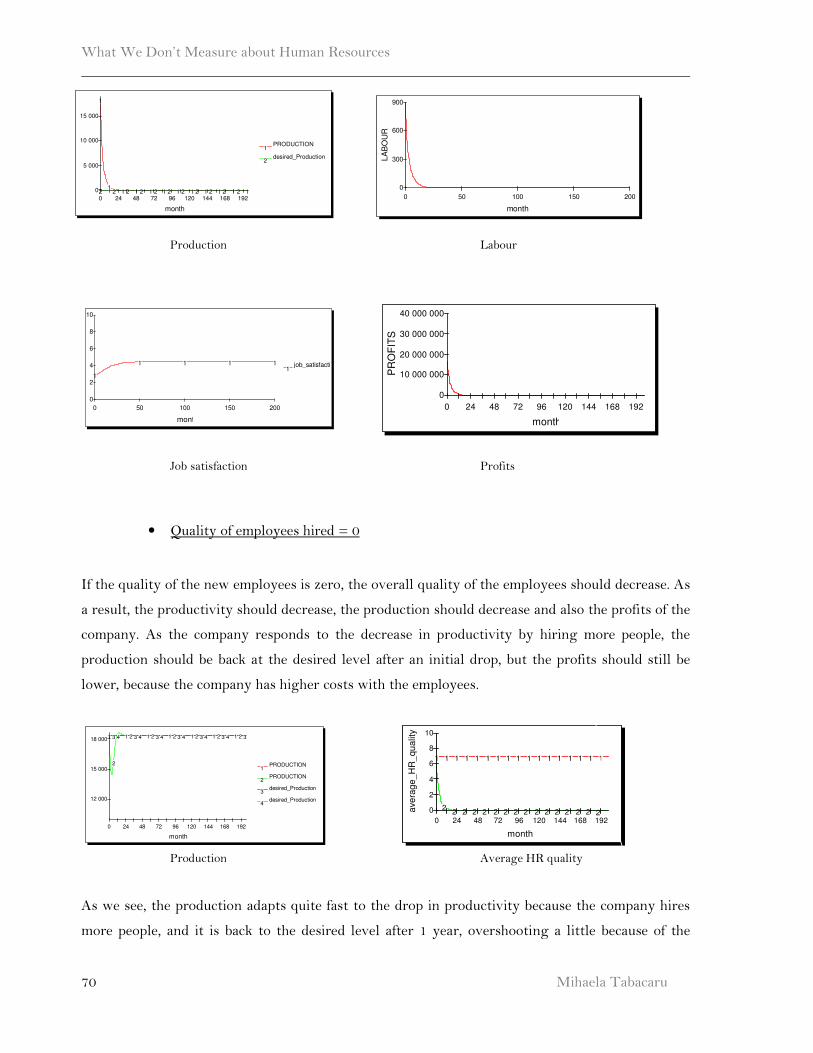
What We Don’t Measure about Human Resources
Mihaela Tabacaru
70
Production Labour
Job satisfaction Profits
• Quality of employees hired = 0
If the quality of the new employees is zero, the overall quality of the employees should decrease. As
a result, the productivity should decrease, the production should decrease and also the profits of the
company. As the company responds to the decrease in productivity by hiring more people, the
production should be back at the desired level after an initial drop, but the profits should still be
lower, because the company has higher costs with the employees.
Production Average HR quality
As we see, the production adapts quite fast to the drop in productivity because the company hires
more people, and it is back to the desired level after 1 year, overshooting a little because of the
month
job_satisfaction1
0 50 100 150 200
0
2
4
6
8
10
1
1 1 1 1
month
LA
BO
UR
0 50 100 150 200
0
300
600
900
month
PRODUCTION1
desired_Production2
0 24 48 72 96 120 144 168 192
0
5 000
10 000
15 000
1
21
2 1 2 1 2 1 2 1 2 1 2 1 2 1 2 1 2 1 2 1
month
PR
OF
ITS
0 24 48 72 96 120 144 168 192
0
10 000 000
20 000 000
30 000 000
40 000 000
month
PRODUCTION1
PRODUCTION2
desired_Production3
desired_Production4
0 24 48 72 96 120 144 168 192
12 000
15 000
18 0001
2
3 4 1 2 3 4 1 2 3 4 1 2 3 4 1 2 3 4 1 2 3 4 1 2 3
month
ave
rag
e_
HR
_q
ua
lity
0 24 48 72 96 120 144 168 192
0
2
4
6
8
10
1
2
1
2
1
2
1
2
1
2
1
2
1
2
1
2
1
2
1
2
1
2
1
2
1
2
1
2
1
2
1
2
1
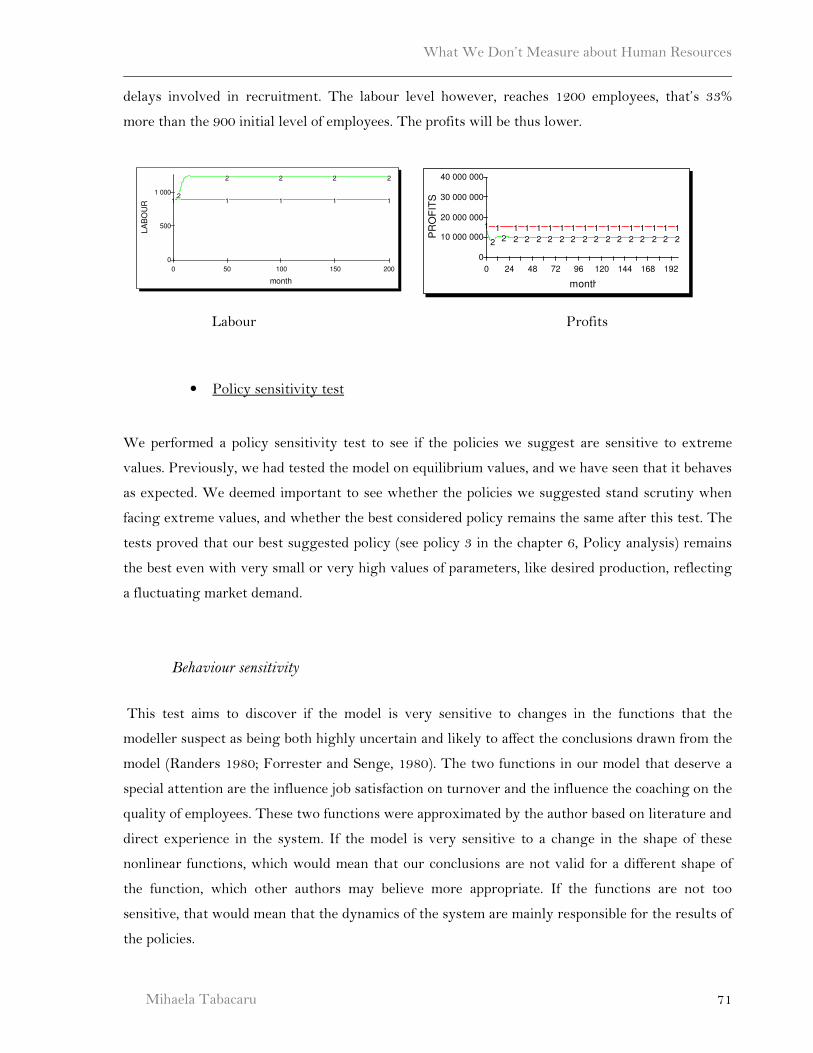
What We Don’t Measure about Human Resources
Mihaela Tabacaru 71
delays involved in recruitment. The labour level however, reaches 1200 employees, that’s 33%
more than the 900 initial level of employees. The profits will be thus lower.
Labour Profits
• Policy sensitivity test
We performed a policy sensitivity test to see if the policies we suggest are sensitive to extreme
values. Previously, we had tested the model on equilibrium values, and we have seen that it behaves
as expected. We deemed important to see whether the policies we suggested stand scrutiny when
facing extreme values, and whether the best considered policy remains the same after this test. The
tests proved that our best suggested policy (see policy 3 in the chapter 6, Policy analysis) remains
the best even with very small or very high values of parameters, like desired production, reflecting
a fluctuating market demand.
Behaviour sensitivity
This test aims to discover if the model is very sensitive to changes in the functions that the
modeller suspect as being both highly uncertain and likely to affect the conclusions drawn from the
model (Randers 1980; Forrester and Senge, 1980). The two functions in our model that deserve a
special attention are the influence job satisfaction on turnover and the influence the coaching on the
quality of employees. These two functions were approximated by the author based on literature and
direct experience in the system. If the model is very sensitive to a change in the shape of these
nonlinear functions, which would mean that our conclusions are not valid for a different shape of
the function, which other authors may believe more appropriate. If the functions are not too
sensitive, that would mean that the dynamics of the system are mainly responsible for the results of
the policies.
month
PR
OF
ITS
0 24 48 72 96 120 144 168 192
0
10 000 000
20 000 000
30 000 000
40 000 000
1
2
12
1
2
1
2
1
2
1
2
1
2
1
2
1
2
1
2
1
2
1
2
1
2
1
2
1
2
1
2
1
2
month
LA
BO
UR
0 50 100 150 200
0
500
1 000
12
1
2
1
2
1
2
1
2
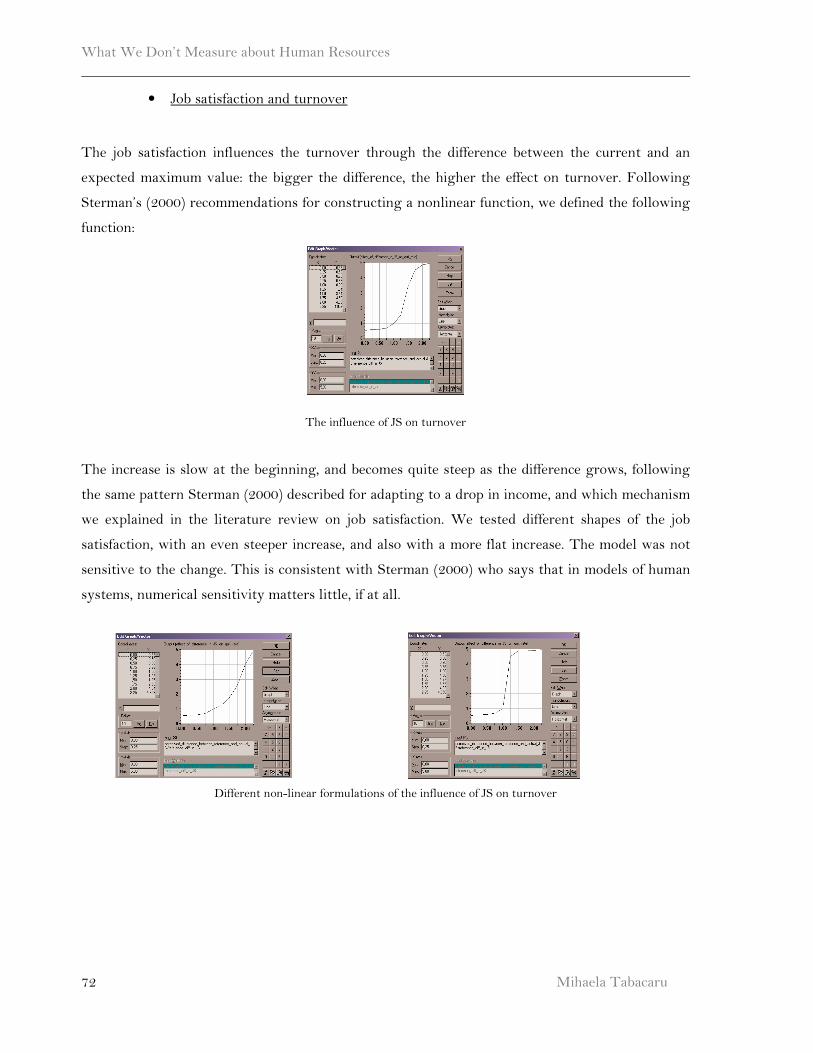
What We Don’t Measure about Human Resources
Mihaela Tabacaru
72
• Job satisfaction and turnover
The job satisfaction influences the turnover through the difference between the current and an
expected maximum value: the bigger the difference, the higher the effect on turnover. Following
Sterman’s (2000) recommendations for constructing a nonlinear function, we defined the following
function:
The influence of JS on turnover
The increase is slow at the beginning, and becomes quite steep as the difference grows, following
the same pattern Sterman (2000) described for adapting to a drop in income, and which mechanism
we explained in the literature review on job satisfaction. We tested different shapes of the job
satisfaction, with an even steeper increase, and also with a more flat increase. The model was not
sensitive to the change. This is consistent with Sterman (2000) who says that in models of human
systems, numerical sensitivity matters little, if at all.
Different non-linear formulations of the influence of JS on turnover
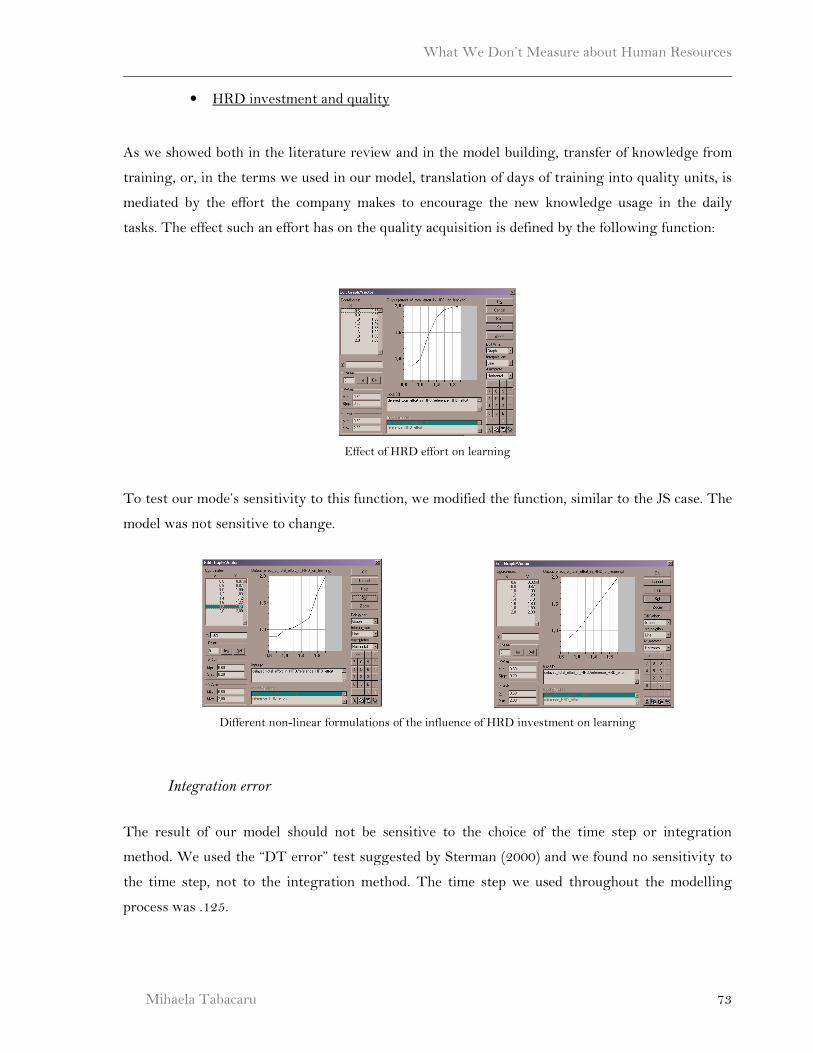
What We Don’t Measure about Human Resources
Mihaela Tabacaru 73
• HRD investment and quality
As we showed both in the literature review and in the model building, transfer of knowledge from
training, or, in the terms we used in our model, translation of days of training into quality units, is
mediated by the effort the company makes to encourage the new knowledge usage in the daily
tasks. The effect such an effort has on the quality acquisition is defined by the following function:
Effect of HRD effort on learning
To test our mode’s sensitivity to this function, we modified the function, similar to the JS case. The
model was not sensitive to change.
Different non-linear formulations of the influence of HRD investment on learning
Integration error
The result of our model should not be sensitive to the choice of the time step or integration
method. We used the “DT error” test suggested by Sterman (2000) and we found no sensitivity to
the time step, not to the integration method. The time step we used throughout the modelling
process was .125.
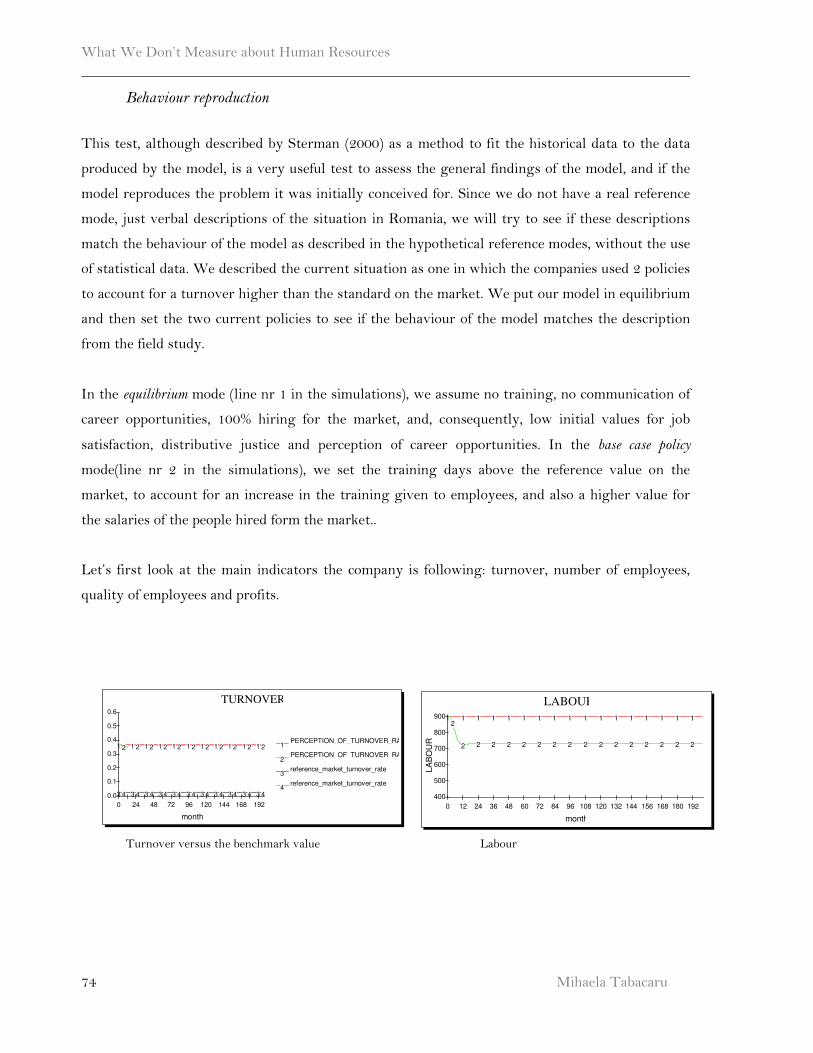
What We Don’t Measure about Human Resources
Mihaela Tabacaru
74
Behaviour reproduction
This test, although described by Sterman (2000) as a method to fit the historical data to the data
produced by the model, is a very useful test to assess the general findings of the model, and if the
model reproduces the problem it was initially conceived for. Since we do not have a real reference
mode, just verbal descriptions of the situation in Romania, we will try to see if these descriptions
match the behaviour of the model as described in the hypothetical reference modes, without the use
of statistical data. We described the current situation as one in which the companies used 2 policies
to account for a turnover higher than the standard on the market. We put our model in equilibrium
and then set the two current policies to see if the behaviour of the model matches the description
from the field study.
In the equilibrium mode (line nr 1 in the simulations), we assume no training, no communication of
career opportunities, 100% hiring for the market, and, consequently, low initial values for job
satisfaction, distributive justice and perception of career opportunities. In the base case policy
mode(line nr 2 in the simulations), we set the training days above the reference value on the
market, to account for an increase in the training given to employees, and also a higher value for
the salaries of the people hired form the market..
Let’s first look at the main indicators the company is following: turnover, number of employees,
quality of employees and profits.
Turnover versus the benchmark value Labour
LABOUR
month
LA
BO
UR
0 12 24 36 48 60 72 84 96 108 120 132 144 156 168 180 192
400
500
600
700
800
90012
1
2
1
2
1
2
1
2
1
2
1
2
1
2
1
2
1
2
1
2
1
2
1
2
1
2
1
2
1
2
1
2
TURNOVER
month
PERCEPTION_OF_TURNOVER_RATE1
PERCEPTION_OF_TURNOVER_RATE2
reference_market_turnover_rate3
reference_market_turnover_rate4
0 24 48 72 96 120 144 168 192
0.0
0.1
0.2
0.3
0.4
0.5
0.6
1 2
3 4
1 2
3 4
1 2
3 4
1 2
3 4
1 2
3 4
1 2
3 4
1 2
3 4
1 2
3 4
1 2
3 4
1 2
3 4
1 2
3 4
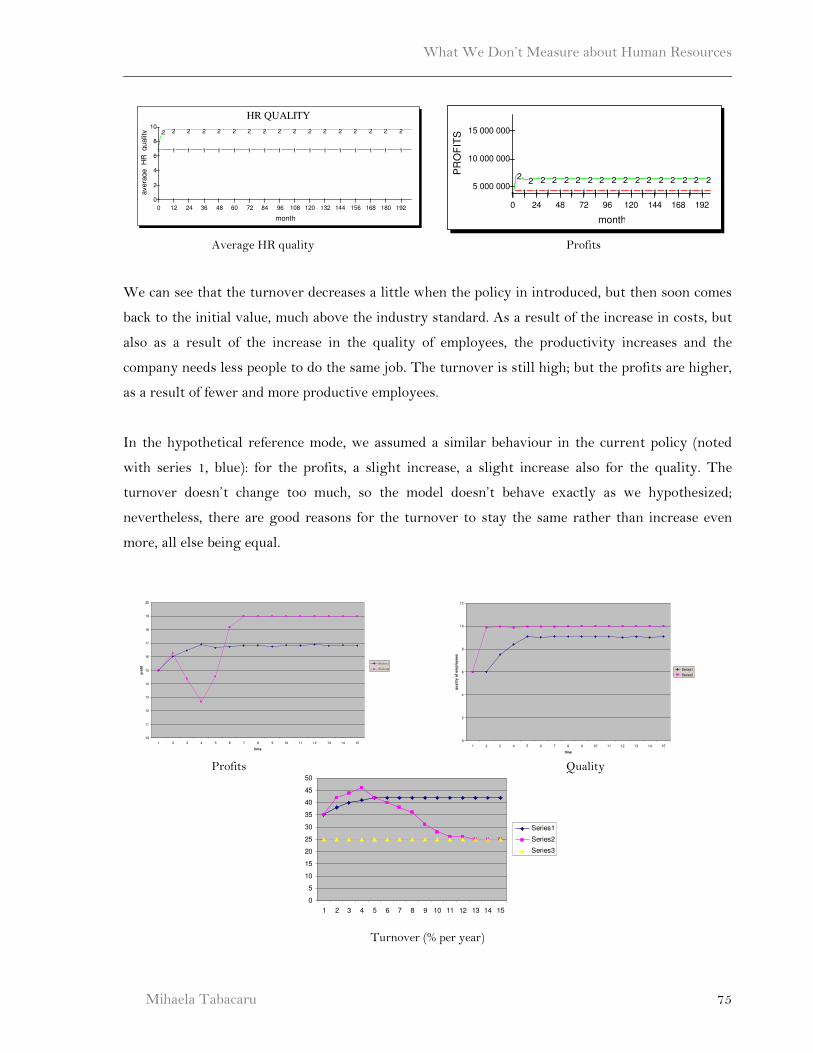
What We Don’t Measure about Human Resources
Mihaela Tabacaru 75
Average HR quality Profits
We can see that the turnover decreases a little when the policy in introduced, but then soon comes
back to the initial value, much above the industry standard. As a result of the increase in costs, but
also as a result of the increase in the quality of employees, the productivity increases and the
company needs less people to do the same job. The turnover is still high; but the profits are higher,
as a result of fewer and more productive employees.
In the hypothetical reference mode, we assumed a similar behaviour in the current policy (noted
with series 1, blue): for the profits, a slight increase, a slight increase also for the quality. The
turnover doesn’t change too much, so the model doesn’t behave exactly as we hypothesized;
nevertheless, there are good reasons for the turnover to stay the same rather than increase even
more, all else being equal.
Profits Quality
Turnover (% per year)
month
PR
OF
ITS
0 24 48 72 96 120 144 168 192
5 000 000
10 000 000
15 000 000
1
2
1
2
1
2
1
2
1
2
1
2
1
2
1
2
1
2
1
2
1
2
1
2
1
2
1
2
1
2
1
2
1
2
10
11
12
13
14
15
16
17
18
19
20
1 2 3 4 5 6 7 8 9 10 11 12 13 14 15
time
pro
fit
Series1
Series2
0
2
4
6
8
10
12
1 2 3 4 5 6 7 8 9 10 11 12 13 14 15
time
qu
ali
ty o
f e
mp
loy
ee
s
Series1
Series2
0
5
10
15
20
25
30
35
40
45
50
1 2 3 4 5 6 7 8 9 10 11 12 13 14 15
Series1
Series2
Series3
HR QUALITY
month
ave
rag
e_
HR
_q
ua
lity
0 12 24 36 48 60 72 84 96 108 120 132 144 156 168 180 192
0
2
4
6
8
10
1
2
1
2
1
2
1
2
1
2
1
2
1
2
1
2
1
2
1
2
1
2
1
2
1
2
1
2
1
2
1
2
1
2
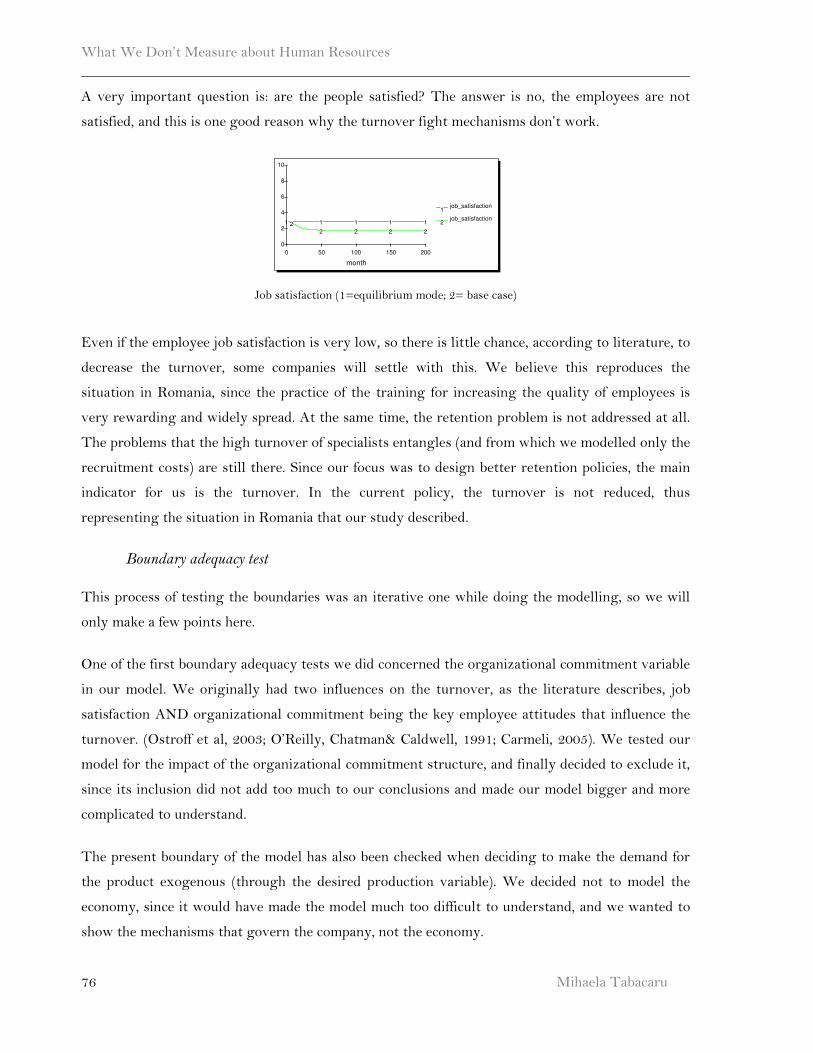
What We Don’t Measure about Human Resources
Mihaela Tabacaru
76
A very important question is: are the people satisfied? The answer is no, the employees are not
satisfied, and this is one good reason why the turnover fight mechanisms don’t work.
Job satisfaction (1=equilibrium mode; 2= base case)
Even if the employee job satisfaction is very low, so there is little chance, according to literature, to
decrease the turnover, some companies will settle with this. We believe this reproduces the
situation in Romania, since the practice of the training for increasing the quality of employees is
very rewarding and widely spread. At the same time, the retention problem is not addressed at all.
The problems that the high turnover of specialists entangles (and from which we modelled only the
recruitment costs) are still there. Since our focus was to design better retention policies, the main
indicator for us is the turnover. In the current policy, the turnover is not reduced, thus
representing the situation in Romania that our study described.
Boundary adequacy test
This process of testing the boundaries was an iterative one while doing the modelling, so we will
only make a few points here.
One of the first boundary adequacy tests we did concerned the organizational commitment variable
in our model. We originally had two influences on the turnover, as the literature describes, job
satisfaction AND organizational commitment being the key employee attitudes that influence the
turnover. (Ostroff et al, 2003; O’Reilly, Chatman& Caldwell, 1991; Carmeli, 2005). We tested our
model for the impact of the organizational commitment structure, and finally decided to exclude it,
since its inclusion did not add too much to our conclusions and made our model bigger and more
complicated to understand.
The present boundary of the model has also been checked when deciding to make the demand for
the product exogenous (through the desired production variable). We decided not to model the
economy, since it would have made the model much too difficult to understand, and we wanted to
show the mechanisms that govern the company, not the economy.
month
job_satisfaction1
job_satisfaction2
0 50 100 150 200
0
2
4
6
8
10
1 2 1
2
1
2
1
2
1
2
What We Don’t Measure about Human Resources
Mihaela Tabacaru 77
Another interesting to test was the inclusion of the quality of newly employed people. We defined
it exogenously, but we tried to see what if this quality is dependant on the quality of employees the
company already has. Such a claim would make sense because good quality employees build a good
reputation, which helps both sales and the recruitment of even higher quality employees (Warren,
2002).
We defined the equation for quality of new employees as
Average_q_from_hiring=initial_q_from_hiring*effect_of_current_q_on_recruiting_quality
, where the effect was defined as function of the average quality versus a reference value.
The results showed a slight improvement in the quality of employees, but the difference did not
make a significant impact on any of the other important indicators of the model. Thus, we decided
not to include this formulation and keep the original one from the model.
Summary
We tried to build more confidence in our model by presenting some of the test we performed in
order to validate it. Although parameters estimation in the case of the soft factors is based mainly
on literature review and experience of the author working in HR departments, without further
empirical validation, we believe that the model reproduces the main feedback loops involved and it
helps enlarge the policy makers’ mental model. We will present, in the next chapter, some of the
policy analysis we performed.
What We Don’t Measure about Human Resources
Mihaela Tabacaru
78
6. POLICY ANALYSIS
This chapter represents an important contribution of the thesis, an it consists of an analysis of
different policies and their impact on the main indicators of the firm. We first discuss the reference
case (the equilibrium) and the base case (the current policies the company is using) and we show the
soft factors the company fails to take into account. Then we go on with presenting our alternative
policies to the “train” and “buy” strategies, policies that take into consideration the job satisfaction
and its determinants.
Reference case
We initialize our model in equilibrium. The equilibrium values describe the situation in the market
if no policy for increasing the job satisfaction is in place, and the main way of replacing employees
that leave is by hiring from outside. The value of willingness to invest in training is 0 and the
fraction for hiring employees from the market is 1, the maximum. No promotion is in place, so the
employee job satisfaction has a low value: 3, on a 0 to 10 scale. The value for the distributive justice
is 5, on a 0 to 10 scale, since the salaries for current employees are the same as for the people that
are just being hired from the market. The career opportunity value is zero, since there is no real
chance of promotion for the employees. Furthermore, we assume that the initial value of quality is 7
units on a 1 to 10 scale, where 1 is the minimum and 10 the maximum, reflecting a relatively good
quality of employees.
Base case - current policies
We have modelled the base case as reflecting the current policies, with the 2 strategies in place:
“train” and “buy”. The policies are reflected in the values of the parameters as follows:
- Number of training days: higher value than the reference value on the market
- Salary for people being hired: higher than for the current employees.
Our company does not have any other policy in place to increase the satisfaction of its employees,
other than giving them training (which it believes increases satisfaction). Although this seems
highly improbable, it is very often the case. The HR departments in Romania are rarely performing
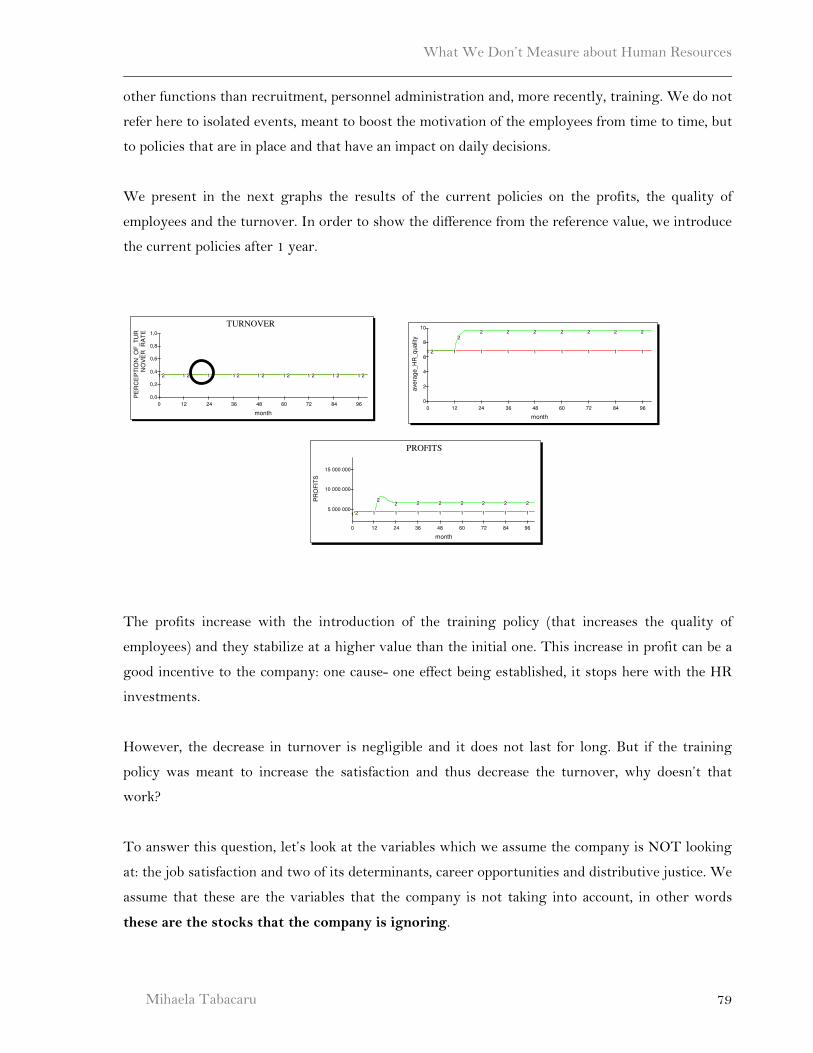
What We Don’t Measure about Human Resources
Mihaela Tabacaru 79
other functions than recruitment, personnel administration and, more recently, training. We do not
refer here to isolated events, meant to boost the motivation of the employees from time to time, but
to policies that are in place and that have an impact on daily decisions.
We present in the next graphs the results of the current policies on the profits, the quality of
employees and the turnover. In order to show the difference from the reference value, we introduce
the current policies after 1 year.
The profits increase with the introduction of the training policy (that increases the quality of
employees) and they stabilize at a higher value than the initial one. This increase in profit can be a
good incentive to the company: one cause- one effect being established, it stops here with the HR
investments.
However, the decrease in turnover is negligible and it does not last for long. But if the training
policy was meant to increase the satisfaction and thus decrease the turnover, why doesn’t that
work?
To answer this question, let’s look at the variables which we assume the company is NOT looking
at: the job satisfaction and two of its determinants, career opportunities and distributive justice. We
assume that these are the variables that the company is not taking into account, in other words
these are the stocks that the company is ignoring.
monthavera
ge_H
R_qualit
y0 12 24 36 48 60 72 84 96
0
2
4
6
8
10
1 2 1
2
1
2
1
2
1
2
1
2
1
2
1
2
1
2
TURNOVER
month
PE
RC
EP
TIO
N_O
F_T
UR
NO
VE
R_R
AT
E
0 12 24 36 48 60 72 84 96
0,0
0,2
0,4
0,6
0,8
1,0
1 2 1 2 1 2 1 2 1 2 1 2 1 2 1 2 1 2
PROFITS
month
PR
OF
ITS
0 12 24 36 48 60 72 84 96
5 000 000
10 000 000
15 000 000
1 2 1
2
1
2
1
2
1
2
1
2
1
2
1
2
1
2
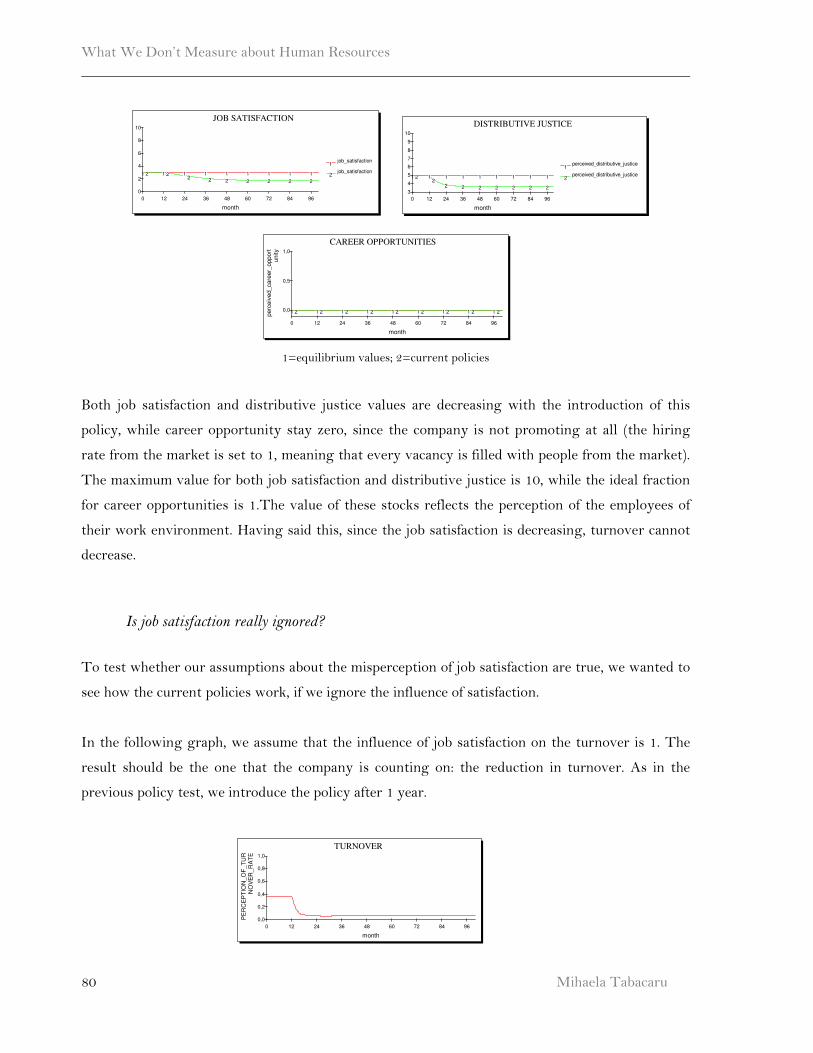
What We Don’t Measure about Human Resources
Mihaela Tabacaru
80
1=equilibrium values; 2=current policies
Both job satisfaction and distributive justice values are decreasing with the introduction of this
policy, while career opportunity stay zero, since the company is not promoting at all (the hiring
rate from the market is set to 1, meaning that every vacancy is filled with people from the market).
The maximum value for both job satisfaction and distributive justice is 10, while the ideal fraction
for career opportunities is 1.The value of these stocks reflects the perception of the employees of
their work environment. Having said this, since the job satisfaction is decreasing, turnover cannot
decrease.
Is job satisfaction really ignored?
To test whether our assumptions about the misperception of job satisfaction are true, we wanted to
see how the current policies work, if we ignore the influence of satisfaction.
In the following graph, we assume that the influence of job satisfaction on the turnover is 1. The
result should be the one that the company is counting on: the reduction in turnover. As in the
previous policy test, we introduce the policy after 1 year.
JOB SATISFACTION
month
job_satisfaction1
job_satisfaction2
0 12 24 36 48 60 72 84 96
0
2
4
6
8
10
1 2 1 2 12
12
1
2
1
2
1
2
1
2
1
2
DISTRIBUTIVE JUSTICE
month
perceived_distributive_justice1
perceived_distributive_justice2
0 12 24 36 48 60 72 84 96
3
4
5
6
7
8
9
10
1 2 12
1
2
1
2
1
2
1
2
1
2
1
2
1
2
CAREER OPPORTUNITIES
month
perc
eiv
ed_care
er_
opport
unity
0 12 24 36 48 60 72 84 96
0,0
0,5
1,0
1 2 1 2 1 2 1 2 1 2 1 2 1 2 1 2 1 2
TURNOVER
month
PE
RC
EP
TIO
N_O
F_T
UR
NO
VE
R_R
AT
E
0 12 24 36 48 60 72 84 96
0,0
0,2
0,4
0,6
0,8
1,0
What We Don’t Measure about Human Resources
Mihaela Tabacaru 81
We see that the graph reproduces what should happen in the system if the current mental model of
managers were right: the turnover decreases considerably, which is exactly what the company
wants. Unfortunately, this is not what is happening in the real world, and we will try to figure out
policies that decrease the turnover AND take into consideration the job satisfaction and its
determinants.
We have performed a number of policy analyses; we will not present all of them here. Rather, we
chose to present the ones that are most counterintuitive and show that investing in only one factor
that determines the job satisfaction does not yield as good results (it even yields worse results) as
investing in all of the determinants at the same time.
Alternatives to the “Buy” policy
Policy 1: promote
A first policy we want to test addresses the career opportunity variable as a precedent of job
satisfaction. The current policy is that all the vacancies are filled in with people from the market,
and there are practically no promotions in place, but they are not communicated on an
organizational scale.
Having a promotion policy does not necessarily mean that the company has to fill in all vacancies
with internal candidates (Holton & Naquin, 2004). Promotion makes employees feel that there is
another reward for their performance other than the pecuniary one. It shows that the company
gives them a chance to prove their KSA and compete with the outside candidates. A promotion
system does not mean that only internal candidates are considered. For these reasons, we defined
an ideal promotion rate of 60% of the candidates. We recognize that this may not be true at all
times in the company, depending on the stage it is in, but we assumed the company to be in stable
stage of its life, so we could focus on the HR mechanisms involved.
There are two parameters we can change in this policy: the fraction of people hired from the
market, and the communication of promotions. The communication of promotions accounts for the
importance of people knowing that promotions happen, and this communication can be done either
by naming the persons promoted, or by communicating a percentage of promotions form the total
vacancies. In our case, we assume that our company communicates the percentage of promotions.
Having such a system in places entangles costs, and we acknowledged that point and modelled it.
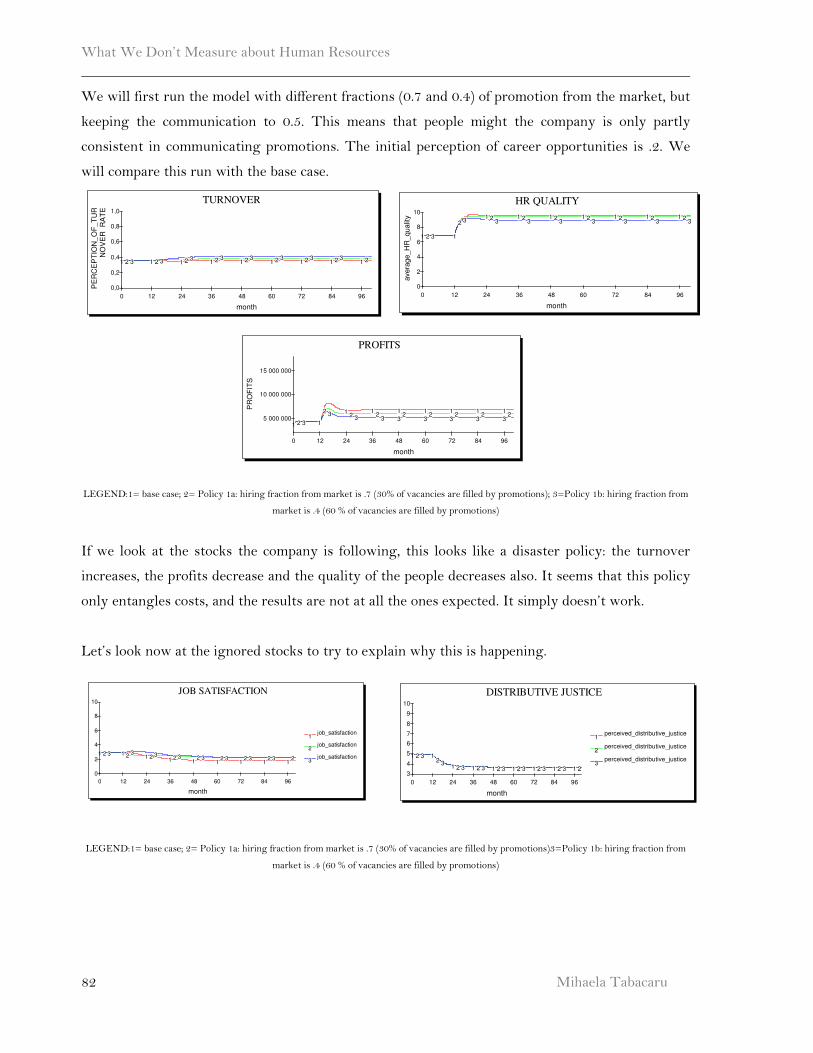
What We Don’t Measure about Human Resources
Mihaela Tabacaru
82
We will first run the model with different fractions (0.7 and 0.4) of promotion from the market, but
keeping the communication to 0.5. This means that people might the company is only partly
consistent in communicating promotions. The initial perception of career opportunities is .2. We
will compare this run with the base case.
LEGEND:1= base case; 2= Policy 1a: hiring fraction from market is .7 (30% of vacancies are filled by promotions); 3=Policy 1b: hiring fraction from
market is .4 (60 % of vacancies are filled by promotions)
If we look at the stocks the company is following, this looks like a disaster policy: the turnover
increases, the profits decrease and the quality of the people decreases also. It seems that this policy
only entangles costs, and the results are not at all the ones expected. It simply doesn’t work.
Let’s look now at the ignored stocks to try to explain why this is happening.
LEGEND:1= base case; 2= Policy 1a: hiring fraction from market is .7 (30% of vacancies are filled by promotions)3=Policy 1b: hiring fraction from
market is .4 (60 % of vacancies are filled by promotions)
TURNOVER
month
PE
RC
EP
TIO
N_
OF
_T
UR
NO
VE
R_
RA
TE
0 12 24 36 48 60 72 84 96
0,0
0,2
0,4
0,6
0,8
1,0
1 2 3 1 2 3 1 2 31 2 3
1 2 31 2 3
1 2 31 2 3
1 2
HR QUALITY
month
avera
ge_H
R_qualit
y
0 12 24 36 48 60 72 84 96
0
2
4
6
8
10
1 2 3 1
2 31 2
31 2
31 2
31 2
31 2
31 2
31 2
3
PROFITS
month
PR
OF
ITS
0 12 24 36 48 60 72 84 96
5 000 000
10 000 000
15 000 000
1 2 3 1
2 3 12 3
12
31
23
12
3
12
3
12
3
12
3
JOB SATISFACTION
month
job_satisfaction1
job_satisfaction2
job_satisfaction3
0 12 24 36 48 60 72 84 96
0
2
4
6
8
10
1 2 3 1 23
1 2 31 2 3
12 3
12 3
12 3
12 3
12
DISTRIBUTIVE JUSTICE
month
perceived_distributive_justice1
perceived_distributive_justice2
perceived_distributive_justice3
0 12 24 36 48 60 72 84 96
3
4
5
6
7
8
9
10
1 2 3 12 3
1 2 3 1 2 3 1 2 3 1 2 3 1 2 3 1 2 3 1 2
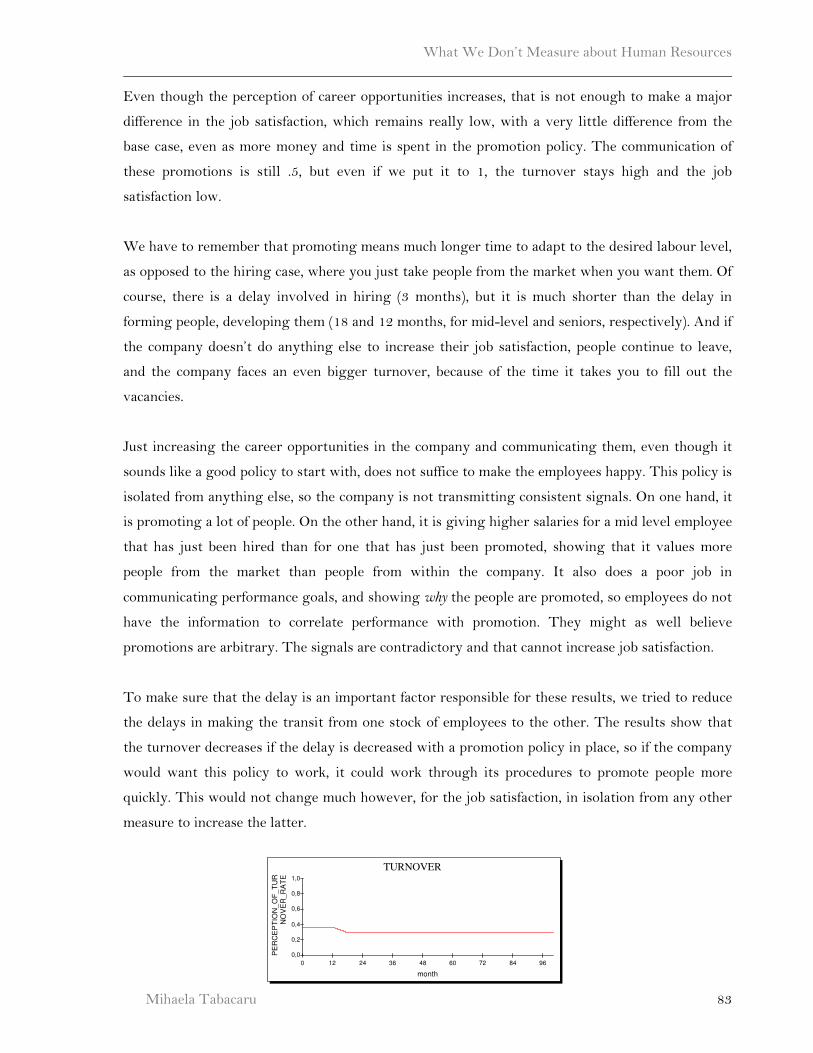
What We Don’t Measure about Human Resources
Mihaela Tabacaru 83
Even though the perception of career opportunities increases, that is not enough to make a major
difference in the job satisfaction, which remains really low, with a very little difference from the
base case, even as more money and time is spent in the promotion policy. The communication of
these promotions is still .5, but even if we put it to 1, the turnover stays high and the job
satisfaction low.
We have to remember that promoting means much longer time to adapt to the desired labour level,
as opposed to the hiring case, where you just take people from the market when you want them. Of
course, there is a delay involved in hiring (3 months), but it is much shorter than the delay in
forming people, developing them (18 and 12 months, for mid-level and seniors, respectively). And if
the company doesn’t do anything else to increase their job satisfaction, people continue to leave,
and the company faces an even bigger turnover, because of the time it takes you to fill out the
vacancies.
Just increasing the career opportunities in the company and communicating them, even though it
sounds like a good policy to start with, does not suffice to make the employees happy. This policy is
isolated from anything else, so the company is not transmitting consistent signals. On one hand, it
is promoting a lot of people. On the other hand, it is giving higher salaries for a mid level employee
that has just been hired than for one that has just been promoted, showing that it values more
people from the market than people from within the company. It also does a poor job in
communicating performance goals, and showing why the people are promoted, so employees do not
have the information to correlate performance with promotion. They might as well believe
promotions are arbitrary. The signals are contradictory and that cannot increase job satisfaction.
To make sure that the delay is an important factor responsible for these results, we tried to reduce
the delays in making the transit from one stock of employees to the other. The results show that
the turnover decreases if the delay is decreased with a promotion policy in place, so if the company
would want this policy to work, it could work through its procedures to promote people more
quickly. This would not change much however, for the job satisfaction, in isolation from any other
measure to increase the latter.
TURNOVER
month
PE
RC
EP
TIO
N_O
F_T
UR
NO
VE
R_R
AT
E
0 12 24 36 48 60 72 84 96
0,0
0,2
0,4
0,6
0,8
1,0
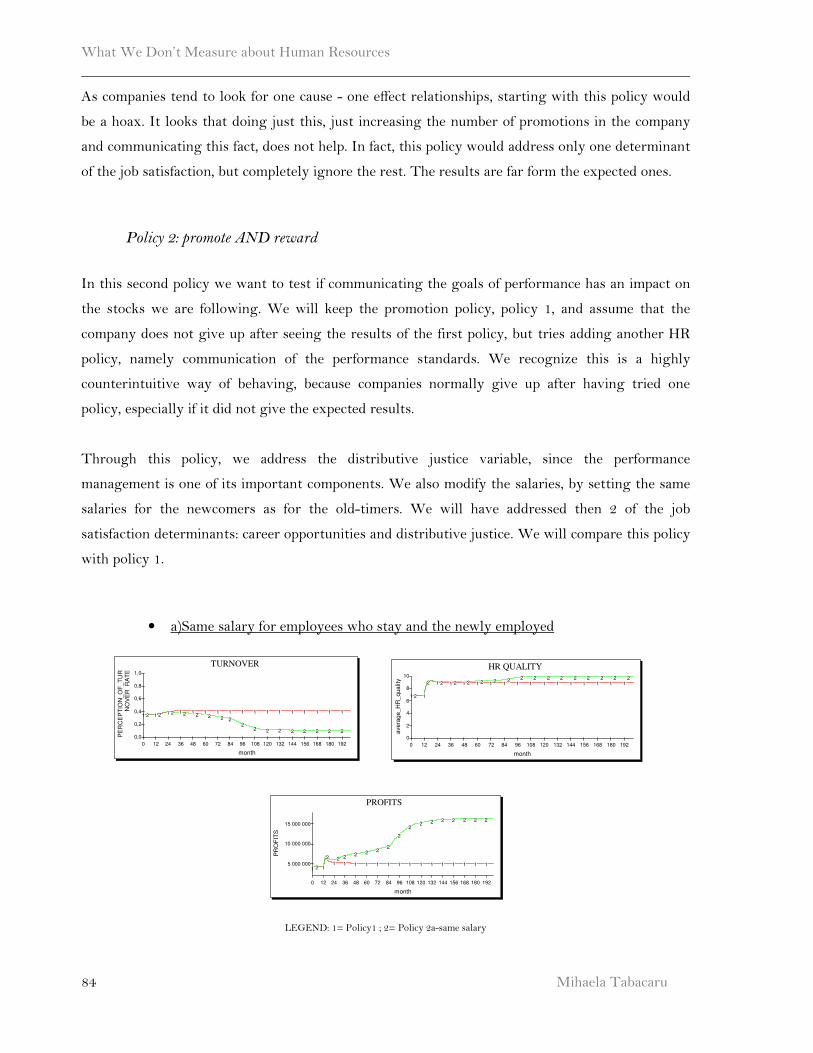
What We Don’t Measure about Human Resources
Mihaela Tabacaru
84
As companies tend to look for one cause - one effect relationships, starting with this policy would
be a hoax. It looks that doing just this, just increasing the number of promotions in the company
and communicating this fact, does not help. In fact, this policy would address only one determinant
of the job satisfaction, but completely ignore the rest. The results are far form the expected ones.
Policy 2: promote AND reward
In this second policy we want to test if communicating the goals of performance has an impact on
the stocks we are following. We will keep the promotion policy, policy 1, and assume that the
company does not give up after seeing the results of the first policy, but tries adding another HR
policy, namely communication of the performance standards. We recognize this is a highly
counterintuitive way of behaving, because companies normally give up after having tried one
policy, especially if it did not give the expected results.
Through this policy, we address the distributive justice variable, since the performance
management is one of its important components. We also modify the salaries, by setting the same
salaries for the newcomers as for the old-timers. We will have addressed then 2 of the job
satisfaction determinants: career opportunities and distributive justice. We will compare this policy
with policy 1.
• a)Same salary for employees who stay and the newly employed
LEGEND: 1= Policy1 ; 2= Policy 2a-same salary
TURNOVER
month
PE
RC
EP
TIO
N_O
F_T
UR
NO
VE
R_R
AT
E
0 12 24 36 48 60 72 84 96 108 120 132 144 156 168 180 192
0,0
0,2
0,4
0,6
0,8
1,0
1 2 1 2 1 2 1 2 12
12
1
2
1
2
1
2
1
2
1
2
1
2
1
2
1
2
1
2
1
2
1
2
HR QUALITY
month
avera
ge_H
R_qualit
y
0 12 24 36 48 60 72 84 96 108 120 132 144 156 168 180 192
0
2
4
6
8
10
1 2 1
2 1 2 1 2 1 2 1 2 1 2 12
12
12
12
12
12
12
12
12
12
PROFITS
month
PR
OF
ITS
0 12 24 36 48 60 72 84 96 108 120 132 144 156 168 180 192
5 000 000
10 000 000
15 000 000
1 2 1
21
21
2
1
2
1
2
1
2
1
2
1
2
1
2
1
2
1
2
1
2
1
2
1
2
1
2
1
2
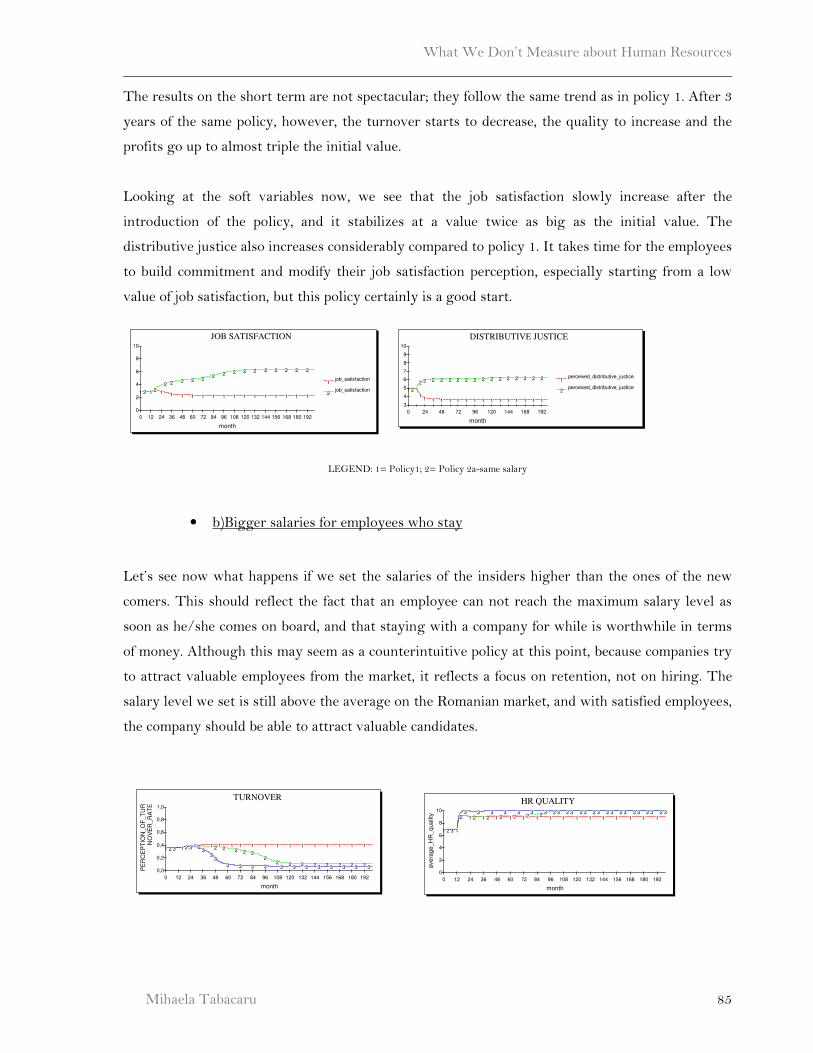
What We Don’t Measure about Human Resources
Mihaela Tabacaru 85
The results on the short term are not spectacular; they follow the same trend as in policy 1. After 3
years of the same policy, however, the turnover starts to decrease, the quality to increase and the
profits go up to almost triple the initial value.
Looking at the soft variables now, we see that the job satisfaction slowly increase after the
introduction of the policy, and it stabilizes at a value twice as big as the initial value. The
distributive justice also increases considerably compared to policy 1. It takes time for the employees
to build commitment and modify their job satisfaction perception, especially starting from a low
value of job satisfaction, but this policy certainly is a good start.
LEGEND: 1= Policy1; 2= Policy 2a-same salary
• b)Bigger salaries for employees who stay
Let’s see now what happens if we set the salaries of the insiders higher than the ones of the new
comers. This should reflect the fact that an employee can not reach the maximum salary level as
soon as he/she comes on board, and that staying with a company for while is worthwhile in terms
of money. Although this may seem as a counterintuitive policy at this point, because companies try
to attract valuable employees from the market, it reflects a focus on retention, not on hiring. The
salary level we set is still above the average on the Romanian market, and with satisfied employees,
the company should be able to attract valuable candidates.
JOB SATISFACTION
month
job_satisfaction1
job_satisfaction2
0 12 24 36 48 60 72 84 96 108 120 132 144 156 168 180 192
0
2
4
6
8
10
1 2 1 2 1
2
1
2
1
2
1
2
1
2
1
2
1
2
1
2
1
2
1
2
1
2
1
2
1
2
1
2
1
2
DISTRIBUTIVE JUSTICE
month
perceived_distributive_justice1
perceived_distributive_justice2
0 24 48 72 96 120 144 168 192
3
4
5
6
7
8
9
10
1 21
2
1
2
1
2
1
2
1
2
1
2
1
2
1
2
1
2
1
2
1
2
1
2
1
2
1
2
1
2
1
2
TURNOVER
month
PE
RC
EP
TIO
N_O
F_T
UR
NO
VE
R_R
AT
E
0 12 24 36 48 60 72 84 96 108 120 132 144 156 168 180 192
0,0
0,2
0,4
0,6
0,8
1,0
1 2 3 1 2 3 1 23
1 2
3
12
3
12
3
1
2
3
1
2
3
1
2
3
1
23
1
23
1
23
1
2 3
1
2 3
1
2 3
1
2 3
1
2 3
HR QUALITY
month
avera
ge_H
R_qualit
y
0 12 24 36 48 60 72 84 96 108 120 132 144 156 168 180 192
0
2
4
6
8
10
1 2 3 1
23
1 23
1 23
1 23
1 23
1 23
12 3
12 3
12 3
12 3
12 3
12 3
12 3
12 3
12 3
12 3
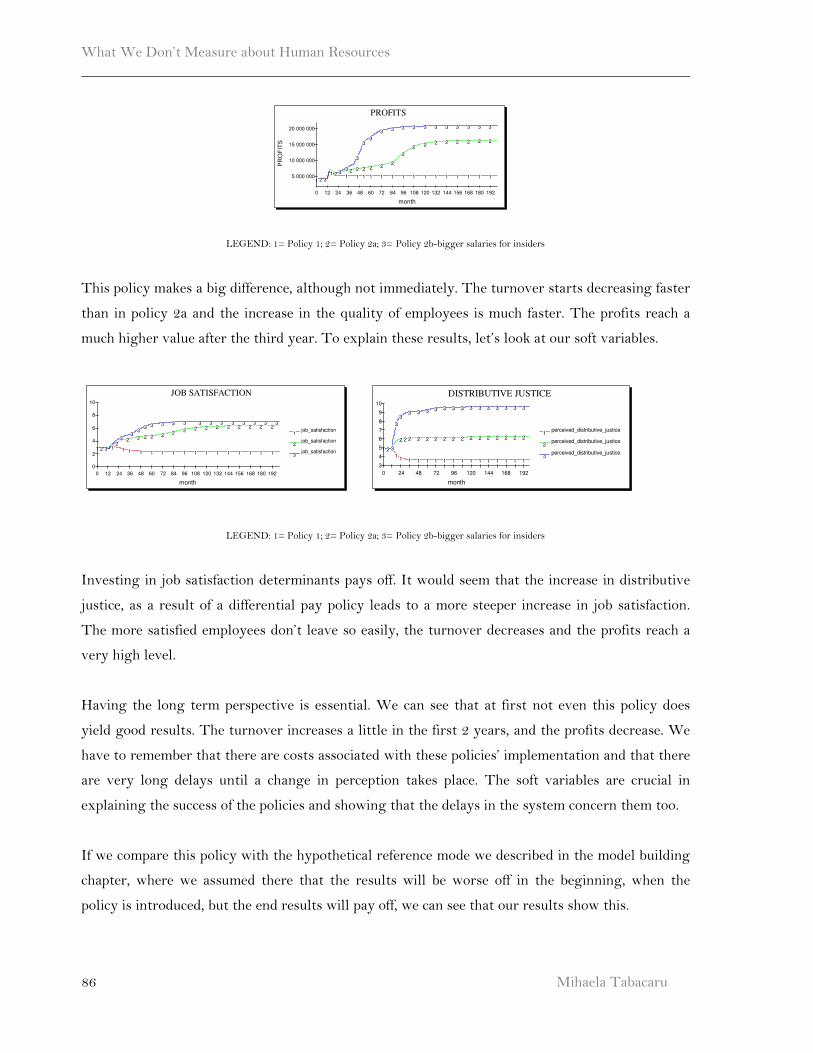
What We Don’t Measure about Human Resources
Mihaela Tabacaru
86
LEGEND: 1= Policy 1; 2= Policy 2a; 3= Policy 2b-bigger salaries for insiders
This policy makes a big difference, although not immediately. The turnover starts decreasing faster
than in policy 2a and the increase in the quality of employees is much faster. The profits reach a
much higher value after the third year. To explain these results, let’s look at our soft variables.
LEGEND: 1= Policy 1; 2= Policy 2a; 3= Policy 2b-bigger salaries for insiders
Investing in job satisfaction determinants pays off. It would seem that the increase in distributive
justice, as a result of a differential pay policy leads to a more steeper increase in job satisfaction.
The more satisfied employees don’t leave so easily, the turnover decreases and the profits reach a
very high level.
Having the long term perspective is essential. We can see that at first not even this policy does
yield good results. The turnover increases a little in the first 2 years, and the profits decrease. We
have to remember that there are costs associated with these policies’ implementation and that there
are very long delays until a change in perception takes place. The soft variables are crucial in
explaining the success of the policies and showing that the delays in the system concern them too.
If we compare this policy with the hypothetical reference mode we described in the model building
chapter, where we assumed there that the results will be worse off in the beginning, when the
policy is introduced, but the end results will pay off, we can see that our results show this.
PROFITS
month
PR
OF
ITS
0 12 24 36 48 60 72 84 96 108 120 132 144 156 168 180 192
5 000 000
10 000 000
15 000 000
20 000 000
1 2 31 2 3
123
1
2
3
1
2
3
1
2
3
1
2
3
1
2
3
1
2
3
1
2
3
1
2
3
1
2
3
1
2
3
1
2
3
1
2
3
1
2
3
1
2
3
JOB SATISFACTION
month
job_satisfaction1
job_satisfaction2
job_satisfaction3
0 12 24 36 48 60 72 84 96 108 120 132 144 156 168 180 192
0
2
4
6
8
10
1 2 3 12
3
1
23
1
2
3
1
2
3
1
2
3
1
2
3
1
2
3
1
2
3
1
23
1
23
1
23
1
23
1
23
1
23
1
23
1
23
DISTRIBUTIVE JUSTICE
month
perceived_distributive_justice1
perceived_distributive_justice2
perceived_distributive_justice3
0 24 48 72 96 120 144 168 192
3
4
5
6
7
8
9
10
1 2 3
1
2
3
1
2
3
1
2
3
1
2
3
1
2
3
1
2
3
1
2
3
1
2
3
1
2
3
1
2
3
1
2
3
1
2
3
1
2
3
1
2
3
1
2
3
1
2
3
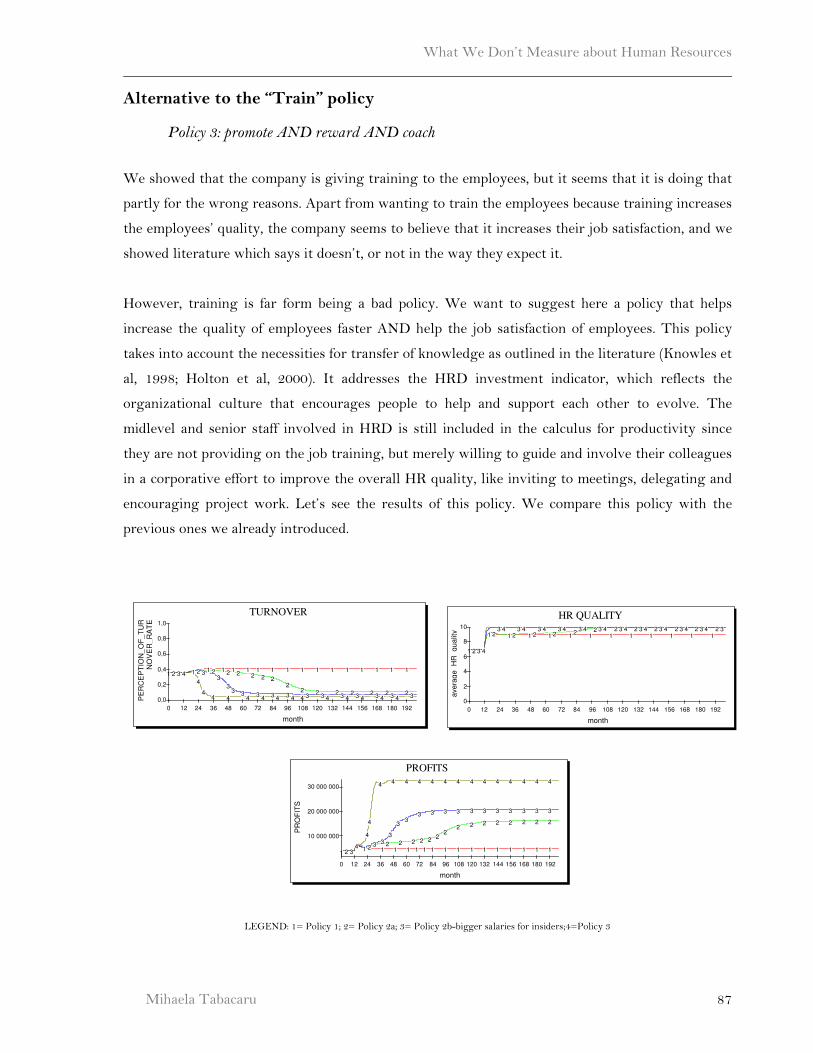
What We Don’t Measure about Human Resources
Mihaela Tabacaru 87
Alternative to the “Train” policy
Policy 3: promote AND reward AND coach
We showed that the company is giving training to the employees, but it seems that it is doing that
partly for the wrong reasons. Apart from wanting to train the employees because training increases
the employees’ quality, the company seems to believe that it increases their job satisfaction, and we
showed literature which says it doesn’t, or not in the way they expect it.
However, training is far form being a bad policy. We want to suggest here a policy that helps
increase the quality of employees faster AND help the job satisfaction of employees. This policy
takes into account the necessities for transfer of knowledge as outlined in the literature (Knowles et
al, 1998; Holton et al, 2000). It addresses the HRD investment indicator, which reflects the
organizational culture that encourages people to help and support each other to evolve. The
midlevel and senior staff involved in HRD is still included in the calculus for productivity since
they are not providing on the job training, but merely willing to guide and involve their colleagues
in a corporative effort to improve the overall HR quality, like inviting to meetings, delegating and
encouraging project work. Let’s see the results of this policy. We compare this policy with the
previous ones we already introduced.
LEGEND: 1= Policy 1; 2= Policy 2a; 3= Policy 2b-bigger salaries for insiders;4=Policy 3
TURNOVER
month
PE
RC
EP
TIO
N_
OF
_T
UR
NO
VE
R_
RA
TE
0 12 24 36 48 60 72 84 96 108 120 132 144 156 168 180 192
0,0
0,2
0,4
0,6
0,8
1,0
1 2 3 4 1 2 3
4
1 23
4
1 2
3
4
12
34
12
34
12
34
1
2
3 4
1
2
3 4
1
234
1
23 4
1
23 4
1
2 3 4
1
2 3 4
1
2 3 4
1
2 3
1
HR QUALITY
month
ave
rag
e_
HR
_q
ua
lity
0 12 24 36 48 60 72 84 96 108 120 132 144 156 168 180 192
0
2
4
6
8
10
1 2 3 4
1 23 4
1 23 4
1 23 4
1 23 4
12
3 41
2 3 41
2 3 41
2 3 41
2 3 41
2 3 41
2 3 41
2 3
PROFITS
month
PR
OF
ITS
0 12 24 36 48 60 72 84 96 108 120 132 144 156 168 180 192
10 000 000
20 000 000
30 000 000
1 2 34 1 2 3
4
123
4
12
3
4
1
2
3
4
1
2
3
4
1
2
3
4
1
2
3
4
1
2
3
4
1
2
3
4
1
2
3
4
1
2
3
4
1
2
3
4
1
2
3
4
1
2
3
4
1
2
3
4
1
2
3
4
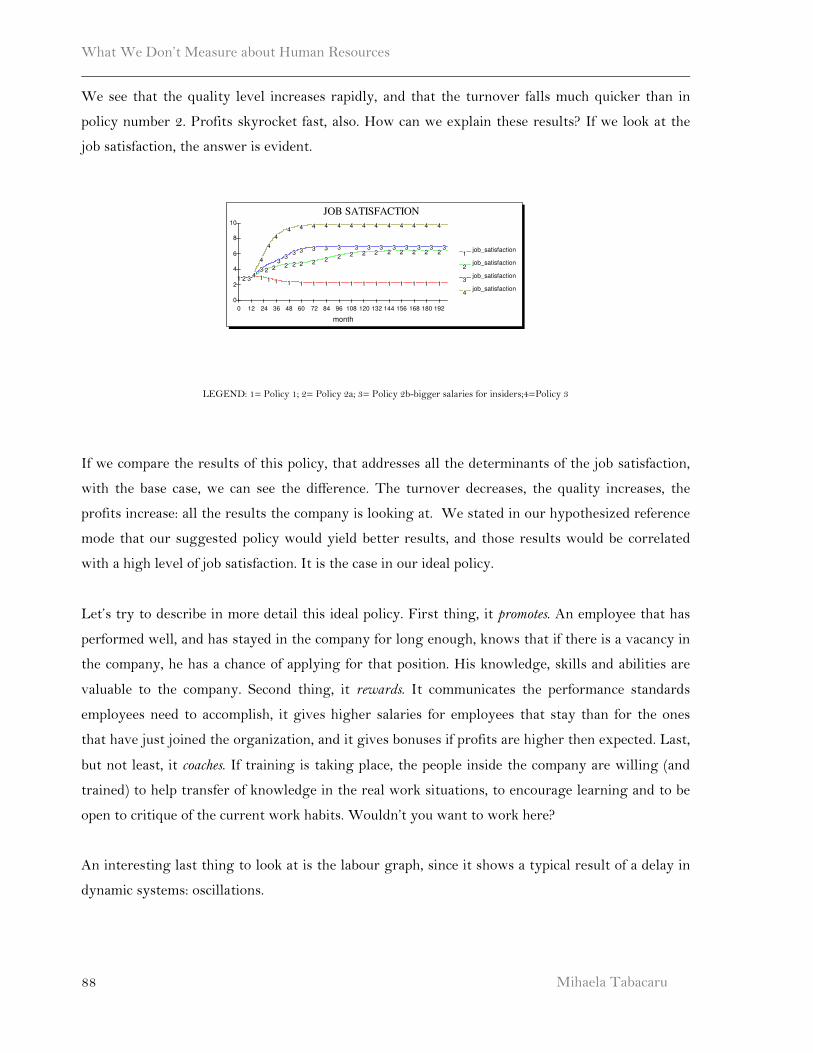
What We Don’t Measure about Human Resources
Mihaela Tabacaru
88
We see that the quality level increases rapidly, and that the turnover falls much quicker than in
policy number 2. Profits skyrocket fast, also. How can we explain these results? If we look at the
job satisfaction, the answer is evident.
LEGEND: 1= Policy 1; 2= Policy 2a; 3= Policy 2b-bigger salaries for insiders;4=Policy 3
If we compare the results of this policy, that addresses all the determinants of the job satisfaction,
with the base case, we can see the difference. The turnover decreases, the quality increases, the
profits increase: all the results the company is looking at. We stated in our hypothesized reference
mode that our suggested policy would yield better results, and those results would be correlated
with a high level of job satisfaction. It is the case in our ideal policy.
Let’s try to describe in more detail this ideal policy. First thing, it promotes. An employee that has
performed well, and has stayed in the company for long enough, knows that if there is a vacancy in
the company, he has a chance of applying for that position. His knowledge, skills and abilities are
valuable to the company. Second thing, it rewards. It communicates the performance standards
employees need to accomplish, it gives higher salaries for employees that stay than for the ones
that have just joined the organization, and it gives bonuses if profits are higher then expected. Last,
but not least, it coaches. If training is taking place, the people inside the company are willing (and
trained) to help transfer of knowledge in the real work situations, to encourage learning and to be
open to critique of the current work habits. Wouldn’t you want to work here?
An interesting last thing to look at is the labour graph, since it shows a typical result of a delay in
dynamic systems: oscillations.
JOB SATISFACTION
month
job_satisfaction1
job_satisfaction2
job_satisfaction3
job_satisfaction4
0 12 24 36 48 60 72 84 96 108 120 132 144 156 168 180 192
0
2
4
6
8
10
1 2 34 1
23
4
1
23
4
1
2
3
4
1
2
3
4
1
2
3
4
1
2
3
4
1
2
3
4
1
2
3
4
1
23
4
1
23
4
1
23
4
1
23
4
1
23
4
1
23
4
1
23
4
1
23
4
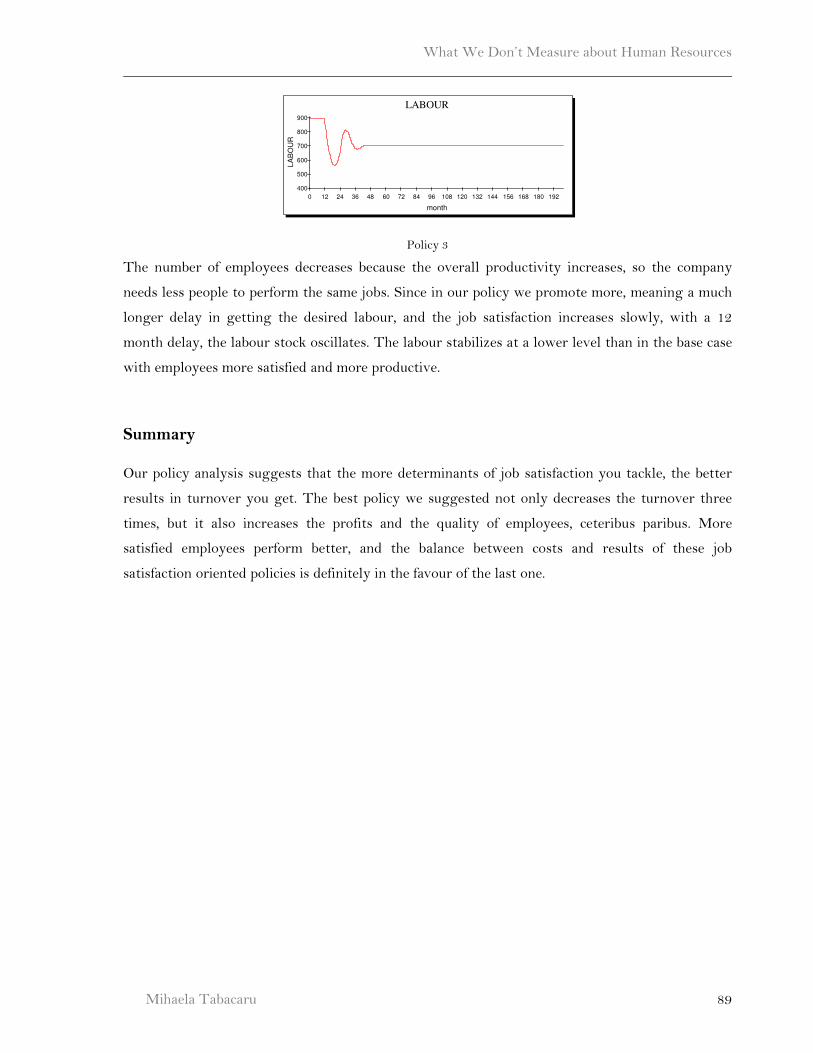
What We Don’t Measure about Human Resources
Mihaela Tabacaru 89
Policy 3
The number of employees decreases because the overall productivity increases, so the company
needs less people to perform the same jobs. Since in our policy we promote more, meaning a much
longer delay in getting the desired labour, and the job satisfaction increases slowly, with a 12
month delay, the labour stock oscillates. The labour stabilizes at a lower level than in the base case
with employees more satisfied and more productive.
Summary
Our policy analysis suggests that the more determinants of job satisfaction you tackle, the better
results in turnover you get. The best policy we suggested not only decreases the turnover three
times, but it also increases the profits and the quality of employees, ceteribus paribus. More
satisfied employees perform better, and the balance between costs and results of these job
satisfaction oriented policies is definitely in the favour of the last one.
LABOUR
month
LA
BO
UR
0 12 24 36 48 60 72 84 96 108 120 132 144 156 168 180 192
400
500
600
700
800
900
What We Don’t Measure about Human Resources
Mihaela Tabacaru
90
7. CONCLUSIONS
This thesis attempted a response to the retention of specialist problem in the banking and telecom
businesses in Romania and tried to find the best policy to address it. We built on literature from
both system dynamics and psychology domains, and we tried to show that the policy makers
misperceive the real causes of turnover and thus design inefficient policies to fight it. Job
satisfaction is one important component of turnover and we believe that the managers have a faulty
mental model or ignore the determinants of job satisfaction, and thus do not attend to them.
Smedslund (1963) has shown that people typically attend to the probability of an outcome given the
“present” cue only and that there is a bias towards correlating two instances simply by associating
the presence of the two, ignoring the probability of one or both being absent. There is reasonable
consensus (Weiner, 1985) that, in policy design, search for a cause is elicited by either an
unexpected event or by a failure in an otherwise familiar and successful task. In other words, policy
designers will only look for a cause if something goes wrong or unexpected, and then stop looking
when they will have found a first possible cause to explain that. A good example of this type of bias
is the companies’ focus on training, as a means to increase job satisfaction, even though the two are
not directly linked. We showed that job satisfaction has other important determinants too, and that
addressing all of them yields better results than designing policies just for one determinant.
The policy we deemed works best for retaining quality employees was the one that encouraged
training, but also the transfer of knowledge acquired through training, once the employee has come
back in his work environment. Our recommended policy also fostered promotion and showed the
employees that the knowledge they acquire while staying in the company is valued and rewarded.
Finally, we showed that an increase in the salary for the people that stay in the firm and the
communication of performance goals add to the employee’s feeling satisfied, and thus more
committed to stay in the company.
We did not re-invent the wheel. The “all inclusive” policy we recommend is in place in many
countries around the world and is part of the HR package of the most successful companies that
attach importance to their employees. It is not the case, unfortunately, for the companies in
Romania we investigated. The important contribution of this thesis, however, is that we managed
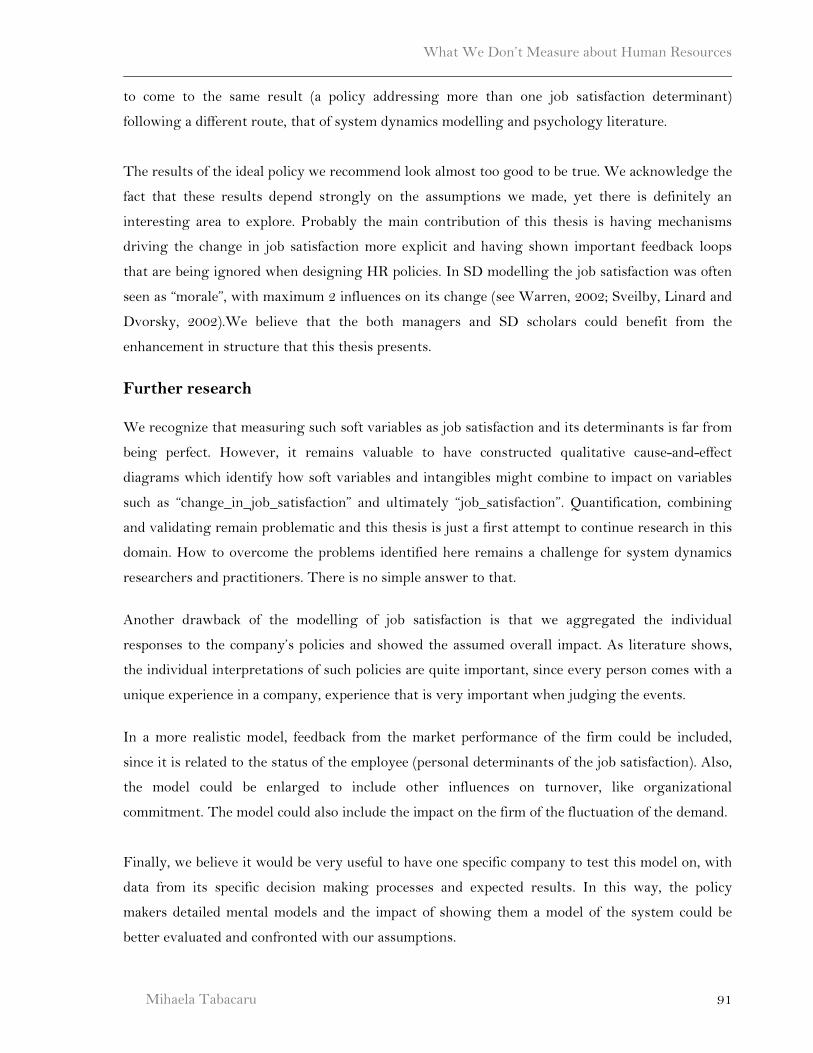
What We Don’t Measure about Human Resources
Mihaela Tabacaru 91
to come to the same result (a policy addressing more than one job satisfaction determinant)
following a different route, that of system dynamics modelling and psychology literature.
The results of the ideal policy we recommend look almost too good to be true. We acknowledge the
fact that these results depend strongly on the assumptions we made, yet there is definitely an
interesting area to explore. Probably the main contribution of this thesis is having mechanisms
driving the change in job satisfaction more explicit and having shown important feedback loops
that are being ignored when designing HR policies. In SD modelling the job satisfaction was often
seen as “morale”, with maximum 2 influences on its change (see Warren, 2002; Sveilby, Linard and
Dvorsky, 2002).We believe that the both managers and SD scholars could benefit from the
enhancement in structure that this thesis presents.
Further research
We recognize that measuring such soft variables as job satisfaction and its determinants is far from
being perfect. However, it remains valuable to have constructed qualitative cause-and-effect
diagrams which identify how soft variables and intangibles might combine to impact on variables
such as “change_in_job_satisfaction” and ultimately “job_satisfaction”. Quantification, combining
and validating remain problematic and this thesis is just a first attempt to continue research in this
domain. How to overcome the problems identified here remains a challenge for system dynamics
researchers and practitioners. There is no simple answer to that.
Another drawback of the modelling of job satisfaction is that we aggregated the individual
responses to the company’s policies and showed the assumed overall impact. As literature shows,
the individual interpretations of such policies are quite important, since every person comes with a
unique experience in a company, experience that is very important when judging the events.
In a more realistic model, feedback from the market performance of the firm could be included,
since it is related to the status of the employee (personal determinants of the job satisfaction). Also,
the model could be enlarged to include other influences on turnover, like organizational
commitment. The model could also include the impact on the firm of the fluctuation of the demand.
Finally, we believe it would be very useful to have one specific company to test this model on, with
data from its specific decision making processes and expected results. In this way, the policy
makers detailed mental models and the impact of showing them a model of the system could be
better evaluated and confronted with our assumptions.
What We Don’t Measure about Human Resources
Mihaela Tabacaru
92
References
AFD, DFID, GTZ/BMZ, KfW & World Bank (2004): Operationalizing Pro-Poor Growth -Case of
Romania , http://www.dfid.gov.uk/pubs/files/oppgromania.pdf
Aguirre, D. M. . Howell Jr. L. W, Kletter, D. B. &. Neilson, G.L. (2005). A Global Check-up:
Diagnosing the Health of Today’s Organizations. strategy + business , http://www.strategy-
business.com
Agho, A.O., Price , J.L, & Mueller ,C.W. (1993). Determinants of Employee Job Satisfaction : An
Empirical Test of Causal Model. Human Relations, 46 (8): 1007-1027
Ajzen,I. (1989). Attitude Structure and Behaviour. In A.R. Pratkanis, S.J. Breckler &
A.G.Greenwald (Eds), Attitude Structure and Function, (pp 241-274). Hillsdale, NJ: Erlbaum
Ajzen, I. (1991). The Theory of Planned Behavior. Organizational Behavior and Human Decision
Processes, 50: 179—211
Ajzen, I. (2001). Nature and Operation of Attitudes. Annual Review of Psychology, 52:27–58.
Azjen, I., & Fishbein M. (1980). Understanding Attitudes and Predicting Social Behaviour. Englewood-
Cliffs, NJ: Prentice Hall
Arnold, H.J. & Feldman,D.C. (1982) A Multivariate Analysis of the Determinants of Job Turnover,
Journal of Applied Psychology, 67:350-360.
Arnold, J. (1997). Managing Careers Into the 21st Century. London:Paul Chapman Publishing
Arnold, J.(2001).The Psychology of Careers. In C.Cooper and I. Robertson (Eds), Organizational
Psychology and Development (pp. 23-59). Chichester:Wiley
Anderson, N.H. (1971). Integration Theory and Attitude Change. Psychological Review, 78,171-206
Anderson, N.H. (1980). Integration Theory Applied to Cognitive Responses and Attitudes. In
R.E.Petty, T.M.Ostrom and T.C.Brocks (Eds), Cognitive responses in persuasion. New York:
Erlbaum
Baron, J. (1995). Thinking and Deciding, Cambridge: Cambridge University Press
Becker, H. S. (1960). Notes on the Concept of Commitment, American Journal of Sociology, 66: 32-42.
Bluedorn, A.C. (1982). A Unified Model of Turnover from Organizations, Human Relations, 35: 135-
153
Boudreau, J.W.(1983) Effects Of Employee Flows On Utility Analysis Of Human Resource
Productivity Improvement Programs. Journal of Applied Psychology, 68: 396-406
Boudreau, J.W.& Berger,C.J.(1985).Decisions Utility Analysis Applied to Employee Separations
and Acquisitions. Journal of Applied Psychology (Monograph),70 (3): 581-612
Brief , A.P.(1998), Attitudes In and Around Organizations, Thousand Oaks: SAGE Publications
What We Don’t Measure about Human Resources
Mihaela Tabacaru 93
Brief, A. P., Burke, M. J., & George, J. M., (1988) Should Negative Affectivity Remain an
Unmeasured Variable in The Study of Stress? Journal of Applied Psychology, 73: 193-198
Brinkerhoff, R.O.,& Dressler, D.E.(1990). Productivity Measurement. A Guide for Managers and
Evaluators, Newbury Park, CA: Sage Publications
Buchanan, B. (1974). Building Organizational Commitment: The Socialization of Managers To
Work Organizations. Administrative Science Quarterly, 19: 533-546.
Carmeli, A. (2005). The Relationship between Organizational Culture and Withdrawal Intentions
and Behavior. International Journal of Manpower 26 (2): 177-195
Curry, J.P.,Wakefield D.S; Price, J.L., & Mueller C.W.(1986). On the Causal Ordering of Job
Satisfaction and Organizational Commitment. The Academy of Management Journal, Vol. 29(4):
847-858
Dalton, D.R., Krackhardt, D.M., & Porter, L.W. (1981). Functional Turnover: An Empirical
Assesment, Journal of Applied Psychology, 66: 716-721
Davenport, T.O. (1999). Human Capital. What It Is and Why People Invest It. San Francisco,
CA:Jossey Bass Publishers
Dewhrist, H.D (1991). Career Patterns: Mobility, Specialization, and Related Career Issues. In
R.F.Morrison& J.Adams (Eds) Contemporary Career Development Issues
Donovan, J.J.(1998). Work Motivation. In N.Anderson, D.S.Ones, H.K.Sinangil & C.Viswesvaran
(Eds.) Handbook of industrial, work and organizational psychology, London: Sage Publications
Dyer, C. (1995). Beginning Research in Psychology, Oxford: Blackwell Publishers
Eagly,A.H. & Chaiken,S. (1993).The Psychology of Attitudes, Fort Worth, TX: Harcourt Brace
Jovanovich
Ferris, K. & Arranya, N.(1983), A Comparison of Two Organizational Commitment Scales,
Personnel Psychology, 29: 559-566
Fishbein, M. & Azjen, I. (1975) Beliefs, Attitudes, Intentions and Behaviour: An Introduction to Theory
and Research, Addison-Wesley Publishing.
Forrester, J. W. (1973). Confidence in Models of Social Behavior-With Emphasis on System
Dynamics Models., M. I. T. System Dynamics Group.
Forrester J.W. (1961) Industrial Dynamics. Cambridge (MA): Productivity Press
Forrester, J. W. (1992). Policies, Decisions, and Information Sources For Modeling. European
Journal of Operations Research, 59(1): 42-63.
Forrester, J.W., and Senge, P.M(1980).,Tests for Building Confidence in System Dynamics Models.
In Legasto, A.A. Jr.; Forrester, J.W. & Lyneis, T.M. (Eds) System Dynamics. New York:
Elsevier North-Holland
What We Don’t Measure about Human Resources
Mihaela Tabacaru
94
Freeman, R.B. (1978), Job Satisfaction as an Economic Variable. American Economic Association,
Quality of Working Life, 68 (2): 135-141
Furnham, A (1997). Psychology of Behaviour at Work, Hove East Sussex: Psychology Press
Greenberger, M., Crensen, M.A. & Crissy, B.L. (1976). Models in the Policy Process. New York:
Russell Sage Foundation.
Hauge,S. (2004). The development, illustration, and evaluation of a method for the application of synthetic
data experiments to analyze policy development in social systems, Master thesis, System Dynamics
group, University of Bergen
Hogg, M.A.& Vaughan, G.M (2002). Social Psychology, Harlow: Pearson Prentice Hall
Hollenbeck, J.R. & Williams, C.R. (1986), Turnover Functionality versus Turnover frequency: A
Note on Work Attitudes and Organizational Effectiveness, Journal of Applied Psychology, 71:
606- 611
Holton, E.F., Bates, R.A. & Ruona, W.E.A. (2000), Development of a Generalized Learning
Transfer System Inventory, Human Resources Development Quarterly,11(4):333- 360
Holton, E.F. & Naquin, S.S. (2004), New Metrics for Employee Development. Performance
Improvement Quarterly, 17(1): 56-80
Homer, J. B. (1985). Worker Burnout: A Dynamic Model with Implications for Prevention and
Control, System Dynamics Review, 11: 42-62
Hrebiniak, L. G. & Alutto, J. A. (1972). Personal and Role-Related Factors in the Development of
Organizational Commitment, Administrative Science Quarterly, 17: 563-573.
Hulin, C.L.(1991).Adaptation, Persistence, and Commitment in Organizations. In MD Dunnette&
L.M. Hough (Eds.), Handbook of industrial and organizational psychology (vol 2, pp.445-505),
Palo Alto, CA: Consulting Psychologists Press
Hulin, C.L., Roznowski, M., & Hachyia, D. (1985). Alternative Opportunities and Withdrawal
Decisions: Empirical and Theoretical Discrepancies and an Integration. Psychological Bulletin,
97: 233-250
Igalens, J. & Roussel, P. (1998) Méthodes de Recherche en Gestion des Ressources Humaines. Paris:
Economica
Judge, T. A., Thoresen, C. J., Bono, J. E., & Patton, G. K. (2001). The Job Satisfaction-Job
Performance Relationship: a Qualitative and Quantitative Review. Psychological Bulletin, 127:
376-407.
Katz,R.(1982). Managing Careers:The influence of Job and Group Longevities. In R.Katz (Ed.),
Career Issues in Human Resources Management. Englewood Cliffs,NJ: Prentice-Hall
What We Don’t Measure about Human Resources
Mihaela Tabacaru 95
Knowles, M., Holton, E. & Swanson, R. (1998), The Adult Learner (5th ed.), Houston, TX: Gulf
Publishing
Lamont, Julian, "Distributive Justice", The Stanford Encyclopedia of Philosophy (Fall 2003 Edition),
Edward N. Zalta(ed.), URL <http://plato.stanford.edu/archives/fall2003/entries/justice-
distributive/>.
Lawler,E.E.III.(1977).Reward systems. In J.R.Hackman & J.L.Suttle (Eds), Improving Life at Work
(pp. 163-226).Santa Monica,CA: Goodyear
Leonard,N.H., Beauvais,L.L. & Scholl R.W.(1999). Work Motivation: The Incorporation of Self-
Concept-Based Processes. Human Relations, Vol 52 (8): 969 - 998
Lichenstein, R.L. (1998). The Job Satisfaction and Retention of Physicians in Organized Settings:
A Literature Review. Med Care; 41: 139–179.
Locke, E. A.(1976). The Nature and Causes of Job Satisfaction, in Marvin Dunnette (Ed.), Handbook
of Industrial and Organizational Psychology (pp. 1297—1350), Rand McNally
Locke, E. A. (1984). Job satisfaction. In M. Gruneberg & T.Wall (Eds.) Social Psychology and
Organizational Behaviour. Chicester: John Wiley & Sons
London,M. (1985). Developing Managers. San Francisco, CA: Jossey-Bass
Lum, L., Kervin,J., Clark, K., Reid,F., & Sirola, W.(1998) Explaining Nursing Turnover Intent:Job
Satisfaction, Pay Satisfaction, or Organizational Commitment?, Journal of Organizational
Behaviour, 19(3):305-320
Maertz, C.P.,& Campion, M.A. (2004)- Profiles in quitting: Integrating process and content
turnover theory. Academy of Management Journal, 47: 566-582
Mathieu, J. E. & Zajac, D. M. (1990). A Review and Meta-Analysis of the Antecedents, Correlates
and Consequences of Organizational Commitment, Psychological Bulletin, 108: 171-194
Miclea, M.(1999). Psihologie Cognitiva. Iasi, Romania:Polirom
Morrison,R.F & Adams, J.- Eds (1991). Contemporary Career Development Issues. Hillsdale,
NJ:Lawrence Erlbaum Associates
Morrison, R.F.&Vosburg, R. (1987). Career Development for Engineers and Scientists. New York: Van
NostrandReinhold
Mowday, R. T., Porter, L. W., & Steers, R. M. (1982). Employee-Organizational Linkages:The
Psychology of Commitment, Absenteeism, and Turnover. New York: Academic Press
Motowidlo, S.J. (1983), Predicting Sales Turnover from Pay Satisfaction and Expectation, Journal
of Applied Psychology ,68: 484-489
Motowidlo, S.J., Borman, W.C. & Schmit, M.J. (1997) A theory of individual differences in task and
contextual performance. Human Performance, 10: 71-83.
What We Don’t Measure about Human Resources
Mihaela Tabacaru
96
Moxnes, E. (2000). Not Only the Tragedy of the Commons: Misperceptions of Feedback and
Policies for Sustainable Development. System Dynamics Review 16(4)
Moxnes, E. (2004). Misperceptions of Basic Dynamics: The Case of Renewable Resource
Management. System Dynamics Review 20 (2): 139-162
Neal, A., and Hesketh, B. (2001). Productivity in Organisations. In N. Anderson, D. Ones, H. K.,
Sinangil, & C. Viswesvaran (Eds) Vol 2 (pp 7-24). International Handbook of Work And
Organisational Psychology. London: Sage.
O’Reilly, C. A., Chatman, J., & Caldwell, D. F. (1991). People and Organizational Culture: A Profile
Comparison Approach to Assessing Person–Organization Fit. Academy of Management Journal,
34: 487–516
Organ, D.W.(1977) Intentional Vs Arousal Effects of Goal-Setting. Organizational Behavior and
Human Performance 18 (2): 378-389
Olson, J. M., & Zanna, M. P. (1993). Attitudes and Attitude Change. Annual Review of Psychology,
44: 117-154.
Ostroff, C., Kinicki, A. J., & Tamkins, M. (2003). Organizational Culture and Climate. In. W. C.
Borman, D. R. Ilgen, & R. J. Klimoski (Eds.), Comprehensive Handbook of Psychology. I/O
Psychology (Vol. 12, pp. 565–594). New York: Wiley
Patterson, M., M. West, R. Lawthom, & S. Nickell. 1997. Impact of People Management Practices
on Business Performance. Issues in People Management. London: Institute of Personnel and
Development
Peterson, D W. & Eberlein ,R.L..(1994). Reality Check: A Bridge between Systems Thinking and
System Dynamics. System Dynamics Review,10 (2-3): 159-174.
Pinder, C. C. (1998). Work Motivation in Organizational Behaviour. Upper Saddle River, NJ:
Prentice Hall.
Pfeffer, J. (1998) The Human Equation: Building Profits by Putting People First, Harvard Business
Press: Boston.
Price, JW and Mueller, CW (1986), Absenteism and Turnover of Hospital Employees, Greenwich,
Conn: JAI Press
Rice, R. W., McFarlin, D. B. & Bennett, D. E.(1989). Standards of Comparison and Job Satisfaction,
Journal of Applied Psychology 74: 591–598
Riketta, M.(2002). Attitudinal Organizational Commitment and Job Performance: A Meta-
Analysis. Journal of Organizational Behavior, 23: 257–266
Rogers, D. (1995). Choosing Performance Management: A Holistic Approach, CUPA Journal, 46
(2): 13-18
What We Don’t Measure about Human Resources
Mihaela Tabacaru 97
Rosenblatt, Z. & Sheaffer, Z. (2001). “Brain drain in declining organizations: Toward a research
agenda”. Journal of Organizational Behavior, 22, 1, 409-424
Rothwell, W.J. (1996). ASTD Models for Human Performance Improvement, American Society for
Training and Development (ASTD)
Schein,E.H. (1984). Culture as an Environment Context for Careers. Journal of Occupational
Behaviour, 5, 71-81
Schein, E.(1985). Organizational Culture and Leadership. San Franciso, CA: Jossey Bass
Schiffman, L G & Kanuk, L (1996) Consumer Behaviour, 6th edition, Englewood Cliffs, NJ: Prentice-
Hall International.
Schleicher, D.J., Watt, J.D., & Greguras, G.J.(2004). Reexamining the Job Satisfaction–
Performance Relationship: The Complexity of Attitudes. Journal of Applied Psychology ,
Vol. 89(1): 165–177
Sinclair,R.R., Leo, M.C., & Wright, C. (2005). Benefit System Effects on Employees’ Benefit
Knowledge, Use, and Organizational Commitment, Journal of Business and Psychology, Vol.
20(1)
Smith,E.E., Osherson,D.N., Rips,L.J. & Keane,M.(1988). Combining Prototypes: A Selective
Modification Model.Cognitive Science, 12: 485-527
Spector, P.E (1997). Job Satisfaction. Sage Publications Inc
Spooncer, F. (1992) Behavioural Studies for Marketing and Business, Leckhampton:Stanley Thornes
Staw, B.M. (1980). The Consequences of Turnover. Journal of Occupational Behaviour, 1: 253-273
Staw, B.M. & Ross, J.,(1985). Stability in the Midst of Change: A Dispositional Approach to Job
Attitudes, Journal of Applied Psychology, 70: 469 - 80.
Staw,B. M., Bell,N. E., & Clausen,J. A.(1986).The Dispositional Approach to Job Attitudes: A
Lifetime Longitudinal Test.American Science Quarterly, 31: 56-77
Steers, R.M., (1977). Antecedents and Outcomes of Organizational Commitment. Administrative
Science Quarterly, 22: 46-56.
Steers, R.M. & Porter, L.W. (1991). Motivation and Work . New York: McGraw-Hill
Sterman, J.D. (2000), Business Dynamics. Systems Thinking and Modelling for a Complex World. New
York: McGraw-Hill
Sturman, M.C., Trevor, C.O., Boudreau, J.W., & Gerhart, B. (2003). Is it Worth it to Win
the Talent War: Evaluating The Utility Of Performance-Based Pay. Personnel
Psychology, 56: 997-1035.
Sveiby, KE. 1997, The New Organizational Wealth: Managing and Measuring Knowledge-based Assets,
San Francisco: Berrett-Koehler.

What We Don’t Measure about Human Resources
Mihaela Tabacaru
98
Sveiby, KE, Linard, K. & Dvorsky,L. (2002), Building a Knowledge-Based Strategy :A System Dynamics
Model for Allocating Value Adding Capacity, paper presented at the System Dynamics Society
conference, Palermo
Swanson, R.A & Arnold, D.E. (1997) .The Purpose of HRD is to Improve Performance. In R.
Rowden (Ed.), pp 13-19, Workplace Learning: Debating Five Critical Questions of the Theory and
Practice, San Francisco: Jossey
Taber, T. D. & Alliger, G. M. (1995). A Task-Level Assessment of Job Satisfaction. Journal of
Organizational Behavior, 16: 101–121.
Vandenbosch, B & Higgins,C. (1996) Information Acquisition and Mental Models: An
Investigation into the Relationship Between Behaviour and Learning. Information
Systems Research. 7 (2): 198 - 214.
Veiga, J.F.(1983). Mobility influences during managerial career stages. Academy of Management
Journal, 26(1): 64-85
Waldman, D.(1994). The Contributions of Total Quality Management to a Theory of Work
Performance. Academy of Mangement Review, 19 (3) : 510-536
Warren, K, (2000). The Softer Side of Strategy Dynamics. Business Strategy Review, 11(1): 45-58
Warren, K. (2002). Competitive Strategy Dynamics. Chicester, England: John Wiley& Sons
Watson, D., & Clark, L. A. (1984). Negative Affectivity: The Disposition to Experience Aversive
Negative States. Psychological Bulletin, 96: 465-490.
Weiner, B.(1985). “Spontaneous” Causal Thinking. Psychological Bulletin, 97 (1) : 74-84
Westwood, R.(1992).Organizational Behaviour: Southeast Asian perspectives. Hong Kong: Longman.
Web resources
www.HR-Romania.ro, accessed on a monthly basis between August 2004 and May 2006.
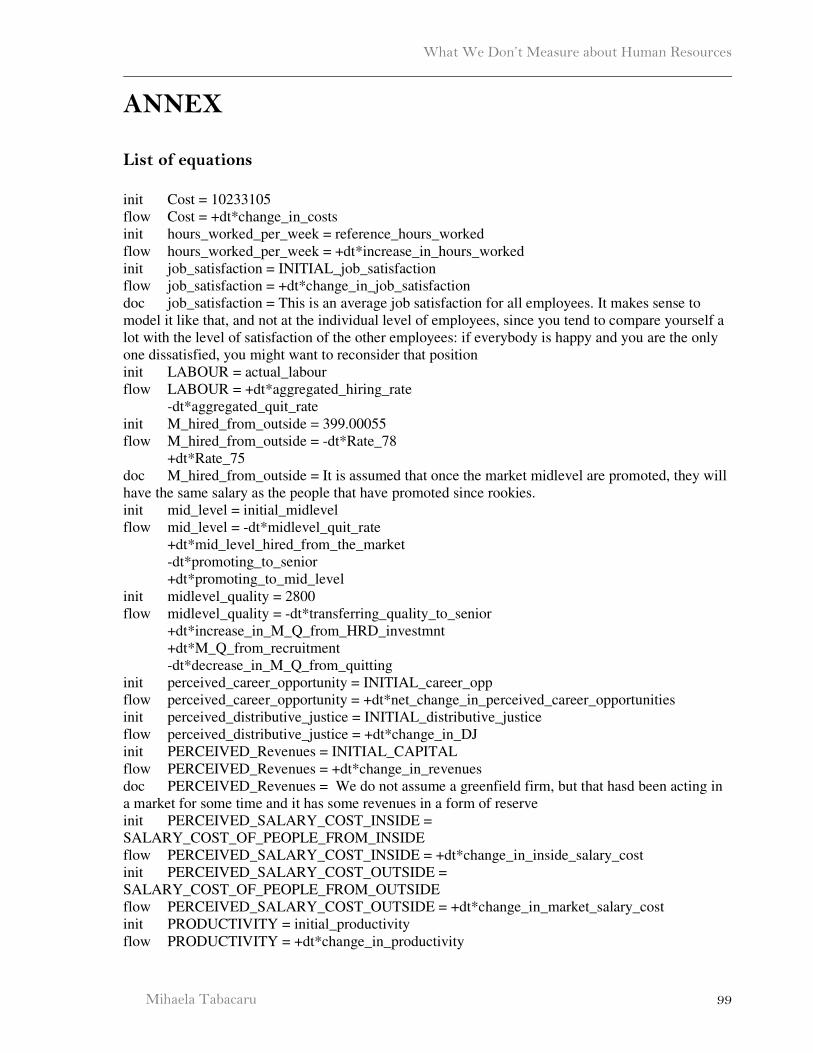
What We Don’t Measure about Human Resources
Mihaela Tabacaru 99
ANNEX
List of equations
init Cost = 10233105
flow Cost = +dt*change_in_costs
init hours_worked_per_week = reference_hours_worked
flow hours_worked_per_week = +dt*increase_in_hours_worked
init job_satisfaction = INITIAL_job_satisfaction
flow job_satisfaction = +dt*change_in_job_satisfaction
doc job_satisfaction = This is an average job satisfaction for all employees. It makes sense to
model it like that, and not at the individual level of employees, since you tend to compare yourself a
lot with the level of satisfaction of the other employees: if everybody is happy and you are the only
one dissatisfied, you might want to reconsider that position
init LABOUR = actual_labour
flow LABOUR = +dt*aggregated_hiring_rate
-dt*aggregated_quit_rate
init M_hired_from_outside = 399.00055
flow M_hired_from_outside = -dt*Rate_78
+dt*Rate_75
doc M_hired_from_outside = It is assumed that once the market midlevel are promoted, they will
have the same salary as the people that have promoted since rookies.
init mid_level = initial_midlevel
flow mid_level = -dt*midlevel_quit_rate
+dt*mid_level_hired_from_the_market
-dt*promoting_to_senior
+dt*promoting_to_mid_level
init midlevel_quality = 2800
flow midlevel_quality = -dt*transferring_quality_to_senior
+dt*increase_in_M_Q_from_HRD_investmnt
+dt*M_Q_from_recruitment
-dt*decrease_in_M_Q_from_quitting
init perceived_career_opportunity = INITIAL_career_opp
flow perceived_career_opportunity = +dt*net_change_in_perceived_career_opportunities
init perceived_distributive_justice = INITIAL_distributive_justice
flow perceived_distributive_justice = +dt*change_in_DJ
init PERCEIVED_Revenues = INITIAL_CAPITAL
flow PERCEIVED_Revenues = +dt*change_in_revenues
doc PERCEIVED_Revenues = We do not assume a greenfield firm, but that hasd been acting in
a market for some time and it has some revenues in a form of reserve
init PERCEIVED_SALARY_COST_INSIDE =
SALARY_COST_OF_PEOPLE_FROM_INSIDE
flow PERCEIVED_SALARY_COST_INSIDE = +dt*change_in_inside_salary_cost
init PERCEIVED_SALARY_COST_OUTSIDE =
SALARY_COST_OF_PEOPLE_FROM_OUTSIDE
flow PERCEIVED_SALARY_COST_OUTSIDE = +dt*change_in_market_salary_cost
init PRODUCTIVITY = initial_productivity
flow PRODUCTIVITY = +dt*change_in_productivity
What We Don’t Measure about Human Resources
Mihaela Tabacaru
100
init rookie_quality = 1200
flow rookie_quality = +dt*R_Q_from_recruitment
-dt*transferring_quality_to_midlevel
-dt*decrease_in_R_Q_from_quitting
+dt*increase_in_R_Q_from_HRD_investmnt
init rookies = initial_rookies
flow rookies = +dt*hiring_rookies
-dt*promoting_to_mid_level
-dt*rookie_quit_rate
init S_hired_from_the_outside = 299.78
flow S_hired_from_the_outside = -dt*Rate_79
+dt*Rate_76
init senior_quality = 2400
flow senior_quality = +dt*increase_in_S_Q_from_HRD_investmt
+dt*S_Q_from_recruitment
-dt*decrease_in_S_Q_from_quitting
init seniors = initial_seniors
flow seniors = +dt*senior_hired_from_the_market
-dt*senior_quit_rate
+dt*promoting_to_senior
init Total_hidden_training_cost = 0
flow Total_hidden_training_cost = +dt*change_in_hidden_cost
init Total_REAL_training_cost = 0
flow Total_REAL_training_cost = +dt*change_in_measured_cost
init vacancies = initial_vacancies
flow vacancies = +dt*vacancy_creation_rate
aux aggregated_hiring_rate =
hiring_rookies+mid_level_hired_from_the_market+senior_hired_from_the_market
aux aggregated_quit_rate = midlevel_quit_rate+rookie_quit_rate+senior_quit_rate
aux change_in_costs = (Calculated_cost-Cost)/time_to_perceive_costs
aux change_in_DJ = (indicated_DJ-perceived_distributive_justice)/DJ_adj_time
aux change_in_hidden_cost =
((Total_hidden_cost_ML+Total_hidden_cost_R+Total_hidden_cost_S)-
Total_hidden_training_cost)/time_to_accumulate
aux change_in_inside_salary_cost = (SALARY_COST_OF_PEOPLE_FROM_INSIDE-
PERCEIVED_SALARY_COST_INSIDE)/time_to_calculate_salary
aux change_in_job_satisfaction = (INDICATED_JS-
job_satisfaction)/time_to_perceive_a_change_in_JS
aux change_in_market_salary_cost = (SALARY_COST_OF_PEOPLE_FROM_OUTSIDE-
PERCEIVED_SALARY_COST_OUTSIDE)/time_to_calculate_salary
aux change_in_measured_cost =
((cost_of_HRD_training+Total_cost_R+Total_measured_cost_S+Total_cost_ML)-
Total_REAL_training_cost)/time_to_accumulate
aux change_in_productivity = Productivity_gap/time_to_adapt_productivity
aux change_in_revenues = (Calculated_revenues-
PERCEIVED_Revenues)/time_to_perceive_revenues
aux decrease_in_M_Q_from_quitting = average_quality_midlevel*midlevel_quit_rate
aux decrease_in_R_Q_from_quitting = rookie_quit_rate*average_quality_rookies
aux decrease_in_S_Q_from_quitting = senior_quit_rate*average_quality_seniors
aux hiring_rookies = rookie_target_hiring_rate/time_to_hire_and_integrate_newcomers
What We Don’t Measure about Human Resources
Mihaela Tabacaru 101
aux increase_in_hours_worked = (indicated_hours_worked-
hours_worked_per_week)/time_to_adjust_hours_per_week
aux increase_in_M_Q_from_HRD_investmnt =
indicated_M_quality/time_to_add_quality_by_training
aux increase_in_R_Q_from_HRD_investmnt =
indicated_R_quality/time_to_add_quality_by_training
doc increase_in_R_Q_from_HRD_investmnt = The influence of the HRD effort is not adding
quality points in itself, but mediates the transfer of knowledge, as Holton and Naquin (2004) show it
aux increase_in_S_Q_from_HRD_investmt =
indicated_S_quality/time_to_add_quality_by_training
aux M_Q_from_recruitment =
mid_level_hired_from_the_market*(IF(relative_perceived_salary_ratio> 1,
average_M_Q_from_hiring*1.25, average_M_Q_from_hiring))
doc M_Q_from_recruitment = THE QUALITY IF PEOPLE ATTRACTED IS INCREASED IF
THE SALARIES ARE HIGHER
aux mid_level_hired_from_the_market =
mid_level_target_hiring_from_market/time_to_hire_and_integrate_newcomers
aux midlevel_quit_rate = IF
((mid_level*normal_mid_level_quit_fraction*effect_of_difference_in_JS_on_quit_rate)<=mid_level
,(mid_level*normal_mid_level_quit_fraction*effect_of_difference_in_JS_on_quit_rate),(mid_level*
normal_mid_level_quit_fraction))
aux net_change_in_perceived_career_opportunities = (average_communicated_career_opp-
perceived_career_opportunity)/Memory_of_CO
aux promoting_to_mid_level =
((rookies*normal_rookie_promotion_rate+midlevel_promotion_target_from_staffing_needs)*effect_
of_quality_on_promotion_of_rookies)DIVZ1 time_to_promote_rookies
aux promoting_to_senior =
((mid_level*normal_midlevel_promotion_rate+senior_promotion_target_from_staffing_needs)*effe
ct_of_quality_on_promotion_of_mid_level) DIVZ1 time_to_promote_midlevel
aux R_Q_from_recruitment = hiring_rookies*(IF(relative_perceived_salary_ratio> 1,
average_R_Q_from_hiring*1.25, average_R_Q_from_hiring))
doc R_Q_from_recruitment = THE QUALITY oF PEOPLE ATTRACTED IS INCREASED IF
THE SALARIES ARE HIGHER
aux Rate_75 = mid_level_hired_from_the_market
aux Rate_76 = senior_hired_from_the_market
aux Rate_78 = (M_hired_from_outside DIVZ1
mid_level)*(midlevel_quit_rate+promoting_to_senior)
doc Rate_78 = it is assumed that probability of the people coming from the market to leave is the
same as for those coming from a long promotion chain; the number of market people is weighed
against the total number of employees
aux Rate_79 = (S_hired_from_the_outside DIVZ1 seniors)*senior_quit_rate
aux rookie_quit_rate = IF(
(rookies*normal_rookie_quit_fraction*effect_of_difference_in_JS_on_quit_rate)<=rookies,(rookies
*normal_rookie_quit_fraction*effect_of_difference_in_JS_on_quit_rate),(rookies*normal_rookie_q
uit_fraction))
aux S_Q_from_recruitment =
senior_hired_from_the_market*(IF(relative_perceived_salary_ratio> 1,
average_S_Q_from_hiring*1.25, average_S_Q_from_hiring))
doc S_Q_from_recruitment = THE QUALITY IF PEOPLE ATTRACTED IS INCREASED IF
THE SALARIES ARE HIGHER
What We Don’t Measure about Human Resources
Mihaela Tabacaru
102
aux senior_hired_from_the_market =
senior_target_hring_from_market/time_to_hire_and_integrate_newcomers
aux senior_quit_rate = IF
((seniors*normal_senior_attrition_factor*effect_of_difference_in_JS_on_quit_rate)<=seniors,(senior
s*normal_senior_attrition_factor*effect_of_difference_in_JS_on_quit_rate),
(seniors*normal_senior_attrition_factor))
aux transferring_quality_to_midlevel = promoting_to_mid_level*average_quality_rookies
aux transferring_quality_to_senior = promoting_to_senior*average_quality_midlevel
aux vacancy_creation_rate = (desired_vacancies-vacancies)/vacancy_adj_time
aux actual_labour = mid_level+rookies+seniors
aux actual_M_internal_training_days = M_days_in_internal_training*mid_level
aux actual_positionS_for_the_midelevel = (theoretical_positions_available_for_midlevel*((1-
fraction_of_target_hiring_from_the_market)/IDEAL_fraction_of_promoting)*fraction_of_promotio
ns_communicated)/theoretical_positions_available_for_midlevel
aux actual_positions_for_the_rookies = (theoretical_positions_available_for_rookie*((1-
fraction_of_target_hiring_from_the_market)/IDEAL_fraction_of_promoting)*fraction_of_promotio
ns_communicated)/theoretical_positions_available_for_rookie
aux Actual_productivity =
MAX((MIN((reference_productivity*effect_of_HR_quality_on_productivity*effect_of_JS_on_prod
uctivity*effect_of_hours_worked_on_productivity),maximum_productivity)),minimum_productivity
)
aux actual_R_internal_training_days = rookies*R_days_in_internal_training
aux actual_S_internal_training_days = seniors*S_days_in_internal_training
aux adding_M_Q_by_training =
midlevel_time_in_training*formal_training_efficiency*mid_level
aux adding_R_Q_by_training = rookie_time_in_training*formal_training_efficiency*rookies
aux adding_S_Q_by_trainiing = senior_time_in_training*formal_training_efficiency*seniors
aux adjustment_for_labour = (desired_labour-reported_labour)/average_time_to_adjust_labour
aux average_communicated_career_opp =
AVG(actual_positionS_for_the_midelevel,actual_positions_for_the_rookies)
aux average_HR_quality = AVG(average_quality_midlevel,
average_quality_rookies,average_quality_seniors)
aux average_ML_payroll_per_training_day =
(ML_monthly_salary/training_days_in_a_month)*mid_level
aux average_quality_midlevel = MIN((midlevel_quality/mid_level),maximum_quality)
aux average_quality_rookies = MIN((rookie_quality/rookies),maximum_quality)
aux average_quality_seniors = MIN((senior_quality/seniors),maximum_quality)
aux average_R_payroll_per_training_day =
(reference_R_inside_salary/training_days_in_a_month)*rookies
aux average_S_payroll_per_day = (S_montlhy_salary/training_days_in_a_month)*seniors
aux Calculated_cost =
recruitment_costs+taxes+(total_PERCEIVED_salary_cost)+cost_of_communicating_the_CO+Total
_REAL_training_cost+other_costs+cost_of_PM+production_cost
aux Calculated_revenues = indicated_sales*price_per_unit
aux cost_of_communicating_the_CO =
fraction_of_promotions_communicated*average_cost_of_communicating_CO
aux cost_of_HRD_training =
(mid_level_involved_in_HRD+seniors_involved_in_HRD)*reference_cost_of_training_for_HRD_a
ctivities*normalized_willingness_to_invest
What We Don’t Measure about Human Resources
Mihaela Tabacaru 103
aux cost_of_PM =
average_cost_of_communicating_PM*(effort_to_communicate_goals+communication_of_salary_m
ultiple)
aux delayed_total_effort_in_HRD = DELAYINF(total_EFFORT_staff_involved_in_HRD, 3,3)
doc delayed_total_effort_in_HRD = It takes a while for the employees to see the effort the
company has put into them and feel the difference.
aux desired_labour = desired_Production/reported_productivity
aux desired_vacancies =
MAX(0,((adjustment_for_labour+expected_attrition_rate)*time_to_hire_and_integrate_newcomers*
willingness_to_hire))
aux effect_of_career_opportunity_on_JS = GRAPH(perceived_career_opportunity DIVZ1
INITIAL_career_opp,0,0.25,[0.37,0.37,0.54,0.68,1,1.35,1.44,1.44"Min:0;Max:4;Zoom"])
aux effect_of_days_of_training_on_hours_worked =
GRAPH(normalized_global_days_of_training,0,0.2,[1,1,1,1,1,1,1.3,1.36"Min:0;Max:1.4"])
aux effect_of_difference_in_JS_on_quit_rate =
GRAPH(perceived_difference_between_reference_and_actual_JS/reference_diff_in_JS,0,0.25,[0.53,
0.58,0.6,0.68,0.99,1.54,3.44,4.52,4.85,4.958"Min:0;Max:5"])
aux effect_of_distributive_justice_on_JS =
GRAPH(normalized_diff_in_DJ,0,0.25,[1.31,1.3,1.28,1.19,1,0.61,0.47,0.44"Min:0;Max:2;Zoom"])
aux effect_of_employmt_opp_on_JS = GRAPH((PERCEPTION_OF_TURNOVER_RATE
DIVZ1
initial_perception_of_Turnover),0,0.25,[1.25,1.25,1.25,1.2,1,0.81,0.74,0.74"Min:0;Max:2;Zoom"])
doc effect_of_employmt_opp_on_JS = If employees leave, it is an indicator that there are
opportunities on the market, because nobody is layed off and finds himself unemployed.
In the equilibrium mode, the companies ignore what is going on the market, since their initial
perception has nothig to do wth the market value of turnover.
aux effect_of_hours_worked_on_productivity =
GRAPH(normalized_hours_worked,0.5,0.1,[0.84,0.85,0.87,0.88,0.93,1,1.09,1.18,1.18,1.18,1.18"Mi
n:0.5;Max:1.5;Zoom"])
doc effect_of_hours_worked_on_productivity = The longer you work, your energy level drops
and you are less effective
aux effect_of_HR_quality_on_productivity =
GRAPH(NORMALIZED_HR_quality,0,0.2,[0.66,0.66,0.68,0.75,0.84,1,1.28,1.39"Min:0;Max:1.5;Z
oom"])
aux effect_of_HR_quality_on_sales =
GRAPH(NORMALIZED_HR_quality,0,0.2,[0.82,0.82,0.85,0.86,0.92,0.99,1.22,1.25"Min:0;Max:1.4
"])
aux effect_of_HRD_effort_on_JS =
GRAPH(delayed_total_effort_in_HRD/reference_HRD_effort,0,0.2,[0.68,0.73,0.82,0.86,0.92,1,1.27
,1.37,1.37,1.37,1.4"Min:0;Max:2"])
doc effect_of_HRD_effort_on_JS = it is hypothesized that if people feel that they have been
invested in, they will feel more satisfied in their job. According to literature (Price & Mueller, 1986),
job mix and routinization are factors that influence the JS. These two factors are improved by
investing in the development of employees, not from classical training but from coaching and job
rotation and efforts.
aux effect_of_HRD_effort_on_PM =
GRAPH(delayed_total_effort_in_HRD/reference_HRD_effort,0,0.2,[0.61,0.61,0.61,0.61,0.73,1,1.35
,1.4"Min:0;Max:1.5;Zoom"])
What We Don’t Measure about Human Resources
Mihaela Tabacaru
104
aux effect_of_job_satisfaction_difference_on_sales =
GRAPH(normalized_JS,0,0.25,[1.42,1.42,1.42,1.31,1,0.79,0.65,0.6,0.54,0.53,0.51"Min:0;Max:1.5;Z
oom"])
aux effect_of_JS_on_productivity =
GRAPH(normalized_JS,0,0.2,[1.22,1.22,1.2,1.16,1.09,1,0.89,0.81,0.76,0.76"Min:0;Max:1.5"])
doc effect_of_JS_on_productivity = Job dissatisfaction yields stronger results on productivity
than satisfaction, since the dissatisfied people may display withdrawal behaviours
aux effect_of_perceived_salary_ratio_on_DJ =
GRAPH(relative_perceived_salary_ratio/reference_salary_ratio,0,0.25,[0.77,0.77,0.77,0.84,1,1.41,1.
49,1.49"Min:0;Max:1.5"])
aux effect_of_PM_indicator_on_DJ =
GRAPH(normalized_PM_indicator,0,0.25,[0.72,0.72,0.77,0.82,1,1.1,1.2,1.27,1.31,1.31"Min:0.2;Ma
x:1.5;Zoom"])
doc effect_of_PM_indicator_on_DJ = the effectiveness of communicating the goals:
COMMUNICATING WHAT IS EXPECTED OF THEM MAKES PEOPLE PERFORM BETTER
aux effect_of_prod_shortfall_on_hours_worked = GRAPH(Production_shortfall DIVZ1
reference_prod_shortfall,0,0.25,[1,1,1,1,1,1.11,1.27,1.33,1.33,1.33,1.33"Min:0;Max:2;Zoom"])
aux effect_of_quality_on_promotion_of_mid_level =
GRAPH(average_quality_midlevel/reference_quality_for_promoting_midlevel,0,0.25,[0.62,0.62,0.6
2,0.71,1,1.16,1.21,1.21"Min:0;Max:1.5"])
aux effect_of_quality_on_promotion_of_rookies =
GRAPH(average_quality_rookies/reference_quality_for_promoting_rookies,0,0.25,[0.66,0.66,0.67,0
.7,1,1.11,1.21,1.21"Min:0;Max:1.5"])
aux effect_of_total_effort_in_HRD_on_learning =
GRAPH(delayed_total_effort_in_HRD/reference_HRD_effort,0.6,0.2,[0.87,0.87,1,1.46,1.79,1.93,1.
98,2"Min:0.6;Max:2"])
aux effect_of_work_vs_pay_on_DJ =
GRAPH(normalized_WP_indicator,0,0.25,[2.11,2.11,1.96,1.61,1,0.87,0.76,0.76"Min:0;Max:3"])
aux expected_attrition_rate = DELAYINF(aggregated_quit_rate, 2,3)
aux external_cost_ML =
((outsourcing_cost+other_development_costs)*(outsourced_M_training_days*(mid_level/12)) )
doc external_cost_ML = The mid-levels are divided by 12, because the training takes place in
groups of 12 people usually, so the cost o the training day is not per person, but per group of 12
aux external_cost_R =
((outsourcing_cost+other_development_costs)*outsourced_R_training_days*(rookies/12))
doc external_cost_R = The rookies are divided by 12, because the training takes place in groups
of 12 people usually, so the cost of the training day is not per rookie, but per group of rookies
aux external_cost_S =
((outsourcing_cost+other_development_costs)*(S_outsourced_training_days*(seniors/12)) )
doc external_cost_S = The seniors are divided by 10, because the training takes place in groups of
10 people usually, so the cost o the training day is not per person, but per group of 10
aux hidden_cost_ML = average_ML_payroll_per_training_day*actual_M_internal_training_days
aux hidden_cost_R = actual_R_internal_training_days*average_R_payroll_per_training_day
aux hidden_cost_S = actual_S_internal_training_days*average_S_payroll_per_day
aux indicated_DJ =
MIN((INITIAL_distributive_justice*effect_of_PM_indicator_on_DJ*effect_of_work_vs_pay_on_D
J*effect_of_perceived_salary_ratio_on_DJ), maximum_DJ)
aux indicated_hours_worked =
MIN(limit_on_hours_worked_per_week,(hours_worked_per_week*effect_of_prod_shortfall_on_ho
urs_worked*effect_of_days_of_training_on_hours_worked))
What We Don’t Measure about Human Resources
Mihaela Tabacaru 105
aux INDICATED_JS =
MIN((INITIAL_job_satisfaction*effect_of_HRD_effort_on_JS*effect_of_employmt_opp_on_JS*ef
fect_of_distributive_justice_on_JS*effect_of_career_opportunity_on_JS),maximum_JS)
aux indicated_M_quality =
adding_M_Q_by_training*effect_of_total_effort_in_HRD_on_learning
aux indicated_R_quality =
adding_R_Q_by_training*effect_of_total_effort_in_HRD_on_learning
aux indicated_S_quality =
adding_S_Q_by_trainiing*effect_of_total_effort_in_HRD_on_learning
aux indicated_sales =
sales*effect_of_HR_quality_on_sales*effect_of_job_satisfaction_difference_on_sales
aux internal_cost_ML =
((mid_level/12)*M_days_in_internal_training)*(direct_costs_of_internal_learning_events+internal_t
raining_expenses)
doc internal_cost_ML = The mid-levels are divided by 12, because the training takes place in
groups of 12 people usually, so the cost o the training day is not per person, but per group of 12
aux internal_cost_R =
(R_days_in_internal_training*(rookies/12))*(direct_costs_of_internal_learning_events+internal_trai
ning_expenses)
doc internal_cost_R = The rookies are divided by 12, because the training takes place in groups of
12 people usually, so the cost o the training day is not per rookie, but per group of rookies
aux internal_cost_S =
((seniors/10)*S_days_in_internal_training)*(direct_costs_of_internal_learning_events+internal_train
ing_expenses)
doc internal_cost_S = The seniors are divided by 10, because the training takes place in groups of
10 people usually, so the cost o the training day is not per person, but per group of 10
aux M_days_in_internal_training =
normalized_willingness_to_invest*reference_M_days_in_internal_training
aux Memory_of_CO =
IF(average_communicated_career_opp>=perceived_career_opportunity,Time_to_increase_,Time_to
_decrease_)
aux mid_level_involved_in_HRD = mid_level*
MIN(fraction_of_midlevel_dedicated_to_HRD,maximum_fraction_of_midlevel_in_HRD)
aux mid_level_target_hiring_from_market =
mid_level_target_hiring_rate*fraction_of_target_hiring_from_the_market
aux mid_level_target_hiring_rate = (vacancies*desired_midlevel_fraction)*willingness_to_hire
aux midlevel_promotion_target_from_staffing_needs = (1-
fraction_of_target_hiring_from_the_market)*mid_level_target_hiring_rate
aux midlevel_time_in_training = M_days_in_internal_training+outsourced_M_training_days
aux normalized_diff_in_DJ =
perceived_difference_between_reference_and_actual_DJ/initial_diff_in_DJ
aux normalized_global_days_of_training = AVG(normalized_M_days_in_training,
normalized_R_days_in_training, normalized_S_days_in_training)
aux normalized_hours_worked = hours_worked_per_week/reference_hours_worked
aux NORMALIZED_HR_quality = average_HR_quality/reference_average_quality
aux normalized_JS =
perceived_difference_between_reference_and_actual_JS/reference_diff_in_JS
aux normalized_M_days_in_training =
M_days_in_internal_training/reference_M_days_in_internal_training
aux normalized_PM_indicator = PM_indicator/initial_PM_indicator
What We Don’t Measure about Human Resources
Mihaela Tabacaru
106
aux normalized_R_days_in_training =
R_days_in_internal_training/reference_R_days_in_internal_training
aux normalized_S_days_in_training =
S_days_in_internal_training/reference_senior_days_in_internal_training
aux normalized_willingness_to_invest = Willingness_to_invest_in_training DIVZ0
reference_willingness_to_invest_in_training
aux normalized_WP_indicator = work_vs_pay_indicator/reference_work_vs_pay_indicator
aux outsourced_M_training_days =
normalized_willingness_to_invest*reference_outsourced_M_training_days
aux outsourced_R_training_days =
normalized_willingness_to_invest*reference_outsourced_R_training_days
aux perceived_difference_between_reference_and_actual_DJ = maximum_DJ-
perceived_distributive_justice
aux perceived_difference_between_reference_and_actual_JS = maximum_JS-job_satisfaction
aux perception_of_salary_multiple = salary_multiple*communication_of_salary_multiple
doc perception_of_salary_multiple = what the company has communicated as profit related to the
effort put in by the employees;
aux PERCEPTION_OF_TURNOVER_RATE = DELAYINF(TURNOVER_RATE, 2,2)
aux PM_indicator = ((desired_Production*effort_to_communicate_goals)DIVZ1
desired_Production)*effect_of_HRD_effort_on_PM
doc PM_indicator = People should know what is expected from them. Every employee should be
able to say this phrase"I know what is expected from me and I receive constant feedback about my
work." This indicator includes 1.production goals, because
individual goals should be set in accordance with the bigger company goals, so the employee feels
that his work is important for the company
2. effort put in by the other employees to give feedback about performance (a skill that is trained)
aux PRODUCTION = MAX(0,(LABOUR*PRODUCTIVITY))
aux production_cost = PRODUCTION*cost_of_production_per_unit
aux Production_shortfall = MAX (0,(desired_Production-PRODUCTION))
aux Productivity_gap = Actual_productivity-PRODUCTIVITY
aux profit_per_employee = PROFITS/LABOUR
aux PROFITS = (PERCEIVED_Revenues-Cost)-CAPITAL_COST
doc PROFITS = PROFITS MINUS CAPITAL COSTS ARE TAXATED!!!
aux R_days_in_internal_training =
normalized_willingness_to_invest*reference_R_days_in_internal_training
aux ratio_of_hours_worked = DELAYINF(hours_worked_per_week, 3, 3) DIVZ0
reference_hours_worked
doc ratio_of_hours_worked = The overall impression of the hours worked in the past 3 months
aux recruitment_costs =
hiring_rookies*average_cost_to_recruit_a_rookie+mid_level_hired_from_the_market*average_cost
_of_midlevel_hired+senior_hired_from_the_market*average_cost_of_senior_hired
aux reference_prod_shortfall = desired_Production/20
aux relative_perceived_salary_ratio =
AVG((reference_R_inside_salary/reference_R_market_salary),(reference_S_inside_salary/reference
__S_outside_salary),(reference_M_insider_salary/reference_M_outside_salary))
aux relative_profit_per_employee = profit_per_employee/target_profit_per_employee
aux reported_labour = DELAYINF(LABOUR,2,3)
aux reported_productivity = DELAYINF(PRODUCTIVITY, 2,3)
aux rookie_target_hiring_rate = (vacancies*desired_rookie_fraction)*willingness_to_hire
aux rookie_time_in_training = outsourced_R_training_days+R_days_in_internal_training
What We Don’t Measure about Human Resources
Mihaela Tabacaru 107
aux S_days_in_internal_training =
normalized_willingness_to_invest*reference_senior_days_in_internal_training
aux S_outsourced_training_days =
normalized_willingness_to_invest*reference_outsourced_S_training_days
aux SALARY_COST_OF_PEOPLE_FROM_INSIDE =
(seniors*reference_S_inside_salary+mid_level*reference_M_insider_salary+rookies*reference_R_i
nside_salary)*salary_multiple
aux SALARY_COST_OF_PEOPLE_FROM_OUTSIDE =
(M_hired_from_outside*reference_M_outside_salary+reference__S_outside_salary*S_hired_from_t
he_outside)*salary_multiple
aux salary_multiple =
GRAPH(relative_profit_per_employee,0,1,[1,1,1.16,1.22,1.22"Min:0;Max:1.5;Zoom"])
doc salary_multiple = It shows that if the company has profit, the salaries will increase. If the
profit is low, the salaries remain the same.
aux sales = PRODUCTION
doc sales = In this simple model we assume that everything we produce is sold, thus ignoring the
competition and the demand from the market; we have, however a limit to growth:)
aux senior_promotion_target_from_staffing_needs = (1-
fraction_of_target_hiring_from_the_market)*senior_target_hiring_rate
aux senior_target_hiring_rate = vacancies*desired_senior_fraction*willingness_to_hire
aux senior_target_hring_from_market =
senior_target_hiring_rate*fraction_of_target_hiring_from_the_market
aux senior_time_in_training = S_days_in_internal_training+S_outsourced_training_days
aux seniors_involved_in_HRD =
seniors*MIN(fraction_of_seniors_dedicated_to_HRD,maximum_fraction_of_seniors_in_HRD)
aux taxes = PROFITS*tax_percentage
doc taxes = The tax in Romania is 16%
aux theoretical_positions_available_for_midlevel = senior_quit_rate
doc theoretical_positions_available_for_midlevel = The employees do not typically know the
positions available from the growth of the firm, but they know when people leave.
aux theoretical_positions_available_for_rookie = midlevel_quit_rate
doc theoretical_positions_available_for_rookie = The employees do not typically know the
positions available from the growth of the firm, but they know when people leave.
aux Total_cost_ML = external_cost_ML+internal_cost_ML
aux Total_cost_R = external_cost_R+internal_cost_R
aux total_EFFORT_staff_involved_in_HRD =
(mid_level_involved_in_HRD+seniors_involved_in_HRD)/(mid_level+seniors)
aux Total_hidden_cost_ML = hidden_cost_ML
aux Total_hidden_cost_R = hidden_cost_R
aux Total_hidden_cost_S = hidden_cost_S
aux Total_measured_cost_S = external_cost_S+internal_cost_S
aux total_PERCEIVED_salary_cost =
PERCEIVED_SALARY_COST_OUTSIDE+PERCEIVED_SALARY_COST_INSIDE
aux Total_training_cost = Total_hidden_training_cost+Total_REAL_training_cost
aux TURNOVER_RATE = aggregated_quit_rate/LABOUR
aux willingness_to_hire = IF (desired_Production>0, 1,0)
aux Willingness_to_invest_in_training =
(PERCEPTION_OF_TURNOVER_RATE/reference_market_turnover_rate)^sensitivity_to_turnover
doc Willingness_to_invest_in_training = It should function of training budget- they want to spend
it all every 12 months!
What We Don’t Measure about Human Resources
Mihaela Tabacaru
108
aux work_vs_pay_indicator = ratio_of_hours_worked DIVZ0 perception_of_salary_multiple
doc work_vs_pay_indicator = This variable is a mental calculus people do: what I have worked
extra versus what the company has payed me extra. If the company pays according to the effort put
in, then the indicator is good, otherwise not.
const average_cost_of_communicating_CO = 200
doc average_cost_of_communicating_CO = The typical way of communicating is a monthly
newsletter or any other monthly event the compnay might organize. It doesn't matter what fraction of
promotion you communicate, the cost is the same if you put 4 names or 100 in the same event.
const average_cost_of_communicating_PM = 400
const average_cost_of_midlevel_hired = 1500
const average_cost_of_senior_hired = 3000
const average_cost_to_recruit_a_rookie = 500
const average_M_Q_from_hiring = 7.0177
doc average_M_Q_from_hiring = 7.0177
const average_R_Q_from_hiring = 6
doc average_R_Q_from_hiring = Quality goes from 1 to 10
const average_S_Q_from_hiring = 8.00670
doc average_S_Q_from_hiring = 8.00670
const average_time_to_adjust_labour = 2
const CAPITAL_COST = 20000
const communication_of_salary_multiple = 1
doc communication_of_salary_multiple = it has value from 0.5 to 1, where 0 is no
communication and 1 is accurate communication
const cost_of_production_per_unit = 300
const desired_midlevel_fraction = 0.39
const desired_Production = 18393.1
doc desired_Production = 18393.1 ref
const desired_rookie_fraction = .45
const desired_senior_fraction = .16
const direct_costs_of_internal_learning_events = 1500/30
doc direct_costs_of_internal_learning_events = The salary of the internal trainer(per month, but
divided to fit a day's training)
const DJ_adj_time = 6
const effort_to_communicate_goals = .5
doc effort_to_communicate_goals = Goes from 0 to 1; 0 meaning that there is no effort at all, 1
that everything is done
const formal_training_efficiency = 2
const fraction_of_midlevel_dedicated_to_HRD = .05
const fraction_of_promotions_communicated = 0
doc fraction_of_promotions_communicated = The best way to build a constant perception of
career opportunities is to communicate them as such. People will hear that their colleagues are
promoted, but the information that the promotion is related to an overall program will not be there,
so it is not very valuable.
const fraction_of_seniors_dedicated_to_HRD = .05
const fraction_of_target_hiring_from_the_market = 1
const IDEAL_fraction_of_promoting = .6
const INITIAL_CAPITAL = 14275000
doc INITIAL_CAPITAL = 27314963
const INITIAL_career_opp = 0
const initial_diff_in_DJ = 5
What We Don’t Measure about Human Resources
Mihaela Tabacaru 109
const INITIAL_distributive_justice = 5
const INITIAL_job_satisfaction = 3
doc INITIAL_job_satisfaction = It goes from 1 to 10
const initial_midlevel = 400
const initial_perception_of_Turnover = .36634
const initial_PM_indicator = 0.5
const initial_productivity = 20.437682508504800947872464501108
const initial_rookies = 200
const initial_seniors = 300
const initial_vacancies = 989.12
const internal_training_expenses = 20
doc internal_training_expenses = The cost of food and training materials delivered to participants
const limit_on_hours_worked_per_week = 48*4
doc limit_on_hours_worked_per_week = This is the limit defined by the Romanian legislation is
48 hrs per week; we multiply by 4 weeks/month
const maximum_DJ = 10
const maximum_fraction_of_midlevel_in_HRD = .3
const maximum_fraction_of_seniors_in_HRD = .2
const maximum_JS = 10
const maximum_productivity = 25
const maximum_quality = 10
const minimum_productivity = 10
const ML_monthly_salary = 1500
const normal_mid_level_quit_fraction = .065
const normal_midlevel_promotion_rate = 0.001166
const normal_rookie_promotion_rate = 0.03
const normal_rookie_quit_fraction = .15
const normal_senior_attrition_factor = .035
const other_costs = 20000
const other_development_costs = 200
doc other_development_costs = It reffers to other costs like cost of renting training classes, and
catering for external events
const outsourcing_cost = 4320
doc outsourcing_cost = the average payment is 1200 euros per day of training
const price_per_unit = 1500
doc price_per_unit = We assume a highly priced widget.
const reference__S_outside_salary = 3000
const reference_average_quality = 7
const reference_cost_of_training_for_HRD_activities = 50
const reference_diff_in_JS = 3
const reference_hours_worked = 42*4.1
doc reference_hours_worked = The normal working hours is 40 per week, but everyone stays on
average 2 hours more each week without complaining. Times 4 / month
const reference_HRD_effort = .05
const reference_M_days_in_internal_training = 0.25
doc reference_M_days_in_internal_training = aprox 3 days per year
const reference_M_insider_salary = 1500
const reference_M_outside_salary = 1500
const reference_market_turnover_rate = .025
What We Don’t Measure about Human Resources
Mihaela Tabacaru
110
doc reference_market_turnover_rate = This is an average of a normal turnoevr rate of 3% per
year, which means 0.25 per month
const reference_outsourced_M_training_days = .30
doc reference_outsourced_M_training_days = 2 days per year per mid level employee, ref.16
const reference_outsourced_R_training_days = .16
doc reference_outsourced_R_training_days = The field study revealed 1 day of outsourced
training per year per rookie (the value given here is per month). The reality of the Romanian market
says that mid-level and seniors get most of the training in a company.ref .085
const reference_outsourced_S_training_days = .5
doc reference_outsourced_S_training_days = 3 days of training per year for senior level,ref.25
const reference_productivity = 26.892
const reference_quality_for_promoting_midlevel = 7
const reference_quality_for_promoting_rookies = 6
const reference_R_days_in_internal_training = 1
doc reference_R_days_in_internal_training = Rookies spend more time learning procedures and
firm specific knowledge, an average of 1 day per month
const reference_R_inside_salary = 800
const reference_R_market_salary = 800
const reference_S_inside_salary = 3000
const reference_salary_ratio = 1
const reference_senior_days_in_internal_training = .085
doc reference_senior_days_in_internal_training = 1 day per year
const reference_willingness_to_invest_in_training = 0
const reference_work_vs_pay_indicator = 1
const S_montlhy_salary = 3000
const sensitivity_to_turnover = .4
const target_profit_per_employee = 19264.18
const tax_percentage = .16
const time_to_accumulate = 1
const time_to_adapt_productivity = 1
const time_to_add_quality_by_training = 3
const time_to_adjust_hours_per_week = 1/8
doc time_to_adjust_hours_per_week = The adjustment to hours worked is done very fast, as the
request for more production is felt; this is the fast reaction lane!
const time_to_calculate_salary = 1
const Time_to_decrease_ = 7
doc Time_to_decrease_ = Employees will not remember the promotions for long; the process of
communicating them needs to be ongoing
const time_to_hire_and_integrate_newcomers = 3
const Time_to_increase_ = 3
doc Time_to_increase_ = People adapt to the promotions communicated in about 3 months
const time_to_perceive_a_change_in_JS = 12
const time_to_perceive_costs = 1
const time_to_perceive_revenues = 1
const time_to_promote_midlevel = 12
doc time_to_promote_midlevel = (12)
const time_to_promote_rookies = 18
doc time_to_promote_rookies = (18)
const training_days_in_a_month = 30
const vacancy_adj_time = 1