What radiologists need to know about the pulmonary...
11
Radiología. 2015;57(5):369---379 www.elsevier.es/rx UPDATE IN RADIOLOGY What radiologists need to know about the pulmonary---systemic flow ratio (Qp/Qs): What it is, how to calculate it, and what it is for C. Marín Rodríguez a,* , M.L. Sánchez Alegre b , Á. Lancharro Zapata a , J. Alarcón Rodríguez b a Radiología Pediátrica, Hospital General Universitario Gregorio Mara˜ nón, C/Máiquez 9, 28007 Madrid, Spain b Radiología Torácica, Hospital General Universitario Gregorio Mara˜ nón, C/Máiquez 9, 28007 Madrid, Spain Received 18 January 2015; accepted 28 April 2015 KEYWORDS Congenital heart disease; Cardiac magnetic resonance imaging; Cardiac function tests Abstract Cardiac magnetic resonance imaging (cMRI) provides abundant morphological and functional information in the study of congenital heart disease. The functional information includes pulmonary output and systemic output; the ratio between these two (Qp/Qs) is the shunt fraction. After birth, in normal conditions the pulmonary output is practically identical to the systemic output, so Qp/Qs = 1. In patients with ‘‘shunts’’ between the systemic and pulmonary circulations, the ratio changes, and the interpretation of these findings varies in function of the location of the shunt (intracardiac or extracardiac) and of the associated struc- tural or postsurgical changes. We review the concept of Qp/Qs; the methods to calculate it, with special emphasis on cMRI; and the meaning of the results obtained. We place special emphasis on the relevance of these findings depending on the underlying disease and the treatment the patient has undergone. © 2015 SERAM. Published by Elsevier España, S.L.U. All rights reserved. PALABRAS CLAVE Cardiopatías congénitas; Resonancia magnética cardiaca; Pruebas de función cardiaca Cuantificación de la circulación pulmonar y sistémica: Qp/Qs. Qué es, cómo se calcula y para qué sirve. Lo que el radiólogo debe saber Resumen La resonancia magnética cardiaca aporta abundante información morfológica y funcional al estudio de las cardiopatías congénitas. Entre los datos funcionales se encuen- tran el gasto pulmonar y el gasto sistémico; el cociente entre ambos es el cociente Qp/Qs. Después del nacimiento, en condiciones normales el gasto pulmonar y el sistémico son prácti- camente iguales, y el cociente Qp/Qs = 1. En los pacientes con cortocircuitos entre la circulación Please cite this article as: Marín Rodríguez C, Sánchez Alegre ML, Lancharro Zapata Á, Alarcón Rodríguez J. Cuantificación de la circulación pulmonar y sistémica: Qp/Qs. Qué es, cómo se calcula y para qué sirve. Lo que el radiólogo debe saber. Radiología. 2015;57:369---79. * Corresponding author. E-mail address: [email protected] (C. Marín Rodríguez). 2173-5107/© 2015 SERAM. Published by Elsevier España, S.L.U. All rights reserved. Documento descargado de http://www.elsevier.es el 11/02/2017. Copia para uso personal, se prohíbe la transmisión de este documento por cualquier medio o formato.
Transcript of What radiologists need to know about the pulmonary...
Radiología. 2015;57(5):369---379
www.elsevier.es/rx
UPDATE IN RADIOLOGY
What radiologists need to know about thepulmonary---systemic flow ratio (Qp/Qs): What it is,how to calculate it, and what it is for�
C. Marín Rodríguez a,∗, M.L. Sánchez Alegreb, Á. Lancharro Zapata a,J. Alarcón Rodríguezb
a Radiología Pediátrica, Hospital General Universitario Gregorio Maranón, C/Máiquez 9, 28007 Madrid, Spainb Radiología Torácica, Hospital General Universitario Gregorio Maranón, C/Máiquez 9, 28007 Madrid, Spain
Received 18 January 2015; accepted 28 April 2015
KEYWORDSCongenital heartdisease;Cardiac magneticresonance imaging;Cardiac function tests
Abstract Cardiac magnetic resonance imaging (cMRI) provides abundant morphological andfunctional information in the study of congenital heart disease. The functional informationincludes pulmonary output and systemic output; the ratio between these two (Qp/Qs) is theshunt fraction. After birth, in normal conditions the pulmonary output is practically identicalto the systemic output, so Qp/Qs = 1. In patients with ‘‘shunts’’ between the systemic andpulmonary circulations, the ratio changes, and the interpretation of these findings varies infunction of the location of the shunt (intracardiac or extracardiac) and of the associated struc-tural or postsurgical changes. We review the concept of Qp/Qs; the methods to calculate it, withspecial emphasis on cMRI; and the meaning of the results obtained. We place special emphasison the relevance of these findings depending on the underlying disease and the treatment thepatient has undergone.© 2015 SERAM. Published by Elsevier España, S.L.U. All rights reserved.
PALABRAS CLAVECardiopatíascongénitas;Resonanciamagnética cardiaca;Pruebas de funcióncardiaca
Cuantificación de la circulación pulmonar y sistémica: Qp/Qs. Qué es, cómo secalcula y para qué sirve. Lo que el radiólogo debe saber
Resumen La resonancia magnética cardiaca aporta abundante información morfológica yfuncional al estudio de las cardiopatías congénitas. Entre los datos funcionales se encuen-tran el gasto pulmonar y el gasto sistémico; el cociente entre ambos es el cociente Qp/Qs.Después del nacimiento, en condiciones normales el gasto pulmonar y el sistémico son prácti-camente iguales, y el cociente Qp/Qs = 1. En los pacientes con cortocircuitos entre la circulación
� Please cite this article as: Marín Rodríguez C, Sánchez Alegre ML, Lancharro Zapata Á, Alarcón Rodríguez J. Cuantificación de la circulaciónpulmonar y sistémica: Qp/Qs. Qué es, cómo se calcula y para qué sirve. Lo que el radiólogo debe saber. Radiología. 2015;57:369---79.
∗ Corresponding author.E-mail address: [email protected] (C. Marín Rodríguez).
2173-5107/© 2015 SERAM. Published by Elsevier España, S.L.U. All rights reserved.
Documento descargado de http://www.elsevier.es el 11/02/2017. Copia para uso personal, se prohíbe la transmisión de este documento por cualquier medio o formato.
370 C. Marín Rodríguez et al.
sistémica y la pulmonar este cociente se altera. Dependiendo de la localización del cortocir-cuito (intra o extracardiaco), y de las alteraciones estructurales o posquirúrgicas asociadas,la interpretación de los hallazgos es diferente. Revisamos el concepto de Qp/Qs, los méto-dos para calcularlo con especial énfasis en la RM, y el significado de los resultados obtenidos,haciendo hincapié en la relevancia de estos datos dependiendo de la patología de base y losprocedimientos terapéuticos que se hayan realizado al paciente.© 2015 SERAM. Publicado por Elsevier España, S.L.U. Todos los derechos reservados.
Introduction
Cardiac output (CO) can be defined as the volume pumpedby the heart per unit of time.1 It is made up by the systemicand pulmonary blood flows. There are small physiologicaldifferences between both flows for instance bronchial cir-culation, insignificant in practice and thus the ratio betweenboth equals 1. This is called the pulmonary---systemic ratioor Qp/Qs ratio. If >1 the pulmonary flow is greater thanthe systemic one, and the opposite is true if it is <1. Wereviewed the concept of Qp/Qs, how to calculate it, espe-cially through magnetic resonance (MR), the meaning of thefindings and its repercussions on the prognosis and manage-ment of patients.
Measuring the Qp/Qs ratio
The reference method from the beginning of the 20thcentury is Fick’s method1 consisting on measuring theconcentration of oxygen in blood samples obtained with acatheter at different points of the pulmonary and systemiccirculation after 10 min of breathing with oxygen at 100%. Itis calculated through the following formula:
Q (l/min) =
O2 Consumption (ml/min)Arteriovenous O2 Difference (ml/l)
This way it is possible to characterize the decrease in oxy-gen concentration as due to intrapulmonary or intracardiacshunts or due to hypoventilation or ventilation/perfusionimpairments. Although it implies making some physiologi-cal assumptions not fully correct --- above all that oxygenconsumption is homogeneous it is the standard modality bywhich all other modalities are measured. Other modalitiesare thermodilution2 or the measurement of dye dilution3
(indocyanine) based on variations or changes of concentra-tion of indicators proximal and distal to the shunt for themeasuring of shunts.4 They are invasive modalities of a lowsensitivity to measure small-sized shunts.
Image modalities to calculate the Qp/Qs
The first image modality used to calculate Qp/Qs wasnuclear medicine5,6 through the endovascular administra-tion of an isotope and the subsequent measurement of itsactivity. Although it measures the shunts relatively accurate
it contributes ionizing radiations not allowing the identifica-tion of the location of the shunt.
Echocardiography is the modality of choice for the ini-tial diagnosis of most cardiac shunts. It is innocuous andnon-invasive, and it allows a complete morphological studyof the heart. The use of Doppler is very well-known forthe quantification of shunts7---11 though the calculation ofQp/Qs through Doppler ultrasound has some limitations:the operator dependence typical of ultrasound studies andthe limitations of the acoustic window for an adequateassessment of the right ventricular outflow tract and thepulmonary trunk.
Cardiac magnetic resonance images (MRI) were first usedin the 1990s to estimate the Qp/Qs with the use of phasecontrast sequences. In addition to its excellent spatial andcontrast resolution and accuracy in calculating ventricularfunction, it is extremely good for the study of vascular flowboth for assessing gradients and stenosis and for calculatingQp/Qs.
Measuring Qp/Qs through an MRI
There are two methods to measure Qp/Qs through an MRI:Calculation of the CO through Simpson’s method. It deals
with obtaining the ventricular volumes along the cardiaccycle through cine-MRIs.12 If we know the telediastolic vol-ume (tdV), the telesystolic volume (tsV) and the heart rateit is possible to the calculate cardiac output easily:
CO = (tdV − tsV) × rate
The ratio between the right and left CO will correspondto the Qp/Qs ratio.
There are several setbacks inherent to this modality andthese are non-specific for the calculation of Qp/Qs: anatom-ical complexity for the accurate calculation of the rightventricle volumes or the inclusion of papillary muscles. Anaccurate calculation of the Qp/Qs through this modalityrequires the integrity of the four (4) ventricular valves. Fail-ure in any of the four will add the regurgitating volume tothe telediastolic one and will invalidate results. We needto bear in mind that tricuspid failure is common in patientswith right overload.
Calculation of the CO through phase contrast
sequences/images. Although its clinical use began atthe end of the 1980s13---15 it was first described in 1959 in
Documento descargado de http://www.elsevier.es el 11/02/2017. Copia para uso personal, se prohíbe la transmisión de este documento por cualquier medio o formato.
What radiologists need to know about the pulmonary---systemic flow ratio (Qp/Qs) 371
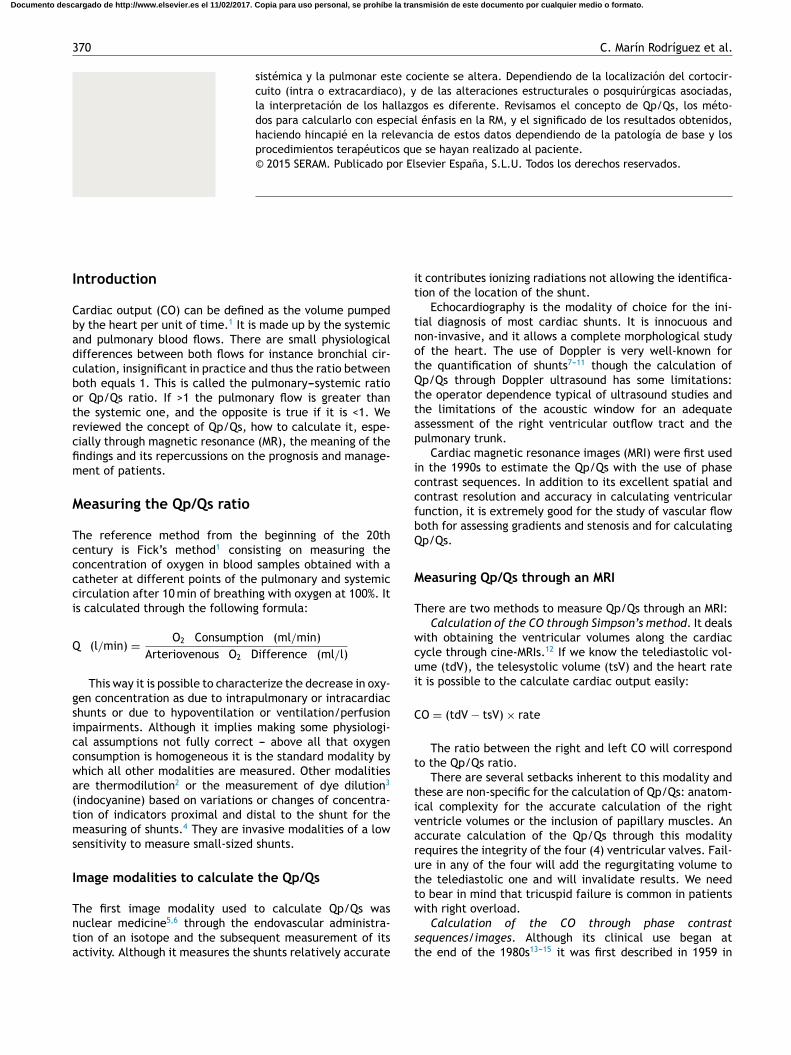
Figure 1 Magnitude (A) and phase image (B) in a phase contrast acquisition in the pulmonary artery trunk. In the phase imagethe ascending flow is white and the descending one is black. AoA: ascending aorta; AoD: descending aorta; AP: pulmonary artery.
the field of animal experimentation.16 It is based on thephase change undergone by moving protons (coming fromanother location) with respect to stationary tissues. Thesesequences/images are very similar to the Doppler effectthough its physical principles are totally different.
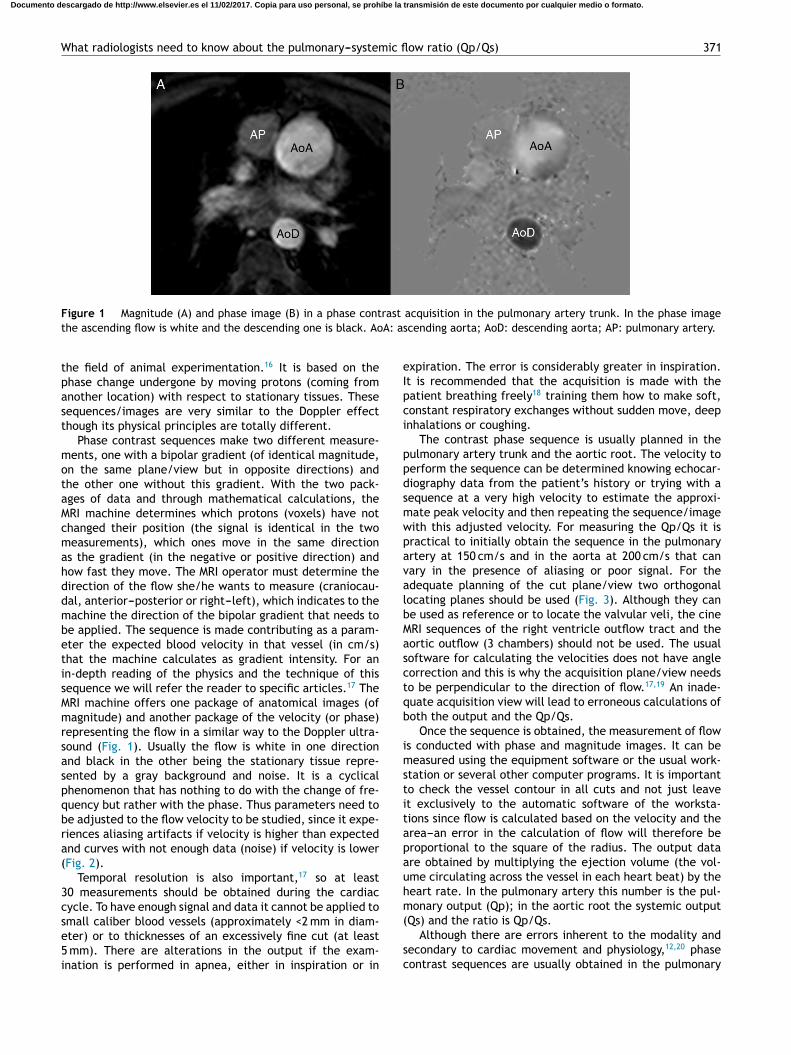
Phase contrast sequences make two different measure-ments, one with a bipolar gradient (of identical magnitude,on the same plane/view but in opposite directions) andthe other one without this gradient. With the two pack-ages of data and through mathematical calculations, theMRI machine determines which protons (voxels) have notchanged their position (the signal is identical in the twomeasurements), which ones move in the same directionas the gradient (in the negative or positive direction) andhow fast they move. The MRI operator must determine thedirection of the flow she/he wants to measure (craniocau-dal, anterior---posterior or right---left), which indicates to themachine the direction of the bipolar gradient that needs tobe applied. The sequence is made contributing as a param-eter the expected blood velocity in that vessel (in cm/s)that the machine calculates as gradient intensity. For anin-depth reading of the physics and the technique of thissequence we will refer the reader to specific articles.17 TheMRI machine offers one package of anatomical images (ofmagnitude) and another package of the velocity (or phase)representing the flow in a similar way to the Doppler ultra-sound (Fig. 1). Usually the flow is white in one directionand black in the other being the stationary tissue repre-sented by a gray background and noise. It is a cyclicalphenomenon that has nothing to do with the change of fre-quency but rather with the phase. Thus parameters need tobe adjusted to the flow velocity to be studied, since it expe-riences aliasing artifacts if velocity is higher than expectedand curves with not enough data (noise) if velocity is lower(Fig. 2).
Temporal resolution is also important,17 so at least30 measurements should be obtained during the cardiaccycle. To have enough signal and data it cannot be applied tosmall caliber blood vessels (approximately <2 mm in diam-eter) or to thicknesses of an excessively fine cut (at least5 mm). There are alterations in the output if the exam-ination is performed in apnea, either in inspiration or in
expiration. The error is considerably greater in inspiration.It is recommended that the acquisition is made with thepatient breathing freely18 training them how to make soft,constant respiratory exchanges without sudden move, deepinhalations or coughing.
The contrast phase sequence is usually planned in thepulmonary artery trunk and the aortic root. The velocity toperform the sequence can be determined knowing echocar-diography data from the patient’s history or trying with asequence at a very high velocity to estimate the approxi-mate peak velocity and then repeating the sequence/imagewith this adjusted velocity. For measuring the Qp/Qs it ispractical to initially obtain the sequence in the pulmonaryartery at 150 cm/s and in the aorta at 200 cm/s that canvary in the presence of aliasing or poor signal. For theadequate planning of the cut plane/view two orthogonallocating planes should be used (Fig. 3). Although they canbe used as reference or to locate the valvular veli, the cineMRI sequences of the right ventricle outflow tract and theaortic outflow (3 chambers) should not be used. The usualsoftware for calculating the velocities does not have anglecorrection and this is why the acquisition plane/view needsto be perpendicular to the direction of flow.17,19 An inade-quate acquisition view will lead to erroneous calculations ofboth the output and the Qp/Qs.
Once the sequence is obtained, the measurement of flowis conducted with phase and magnitude images. It can bemeasured using the equipment software or the usual work-station or several other computer programs. It is importantto check the vessel contour in all cuts and not just leaveit exclusively to the automatic software of the worksta-tions since flow is calculated based on the velocity and thearea---an error in the calculation of flow will therefore beproportional to the square of the radius. The output dataare obtained by multiplying the ejection volume (the vol-ume circulating across the vessel in each heart beat) by theheart rate. In the pulmonary artery this number is the pul-monary output (Qp); in the aortic root the systemic output(Qs) and the ratio is Qp/Qs.
Although there are errors inherent to the modality andsecondary to cardiac movement and physiology,12,20 phasecontrast sequences are usually obtained in the pulmonary
Documento descargado de http://www.elsevier.es el 11/02/2017. Copia para uso personal, se prohíbe la transmisión de este documento por cualquier medio o formato.
372 C. Marín Rodríguez et al.
A
cm/s cm/s cm/s
200180
160
140
120
100
80
60
40
20
0
–20 –50
–40
–30
–20
–10
0
10
20
30
40
50
60
0 50 100
200
150
100
50
0
0 50 100 150 200 250 300 350 400 450 500 550 600 650 700Time (ms)
150 20 0 25 0 30 0 35 0 40 0 45 0 50 0 55 0 60 0 65 0 700Time (ms)
0 50 10 0 15 0 20 0 25 0 30 0 35 0 40 0 45 0 50 0 55 0 60 0 65 0 700Time (ms)
B C
Figure 2 Effect of the speed selection in the phase contrast image in the aortic valve; 400 m/s (A), 100 m/s (B) and 50 m/s speedsequences/images (C). With a very high speed selection (A) the sequence has a low signal and the curve is not very accurate.With an adequate speed selection (B), the ascending and descending flows can be easily identified and the curve shows adequatemorphology and scale. If the speed selection is too low (C) then we are in the presence of aliasing and there is ‘‘descending’’ (black)flow in the aortic valve and a curve that cannot be interpreted with negative speed values in systole.
artery trunk and the aortic root above the aortic sinus. Sothere is a systematic error in the systemic measurement offlow due to the non-inclusion of the coronary flow that canbe representative of around 1% of the output.21 Also thereare differences ranging from 2% to 5% between systemicand pulmonary circulation when measured through phasecontrast---a fact that should be recognized as an internalerror of the test.17,22 Nevertheless its diagnostic accuracyhas been validated vs the oximetry23---25 and other dilutionmodalities,26 nuclear medicine27 or ultrasound.28 As we willsee later on in some special circumstances, such as uni-ventricular surgery the systemic and pulmonary outputs aremeasured differently.
Clinical utility of the Qp/Qs ratio
The measurement of the pulmonary and systemic outputratio informs about the integrity of the independence ofthese two circulations. If >1 there is passage of systemicblood into the pulmonary circulation, and if <1 from pul-monary to systemic circulation. This is very helpful whenquantifying shunts and studying associated complications.In the consensus guidelines on the use of cardiac MRIs thestudy of shunts is an established indication.29
Intra-cardiac shunts
The Qp/Qs is a piece of information of great physiopatho-logical and clinical importance in intracardiac shunts. Mostof these malformations do not require MRIs when it comes
to management. Nevertheless in some situations it is neces-sary to use image modalities to better describe the lesionanatomically and assess its functional repercussion espe-cially for the quantification of the shunt. We describe themeasurement of Qp/Qs in simple intracardiac shunts (septaldefects). In complex malformations including univentricu-lar heart, double outflow right ventricle, transposition withventricular septal defect, etc. the analysis of both thesystemic and pulmonary flows should include different varia-bles.
Intra-atrial communication (IAC). During fetal life andthe first moments after birth, pulmonary circulation showshigh resistance and the right heart is less distensible thanthe left one and pressure on the right atrium is greaterthan that exerted on the left one. The foramen ovale is thephysiological IAC during fetal life. The pressure falls withinthe right cavities when the neonate baby begins to breathemakes the foramen ovale to close. The IAC is an anomalouscommunication between the atria. Its clinical relevance,prognosis and treatment are based on the size and type ofcommunication:
1. Patent foramen ovale---usually small and self-limited.It can be identified in the majority of neonate babiesthough it is closed in 80% of adults. It does not usuallyhave any clinical relevance.
2. Ostium secundum IAC---due to a defect in the septum pri-mum. It is the most common IAC after the foramen ovalein children and on a large extent prognosis depends onits size. Spontaneous closure occurs in more than half
Documento descargado de http://www.elsevier.es el 11/02/2017. Copia para uso personal, se prohíbe la transmisión de este documento por cualquier medio o formato.
What radiologists need to know about the pulmonary---systemic flow ratio (Qp/Qs) 373
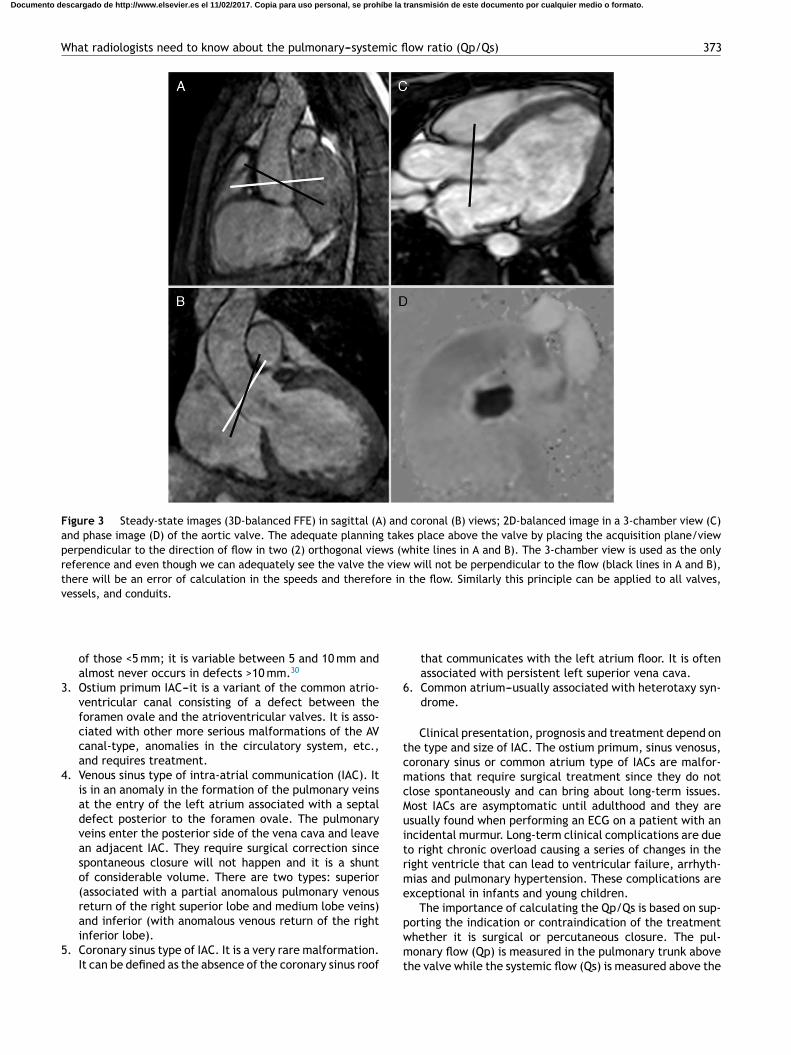
Figure 3 Steady-state images (3D-balanced FFE) in sagittal (A) and coronal (B) views; 2D-balanced image in a 3-chamber view (C)and phase image (D) of the aortic valve. The adequate planning takes place above the valve by placing the acquisition plane/viewperpendicular to the direction of flow in two (2) orthogonal views (white lines in A and B). The 3-chamber view is used as the onlyreference and even though we can adequately see the valve the view will not be perpendicular to the flow (black lines in A and B),there will be an error of calculation in the speeds and therefore in the flow. Similarly this principle can be applied to all valves,vessels, and conduits.
of those <5 mm; it is variable between 5 and 10 mm andalmost never occurs in defects >10 mm.30
3. Ostium primum IAC---it is a variant of the common atrio-ventricular canal consisting of a defect between theforamen ovale and the atrioventricular valves. It is asso-ciated with other more serious malformations of the AVcanal-type, anomalies in the circulatory system, etc.,and requires treatment.
4. Venous sinus type of intra-atrial communication (IAC). Itis in an anomaly in the formation of the pulmonary veinsat the entry of the left atrium associated with a septaldefect posterior to the foramen ovale. The pulmonaryveins enter the posterior side of the vena cava and leavean adjacent IAC. They require surgical correction sincespontaneous closure will not happen and it is a shuntof considerable volume. There are two types: superior(associated with a partial anomalous pulmonary venousreturn of the right superior lobe and medium lobe veins)and inferior (with anomalous venous return of the rightinferior lobe).
5. Coronary sinus type of IAC. It is a very rare malformation.It can be defined as the absence of the coronary sinus roof
that communicates with the left atrium floor. It is oftenassociated with persistent left superior vena cava.
6. Common atrium---usually associated with heterotaxy syn-drome.
Clinical presentation, prognosis and treatment depend onthe type and size of IAC. The ostium primum, sinus venosus,coronary sinus or common atrium type of IACs are malfor-mations that require surgical treatment since they do notclose spontaneously and can bring about long-term issues.Most IACs are asymptomatic until adulthood and they areusually found when performing an ECG on a patient with anincidental murmur. Long-term clinical complications are dueto right chronic overload causing a series of changes in theright ventricle that can lead to ventricular failure, arrhyth-mias and pulmonary hypertension. These complications areexceptional in infants and young children.
The importance of calculating the Qp/Qs is based on sup-porting the indication or contraindication of the treatmentwhether it is surgical or percutaneous closure. The pul-monary flow (Qp) is measured in the pulmonary trunk abovethe valve while the systemic flow (Qs) is measured above the
Documento descargado de http://www.elsevier.es el 11/02/2017. Copia para uso personal, se prohíbe la transmisión de este documento por cualquier medio o formato.
374 C. Marín Rodríguez et al.
Heart rate
Heart rate
: 94 bpm
95 bpm
638 ms
632 ms
:
:
:
RR-interval
RR-interval
Analysis results:
Analysis results:
Slice 1
Slice 1
Vessel
Vessel
1
1
Stroke volume (ml) 89.5
27.127.10.00.1
27.242.99.6
15.3
90.10.50.6
90.6140.225.339.7
Forward flow vol. (ml)Backward flow vol. (ml)Regurgitant fract. (%)Abs. stroke volume (ml)Mean flux (ml/s)Stroke distance (cm)Mean velocity (cm/s)
Stroke volume (ml)Forward flow vol. (ml)Backward flow vol. (ml)Regurgitant fract. (%)Abs. stroke volume (ml)Mean flux (ml/s)Stroke distance (cm)Mean velocity (cm/s)
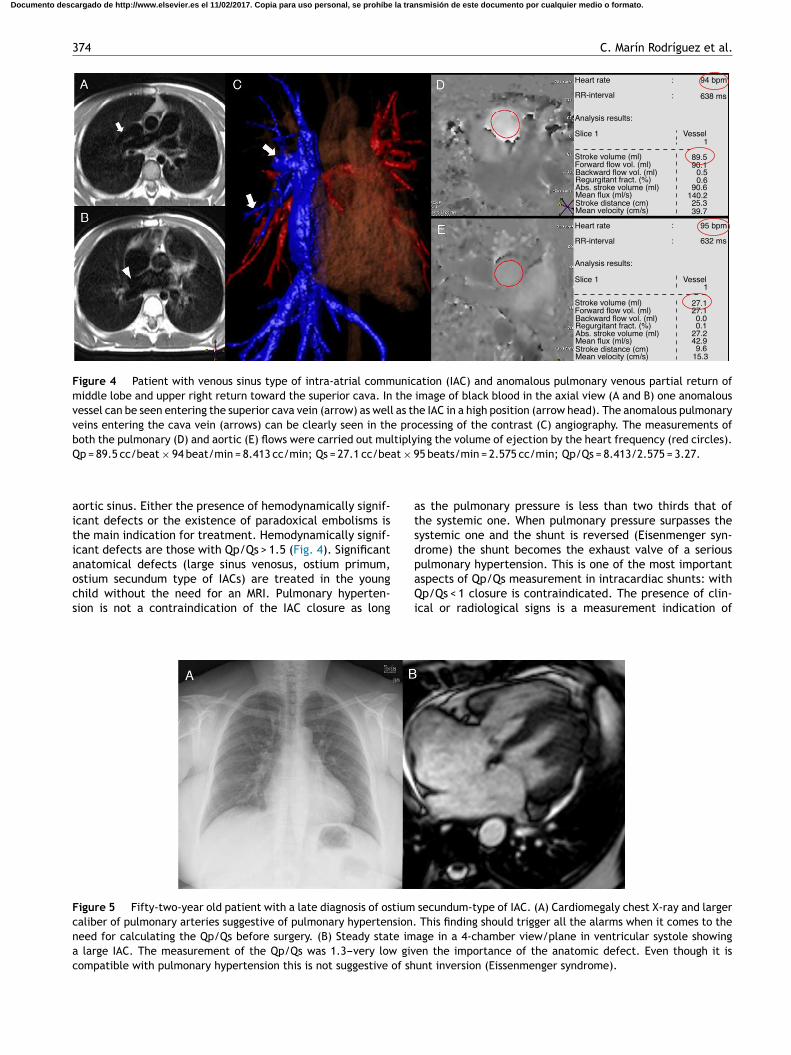
Figure 4 Patient with venous sinus type of intra-atrial communication (IAC) and anomalous pulmonary venous partial return ofmiddle lobe and upper right return toward the superior cava. In the image of black blood in the axial view (A and B) one anomalousvessel can be seen entering the superior cava vein (arrow) as well as the IAC in a high position (arrow head). The anomalous pulmonaryveins entering the cava vein (arrows) can be clearly seen in the processing of the contrast (C) angiography. The measurements ofboth the pulmonary (D) and aortic (E) flows were carried out multiplying the volume of ejection by the heart frequency (red circles).Qp = 89.5 cc/beat × 94 beat/min = 8.413 cc/min; Qs = 27.1 cc/beat × 95 beats/min = 2.575 cc/min; Qp/Qs = 8.413/2.575 = 3.27.
aortic sinus. Either the presence of hemodynamically signif-icant defects or the existence of paradoxical embolisms isthe main indication for treatment. Hemodynamically signif-icant defects are those with Qp/Qs > 1.5 (Fig. 4). Significantanatomical defects (large sinus venosus, ostium primum,ostium secundum type of IACs) are treated in the youngchild without the need for an MRI. Pulmonary hyperten-sion is not a contraindication of the IAC closure as long
as the pulmonary pressure is less than two thirds that ofthe systemic one. When pulmonary pressure surpasses thesystemic one and the shunt is reversed (Eisenmenger syn-drome) the shunt becomes the exhaust valve of a seriouspulmonary hypertension. This is one of the most importantaspects of Qp/Qs measurement in intracardiac shunts: withQp/Qs < 1 closure is contraindicated. The presence of clin-ical or radiological signs is a measurement indication of
Figure 5 Fifty-two-year old patient with a late diagnosis of ostium secundum-type of IAC. (A) Cardiomegaly chest X-ray and largercaliber of pulmonary arteries suggestive of pulmonary hypertension. This finding should trigger all the alarms when it comes to theneed for calculating the Qp/Qs before surgery. (B) Steady state image in a 4-chamber view/plane in ventricular systole showinga large IAC. The measurement of the Qp/Qs was 1.3---very low given the importance of the anatomic defect. Even though it iscompatible with pulmonary hypertension this is not suggestive of shunt inversion (Eissenmenger syndrome).
Documento descargado de http://www.elsevier.es el 11/02/2017. Copia para uso personal, se prohíbe la transmisión de este documento por cualquier medio o formato.
What radiologists need to know about the pulmonary---systemic flow ratio (Qp/Qs) 375
Qp/Qs through MRI (Fig. 5). Nevertheless shunt correctionhas been described in patients with Eisenmenger syndromeusing pulmonary vasodilators such as sildenafil.31
Interventricular communication (IVC). Although theanatomy of IVC is relatively simple, its classification andthe consequences of its different types are way morecomplex.32 Based on its location ICV is classified as:
1. Muscular IVC. They are the most common ones and theyare ever more diagnosed due to the generalization ofthe ECG. They are self-limited when they are small.They occur in any locations of the interventricular sep-tum but they are more usually apical and mid-septal andfrequently multiple.
2. Perimembranous IVC. They can affect both the ventricu-lar inflow and outflow and thus the aortic valve or the AVvalves.
3. Yuxta-arterial IVC (also called supracristal or subarte-rial). It is located at the infundibulum of the ventricularoutflow which generates a single outflow of both ventri-cles and continuity between the aortic and pulmonaryvalves.
Large IVC are surgical when they affect the cardiac valvesand when accompanied by recurrent endocarditis or if theypresent ventricular overload with hemodynamic repercus-sion. Small septal defects in asymptomatic patients withoutoverload can be managed conservatively.33 The usual sce-nario is surgical repair though endovascular procedures havebeen developed during the last few years. Surgical cor-rection is recommended with Qp/Qs > 1.7. Hemodynamicrepercussion that indicates surgery, the method to quan-tify Qp/Qs, and considerations with respect to Eisenmenger
syndrome are similar to what has already been reported inthe IAC.
Other significant circumstances are those in which, inaddition to an IVC there is pulmonary stenosis or atresia(Fallot’s syndrome). Due to the restriction in blood outflowtoward the pulmonary tree, the pressure on the right ven-tricle surpasses the pressure on the left ventricular in such away that the Qp/Qs is <1. This causes deoxygenated blood toenter the systemic circulation causing the cyanosis typicalin these patients before treatment. However if pulmonarystenosis is very significant or in the presence of pulmonaryatresia due to aorticopulmonary collaterals the Qp/Qs canbe >1 reflecting the seriousness of the collaterals and canbe of prognostic value.34 In this case the Qp is measured inthe pulmonary veins (see ‘‘Aorticopulmonary Collaterals inuniventricular correction’’).
Extra-cardiac shunts
The measurement of systemic and pulmonary flows and thecalculation of Qp/Qs also contribute information on thehemodynamic repercussion of extra-cardiac shunts. In orderto interpret the data of flow correctly it is necessary tounderstand the physiopathology of the shunt.
Patent Ductus Arteriosus (PDA). The ductus arteriosusnormally closes during the first hours of life. In 60% of pre-mature infants under 28 weeks there is confirmation of aPDA that when systemic output decreases is associated witha higher frequency of necrotizing enterocolitis, intraven-tricular hemorrhage, chronic pulmonary disease, pulmonaryhemorrhage and death. The diagnosis of PDA is performedthrough ECG in neonate babies and infants. In older chil-dren and adults other image modalities can be required
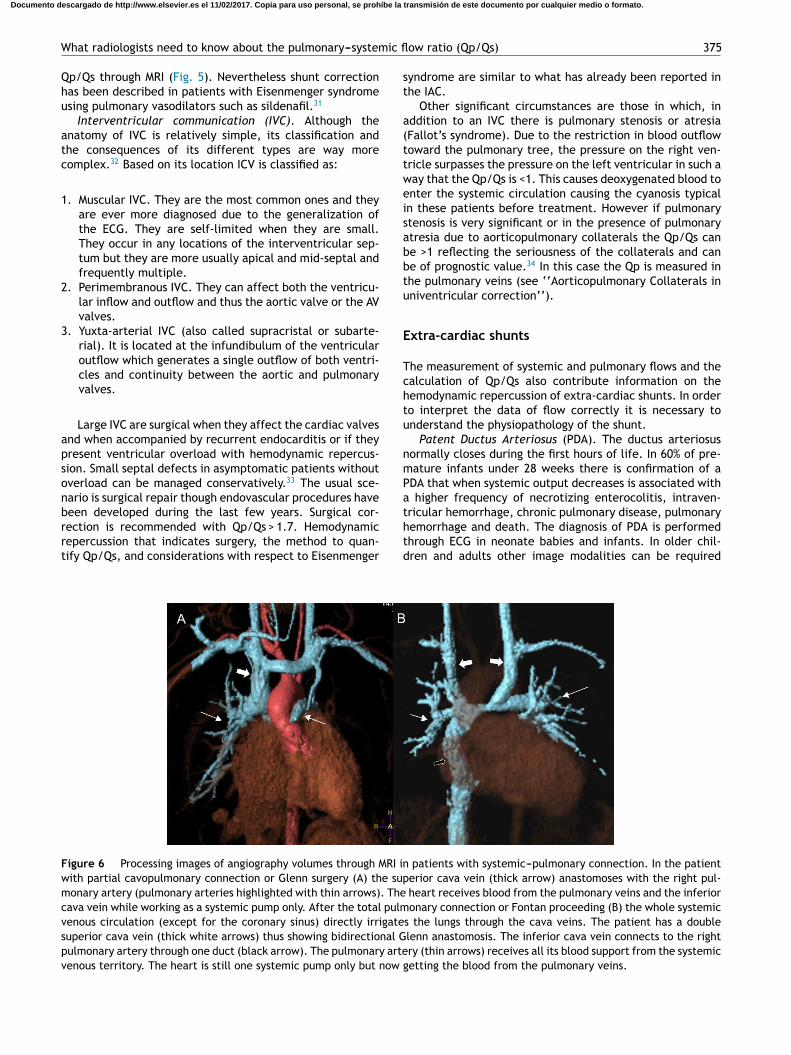
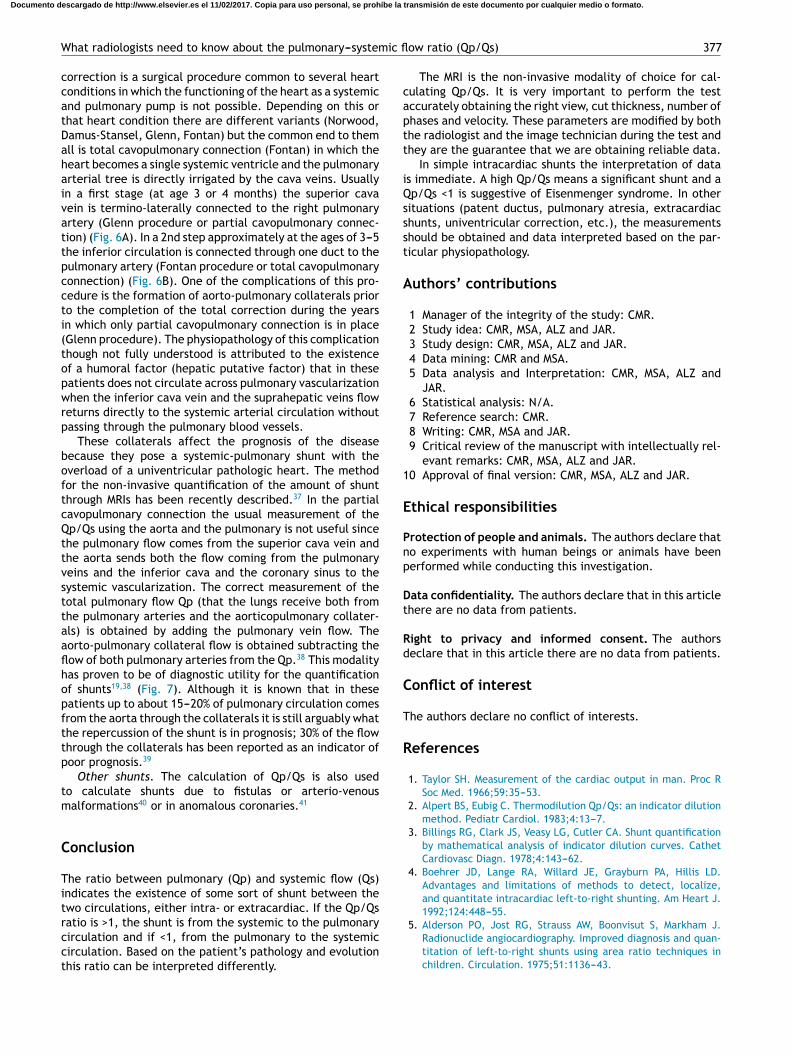
Figure 6 Processing images of angiography volumes through MRI in patients with systemic---pulmonary connection. In the patientwith partial cavopulmonary connection or Glenn surgery (A) the superior cava vein (thick arrow) anastomoses with the right pul-monary artery (pulmonary arteries highlighted with thin arrows). The heart receives blood from the pulmonary veins and the inferiorcava vein while working as a systemic pump only. After the total pulmonary connection or Fontan proceeding (B) the whole systemicvenous circulation (except for the coronary sinus) directly irrigates the lungs through the cava veins. The patient has a doublesuperior cava vein (thick white arrows) thus showing bidirectional Glenn anastomosis. The inferior cava vein connects to the rightpulmonary artery through one duct (black arrow). The pulmonary artery (thin arrows) receives all its blood support from the systemicvenous territory. The heart is still one systemic pump only but now getting the blood from the pulmonary veins.
Documento descargado de http://www.elsevier.es el 11/02/2017. Copia para uso personal, se prohíbe la transmisión de este documento por cualquier medio o formato.
376 C. Marín Rodríguez et al.
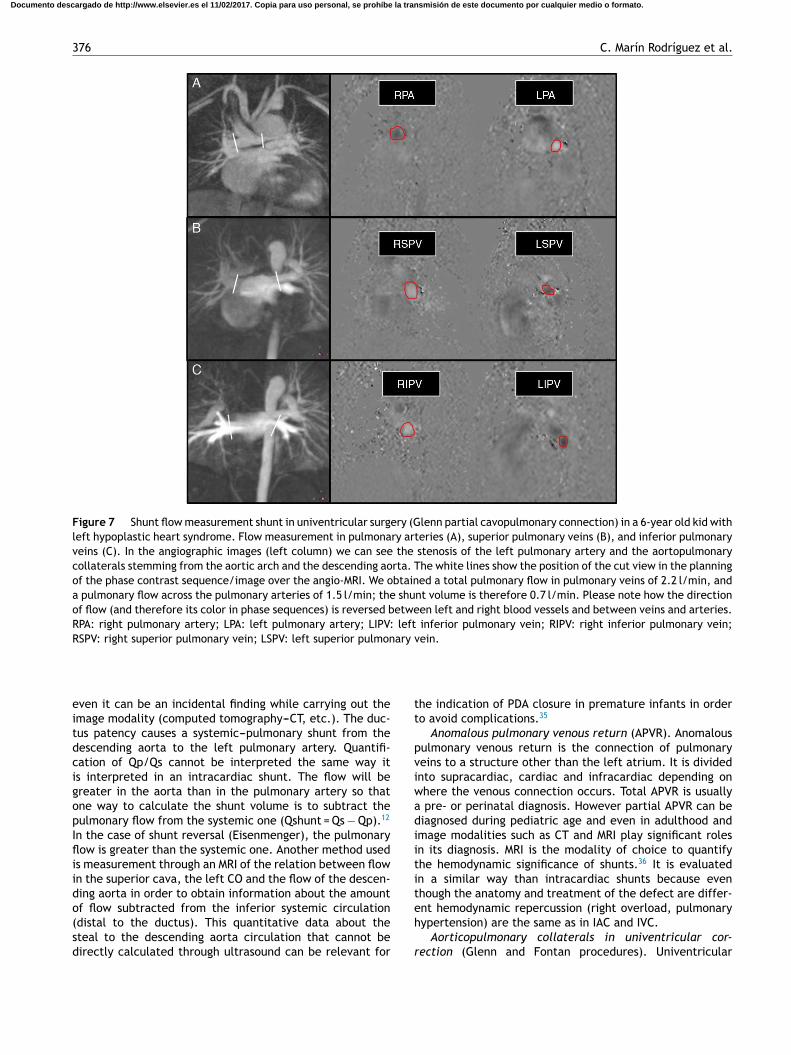
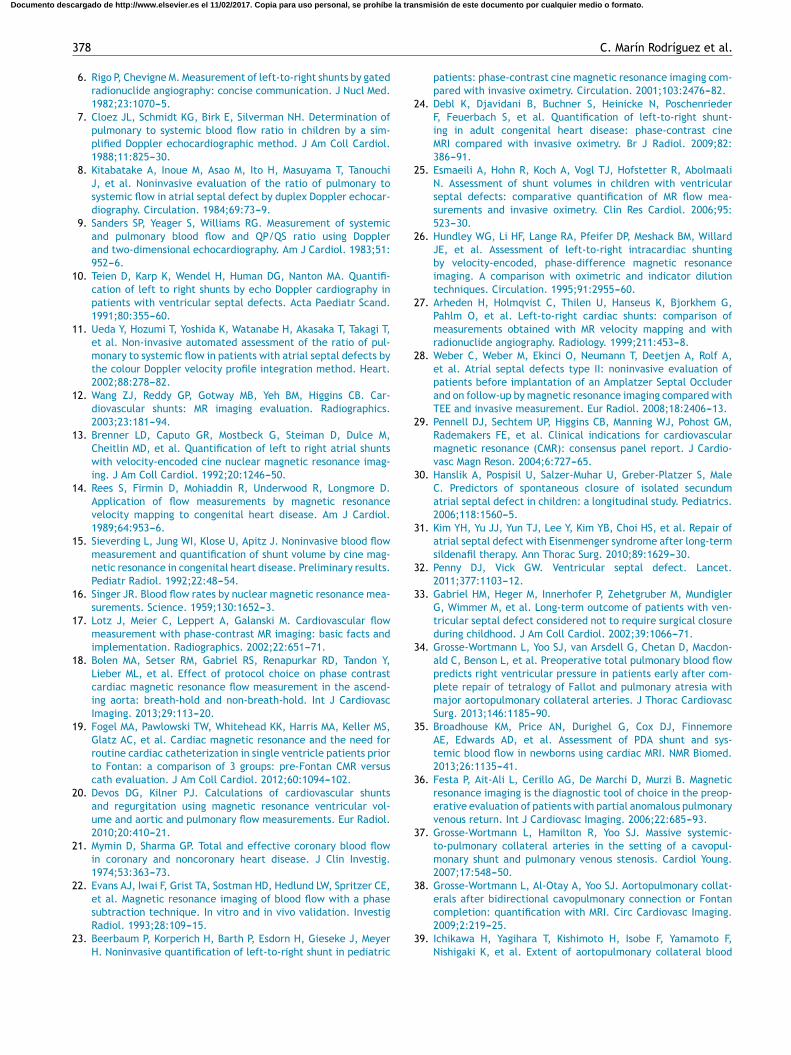
Figure 7 Shunt flow measurement shunt in univentricular surgery (Glenn partial cavopulmonary connection) in a 6-year old kid withleft hypoplastic heart syndrome. Flow measurement in pulmonary arteries (A), superior pulmonary veins (B), and inferior pulmonaryveins (C). In the angiographic images (left column) we can see the stenosis of the left pulmonary artery and the aortopulmonarycollaterals stemming from the aortic arch and the descending aorta. The white lines show the position of the cut view in the planningof the phase contrast sequence/image over the angio-MRI. We obtained a total pulmonary flow in pulmonary veins of 2.2 l/min, anda pulmonary flow across the pulmonary arteries of 1.5 l/min; the shunt volume is therefore 0.7 l/min. Please note how the directionof flow (and therefore its color in phase sequences) is reversed between left and right blood vessels and between veins and arteries.RPA: right pulmonary artery; LPA: left pulmonary artery; LIPV: left inferior pulmonary vein; RIPV: right inferior pulmonary vein;RSPV: right superior pulmonary vein; LSPV: left superior pulmonary vein.
even it can be an incidental finding while carrying out theimage modality (computed tomography---CT, etc.). The duc-tus patency causes a systemic---pulmonary shunt from thedescending aorta to the left pulmonary artery. Quantifi-cation of Qp/Qs cannot be interpreted the same way itis interpreted in an intracardiac shunt. The flow will begreater in the aorta than in the pulmonary artery so thatone way to calculate the shunt volume is to subtract thepulmonary flow from the systemic one (Qshunt = Qs − Qp).12
In the case of shunt reversal (Eisenmenger), the pulmonaryflow is greater than the systemic one. Another method usedis measurement through an MRI of the relation between flowin the superior cava, the left CO and the flow of the descen-ding aorta in order to obtain information about the amountof flow subtracted from the inferior systemic circulation(distal to the ductus). This quantitative data about thesteal to the descending aorta circulation that cannot bedirectly calculated through ultrasound can be relevant for
the indication of PDA closure in premature infants in orderto avoid complications.35
Anomalous pulmonary venous return (APVR). Anomalouspulmonary venous return is the connection of pulmonaryveins to a structure other than the left atrium. It is dividedinto supracardiac, cardiac and infracardiac depending onwhere the venous connection occurs. Total APVR is usuallya pre- or perinatal diagnosis. However partial APVR can bediagnosed during pediatric age and even in adulthood andimage modalities such as CT and MRI play significant rolesin its diagnosis. MRI is the modality of choice to quantifythe hemodynamic significance of shunts.36 It is evaluatedin a similar way than intracardiac shunts because eventhough the anatomy and treatment of the defect are differ-ent hemodynamic repercussion (right overload, pulmonaryhypertension) are the same as in IAC and IVC.
Aorticopulmonary collaterals in univentricular cor-
rection (Glenn and Fontan procedures). Univentricular
Documento descargado de http://www.elsevier.es el 11/02/2017. Copia para uso personal, se prohíbe la transmisión de este documento por cualquier medio o formato.
What radiologists need to know about the pulmonary---systemic flow ratio (Qp/Qs) 377
correction is a surgical procedure common to several heartconditions in which the functioning of the heart as a systemicand pulmonary pump is not possible. Depending on this orthat heart condition there are different variants (Norwood,Damus-Stansel, Glenn, Fontan) but the common end to themall is total cavopulmonary connection (Fontan) in which theheart becomes a single systemic ventricle and the pulmonaryarterial tree is directly irrigated by the cava veins. Usuallyin a first stage (at age 3 or 4 months) the superior cavavein is termino-laterally connected to the right pulmonaryartery (Glenn procedure or partial cavopulmonary connec-tion) (Fig. 6A). In a 2nd step approximately at the ages of 3---5the inferior circulation is connected through one duct to thepulmonary artery (Fontan procedure or total cavopulmonaryconnection) (Fig. 6B). One of the complications of this pro-cedure is the formation of aorto-pulmonary collaterals priorto the completion of the total correction during the yearsin which only partial cavopulmonary connection is in place(Glenn procedure). The physiopathology of this complicationthough not fully understood is attributed to the existenceof a humoral factor (hepatic putative factor) that in thesepatients does not circulate across pulmonary vascularizationwhen the inferior cava vein and the suprahepatic veins flowreturns directly to the systemic arterial circulation withoutpassing through the pulmonary blood vessels.
These collaterals affect the prognosis of the diseasebecause they pose a systemic-pulmonary shunt with theoverload of a univentricular pathologic heart. The methodfor the non-invasive quantification of the amount of shuntthrough MRIs has been recently described.37 In the partialcavopulmonary connection the usual measurement of theQp/Qs using the aorta and the pulmonary is not useful sincethe pulmonary flow comes from the superior cava vein andthe aorta sends both the flow coming from the pulmonaryveins and the inferior cava and the coronary sinus to thesystemic vascularization. The correct measurement of thetotal pulmonary flow Qp (that the lungs receive both fromthe pulmonary arteries and the aorticopulmonary collater-als) is obtained by adding the pulmonary vein flow. Theaorto-pulmonary collateral flow is obtained subtracting theflow of both pulmonary arteries from the Qp.38 This modalityhas proven to be of diagnostic utility for the quantificationof shunts19,38 (Fig. 7). Although it is known that in thesepatients up to about 15---20% of pulmonary circulation comesfrom the aorta through the collaterals it is still arguably whatthe repercussion of the shunt is in prognosis; 30% of the flowthrough the collaterals has been reported as an indicator ofpoor prognosis.39
Other shunts. The calculation of Qp/Qs is also usedto calculate shunts due to fistulas or arterio-venousmalformations40 or in anomalous coronaries.41
Conclusion
The ratio between pulmonary (Qp) and systemic flow (Qs)indicates the existence of some sort of shunt between thetwo circulations, either intra- or extracardiac. If the Qp/Qsratio is >1, the shunt is from the systemic to the pulmonarycirculation and if <1, from the pulmonary to the systemiccirculation. Based on the patient’s pathology and evolutionthis ratio can be interpreted differently.
The MRI is the non-invasive modality of choice for cal-culating Qp/Qs. It is very important to perform the testaccurately obtaining the right view, cut thickness, number ofphases and velocity. These parameters are modified by boththe radiologist and the image technician during the test andthey are the guarantee that we are obtaining reliable data.
In simple intracardiac shunts the interpretation of datais immediate. A high Qp/Qs means a significant shunt and aQp/Qs <1 is suggestive of Eisenmenger syndrome. In othersituations (patent ductus, pulmonary atresia, extracardiacshunts, univentricular correction, etc.), the measurementsshould be obtained and data interpreted based on the par-ticular physiopathology.
Authors’ contributions
1 Manager of the integrity of the study: CMR.2 Study idea: CMR, MSA, ALZ and JAR.3 Study design: CMR, MSA, ALZ and JAR.4 Data mining: CMR and MSA.5 Data analysis and Interpretation: CMR, MSA, ALZ and
JAR.6 Statistical analysis: N/A.7 Reference search: CMR.8 Writing: CMR, MSA and JAR.9 Critical review of the manuscript with intellectually rel-
evant remarks: CMR, MSA, ALZ and JAR.10 Approval of final version: CMR, MSA, ALZ and JAR.
Ethical responsibilities
Protection of people and animals. The authors declare thatno experiments with human beings or animals have beenperformed while conducting this investigation.
Data confidentiality. The authors declare that in this articlethere are no data from patients.
Right to privacy and informed consent. The authorsdeclare that in this article there are no data from patients.
Conflict of interest
The authors declare no conflict of interests.
References
1. Taylor SH. Measurement of the cardiac output in man. Proc RSoc Med. 1966;59:35---53.
2. Alpert BS, Eubig C. Thermodilution Qp/Qs: an indicator dilutionmethod. Pediatr Cardiol. 1983;4:13---7.
3. Billings RG, Clark JS, Veasy LG, Cutler CA. Shunt quantificationby mathematical analysis of indicator dilution curves. CathetCardiovasc Diagn. 1978;4:143---62.
4. Boehrer JD, Lange RA, Willard JE, Grayburn PA, Hillis LD.Advantages and limitations of methods to detect, localize,and quantitate intracardiac left-to-right shunting. Am Heart J.1992;124:448---55.
5. Alderson PO, Jost RG, Strauss AW, Boonvisut S, Markham J.Radionuclide angiocardiography. Improved diagnosis and quan-titation of left-to-right shunts using area ratio techniques inchildren. Circulation. 1975;51:1136---43.
Documento descargado de http://www.elsevier.es el 11/02/2017. Copia para uso personal, se prohíbe la transmisión de este documento por cualquier medio o formato.
378 C. Marín Rodríguez et al.
6. Rigo P, Chevigne M. Measurement of left-to-right shunts by gatedradionuclide angiography: concise communication. J Nucl Med.1982;23:1070---5.
7. Cloez JL, Schmidt KG, Birk E, Silverman NH. Determination ofpulmonary to systemic blood flow ratio in children by a sim-plified Doppler echocardiographic method. J Am Coll Cardiol.1988;11:825---30.
8. Kitabatake A, Inoue M, Asao M, Ito H, Masuyama T, TanouchiJ, et al. Noninvasive evaluation of the ratio of pulmonary tosystemic flow in atrial septal defect by duplex Doppler echocar-diography. Circulation. 1984;69:73---9.
9. Sanders SP, Yeager S, Williams RG. Measurement of systemicand pulmonary blood flow and QP/QS ratio using Dopplerand two-dimensional echocardiography. Am J Cardiol. 1983;51:952---6.
10. Teien D, Karp K, Wendel H, Human DG, Nanton MA. Quantifi-cation of left to right shunts by echo Doppler cardiography inpatients with ventricular septal defects. Acta Paediatr Scand.1991;80:355---60.
11. Ueda Y, Hozumi T, Yoshida K, Watanabe H, Akasaka T, Takagi T,et al. Non-invasive automated assessment of the ratio of pul-monary to systemic flow in patients with atrial septal defects bythe colour Doppler velocity profile integration method. Heart.2002;88:278---82.
12. Wang ZJ, Reddy GP, Gotway MB, Yeh BM, Higgins CB. Car-diovascular shunts: MR imaging evaluation. Radiographics.2003;23:181---94.
13. Brenner LD, Caputo GR, Mostbeck G, Steiman D, Dulce M,Cheitlin MD, et al. Quantification of left to right atrial shuntswith velocity-encoded cine nuclear magnetic resonance imag-ing. J Am Coll Cardiol. 1992;20:1246---50.
14. Rees S, Firmin D, Mohiaddin R, Underwood R, Longmore D.Application of flow measurements by magnetic resonancevelocity mapping to congenital heart disease. Am J Cardiol.1989;64:953---6.
15. Sieverding L, Jung WI, Klose U, Apitz J. Noninvasive blood flowmeasurement and quantification of shunt volume by cine mag-netic resonance in congenital heart disease. Preliminary results.Pediatr Radiol. 1992;22:48---54.
16. Singer JR. Blood flow rates by nuclear magnetic resonance mea-surements. Science. 1959;130:1652---3.
17. Lotz J, Meier C, Leppert A, Galanski M. Cardiovascular flowmeasurement with phase-contrast MR imaging: basic facts andimplementation. Radiographics. 2002;22:651---71.
18. Bolen MA, Setser RM, Gabriel RS, Renapurkar RD, Tandon Y,Lieber ML, et al. Effect of protocol choice on phase contrastcardiac magnetic resonance flow measurement in the ascend-ing aorta: breath-hold and non-breath-hold. Int J CardiovascImaging. 2013;29:113---20.
19. Fogel MA, Pawlowski TW, Whitehead KK, Harris MA, Keller MS,Glatz AC, et al. Cardiac magnetic resonance and the need forroutine cardiac catheterization in single ventricle patients priorto Fontan: a comparison of 3 groups: pre-Fontan CMR versuscath evaluation. J Am Coll Cardiol. 2012;60:1094---102.
20. Devos DG, Kilner PJ. Calculations of cardiovascular shuntsand regurgitation using magnetic resonance ventricular vol-ume and aortic and pulmonary flow measurements. Eur Radiol.2010;20:410---21.
21. Mymin D, Sharma GP. Total and effective coronary blood flowin coronary and noncoronary heart disease. J Clin Investig.1974;53:363---73.
22. Evans AJ, Iwai F, Grist TA, Sostman HD, Hedlund LW, Spritzer CE,et al. Magnetic resonance imaging of blood flow with a phasesubtraction technique. In vitro and in vivo validation. InvestigRadiol. 1993;28:109---15.
23. Beerbaum P, Korperich H, Barth P, Esdorn H, Gieseke J, MeyerH. Noninvasive quantification of left-to-right shunt in pediatric
patients: phase-contrast cine magnetic resonance imaging com-pared with invasive oximetry. Circulation. 2001;103:2476---82.
24. Debl K, Djavidani B, Buchner S, Heinicke N, PoschenriederF, Feuerbach S, et al. Quantification of left-to-right shunt-ing in adult congenital heart disease: phase-contrast cineMRI compared with invasive oximetry. Br J Radiol. 2009;82:386---91.
25. Esmaeili A, Hohn R, Koch A, Vogl TJ, Hofstetter R, AbolmaaliN. Assessment of shunt volumes in children with ventricularseptal defects: comparative quantification of MR flow mea-surements and invasive oximetry. Clin Res Cardiol. 2006;95:523---30.
26. Hundley WG, Li HF, Lange RA, Pfeifer DP, Meshack BM, WillardJE, et al. Assessment of left-to-right intracardiac shuntingby velocity-encoded, phase-difference magnetic resonanceimaging. A comparison with oximetric and indicator dilutiontechniques. Circulation. 1995;91:2955---60.
27. Arheden H, Holmqvist C, Thilen U, Hanseus K, Bjorkhem G,Pahlm O, et al. Left-to-right cardiac shunts: comparison ofmeasurements obtained with MR velocity mapping and withradionuclide angiography. Radiology. 1999;211:453---8.
28. Weber C, Weber M, Ekinci O, Neumann T, Deetjen A, Rolf A,et al. Atrial septal defects type II: noninvasive evaluation ofpatients before implantation of an Amplatzer Septal Occluderand on follow-up by magnetic resonance imaging compared withTEE and invasive measurement. Eur Radiol. 2008;18:2406---13.
29. Pennell DJ, Sechtem UP, Higgins CB, Manning WJ, Pohost GM,Rademakers FE, et al. Clinical indications for cardiovascularmagnetic resonance (CMR): consensus panel report. J Cardio-vasc Magn Reson. 2004;6:727---65.
30. Hanslik A, Pospisil U, Salzer-Muhar U, Greber-Platzer S, MaleC. Predictors of spontaneous closure of isolated secundumatrial septal defect in children: a longitudinal study. Pediatrics.2006;118:1560---5.
31. Kim YH, Yu JJ, Yun TJ, Lee Y, Kim YB, Choi HS, et al. Repair ofatrial septal defect with Eisenmenger syndrome after long-termsildenafil therapy. Ann Thorac Surg. 2010;89:1629---30.
32. Penny DJ, Vick GW. Ventricular septal defect. Lancet.2011;377:1103---12.
33. Gabriel HM, Heger M, Innerhofer P, Zehetgruber M, MundiglerG, Wimmer M, et al. Long-term outcome of patients with ven-tricular septal defect considered not to require surgical closureduring childhood. J Am Coll Cardiol. 2002;39:1066---71.
34. Grosse-Wortmann L, Yoo SJ, van Arsdell G, Chetan D, Macdon-ald C, Benson L, et al. Preoperative total pulmonary blood flowpredicts right ventricular pressure in patients early after com-plete repair of tetralogy of Fallot and pulmonary atresia withmajor aortopulmonary collateral arteries. J Thorac CardiovascSurg. 2013;146:1185---90.
35. Broadhouse KM, Price AN, Durighel G, Cox DJ, FinnemoreAE, Edwards AD, et al. Assessment of PDA shunt and sys-temic blood flow in newborns using cardiac MRI. NMR Biomed.2013;26:1135---41.
36. Festa P, Ait-Ali L, Cerillo AG, De Marchi D, Murzi B. Magneticresonance imaging is the diagnostic tool of choice in the preop-erative evaluation of patients with partial anomalous pulmonaryvenous return. Int J Cardiovasc Imaging. 2006;22:685---93.
37. Grosse-Wortmann L, Hamilton R, Yoo SJ. Massive systemic-to-pulmonary collateral arteries in the setting of a cavopul-monary shunt and pulmonary venous stenosis. Cardiol Young.2007;17:548---50.
38. Grosse-Wortmann L, Al-Otay A, Yoo SJ. Aortopulmonary collat-erals after bidirectional cavopulmonary connection or Fontancompletion: quantification with MRI. Circ Cardiovasc Imaging.2009;2:219---25.
39. Ichikawa H, Yagihara T, Kishimoto H, Isobe F, Yamamoto F,Nishigaki K, et al. Extent of aortopulmonary collateral blood
Documento descargado de http://www.elsevier.es el 11/02/2017. Copia para uso personal, se prohíbe la transmisión de este documento por cualquier medio o formato.

What radiologists need to know about the pulmonary---systemic flow ratio (Qp/Qs) 379
flow as a risk factor for Fontan operations. Ann Thorac Surg.1995;59:433---7.
40. Whyte MK, Peters AM, Hughes JM, Henderson BL, Bellingan GJ,Jackson JE, et al. Quantification of right to left shunt at restand during exercise in patients with pulmonary arteriovenousmalformations. Thorax. 1992;47:790---6.
41. Shariat M, Grosse-Wortmann L, Seed M, Yoo SJ. Isolated anoma-lous origin of the right coronary artery from the pulmonaryartery in an asymptomatic 12-year-old girl: role of MRI indepicting the anatomy, detecting the ischemic burden, andquantifying the amount of left-to-right shunt. World J PediatrCongenit Heart Surg. 2013;4:201---5.
Documento descargado de http://www.elsevier.es el 11/02/2017. Copia para uso personal, se prohíbe la transmisión de este documento por cualquier medio o formato.