What is VIEWS? The Visibility Information Exchange Web System is an online system designed to...
18
What is VIEWS? The Visibility Information Exchange Web System is an online system designed to acquire , manage , and provide access to data and metadata related to visibility and air quality, and to support the efforts of the five Regional Planning Organizations (RPOs) to meet the requirements of the Environmental Protection Agency’s Regional Haze Rule to reduce regional haze in national parks and wilderness areas. http:// vista.cira.colostate.edu/ views Sponsor: Guiding Body: Development: Location: Other Affiliations: Five Regional Planning Organizations VIEWS Steering Committee CIRA, Colorado State University CSU Foothills Campus, Fort Collins, CO IMPROVE Monitoring Network Database Development Update GIS Update Visual Analysis Tools Update New Hardware Update Dataset Acquisition Update
-
Upload
brent-wilkinson -
Category
Documents
-
view
220 -
download
0
Transcript of What is VIEWS? The Visibility Information Exchange Web System is an online system designed to...

What is VIEWS?
The Visibility Information Exchange Web System is an online system designed to acquire, manage, and provide access to data and metadata related to visibility and air quality, and to support the efforts of the five Regional Planning Organizations (RPOs) to meet the requirements of the Environmental Protection Agency’s Regional Haze Rule to reduce regional haze in national parks and wilderness areas.
http://vista.cira.colostate.edu/views
Sponsor:
Guiding Body:
Development:
Location:
Other Affiliations:
Five Regional Planning Organizations
VIEWS Steering Committee
CIRA, Colorado State University
CSU Foothills Campus, Fort Collins, CO
IMPROVE Monitoring Network
Database Development Update
GIS Update
Visual Analysis Tools Update
New Hardware Update
Dataset Acquisition Update
Future Directions and Plans
Introduction to VIEWS Training

Over 500 registered users
Over 150 organizations represented (probably many more that are undeclared)
An estimated 250+ unique hits a day
Over 50 nations represented Denmark, Poland, New Zealand, Australia, Zimbabwe, and more…
Search engine positioning (Google.com): #1 for “Visibility Information”
#3-6 for “Visibility Data”, up from #43 in April and #90+ in February
An ever-increasing number of feedback responses
Linked to by over three dozen other sites (growing rapidly)
EPA, RPOs, State Environmental Agencies, Universities, etc.
An increasing number of requests for data and new features Online submission and immediate use of data sets
Geographical Information System (GIS) integration
Online modeling tools and simulations

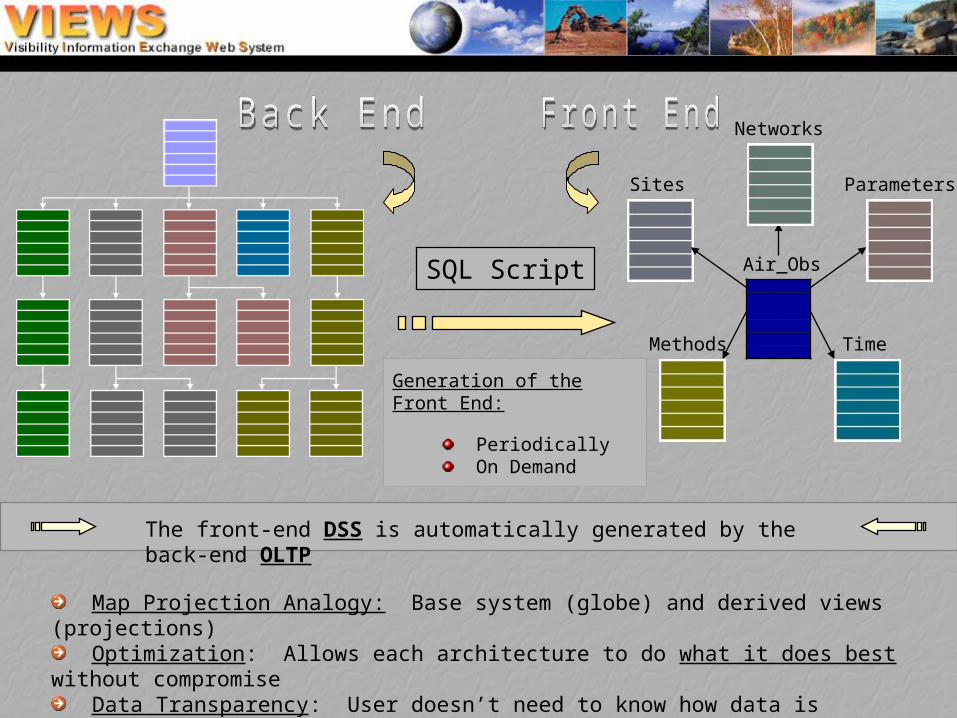
The front-end DSS is automatically generated by the back-end OLTP
Map Projection Analogy: Base system (globe) and derived views (projections) Optimization: Allows each architecture to do what it does best without compromise Data Transparency: User doesn’t need to know how data is stored, only how to use it Exchangeability: A wide variety of diverse schemas can be generated from OLTP
Networks
Sites Parameters
Methods Time
Air_ObsSQL Script
Generation of the Front End:
Periodically On Demand

Wrap-up of back-end OLTP design and implementation Optimized for import, transformation, and quality control
Robust, general-purpose data ingest routines
Faster turnaround time for new datasets
Provision for more detailed metadata
Wrap-up of front-end Data Warehouse design Optimized for query and output
Online Analytical Processing (OLAP)
Multidimensional analysis, pivot table analysis
Analysis tools will be usable with ALL datasets, not just IMPROVE
Facilitates analysis across multiple datasets
Common set of parameters for all datasets
Provides much more flexible output options

Site Browser for exploring monitoring site metadata
Popup Parameter and Variable metadata
New Excel Pivot Table output option
Improved query performance
Expanded error handling and reporting
Query Wizard Version 2 being designed

Sharper-looking maps
Dynamic layer display
Easier metadata browsing
Powerful data drill-down
More formatting options
Detailed legends
A large selection of layers
Faster site selection

Pie and doughnut charts
Bar & stacked bar charts
Line, curve, & area graphs
Scatter plots
Contour and surface charts
3D charts and graphs
Extensive formatting options
Easy-to-use chart controls
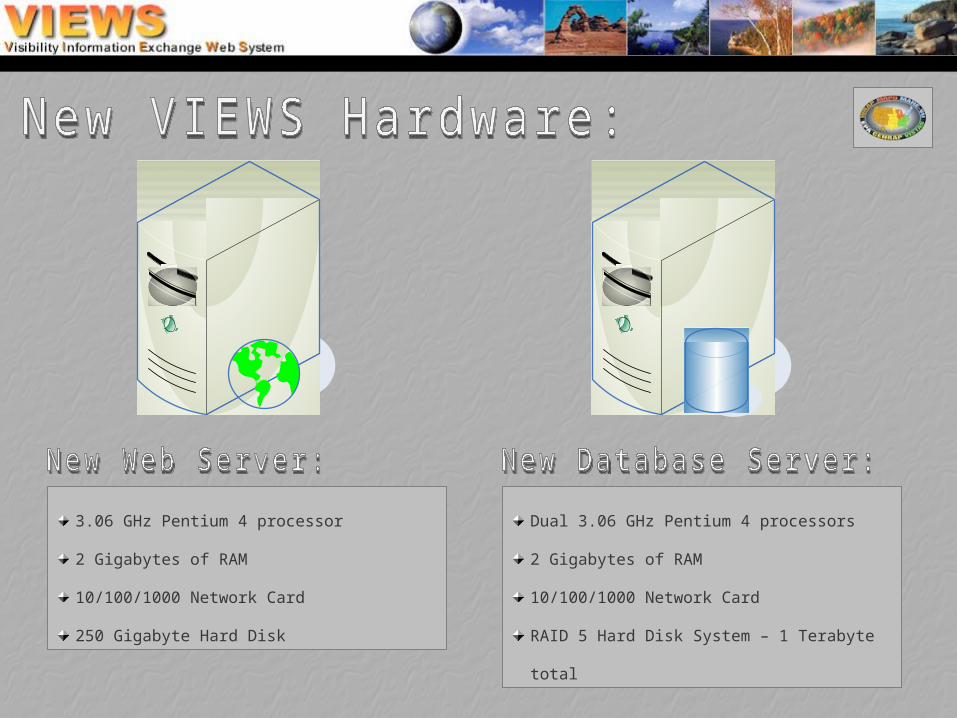
3.06 GHz Pentium 4 processor
2 Gigabytes of RAM
10/100/1000 Network Card
250 Gigabyte Hard Disk
Dual 3.06 GHz Pentium 4 processors
2 Gigabytes of RAM
10/100/1000 Network Card
RAID 5 Hard Disk System – 1 Terabyte total

ARS nephelometer, transmissometer
CASTNET drychem, vischem
EPA FRM frm data
EPA Speciation speciation data
IMPROVE aerosol, calculated variables, regional haze rule data
MOHAVE aerosol
PREVENT aerosol
REVEAL aerosol
SEAVS aerosol
SFU aerosol
NESCAUM aerosol
MOHAVE nephelometer, transmissometer
SEAVS nephelometer, transmissometer
BRAVO aerosol, nephelometer, transmissometer
SEARCH Continuous PM2.5, speciated aerosol, gaseous, surface met
SEARCH 24hr PM2.5, speciated aerosol
NPS Gaseous
GAViM PM2.5, speciated aerosol
Data Sets currently available from VIEWS:
Data Sets soon to be added to VIEWS (before Christmas 2003 *):

EPA AIRS PM10
NEPART PM2.5, speciatPM2.5, speciated aerosoled aerosol
Trans-Boundary Monitoring Network (TBDM) PM10, PM2.5, SO2, NOx, meteorology
Surface Meteorology meteorology and visual range
EPA AIRS Gaseous O3, CO, SO2, NO2
NAPS PM2.5, speciated aerosol
NADP/NTN Wet deposition ions
UV Radiation
EPA Supersites aerosol, gaseous, met, SO2, NOX, PM10, VOC, CO
AIRS Emissions
Modeling Data and Output(?)
Other Emissions

Optimize data storage and retrieval mechanisms
Further refine and automate data ingestion and transformation tools
Identify and acquire additional data sets Special studies and projects
University programs and research
International data sets
Modeling data and output results (?)
Allow online submission of data sets – per standardized format Directory Interchange Format (DIF) – from NASA’s GCMD
NARSTO’s Data Exchange Template
Implement an easily searchable catalog of offsite data resources ISO 11179: Specification and Standardization of Data Elements
Dublin Core standard by Online Computer Library Center (OCLC)
Develop and emphasize the “Exchange” nature of VIEWS

Additional searching & filtering options
Faster loading of metadata
Easier and faster query building
Multidimensional interface model
Easier, more powerful results formatting
Large query handling – no timeouts
Email notification of query results
Saving query templates and style options

Consolidated Excel Pivot Tables, Pivot Charts, and Spreadsheets
Presentation-ready Regional Haze Rule compliance reports
Conversion of results to XML
Custom Reports: Choose titles, text, graphics, results, and arrange them
Online Analysis Server Cubes: Explore your data in multiple dimensions
Annual Summary tools available for ALL datasets – not just IMPROVE

FTP Access with minimum data description
Upload data with simple “ReadMe”-type data description
Download data by browsing our FTP site
Minimum development time required
No tools available
Website User Interface with more formal data description
Upload and download data via a simple web interface
Describe data using an accepted standard for metadata, perhaps NASA’s D.I.F.
Perhaps some tool availability
More sophisticated Web Interface with automated data description
Upload and download data via a helpful web interface
Describe data using an automated, fill-in-the-blanks-type interface
Use VIEWS tools to display and analyze data

Extensive Help, Tutorials, and Step-by-step guidance
Integrated annotations and popup tool tips
Context-sensitive FAQs and User Message Boards
Instant messaging for immediate help
Online Regional Haze Rule guidance
Conference calls and training sessions for new tools

Integrated, easy-to-use data “dashboard” – all tools from one interface
Automatic, on-demand contour map generation
Full integration of dynamic charting and graphing features
Multithreaded, asynchronous query processing
Integration with CAPITA CATT and Gridder tools
Direct connection to AIRS/AQS for faster, more complete data updates
XML Web Services for query submission and map products
Expose data model for ad hoc queries

Thank You.http://vista.cira.colostate.edu/views
Conclusion and call for participation…
Visit our website: http://vista.cira.colostate.edu/views
Sign up for our newsletter
Become a member of our guest list
Access our data, use our tools, and check back frequently…
Give us your comments, suggestions, and feedback ( Really!! …and often.)