What is the color of that music performance? - TMH KTH :: Home
4
WHAT IS THE COLOR OF THAT MUSIC PERFORMANCE? Roberto Bresin KTH – Royal Institute of Technology, Dept. of Speech Music and Hearing Stockholm, Sweden ABSTRACT The representation of expressivity in music is still a fairly unexplored field. Alternative ways of representing musi- cal information are necessary when providing feedback on emotion expression in music such as in real-time tools for music education, or in the display of large music databases. One possible solution could be a graphical non-verbal rep- resentation of expressivity in music performance using co- lor as index of emotion. To determine which colors are most suitable for an emotional expression, a test was run. Subjects rated how well each of 8 colors and their 3 nu- ances corresponds to each of 12 music performances ex- pressing different emotions. Performances were played by professional musicians with 3 instruments, saxophone, guitar, and piano. Results show that subjects associated different hues to different emotions. Also, dark colors were associated to music in minor tonality and light col- ors to music in major tonality. Correspondence between spectrum energy and color hue are preliminary discussed. 1. INTRODUCTION Studies on synesthetic experiences related to music per- ception have reported non-consistent association between music, usually music events, and colors [1]. We want to investigate if these differences could be explained in terms of expressive contents of music performances and conse- quently if we could use color as one indicator of expres- sivity in music performance. This work is part of a research project 1 that aims to develop a computer system for teaching students to play expressively. Part of the system is a tool for automatic extraction of acoustic cues that are considered important for the analysis of performance expression. These cues in- clude duration, sound level, articulation, and vibrato. For example, staccato articulation may be typical of a happy performance, while legato articulation may be typical of a tender performance. This tool was presented at ICMC 2002 in G ¨ oteborg [2]. It is important that music students are trained to con- trol acoustic cues effectively to achieve different expres- sive performances. Results from analysis of acoustic cues can be presented to the performer in a variety of ways, for example in term of graphs or tables representing mean values and deviation curves after a post-processing of the 1 Feedback-learning of Musical Expressivity (Fee-Me): http://www.psyk.uu.se/hemsidor/musicpsy/ performance. This can be useful for a more analytical un- derstanding of what the performer did. A different display is needed in the case of a system that provides real-time feedback of musicians’ expressive intention. In order to map intended emotions a visual display was designed in which emotions are mapped to colors. For a meaningful association of intended emotions in music performance to colors, an experiment was needed. This is presented in the following sections. 2. METHOD An experiment was designed in which it was tested how subjects associated different emotionally expressive per- formances to different colors. The experiment was con- ducted with the help of a specially designed computer pro- gram. 2.1. Music examples For this experiment performances of two melodies were used, Brahms’ 1st theme of the poco allegretto 3rd move- ment Symphony Op.90 No.3, in C minor, and Haydn’s theme from first movement of Quartet in F major for strings, Op. 74 No. 2. In a previous experiment [4] the two me- lodies were performed with piano, guitar, and saxophone by nine professional musicians, three musicians for each instrument. The musicians were asked to perform the two melodies with twelve different emotional intentions, namely happiness, love, contentment, pride, curiosity, indifference, sadness, fear, shame, anger, jealousy, and disgust. In a lis- tening test, subjects were asked to rate these performances with regards to their emotional character. Analyzing the results from this listening test it emerged that some per- formers were better in communicating certain emotions. The performances that received the highest rating for each instrument and each emotion were chosen for the present experiment. Thus the musical material for the experiment consisted in twelve performances for each instrument and each melody (12 x 3 x 2) for a total of 72 performances. 2.2. Colors Colors were used for rating each performance. Colors were coded using the Hue Saturation Brightness (HSB) scheme 2 . Hue is the actual color. Saturation is the purity 2 See http://www.cecs.csulb.edu/˜jewett/colors/ hsb.html
Transcript of What is the color of that music performance? - TMH KTH :: Home

WHAT IS THE COLOR OF THAT MUSIC PERFORMANCE?
Roberto BresinKTH – Royal Institute of Technology, Dept. of Speech Music and Hearing
Stockholm, Sweden
ABSTRACT
The representation of expressivity in music is still a fairlyunexplored field. Alternative ways of representing musi-cal information are necessary when providing feedback onemotion expression in music such as in real-time tools formusic education, or in the display of large music databases.One possible solution could be a graphical non-verbal rep-resentation of expressivity in music performance using co-lor as index of emotion. To determine which colors aremost suitable for an emotional expression, a test was run.Subjects rated how well each of 8 colors and their 3 nu-ances corresponds to each of 12 music performances ex-pressing different emotions. Performances were playedby professional musicians with 3 instruments, saxophone,guitar, and piano. Results show that subjects associateddifferent hues to different emotions. Also, dark colorswere associated to music in minor tonality and light col-ors to music in major tonality. Correspondence betweenspectrum energy and color hue are preliminary discussed.
1. INTRODUCTION
Studies on synesthetic experiences related to music per-ception have reported non-consistent association betweenmusic, usually music events, and colors [1]. We want toinvestigate if these differences could be explained in termsof expressive contents of music performances and conse-quently if we could use color as one indicator of expres-sivity in music performance.
This work is part of a research project 1 that aims todevelop a computer system for teaching students to playexpressively. Part of the system is a tool for automaticextraction of acoustic cues that are considered importantfor the analysis of performance expression. These cues in-clude duration, sound level, articulation, and vibrato. Forexample, staccato articulation may be typical of a happyperformance, while legato articulation may be typical ofa tender performance. This tool was presented at ICMC2002 in Goteborg [2].
It is important that music students are trained to con-trol acoustic cues effectively to achieve different expres-sive performances. Results from analysis of acoustic cuescan be presented to the performer in a variety of ways,for example in term of graphs or tables representing meanvalues and deviation curves after a post-processing of the
1 Feedback-learning of Musical Expressivity (Fee-Me):http://www.psyk.uu.se/hemsidor/musicpsy/
performance. This can be useful for a more analytical un-derstanding of what the performer did. A different displayis needed in the case of a system that provides real-timefeedback of musicians’ expressive intention. In order tomap intended emotions a visual display was designed inwhich emotions are mapped to colors. For a meaningfulassociation of intended emotions in music performance tocolors, an experiment was needed. This is presented in thefollowing sections.
2. METHOD
An experiment was designed in which it was tested howsubjects associated different emotionally expressive per-formances to different colors. The experiment was con-ducted with the help of a specially designed computer pro-gram.
2.1. Music examples
For this experiment performances of two melodies wereused, Brahms’ 1st theme of the poco allegretto 3rd move-ment Symphony Op.90 No.3, in C minor, and Haydn’stheme from first movement of Quartet in F major for strings,Op. 74 No. 2. In a previous experiment [4] the two me-lodies were performed with piano, guitar, and saxophoneby nine professional musicians, three musicians for eachinstrument. The musicians were asked to perform the twomelodies with twelve different emotional intentions, namelyhappiness, love, contentment, pride, curiosity, indifference,sadness, fear, shame, anger, jealousy, and disgust. In a lis-tening test, subjects were asked to rate these performanceswith regards to their emotional character. Analyzing theresults from this listening test it emerged that some per-formers were better in communicating certain emotions.The performances that received the highest rating for eachinstrument and each emotion were chosen for the presentexperiment. Thus the musical material for the experimentconsisted in twelve performances for each instrument andeach melody (12 x 3 x 2) for a total of 72 performances.
2.2. Colors
Colors were used for rating each performance. Colorswere coded using the Hue Saturation Brightness (HSB)scheme 2 . Hue is the actual color. Saturation is the purity
2 See http://www.cecs.csulb.edu/˜jewett/colors/hsb.html
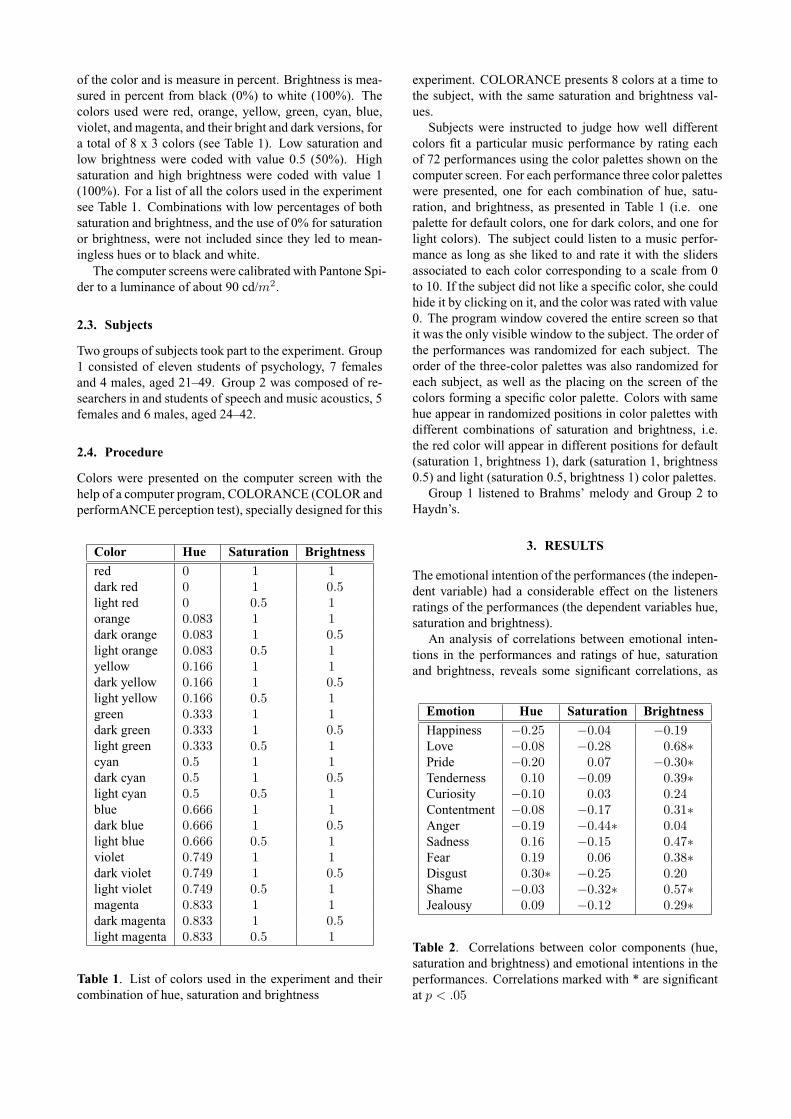
of the color and is measure in percent. Brightness is mea-sured in percent from black (0%) to white (100%). Thecolors used were red, orange, yellow, green, cyan, blue,violet, and magenta, and their bright and dark versions, fora total of 8 x 3 colors (see Table 1). Low saturation andlow brightness were coded with value 0.5 (50%). Highsaturation and high brightness were coded with value 1(100%). For a list of all the colors used in the experimentsee Table 1. Combinations with low percentages of bothsaturation and brightness, and the use of 0% for saturationor brightness, were not included since they led to mean-ingless hues or to black and white.
The computer screens were calibrated with Pantone Spi-der to a luminance of about 90 cd/m2.
2.3. Subjects
Two groups of subjects took part to the experiment. Group1 consisted of eleven students of psychology, 7 femalesand 4 males, aged 21–49. Group 2 was composed of re-searchers in and students of speech and music acoustics, 5females and 6 males, aged 24–42.
2.4. Procedure
Colors were presented on the computer screen with thehelp of a computer program, COLORANCE (COLOR andperformANCE perception test), specially designed for this
Color Hue Saturation Brightness
red 0 1 1dark red 0 1 0.5light red 0 0.5 1orange 0.083 1 1dark orange 0.083 1 0.5light orange 0.083 0.5 1yellow 0.166 1 1dark yellow 0.166 1 0.5light yellow 0.166 0.5 1green 0.333 1 1dark green 0.333 1 0.5light green 0.333 0.5 1cyan 0.5 1 1dark cyan 0.5 1 0.5light cyan 0.5 0.5 1blue 0.666 1 1dark blue 0.666 1 0.5light blue 0.666 0.5 1violet 0.749 1 1dark violet 0.749 1 0.5light violet 0.749 0.5 1magenta 0.833 1 1dark magenta 0.833 1 0.5light magenta 0.833 0.5 1
Table 1. List of colors used in the experiment and theircombination of hue, saturation and brightness
experiment. COLORANCE presents 8 colors at a time tothe subject, with the same saturation and brightness val-ues.
Subjects were instructed to judge how well differentcolors fit a particular music performance by rating eachof 72 performances using the color palettes shown on thecomputer screen. For each performance three color paletteswere presented, one for each combination of hue, satu-ration, and brightness, as presented in Table 1 (i.e. onepalette for default colors, one for dark colors, and one forlight colors). The subject could listen to a music perfor-mance as long as she liked to and rate it with the slidersassociated to each color corresponding to a scale from 0to 10. If the subject did not like a specific color, she couldhide it by clicking on it, and the color was rated with value0. The program window covered the entire screen so thatit was the only visible window to the subject. The order ofthe performances was randomized for each subject. Theorder of the three-color palettes was also randomized foreach subject, as well as the placing on the screen of thecolors forming a specific color palette. Colors with samehue appear in randomized positions in color palettes withdifferent combinations of saturation and brightness, i.e.the red color will appear in different positions for default(saturation 1, brightness 1), dark (saturation 1, brightness0.5) and light (saturation 0.5, brightness 1) color palettes.
Group 1 listened to Brahms’ melody and Group 2 toHaydn’s.
3. RESULTS
The emotional intention of the performances (the indepen-dent variable) had a considerable effect on the listenersratings of the performances (the dependent variables hue,saturation and brightness).
An analysis of correlations between emotional inten-tions in the performances and ratings of hue, saturationand brightness, reveals some significant correlations, as
Emotion Hue Saturation Brightness
Happiness −0.25 −0.04 −0.19Love −0.08 −0.28 0.68∗Pride −0.20 0.07 −0.30∗Tenderness 0.10 −0.09 0.39∗Curiosity −0.10 0.03 0.24Contentment −0.08 −0.17 0.31∗Anger −0.19 −0.44∗ 0.04Sadness 0.16 −0.15 0.47∗Fear 0.19 0.06 0.38∗Disgust 0.30∗ −0.25 0.20Shame −0.03 −0.32∗ 0.57∗Jealousy 0.09 −0.12 0.29∗
Table 2. Correlations between color components (hue,saturation and brightness) and emotional intentions in theperformances. Correlations marked with * are significantat p < .05

shown in Table 2. Significant correlations were foundfor brightness and the expressive performances performedwith love, pride, tenderness, contentment, sadness, andfear. Also significant was the correlation between satura-tion and the intentions anger and shame. There was onlyone significant correlation for hue, with disgust.
In the following a more detailed analysis of the effectof the hue, saturation and brightness is presented.
3.1. Hue
If we look in detail to the average color profile for eachinstrument and each emotion, we find that saxophone andguitar have very similar profiles within the same melodyand emotion. As an example see Figure 1. For saxophoneand guitar the dark versions of colors red, orange, blue, vi-olet received higher average preferences, while for pianoperformances their light versions get higher rates (exceptfor violet). The color profiles for saxophone and guitardiffer from those of piano, probably because its lack ofpossibilities of controlling timbre features such as attacktime and vibrato. In fact these are acoustic cues that areimportant in the communication of emotions, e.g. a slowattack time and vibrato are characteristic of a performance
Figure 1. Color palettes resulting from the mean rating ofthe performances with expressive intention “shame”
Emotion Hue
Happiness 0.167 (Yellow)Love 0.667 (Blue), 0.75 (Violet)Pride 0.167 (Yellow)Tenderness 0.75 (Violet)Curiosity 0.5 (Cyan)Contentment 0.083 (Orange)Anger 0 (Red)Sadness 0.75 (Violet)Fear 0.667 (Blue)Disgust 0.75 (Violet)Shame 0.083 (Orange)Jealousy 0 (Red)
Table 3. Hue values that received highest mean rating foreach emotional expression
portraying sadness while fast attack time is typical of an-gry performances [3].
In the case of “shame”, if we consider only the hue pa-rameter than orange is the color mostly associated to thisemotional intention. Similarly, table 3 presents the huevalues that received highest mean rating for each emo-tional expression. Results were independent from the me-lody while some differences emerged between instruments.
3.2. Saturation
A general observed tendency for saturation is that the mi-nor tonality composition (Brahms) tends to be associatedto colors with higher saturation (dark and default colors).This tendency is independent from the instrument.
When taking into account also the instrument variable,it emerges that Brahms melody ratings follow a differenttrend for piano, for which colors with lower saturationlevel seem to be preferred.
3.3. Brightness
A general observed tendency for brightness is that the mi-nor tonality composition (Brahms) tends to be associatedto dark colors, and the major tonality melody (Haydn) tolight colors. This tendency is independent from the instru-ment.
4. DISCUSSION
It is important to remember that subjects participating inthe experiment were not told anything about the emotions,they rated the performances using the colors that best fitthe particular expressive performance.
The association of brighter colors to positive emotionsand of darker colors to negative ones has been found inprevious studies. This was also confirmed in an exper-iment in which young children were asked to associatecolors to emotions [8]. Results from the present study, i.e.the association of brighter colors to the Haydn melody and

of darker colors to the Brahms melody, confirm the classi-cal correspondence of positive emotions to major tonalityand negative emotions to minor tonality [6]. The new con-tribution is that this association was obtained using colorsinstead of word lables or icons.
One important parameter in the identification of emo-tion in music performance is the Sound Pressure Level(SPL) at frequencies above 1000 Hz. Since each melody isabout 30 seconds long and the subjects are exposed to itsdifferent versions for on average 40 minutes, it appearedto be interesting to look at the long time average spec-trum (LTAS) of the performances, it would probably showif there was a correlation between colors chosen by sub-jects and the SPL in the spectrum. The LTAS for eachof the twelve performances of Haydn melody performedwith saxophone is plotted in Figure 2. The angry and jeal-ous performances have higher SPL in the spectrum at fre-quencies above 1000 Hz and the love performance has thelowest SPL above 1000 Hz. This corresponds with thepreferred hues for these performances, i.e. red for angryand jealous, and blue and violet for love. Further inves-tigations on the the relation between LTAS and color huehave to be done in the future in order to see if there isa consistent association between SPL and hue. If sucha relationship were demonstrated, it would be interestingto rate perception of electroacoustic music using colors,since electroacoustic music usually explores new dimen-sions in the timbre space.
Results from the present study show that subjects in-deed used different color profiles for classifying the samepiece of music, but these differences depended mainly onthe performance (and on the instrument). This result couldraise the question of whether differences reported in stud-ies about color hearing could be explained in terms of dif-ferences in the expressive content of performances.
The results from this work could be applied in the de-sign of an application providing feedback about a perfor-mance. A possible application is a graphical interfaceshowing acoustic cues extracted from expressive perfor-mances. Combinations of these cues correspond to a spe-cific emotion intention that can be represented in termsof colors. In previous studies it has been demonstratedthat auditory–visual interaction speeds stimuli discrimi-nation capabilities [5] and that the surface color of anobject affects its recognition [7]. Therefore, an interac-tive display in which expressivity in music is representedby shape, size, position, and color of objects on a screen(e.g. in a portable device) is expected to speed the processof learning and identification. For example, users couldlearn to associate red hue and square shapes to angry per-formances, and blue hue and round shapes to sad perfor-mances. A PD tool implementing this hypothesis has beendesigned and it will be tested in future usability tests.
5. ACKNOWLEDMENTS
The present work has been supported by the previouslymention Feel-Me project and by the EU funded S2S2 Co-
0 1000 2000 3000 4000 5000 6000 7000-70
-60
-50
-40
-30
-20
-10
0
10
LTAS
Love
Pride
Jealousy
Tenderness
Fear
Shame
Disgust
Contentment
Happiness
Anger
Curiousity
Sadness
Hz
dB
Figure 2. Long Time Average Spectra (LTAS) of saxo-phone performances with 12 emotional intentions
ordinating action, HUMAINE Network of Excellence, andConGAS COST 287 Action.
6. REFERENCES
[1] Cytowic RE (1989) Synesthesia: A Union of theSenses. Springer Verlag: New York.
[2] Friberg A, Schoonderwaldt E, Juslin PN, Bresin R(2002) “Automatic real-time extraction of musical ex-pression”. Proc. of the International Computer MusicConference - ICMC 2002, Goteborg, 365–367
[3] Juslin PN (2001) “Communicating emotion in musicperformance: A review and a theoretical framework”.in Juslin PN and Sloboda JA (eds)Music and emotion:Theory and research, OUP: New York, 305–333
[4] Juslin PN, Lindstrom E (2004) “Musical expressionof emotions: Modeling composed and performed fea-tures”. Manuscript in preparation.
[5] Marks LE (1987) “On cross-modal similarity:Auditory-visual interactions in speeded discrimina-tion”. J. of Experimental Psychology: Human Percep-tion and Performance, 13, 384–394
[6] Meyer LB (1956) Emotion and meaning in music. theUniversity of Chicago Press: Chicago and London.
[7] Tanaka J, Weiskopf D, Williams P (2001) “The roleof color in high-level vision”. Trends in Cognitive Sci-ences, 5:5, 211–215
[8] Zentner MR (2001) “Preferences for colours andcolour-emotion combinations in early childhood”.Developmental Science, 4:4, 389–398