What is MPC from income shock? Critical for getting the multiplier started Vast literature on...
40
What is MPC from income shock? • Critical for getting the multiplier started • Vast literature on failure of LC/PIH prediction of response to temporary income – Euler equation: Hall, Campbell- Mankiw – Specific income shocks
-
Upload
winfred-gaines -
Category
Documents
-
view
215 -
download
1
Transcript of What is MPC from income shock? Critical for getting the multiplier started Vast literature on...

What is MPC from income shock?
• Critical for getting the multiplier started• Vast literature on failure of LC/PIH prediction
of response to temporary income– Euler equation: Hall, Campbell-Mankiw– Specific income shocks

Specific income shocks
Response to windfalls or anticipated income •Wilcox, Income tax refunds•Parker, Hitting the FICA ceiling•Stephens, Receipt of Social Security check•Souleles, Tuition payments
– (Christian, labor supply response)
•Hsieh, Alaska oil paymentsSee literature review in Shapiro-Slemrod (2003)

Survey Approach
• Specific policy
• Estimate MPC, not GE effects
• Clearly endogenous
• Clearly income, not price/allocative
• What was household response to a specific policy at a specific time?

Shapiro-Slemrod surveys
1992: Change in timing of withholding
2001: Rebate
2008: Rebate
2009: Making Work Pay credit (withholding)
2011: Social Security payroll tax holiday (withholding)—In field this spring
Recent work joint with Claudia Sahm, FRB
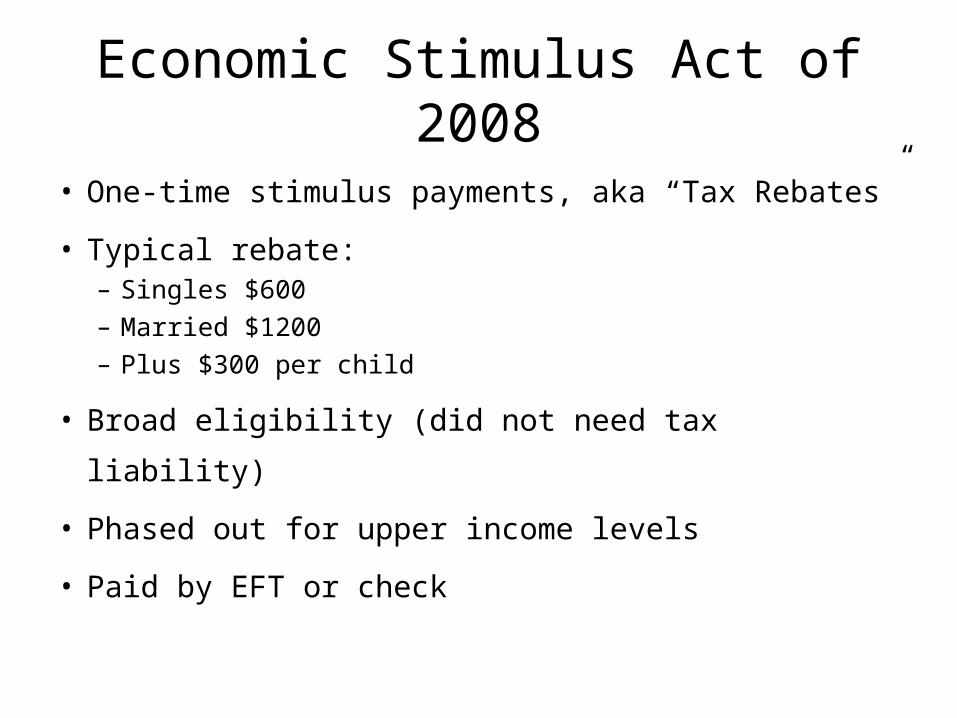
Economic Stimulus Act of 2008
• One-time stimulus payments, aka “Tax Rebates”
• Typical rebate:– Singles $600– Married $1200 – Plus $300 per child
• Broad eligibility (did not need tax liability)
• Phased out for upper income levels
• Paid by EFT or check

2008 Stimulus Payments
Large and distributed quickly
• $96 billion– 0.8% of annual personal income– 8.7% of annual Federal personal tax receipts
≈ one-month of income tax revenue
• Disbursed mainly in 2008:Q2
shapiro
96/CY 2008 personal income
shapiro
96 billion / CY 2008 Federal personal tax payments from NIPA table 3.2
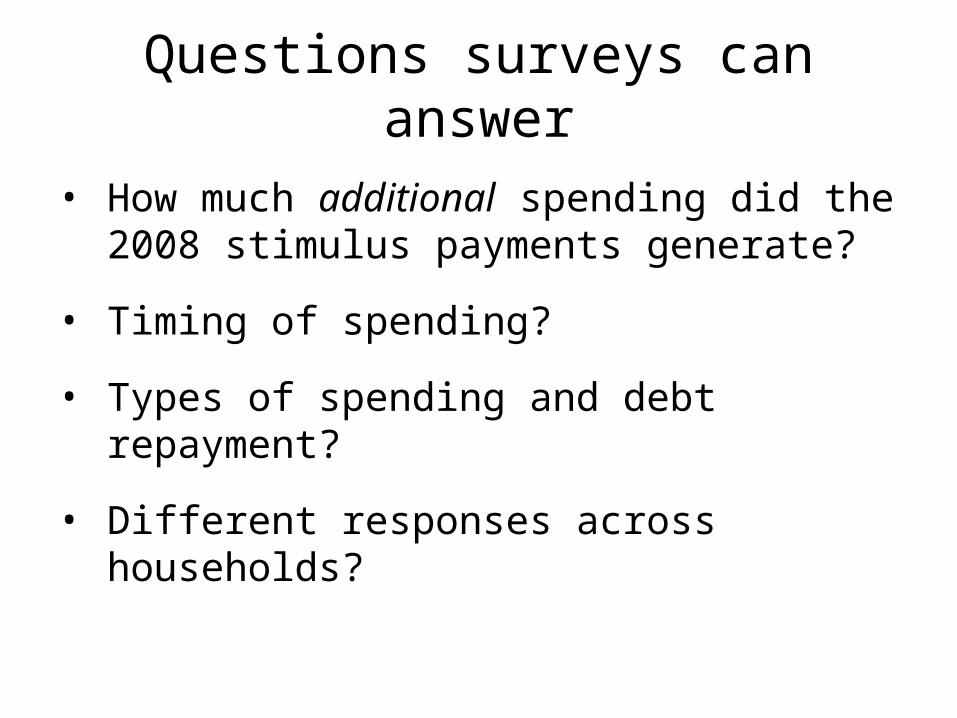
Questions surveys can answer
• How much additional spending did the 2008 stimulus payments generate?
• Timing of spending?
• Types of spending and debt repayment?
• Different responses across households?

Research Design
• Survey questions: Ask directly about response to rebates
• Follow-up questions and multivariate analysis: Assess the survey responses
• Validate survey responses: Compare to aggregate data on spending and debt
• Compare to other surveys
Key Survey Question
Thinking about your family’s financial situation this year, did the tax rebate lead you mostly to increase spending, mostly to increase saving, or mostly to pay off debt?
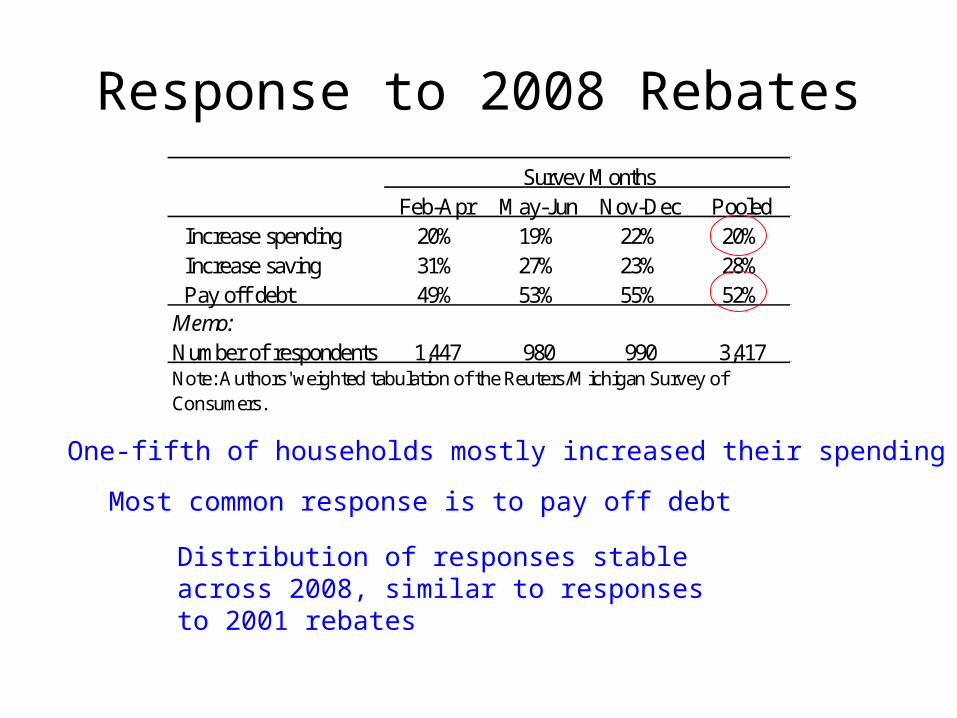
Response to 2008 Rebates
Feb-Apr May-Jun Nov-Dec Pooled Increase spending 20% 19% 22% 20% Increase saving 31% 27% 23% 28% Pay off debt 49% 53% 55% 52%Memo:Number of respondents 1,447 980 990 3,417
Survey Months
Note: Authors' weighted tabulation of the Reuters/Michigan Survey of Consumers.
One-fifth of households mostly increased their spending
Most common response is to pay off debt
Distribution of responses stable across 2008, similar to responses to 2001 rebates
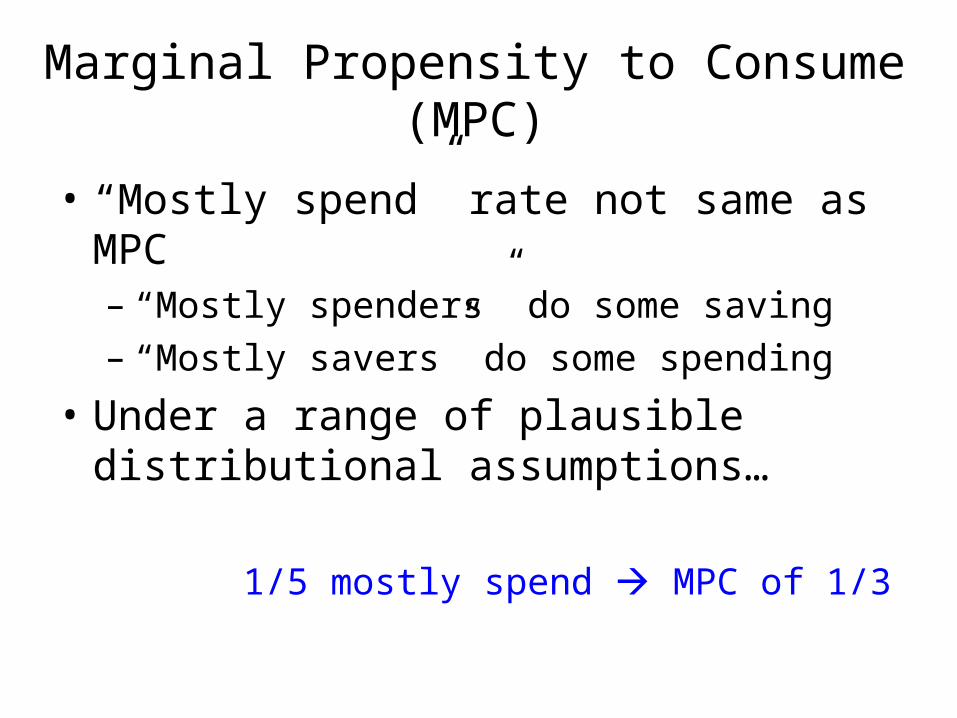
Marginal Propensity to Consume (MPC)
• “Mostly spend” rate not same as MPC– “Mostly spenders” do some saving– “Mostly savers” do some spending
• Under a range of plausible distributional assumptions…
1/5 mostly spend MPC of 1/3
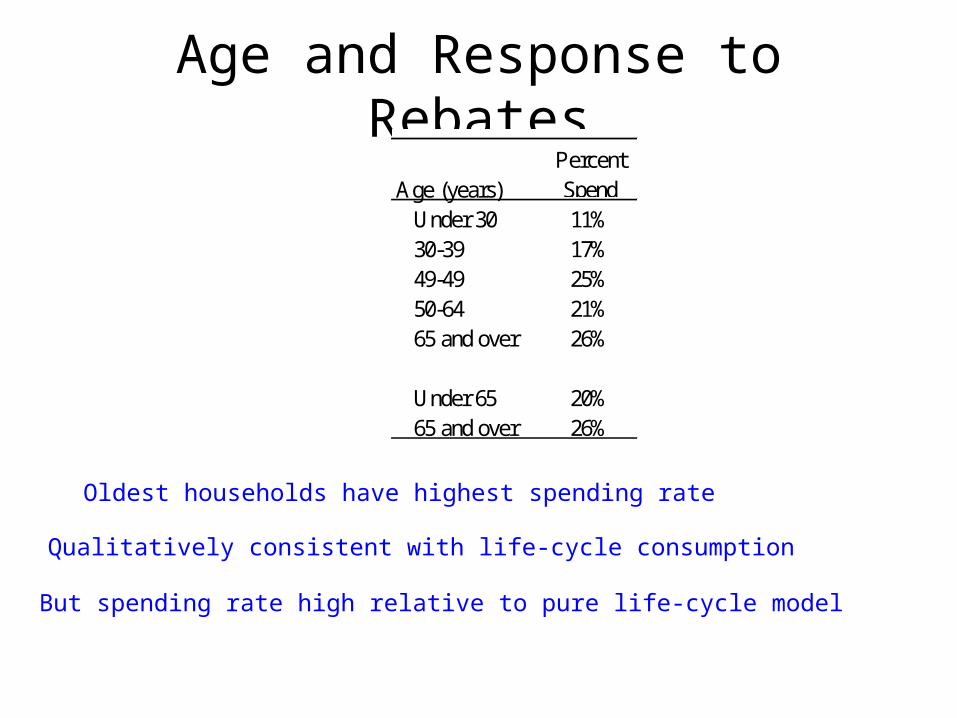
Age and Response to Rebates
Oldest households have highest spending rate
Qualitatively consistent with life-cycle consumption
But spending rate high relative to pure life-cycle model
Age (years) Under 30 11% 30-39 17% 49-49 25% 50-64 21% 65 and over 26%
Under 65 20% 65 and over 26%
Percent Spend

Income and Response to Rebates
Highest income households have highest spending rate
Results robust to multivariate analysis
Lower income households likely to pay off debt
Household IncomePercent Spend
$0 to $20,000 20%$20,001 to $35,000 22%$35,001 to $50,000 17%$50,001 to $75,000 17%More than $75,000 26%
Refused / Don't know income 30%

Income Expectations
Expected income growth strongly is strongly associated with spending
EstimateExpected income growth g g > 4% 3.9
(2.2) 0 < g < 4% 1.7
(2.2) -10% < g < 0 -0.8
(2.8) g < -10% -5.1
(2.8)
Multivariate Regression: Probability Mostly Spend

Summary of Age and Income Effects
• Being young or poor does not indicate high spending rate– Debt repayment modal for less well off
• Finding contrary to conventional wisdom– CBO, Hamilton Project (Jan 2008) white
papers
• Income growth a better indicator of liquidity-constrained behavior
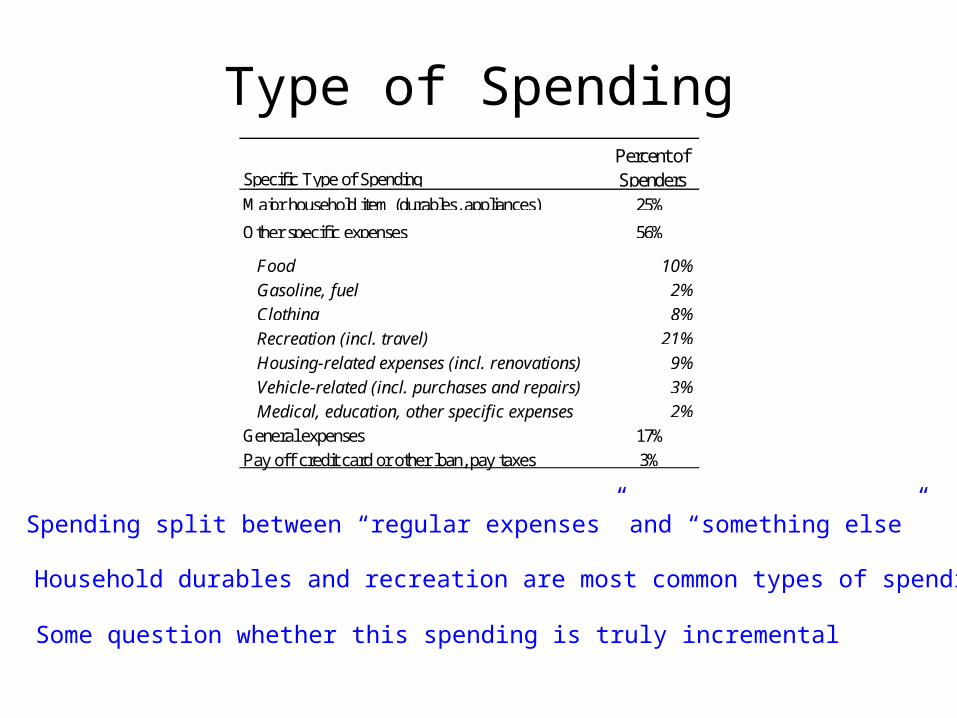
Type of Spending
Spending split between “regular expenses” and “something else”
Household durables and recreation are most common types of spending
Some question whether this spending is truly incremental
Specific Type of Spending
Major household item (durables, appliances) 25%
Other specific expenses 56%
Food 10%
Gasoline, fuel 2%
Clothing 8%
Recreation (incl. travel) 21%
Housing-related expenses (incl. renovations) 9%
Vehicle-related (incl. purchases and repairs) 3%
Medical, education, other specific expenses 2%
General expenses 17%
Pay off credit card or other loan, pay taxes 3%
Percent of Spenders
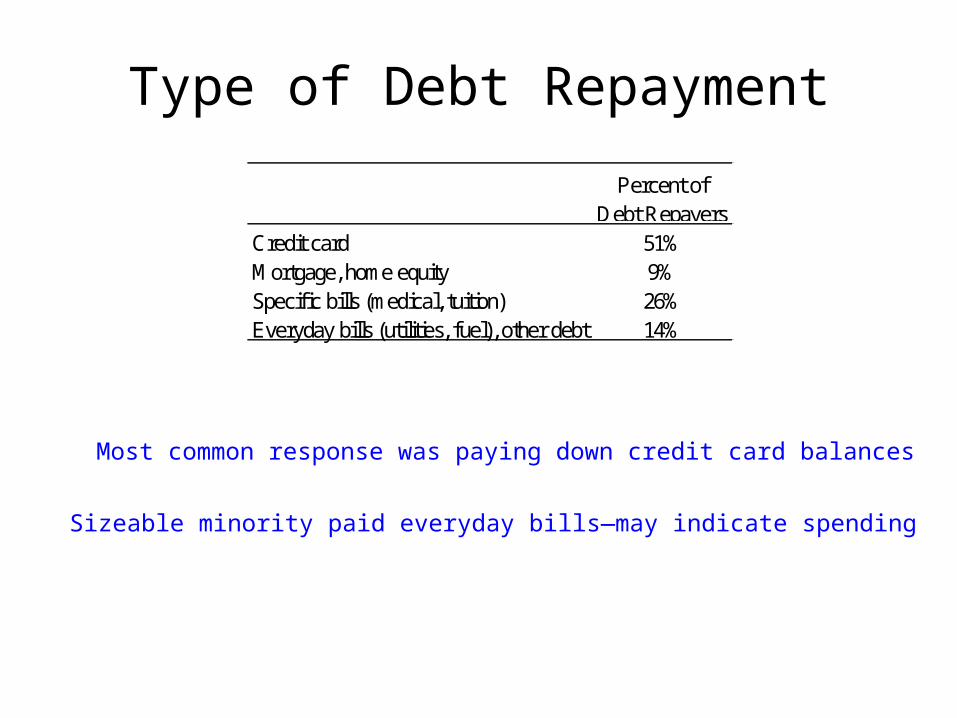
Type of Debt Repayment
Percent of Debt Repayers
Credit card 51%Mortgage, home equity 9%Specific bills (medical, tuition) 26%Everyday bills (utilities, fuel), other debt 14%
Most common response was paying down credit card balances
Sizeable minority paid everyday bills—may indicate spending

Using Survey Data for Aggregate Implications
• Use survey data to estimate– MPC (implied by “mostly spend rate”)– Timing of spending
• Use aggregate data– Level and timing of aggregate disbursements
• Compare survey estimate to – Actual spending and saving– Debt levels
• Direct effect only: No GE/multiplier effects
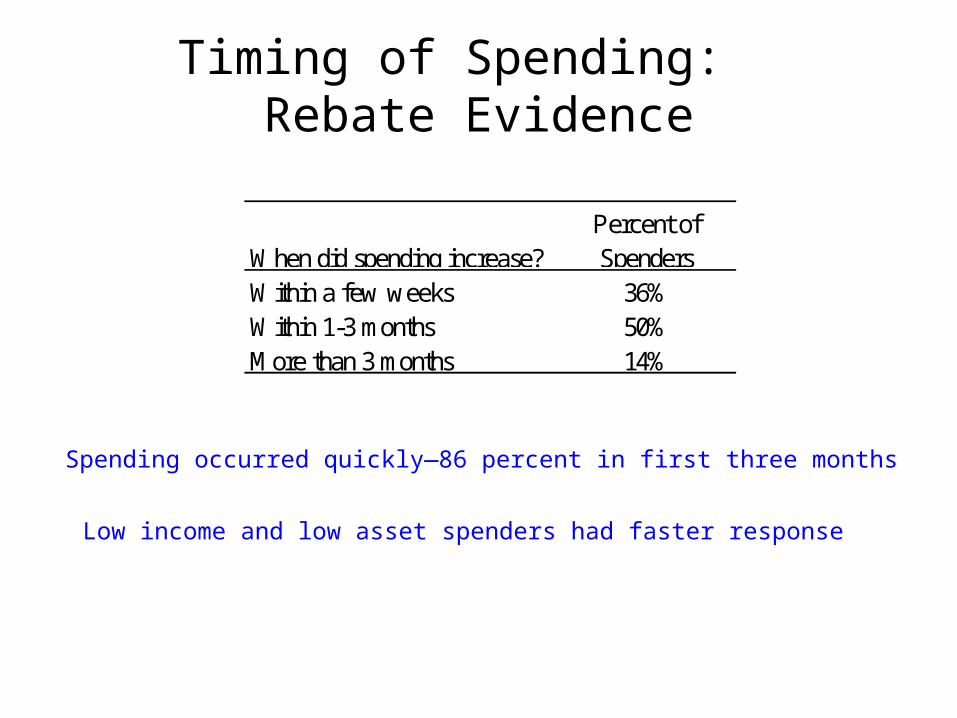
Timing of Spending: Rebate Evidence
Spending occurred quickly—86 percent in first three months
Low income and low asset spenders had faster response
When did spending increase?Percent of Spenders
Within a few weeks 36%Within 1-3 months 50%More than 3 months 14%

2
48
28
14
4
0
10
20
30
40
50
60
April May June July Aug-Dec
Bill
ions
of
Dol
lars
(m
onth
ly r
ate)
Disbursements of Rebates: Aggregate Data

Personal Saving Rate
Jump in the saving rate in spring 2008 mainly reflects boost to income
Saving rate would have risen steadily without rebates
0
1
2
3
4
5
6
Jan-08 Apr-08 Jul-08 Oct-08 Jan-09
Pers
onal
Sav
ing
Rat
e, P
erce
nt
Actual Excludes Rebate Income and Rebate Spending

-2
-1
0
1
2
3
2008Q1 2008Q2 2008Q3 2008Q4
Per
cen
t (a
nn
ual
rat
e)
Survey-based estimate of contribution of rebate
Rebate’s Effect on Spending Growth:
Survey-based Evidence
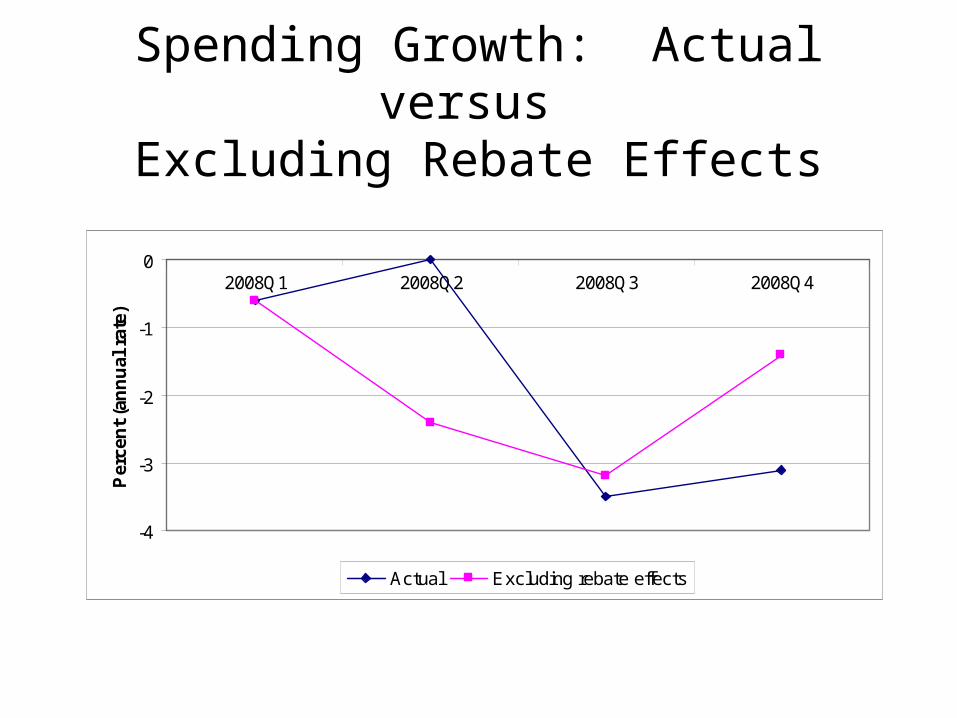
Spending Growth: Actual versus Excluding Rebate Effects
-4
-3
-2
-1
02008Q1 2008Q2 2008Q3 2008Q4
Per
cen
t (a
nn
ual
rat
e)
Actual Excluding rebate effects
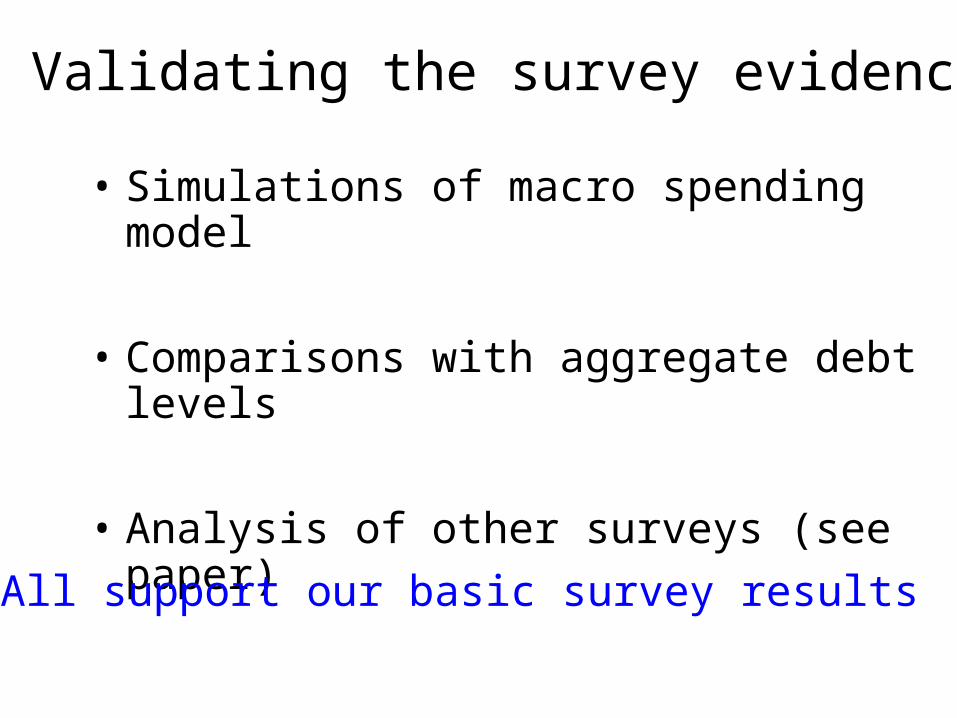
Validating the survey evidence
• Simulations of macro spending model
• Comparisons with aggregate debt levels
• Analysis of other surveys (see paper)
All support our basic survey results

Model Simulation
Simple FRB consumption model:• Dynamic error correction model of
consumption growth• Explanatory variables:
– Disposable income (excluding rebate)– Net worth– Federal Funds rate– Consumer sentiment
• Compare actual and simulated data
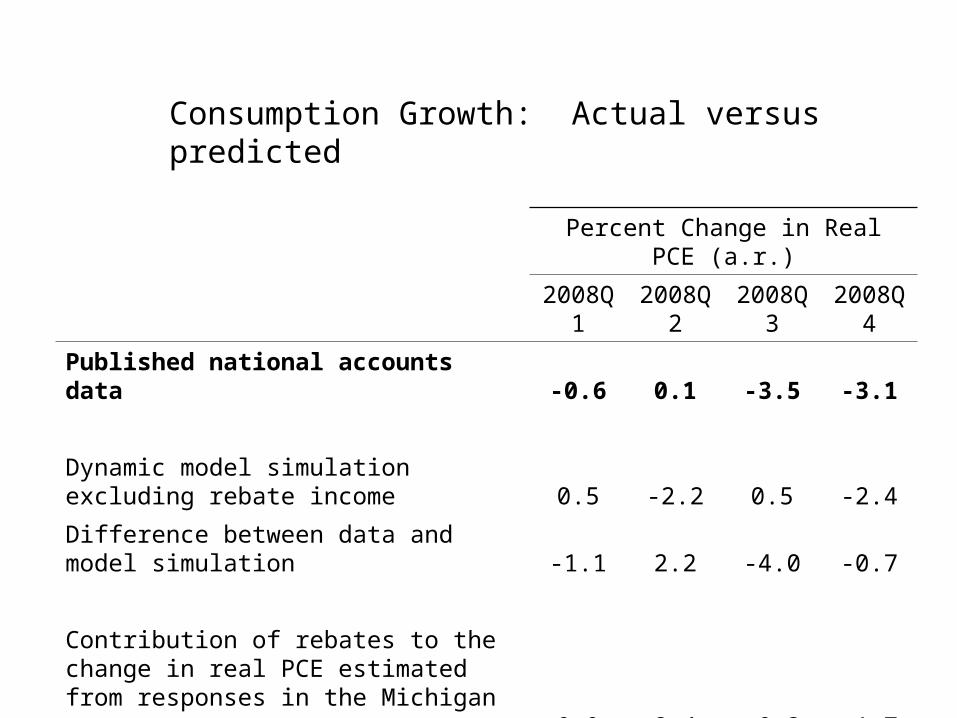
Percent Change in Real PCE (a.r.)
2008Q1 2008Q2 2008Q3 2008Q4
Published national accounts data -0.6 0.1 -3.5 -3.1
Dynamic model simulation excluding rebate income 0.5 -2.2 0.5 -2.4
Difference between data and model simulation -1.1 2.2 -4.0 -0.7
Contribution of rebates to the change in real PCE estimated from responses in the Michigan survey 0.0 2.4 -0.3 -1.7
Consumption Growth: Actual versus predicted
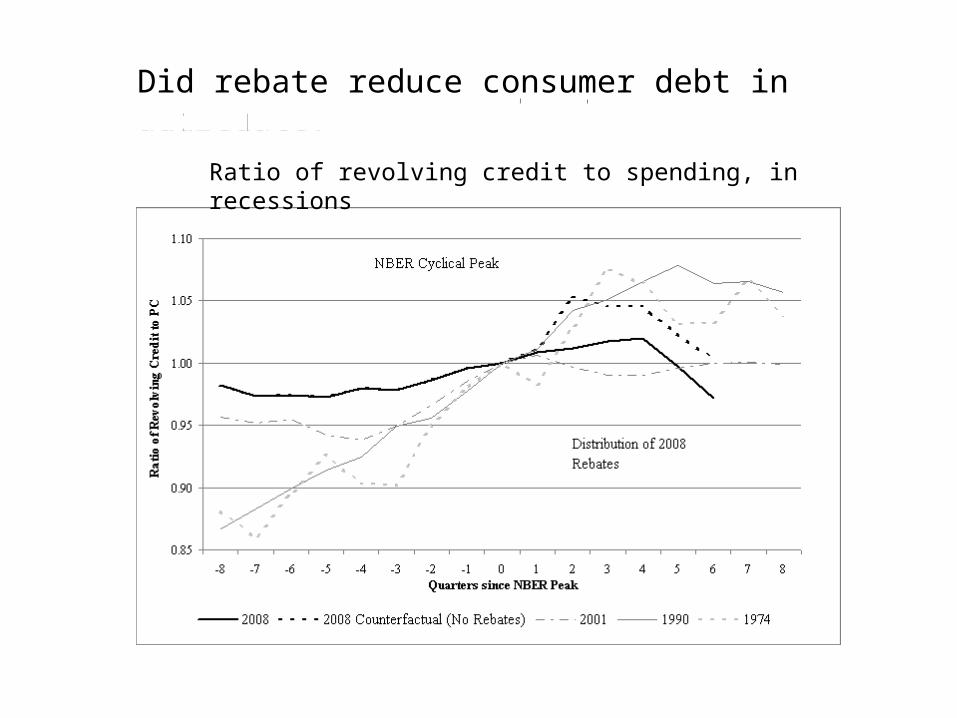
Did rebate reduce consumer debt in aggregate?
Ratio of revolving credit to spending, in recessions
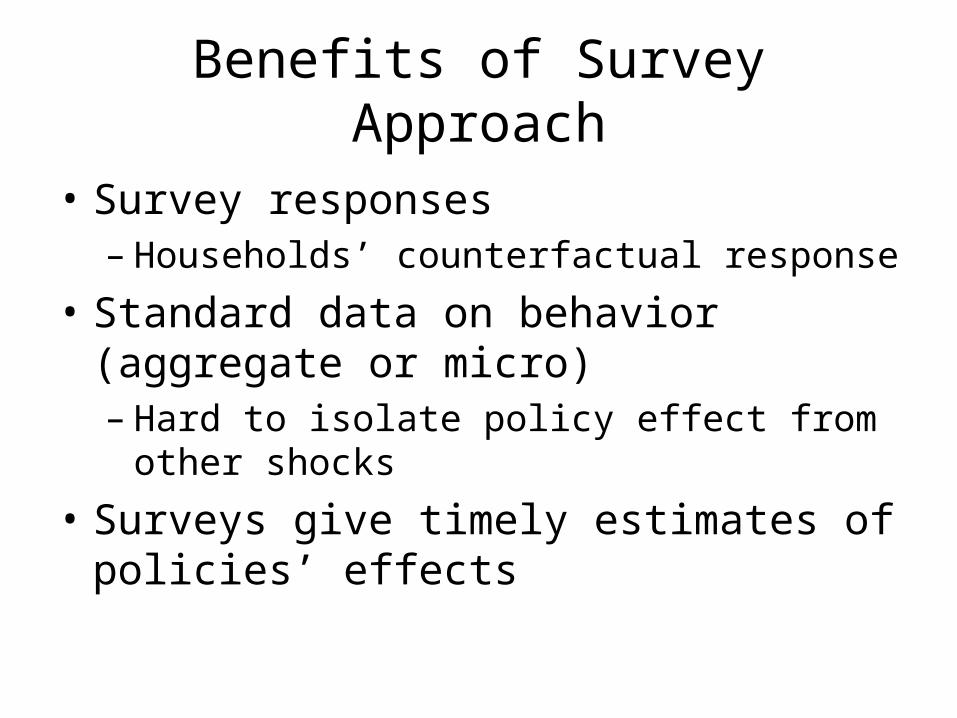
Benefits of Survey Approach
• Survey responses– Households’ counterfactual response
• Standard data on behavior (aggregate or micro) – Hard to isolate policy effect from other
shocks
• Surveys give timely estimates of policies’ effects

Implications for Fiscal Policy
• Recent rebates have had modest spending rates
• Low “bang for buck”
• Large rebates nonetheless had noticeable temporary effect on spending
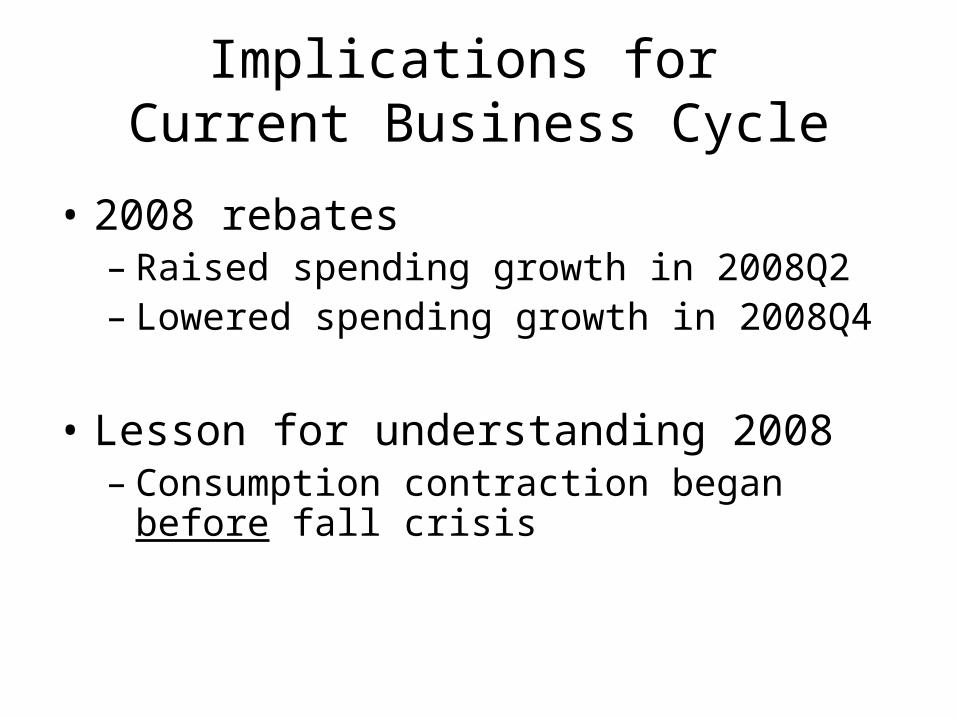
Implications for Current Business Cycle
• 2008 rebates– Raised spending growth in 2008Q2– Lowered spending growth in 2008Q4
• Lesson for understanding 2008– Consumption contraction began before fall
crisis
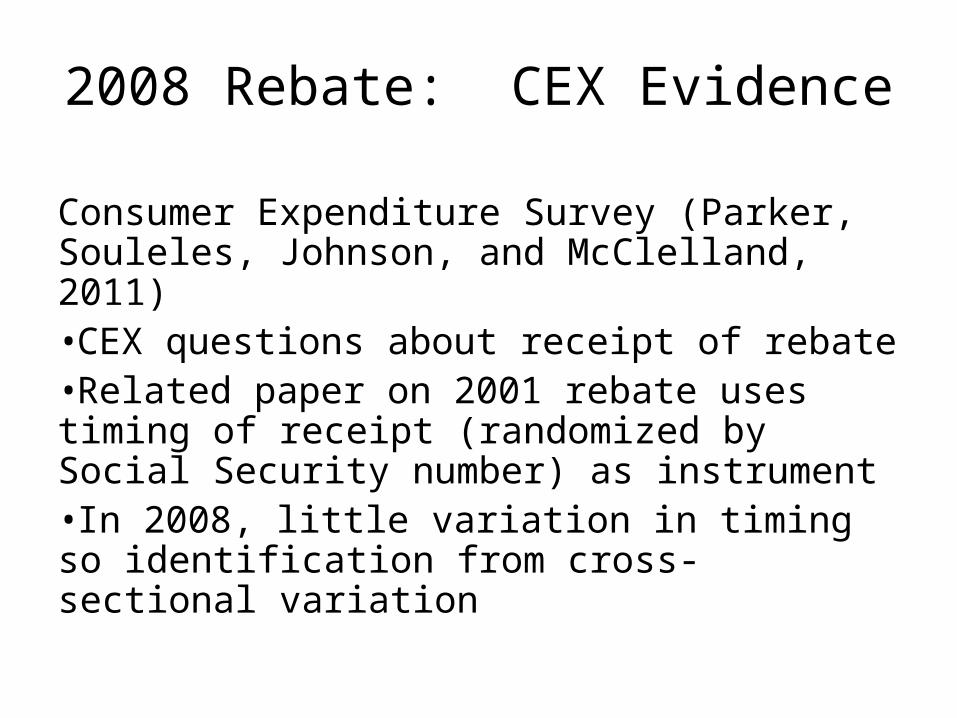
2008 Rebate: CEX Evidence
Consumer Expenditure Survey (Parker, Souleles, Johnson, and McClelland, 2011)•CEX questions about receipt of rebate•Related paper on 2001 rebate uses timing of receipt (randomized by Social Security number) as instrument•In 2008, little variation in timing so identification from cross-sectional variation

2008 Rebate: CEX Evidence
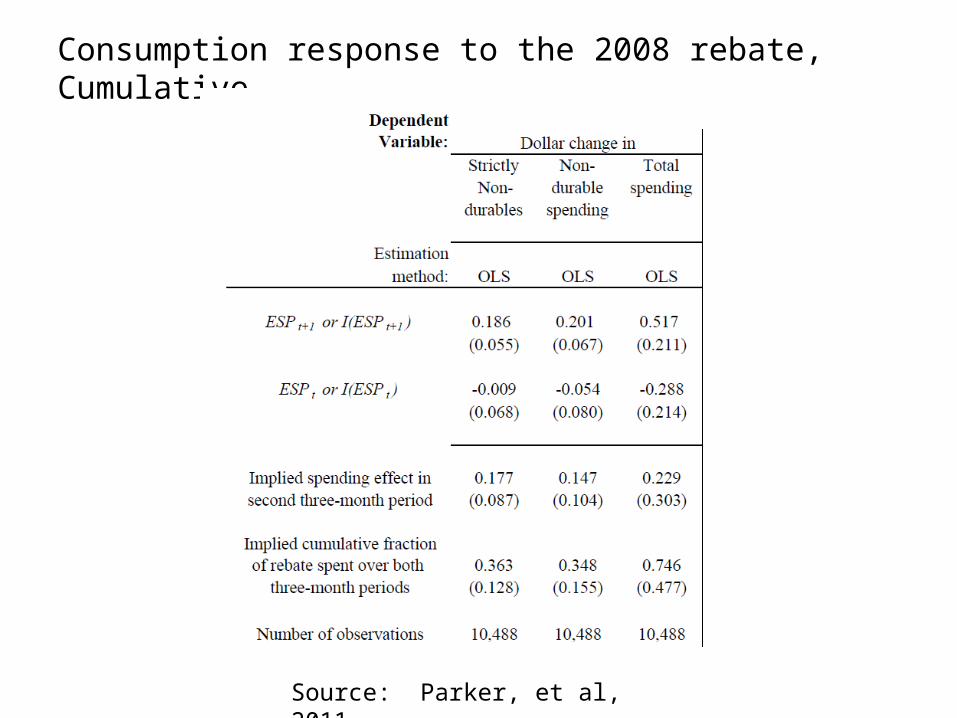
• MPC on non-durables low• MPC on total consumption higher
– Mainly coming from automobiles
• Lagged/cumulative MPC larger

Source: Parker, et al, 2011
Consumption response to the 2008 rebate
Source: Parker, et al, 2011
Consumption response to the 2008 rebate, Cumulative
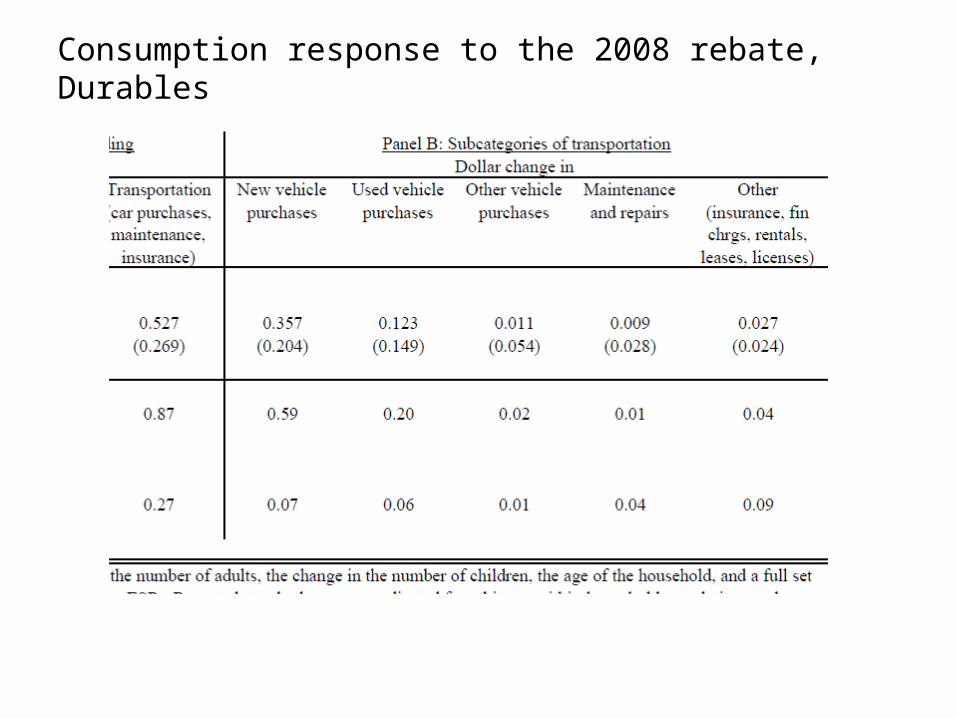
Consumption response to the 2008 rebate, Durables

Real expenditures by households on motor vehicles, billion 2005 dollars, annual rate, seasonally adjusted
Payments from 2008 Rebates, nominal,
annual rate
Nominal rebate-induced spending on new and used motor vehicles implied by
Table 12 PSJM*
Real rebate-induced spending on new and used motor vehicles
implied by Table 12 PSJM
Implied Share of Motor Vehicle
Outlays Owing to Rebates
2008 JAN 340.842008 FEB 339.242008 MAR 326.832008 APR 322.75 23.3 5.6 5.4 0.022008 MAY 314.55 577.1 144.1 140.0 0.452008 JUN 306.39 334.4 218.8 211.9 0.692008 JUL 281.14 164.1 119.6 115.8 0.412008 AUG 307.05 12.4 42.4 40.8 0.132008 SEP 292.02 8.1 4.9 4.7 0.022008 OCT 262.72 11.7 4.7 4.5 0.022008 NOV 262.88 13.1 6.0 5.6 0.022008 DEC 262.01 2.6 3.8 3.5 0.01
2008 Total 301.535 96 46 44 0.15
Consumption response to the 2008 rebateImplications for Automobile Purchases in Aggregate
2008 Rebate: CEX and Survey Approach Cross-Validation
• CEX includes Shapiro-Slemrod “mostly spend/save/pay debt” question
• Somewhat more CEX respondents “mostly spend”– 1/5 in Michigan survey, 1/3 in CEX– Mostly pay off debt modal in both
• CEX consumption strongly predicted by “mostly spend”
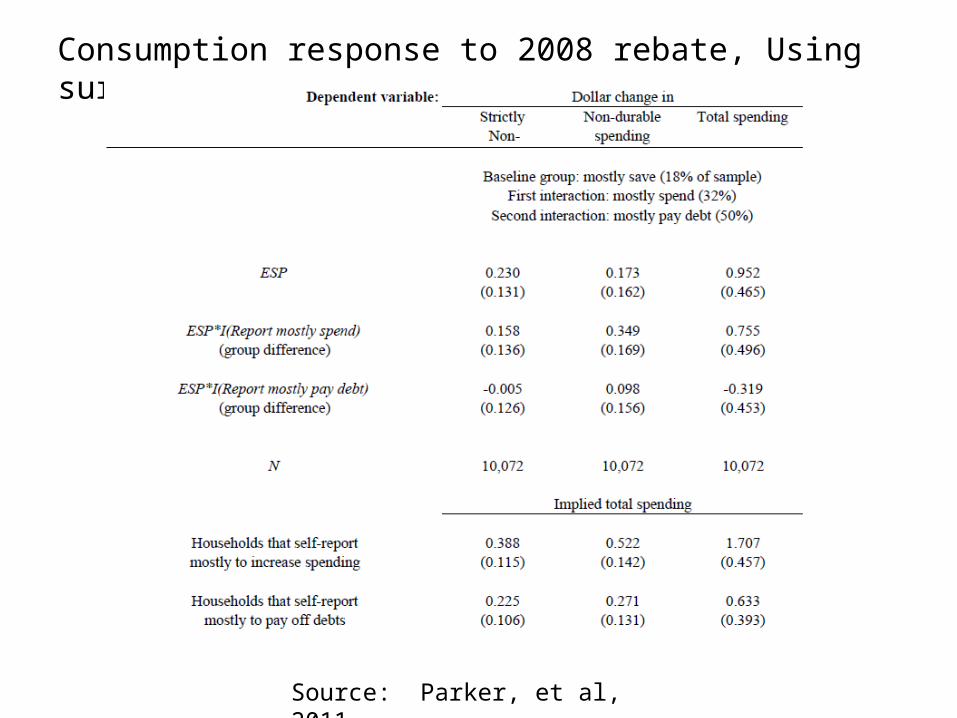
Source: Parker, et al, 2011
Consumption response to 2008 rebate, Using survey question

2008 Rebate: Summary
• CEX and Michigan survey have similar estimates on impact
• CEX has larger cumulative effect– mainly from automobiles– not precisely estimated
• Cross-validation• Policymakers tend to focus on largest
estimated MPC, which imply larger multipliers