What is an exponential function? An exponential function has the form of y = ab x, a ≠ 0, b is a...
15
What is an exponential function? • An exponential function has the form of y = ab x , a ≠ 0, b is a positive number other than 1 Example: y = 2 x or y =(½) x • There are 2 kinds of exponential function: 1. Exponential growth: b > 1 Example: y = 4 x 2. Exponential decay : 0 < b < 1 Example: y Tuesday April 15, 2014 7.1 Exponential Growth Functions Objective : To solve and graph polynomial and radical functions EQ : Can you graph an exponential function? Exponential Growth Function : Domain : all real numbers Range : y > 0 To graph : Step 1: Plot 2 points (0, a) and (1, b) Step 2: Find couple points left of (0, a) and right to (1, b) Step 3: Make a smooth curve, the left of the Example 1: Graph y = 2 x Solution: a = 1, b = 2 Step 1: Plot 2 points (0, 1) and (1, 2) Step 2: Points left of (0, 1) , right of (1, 2) Step 3: Make a smooth curve
-
Upload
berniece-conley -
Category
Documents
-
view
232 -
download
0
Transcript of What is an exponential function? An exponential function has the form of y = ab x, a ≠ 0, b is a...

What is an exponential function?• An exponential function has the form of y = abx, a ≠ 0,
b is a positive number other than 1
Example: y = 2x or y =(½) x
• There are 2 kinds of exponential function:1. Exponential growth: b > 1 Example: y = 4x
2. Exponential decay : 0 < b < 1 Example: y =(⅛) x
What is an exponential function?• An exponential function has the form of y = abx, a ≠ 0,
b is a positive number other than 1
Example: y = 2x or y =(½) x
• There are 2 kinds of exponential function:1. Exponential growth: b > 1 Example: y = 4x
2. Exponential decay : 0 < b < 1 Example: y =(⅛) x
Tuesday April 15, 2014
7.1 Exponential Growth Functions7.1 Exponential Growth Functions
Objective: To solve and graph polynomial and radical functionsObjective: To solve and graph polynomial and radical functionsEQ: Can you graph an exponential function?EQ: Can you graph an exponential function?
Exponential Growth Function:Domain: all real numbersRange: y > 0
To graph:Step 1: Plot 2 points (0, a) and (1, b)Step 2: Find couple points left of (0, a) and right to
(1, b)Step 3: Make a smooth curve, the left of the curve
never crosses x axis
Exponential Growth Function:Domain: all real numbersRange: y > 0
To graph:Step 1: Plot 2 points (0, a) and (1, b)Step 2: Find couple points left of (0, a) and right to
(1, b)Step 3: Make a smooth curve, the left of the curve
never crosses x axisExample 1: Graph y = 2x
Solution:a = 1, b = 2Step 1: Plot 2 points (0, 1) and (1, 2) Step 2: Points left of (0, 1) , right of (1, 2)
Step 3: Make a smooth curve
Example 1: Graph y = 2x
Solution:a = 1, b = 2Step 1: Plot 2 points (0, 1) and (1, 2) Step 2: Points left of (0, 1) , right of (1, 2)
Step 3: Make a smooth curve
Tuesday April 15, 2014
7.1 Exponential Growth Functions7.1 Exponential Growth Functions
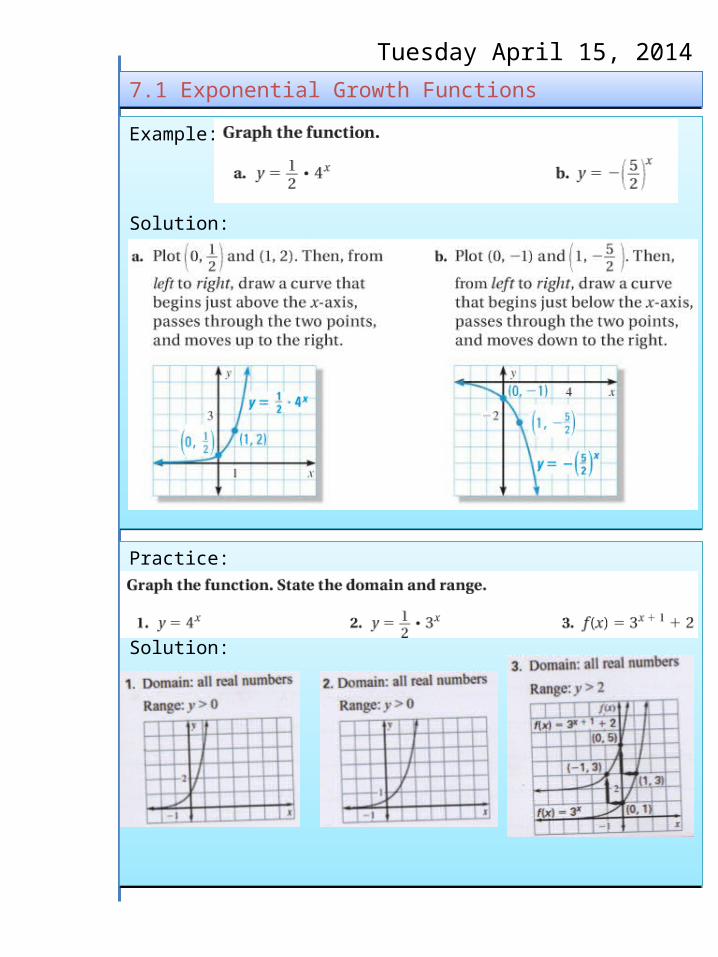
Example:
Solution:
Example:
Solution:
Practice:
Solution:
Practice:
Solution:

Tuesday April 15, 2014
7.1 Exponential Growth Functions7.1 Exponential Growth Functions
Exponential Growth Models: y = a (1+r) t
a = initial amount, r = % (in decimal form), t = time
Example: In 1996, there were 2573 computer viruses security incidents. During the next 7 years, the number of incidents increased by 92% per year.1.Write the exponential growth model giving the number n of incidents t years after 1996 2.Graph the model3.Use the graph to estimate the year when there were about 125,000 computer security incidents
Solution:

TranslationsTo graph a function of the form y = abx-h +k:• sketch y = abx
• then translate:h units horizontally and k units vertically
Example: y = 4. 2x-1 – 3
Graph y= 4. 2x
a = 4, b=2
h = 1, k = -3
TranslationsTo graph a function of the form y = abx-h +k:• sketch y = abx
• then translate:h units horizontally and k units vertically
Example: y = 4. 2x-1 – 3
Graph y= 4. 2x
a = 4, b=2
h = 1, k = -3
Tuesday April 15, 2014
7.1 Exponential Growth Functions7.1 Exponential Growth Functions
Example : Graph the function. State the domain and range1. y = 4x 2. y = ½ 3x 3. y
= 3x-1 – 3
Example : Graph the function. State the domain and range1. y = 4x 2. y = ½ 3x 3. y
= 3x-1 – 3
Exponential Growth Models: y = a (1+r) t
a = initial amount, r = % (in decimal form), t = time
Example: In 1996, there were 2573 computer viruses security incidents. During the next 7 years, the number of incidents increased by 92% per year.1.Write the exponential growth model giving the number n of incidents t years after 1996 2.Graph the model3.Use the graph to estimate the year when there were about 125,000 computer security incidents
Solution:

Wednesday April 23, 2014
7.2 Exponential Decay Functions7.2 Exponential Decay Functions
Objective: To solve and graph polynomial and radical functionsObjective: To solve and graph polynomial and radical functionsEQ: Can you graph an exponential function?EQ: Can you graph an exponential function?
Exponential Decay Function has the form of f (x) = of y = abx, where 0 < b < 1
Domain: all real numbersRange: y > 0
To graph:Step 1: Plot 2 points (0, a) and (1, b)Step 2: Find couple points left of (0, a) and right to
(1, b)Step 3: Make a smooth curve, the left of the curve
never crosses x axis
Exponential Decay Function has the form of f (x) = of y = abx, where 0 < b < 1
Domain: all real numbersRange: y > 0
To graph:Step 1: Plot 2 points (0, a) and (1, b)Step 2: Find couple points left of (0, a) and right to
(1, b)Step 3: Make a smooth curve, the left of the curve
never crosses x axisExample 1: Graph y = (1/2)x
Solution:a = 1, b = 1/2Step 1: Plot 2 points (0, 1) and (1, 1/2) Step 2: Points left of (0, 1) , right of (1, 1/2)
Step 3: Make a smooth curve
Example 1: Graph y = (1/2)x
Solution:a = 1, b = 1/2Step 1: Plot 2 points (0, 1) and (1, 1/2) Step 2: Points left of (0, 1) , right of (1, 1/2)
Step 3: Make a smooth curve
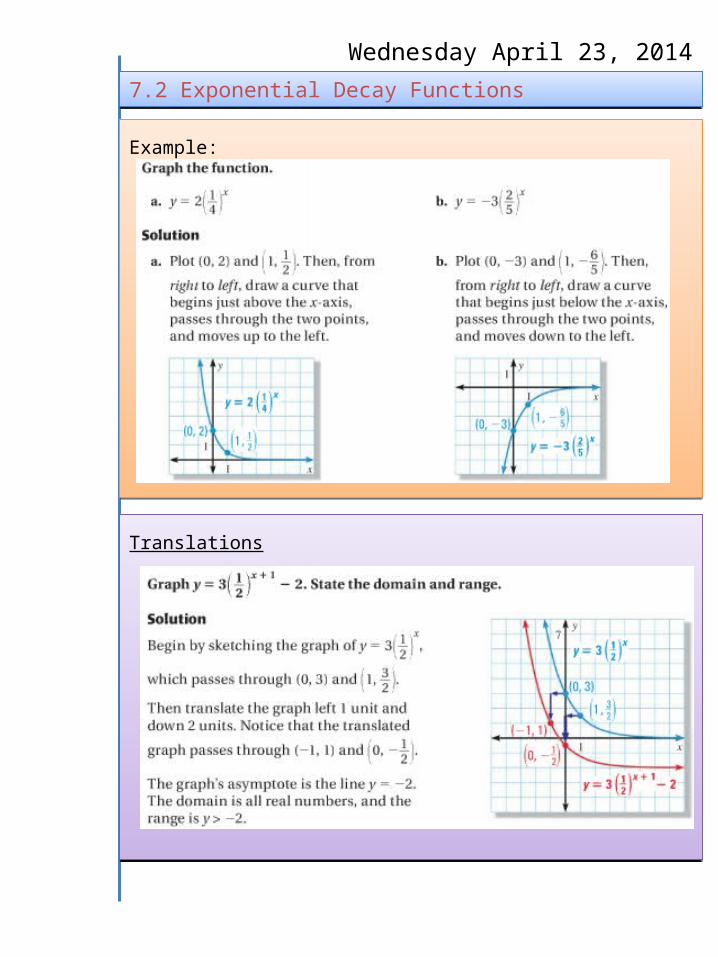
Example:Example:
7.2 Exponential Decay Functions7.2 Exponential Decay Functions
TranslationsTranslations
Wednesday April 23, 2014

Tuesday April 15, 2014
7.2 Exponential Growth Functions7.2 Exponential Growth Functions
Exponential Decay Models: y = a (1 - r) t
a = initial amount, r = % (in decimal form), t = time
Example: A snowmobile costs $4200. The value of the snowmobile decreases by 10% each year.1.Write the exponent decay model?2.Find the value after 3 years3.Graph the model4.Find when the value of the snowmobile will be $2500
Solution:

Thursday April 24, 2014

What is the Euler number or the Natural Base e?What is the Euler number or the Natural Base e?
Thursday April 24, 2014
7.3 Exponential Growth Functions7.3 Exponential Growth Functions
Objective: To solve and graph polynomial and radical functionsObjective: To solve and graph polynomial and radical functionsEQ: Can you graph an exponential function?EQ: Can you graph an exponential function?
Example: Example:
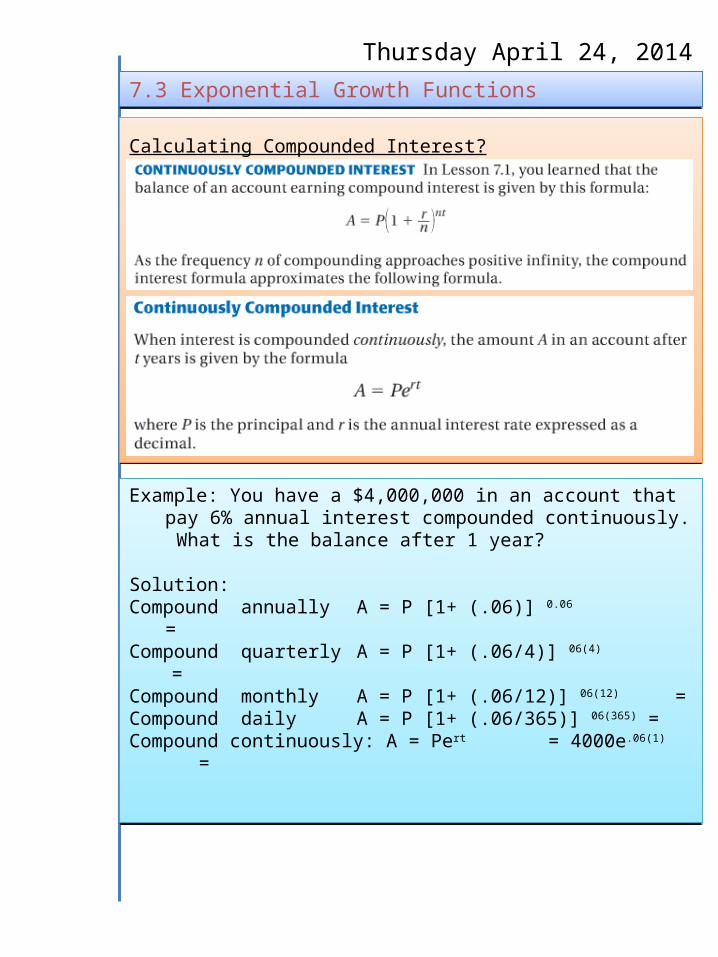
Calculating Compounded Interest?Calculating Compounded Interest?
Thursday April 24, 2014
7.3 Exponential Growth Functions7.3 Exponential Growth Functions
Example: You have a $4,000,000 in an account that pay 6% annual interest compounded continuously. What is the balance after 1 year?
Solution:Compound annually A = P [1+ (.06)] 0.06 =Compound quarterly A = P [1+ (.06/4)] 06(4) =Compound monthly A = P [1+ (.06/12)] 06(12) =Compound daily A = P [1+ (.06/365)] 06(365) =Compound continuously: A = Pert = 4000e.06(1) =
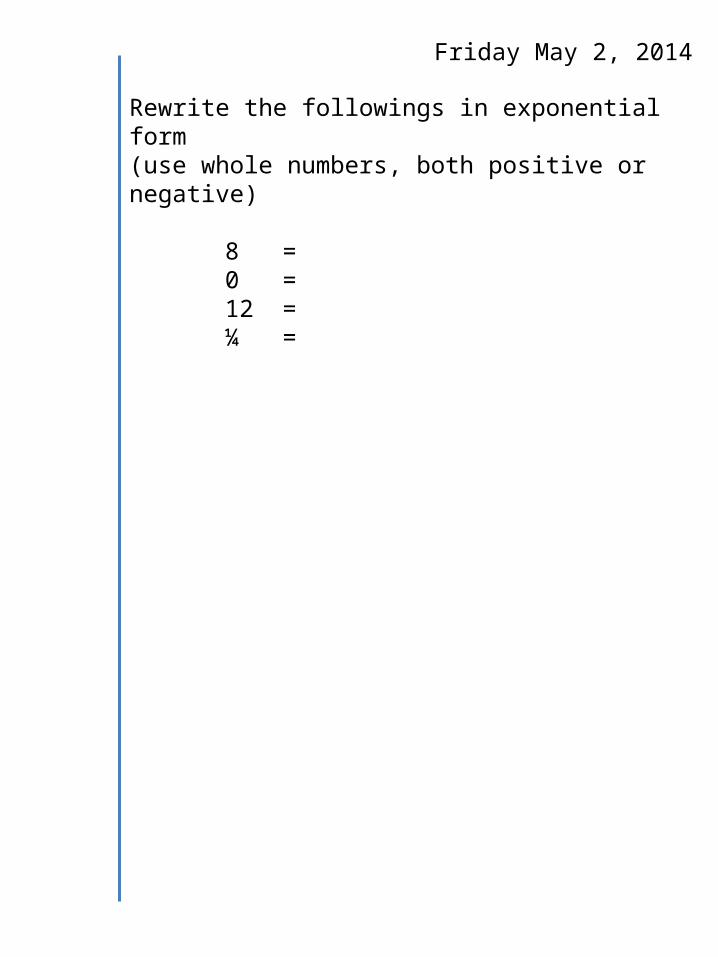
Friday May 2, 2014
Rewrite the followings in exponential form(use whole numbers, both positive or negative)
8 = 0 = 12 =¼ =
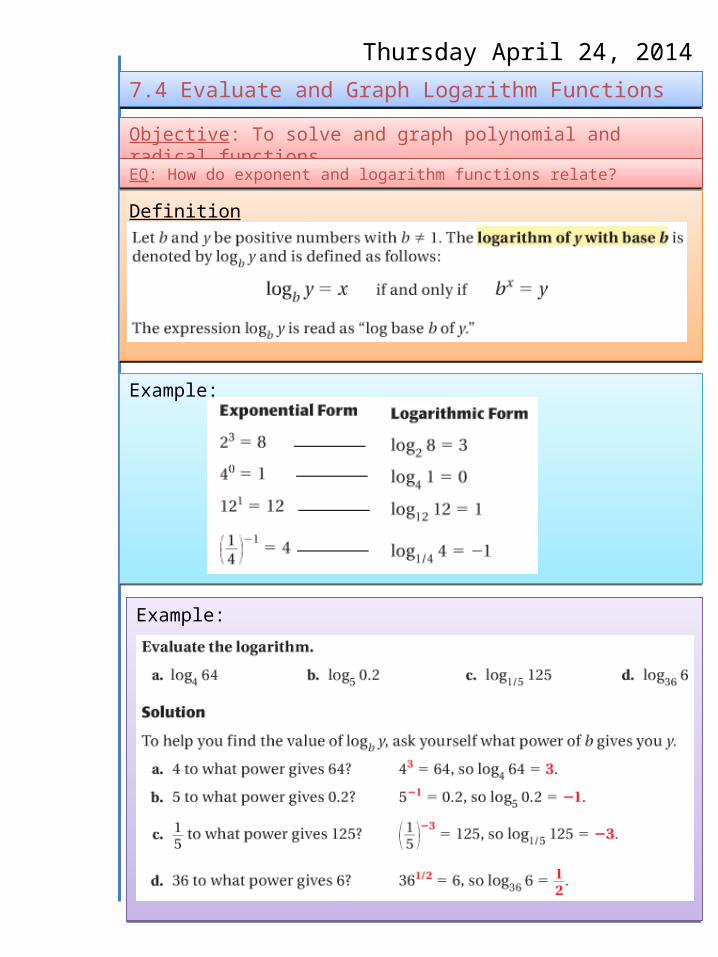
DefinitionDefinition
Thursday April 24, 2014
7.4 Evaluate and Graph Logarithm Functions7.4 Evaluate and Graph Logarithm Functions
Objective: To solve and graph polynomial and radical functionsObjective: To solve and graph polynomial and radical functionsEQ: How do exponent and logarithm functions relate?EQ: How do exponent and logarithm functions relate?
Example: Example:
Example:
Example:

Inverse Functions:
f(x) = bx is the inverse function of g(x) = logbxTherefor:
Inverse Functions:
f(x) = bx is the inverse function of g(x) = logbxTherefor:
Thursday April 24, 2014
7.4 Evaluate and Graph Logarithm Functions7.4 Evaluate and Graph Logarithm Functions
Example:
Example:
Example:
Example:

Parent Graphs for Logarithmic Functions:Parent Graphs for Logarithmic Functions:
Thursday April 24, 2014
7.4 Evaluate and Graph Logarithm Functions7.4 Evaluate and Graph Logarithm Functions
Example:
Example:

Translations in Logarithmic Function Graph:
From the parent function: y = logb x to y = logb (x – h) + k
(the graph moves h units to the right and k units up)
Translations in Logarithmic Function Graph:
From the parent function: y = logb x to y = logb (x – h) + k
(the graph moves h units to the right and k units up)
Thursday April 24, 2014
7.4 Evaluate and Graph Logarithm Functions7.4 Evaluate and Graph Logarithm Functions
Example: y = logb (x + 3) + 1
Solution:
Example: y = logb (x + 3) + 1
Solution: