What International Students Think About U.S. … Keteku, REAC for West and Central Africa Thailand...
36
What International Students Think About U.S. Higher Education: Attitudes and Perceptions of Prospective Students in Africa, Asia, Europe and Latin America Opening Minds to the World ®
Transcript of What International Students Think About U.S. … Keteku, REAC for West and Central Africa Thailand...

What International Students ThinkAbout U.S. Higher Education:
Attitudes and Perceptions ofProspective Students in Africa, Asia,
Europe and Latin America
Opening Minds to the World®

Institute of International Education
An independent 501(c)(3) nonprofit founded in 1919, IIE is among the world’s largest and most experienced international education and training organizations.
Institute of International Education809 United Nations PlazaNew York, NY 10017http://www.iie.org
To download additional copies of this report and access the latest student mobility data from Open Doors and Project Atlas, please visit us online at http://www.iie.org/opendoors.
With Thanks to Our Data Collection Partners:
BrazilRita Moriconi, REAC for the Southern ConeEducationUSA Brazil
GermanyWes Teter, REAC for Western EuropeEducationUSA Germany
Hong KongAnn White, Former Director, IIE-Hong Kong
IndiaDiya Dutt, Deputy Director, USIEFEducationUSA India
MexicoTim Wright, REAC for Mexico & the CaribbeanEducationUSA Mexico
NigeriaShade Adebayo, Margaret Anyigbo & Jennifer Onyukwu,EducationUSA Nigeria
South AfricaClara Priester, REAC for South and East AfricaNancy Keteku, REAC for West and Central Africa
ThailandChalintorn Burian, Director, IIE-BangkokEakapol Chansatitporn, IIE-Bangkok
TurkeyAmy McGoldrick, REAC for Central AsiaTurkish Fulbright CommissionTurkish-American Association, Ankara
United KingdomLauren Welch, US-UK Fulbright Commission
VietnamNgoc Quach, EducationUSA adviser, Ho Chi Minh City
Copyright © 2011 Institute of International Education, Inc.
This report was funded by a grant from the United States Department of State. The opinions, findings and conclusions stated herein are those of the authors and do not necessarily reflect those of the United States Department of State.
Portions of this report are reprinted from IIE’s Open Doors Report on International Educational Exchange, published with support from the Bureau of Educational and Cultural Affairs of the U.S. Department of State. Open Doors and Project Atlas are registered trademarks of the Institute of International Education, Inc. All rights reserved.

What International Students Think About U.S. Higher Education:
Attitudes and Perceptions of Prospective Students in Africa, Asia, Europe and Latin America
Report Prepared by Patricia Chow
Institute of International EducationMay 2011

What International Students Think About U.S. Higher Education
Executive Summary .............................................................................................................3
I. Overview .............................................................................................................................4
II. Africa
A. Nigeria ............................................................................................................................ 7
B. South Africa .................................................................................................................... 9
III. Asia
A. Hong Kong ..................................................................................................................... 10
B. India ............................................................................................................................ 12
C. Thailand ......................................................................................................................... 14
D. Vietnam ......................................................................................................................... 16
IV. Europe
A. Germany ........................................................................................................................ 18
B. Turkey ...........................................................................................................................20
C. United Kingdom .............................................................................................................22
V. Latin America
A. Brazil ...........................................................................................................................24
B. Mexico ...........................................................................................................................26
VI. Conclusion .................................................................................................................................. 28
VII. Appendix (Methodology) ........................................................................................................ 30
Table of Contents
2

Executive Summary
This IIE report examines the attitudes and perceptions that international students who are considering studying in the United States have of U.S. higher
education. The following research questions are explored: What attracts students from other countries to study in the U.S.? What course of study do they intend to pursue? Do they prefer the U.S. to other key destinations? What are the perceived barriers facing students who wish to study in the U.S.?
To answer these and other questions, IIE, in cooperation with EducationUSA, surveyed prospective students in selected countries in four major sending regions about their preferred study destinations, their reasons for studying internationally, the perceived obstacles they faced, their main sources of information on overseas study and their opinions of the U.S. as a potential study destination compared to other key host destinations.
IIE began conducting the surveys in Vietnam in March 2009, followed by India in summer 2009. Surveys were then conducted in Mexico, Thailand, Hong Kong, Brazil, Germany, Turkey, the United Kingdom, Nigeria and South Africa through fall 2010. A total of 9,330 valid student responses were received.
Key findings include:
the U.S. is the destination of choice for the vast majority of •respondents worldwide, with three-quarters (75 percent) of prospective students reporting the U.S. as their top choice;over three-quarters (76 percent) of prospective students •worldwide perceived the U.S. to have a high quality higher education system;over three-quarters (76 percent) of prospective students •worldwide feel the U.S. has a wide range of schools and programs to suit a variety of different students;over two-thirds (69 percent) of prospective students worldwide •feel that the U.S. welcomes international students; cost was cited as the primary obstacle to overseas study by •respondents in all countries; six in ten prospective students worldwide (60 percent) perceived tuition in the U.S. to be expensive;half of respondents had concerns about obtaining a visa to •study in the U.S. Responses varied by country, ranging from less than a quarter (22 percent) of students in Turkey to 59 percent of students in Brazil.
EducationUSA is a network of more than 400 advising centers around the world supported by the Bureau of Educational and Cultural Affairs of the U.S. Department of State (ECA). ECA fosters mutual understanding between the people of the United States and other countries by promoting personal, professional and institutional ties between private citizens and organizations in the U.S. and abroad, as well as by presenting U.S. history, society, art and culture in all of its diversity to overseas audiences.
EducationUSA centers actively promote U.S. higher education around the world by offering accurate, unbiased, comprehensive, objective and timely information about educational institutions in the United States, and guidance to qualified individuals on how best to access those opportunities. Millions of prospective students learn about U.S. study opportunities through EducationUSA centers each year. Centers are staffed by professional advisers who adhere to ethical standards, many of whom have first-hand experience studying in the U.S. and have received U.S. State Department-approved training about U.S. higher education and the advising process.
EducationUSA advisers working in a variety of host institutions, such as Fulbright Commissions, IIE offices, AMIDEAST offices, American Councils, U.S. embassies and consulates, bi-national centers, universities and public libraries share a common goal: assisting students from their country to access U.S. higher education opportunities.
EducationUSA staff in Washington, D.C. also work with the U.S. higher education community, providing information on international education policy, global education systems, the importance of recruiting international students, how to cooperate with EducationUSA centers around the world and how to maintain an international-student friendly campus and website. For more information, please visit the EducationUSA website at: http://www.educationusa.info/.
3Institute of International Education

What International Students Think About U.S. Higher Education
Introduction
The growth of the international student population in the United States reflects the broader global trend of the increasing number of students who pursue higher education outside their homelands each year. In 2008, 3.3 million students studied internationally worldwide, an increase of over ten percent over the previous year, and an increase of approximately 65 percent since 2000 (OECD, 2010). These trends are expected to continue in the next decade.
In 2009/10, the U.S. hosted a record high of over 690,000 international students (Open Doors, 2010). Although the U.S. market share has declined in the last decade, the U.S. nevertheless hosted far more international students than any other destination. The United Kingdom, the second most popular international study destination, hosted about 450,000 international students, two-thirds of the U.S. total.
According to UNESCO, in 2008, the top five study destinations (the U.S., the U.K., France, Australia and Germany) hosted 55 percent of the world’s tertiary-level mobile students. At less than four percent, the proportion of international students to overall higher education enrollment in the U.S. remains quite small compared to other top host countries, although the percentage is higher at the graduate level (11 percent). Furthermore, in 2009/10, over 62 percent of international students in the U.S. were hosted at fewer than 200 colleges and universities. With over 4,000 institutions of higher education in the U.S., there is tremendous potential for more institutions to host more international students, particularly at the undergraduate and non-degree levels.
Students around the world are starting to study in a more diverse range of destinations. According to recent data collected through IIE’s Project Atlas (http://iie.org/projectatlas), a collaborative research and data-sharing initiative with 17 country partners and four research affliliates, China is now the fifth largest
I. Overview
hosting destination for international students. China and many other host countries are increasing efforts to internationalize their academic institutions and attract more international students. National and institutional strategies implemented by both traditional and emerging host destinations create a competitive international environment for recruiting top talent from around the world. At the same time, the growing demand for higher education worldwide will continue to generate the need for expanded international education capacity for years to come, as home countries remain unable to meet increased demand locally.
In this era of global competition for the world’s best and brightest, prospective international students are well-informed and selective consumers of higher education. In order to better understand what potential international students think about U.S. higher education, the Institute of International Education (IIE) conducted a series of perceptual and attitudinal surveys in selected countries in four key sending regions. The following research questions are explored: What attracts students from other countries to study in the U.S.? What course of study do they intend to pursue? Do they prefer the U.S. to other key destinations? What perceived barriers do students who wish to study in the U.S. face? IIE began conducting the surveys in Vietnam and India in 2009, followed by Mexico, Thailand, Hong Kong, Brazil, Germany, Turkey, the United Kingdom, Nigeria and South Africa in 2010. A total of 9,330 valid responses from prospective students were received.
The majority of respondents worldwide (55 percent) were female, while 45 percent were male (fig. 1). In addition, 35 percent were current high school students, 40 percent were undergraduate degree students or had completed an undergraduate degree but no graduate degree, 15 percent were graduate students and 10 percent were students at two-year colleges or technical schools, or studying at other levels, including in non-degree programs.
4

Figure 1: Gender of Survey Respondents
% Female % Male
Brazil 55.5% 44.5%
Germany 61.3% 38.7%
Hong Kong 62.6% 37.4%
India 40.0% 60.0%
Mexico 52.0% 48.0%
Nigeria 44.0% 56.0%
South Africa 69.2% 30.8%
Thailand 65.0% 35.0%
Turkey 50.5% 49.5%
United Kingdom 57.6% 42.4%
Vietnam 62.9% 37.1%
TOTAL (N=9,330) 55.3% 44.7%
Figure 2: Preferred Study Destination of Prospective International Students
Study Destination % of Total
United States 74.9% United Kingdom 8.4% Canada 5.0% Australia 3.0% France 1.4% Germany 1.0% Spain 1.0% Japan 1.0% New Zealand 0.7% Sweden 0.4% Italy 0.3% Singapore 0.3% China 0.3% Other European destinations 1.2%Other Asian destinations 0.5%Latin America 0.4%Sub-Saharan Africa 0.1%Middle East and North Africa 0.1%
TOTAL (N=9,330) 100.0%
I. Overview (cont.)
Preferred International Study Destinations
The most popular first-choice destination chosen by respondents worldwide was the United States, with 75 percent of prospective international students listing the U.S. as their top choice in an open-ended question (fig. 2). The United Kingdom was the next most cited first-choice destination, with eight percent of the total, followed by Canada (five percent) and Australia (three percent).
The preferred destinations of respondents reflect existing patterns of global student mobility. Currently, the U.S. hosts 20 percent of the 3.3 million students worldwide who are pursuing higher education outside their home countries. The U.K. has the next largest portion, with 13 percent of the total, followed by France (eight percent), Germany (seven percent), China (seven percent), Australia (seven percent), Canada (four percent) and Japan (four percent) (Project Atlas, 2010). While Spain does not figure among the top eight host destinations worldwide, it is a popular study destination for students from Latin America.
Impressions of Key Host Destinations
Respondents were asked whether they agreed with a set of statements about each host destination, including whether or not the study destination has a wide range of schools and programs, has a high quality higher education system, welcomes international students, has many opportunities for student scholarships, has good student support services and is a safe place to study. Potential students were also asked whether they felt the study destination had: expensive tuition; a high cost of living; difficult or complex visa procedures; or a significant language barrier.
The majority of students rated the U.S. more positively than other potential destinations for most dimensions. Over three-quarters (76 percent) of respondents worldwide perceived the U.S. to have a wide range of schools and programs, as compared with 35 percent for the U.K. and 28 percent for Canada, the host destinations with the next highest percentages.
Institute of International Education 5

U.S. U.K. France Germany China Australia Canada Japan
Wide range of schools and programs 75.9 34.5 15.5 14.3 3.1 20.7 27.9 14.2
High quality higher education system 75.6 49.9 23.2 30.7 3.5 19.2 33.2 18.6
Welcomes international students 69.1 33.0 19.6 22.2 10.0 33.8 41.5 20.4
Tuition is expensive 60.1 51.0 19.2 11.2 1.3 17.5 23.1 20.7
Many scholarship opportunities 58.5 18.5 10.8 8.7 3.1 14.9 22.3 19.5
Good student support services 56.9 26.0 13.9 13.1 4.8 17.9 29.6 no data
Difficult or complex visa procedures 49.3 23.2 9.3 5.9 2.6 10.9 13.4 18.1
Safe place to study 46.3 37.5 32.4 27.2 7.9 31.6 45.8 27.9
High cost of living 44.7 53.9 33.3 19.0 0.4 17.0 19.7 34.4
Language barrier 10.7 9.5 55.6 56.4 12.2 6.2 3.6 97.2
Number of responses 9,379 7,781 5,045 2,701 229 8,965 4,153 1,103
Figure 3: Percent of Prospective Students Who Agree the Statement Applies to the Study Destination
Over three-quarters (76 percent) of respondents worldwide also perceived the U.S. to have a high quality higher education system, as compared with 50 percent for the U.K., 33 percent for Canada and 31 percent for Germany, the host destinations with the next highest percentages.
Over two-thirds (69 percent) of respondents worldwide felt that the U.S. welcomes international students, as compared with 42 percent for Canada, 34 percent for Australia and 33 percent for the U.K., the host destinations with the next highest percentages.
The U.S. was rated a host destination with many scholarship opportunities and good student support services by over half of respondents (59 percent and 57 percent, respectively). This is a significantly higher proportion than those of the other host destinations.
About 46 percent of respondents perceived the U.S. to be a safe place to study, similar to the proportion for Canada, and higher than the proportions for the other countries.
I. Overview (cont.)
Barriers and Challenges
Over 60 percent of respondents worldwide felt tuition in the U.S. to be expensive, the highest among all of the host destinations. Tuition in the U.K. was also perceived to be expensive by the majority (51 percent) of respondents. In addition, 49 percent of respondents felt the U.S. had difficult or complex student visa procedures, also the highest of any host destination. Only 23 percent of respondents felt that the U.K. had difficult or complex student visa procedures, the host destination with the next highest percentage. However, these surveys were conducted prior to the recently announced changes to visa procedures and tuition increases in both the U.K. and Australia.
The largest proportion of respondents found the U.K. to have a high cost of living (54 percent), followed by the U.S. (45 percent), Japan (34 percent) and France (33 percent).
Japan was seen as having a significant language barrier by the highest number of respondents (97 percent), followed by Germany and France with 56 percent each.
6 What International Students Think About U.S. Higher Education

Institute of International Education
II. Africa
Sub-Saharan Africa has the highest outbound student mobility rates in the world, with students from Sub-Saharan Africa comprising eight
percent of globally mobile students worldwide (UNESCO, 2010). In many African countries, there is limited domestic capacity in tertiary education to accommodate all of the students who wish to pursue higher education. In some countries, including Botswana, Cape Verde and Swaziland, more than 50 percent of students pursue higher education abroad.
The 32,121 students from Sub-Saharan Africa comprised just under five percent of the 690,923 international students in the U.S. in 2009/10 (Open Doors, 2010). The majority (58 percent) of students from Sub-Saharan Africa are enrolled at the undergraduate level, with less than one-third (30 percent) enrolled at the graduate level, and 12 percent enrolled in non-degree programs or on Optional Practical Training (OPT). The top Sub-Saharan African places of origin of students in the U.S. are Nigeria, Kenya, Ghana, Cameroon and South Africa. Only Nigeria and Kenya figure among the top 25 overall places of origin of international students in the U.S.
Nigeria is the top African place of origin of international students in the U.S. and is ranked twentieth among all places of origin
of international students in the U.S. During the 2009/10 academic year, 6,568 Nigerian students were studying at U.S. colleges and universities, a five percent increase over the previous year. In comparison, over 15,100 Nigerian students were studying in the U.K. in 2009.
In fall 2010, IIE and EducationUSA conducted a survey of prospective students in Nigeria, regarding their attitudes and perceptions of U.S. higher education compared to other popular host destinations. Respondents were asked about perceived obstacles to international study, preferred study destinations, intended major or field of study, reasons for studying overseas and main sources of information on studying in the U.S. Respondents were
drawn from attendees at EducationUSA-sponsored college fairs in Lagos and Abuja. A total of 211 valid responses were received.
The majority of respondents (56 percent) were male, while 44 percent were female. About 85 percent had already decided to study abroad, while 15 percent were just starting to think about studying abroad. In addition, 54 percent of respondents were interested in pursuing an undergraduate degree abroad; 43 percent were interested in a graduate degree (MA or PhD); 23 percent were interested in a professional degree (MBA, JD, MD, etc.) and four percent were interested in foreign language study, including intensive English (respondents could select more than one choice). Six percent were undecided as to the level of study they wished to pursue abroad.
Engineering was the most popular field of study of prospective Nigerian students, chosen by 30 percent of respondents, followed by physical and life sciences (23 percent), and business/management (17 percent).
First Alternate Destination Choice Choice
United States 88.9% 16.1%
United Kingdom 6.3% 36.0%
Canada 3.4% 29.6%
Asia 1.0% 5.9%
Continental Europe 0.5% 6.5%
Africa n/a 3.8%
Australia n/a 2.2%
Middle East n/a 0.5%
No second choice n/a 20.4%
TOTAL 100.0% n/a
Figure 4: Preferred Study Abroad Destinations of Prospective Students from Nigeria
7

The United States was the overwhelming first-choice study destination for respondents in Nigeria. Almost nine out of every ten respondents (89 percent) listed the U.S. as their first-choice destination in an open-ended question (fig. 4).
The United Kingdom was the second most cited preferred destination, with six percent of respondents listing the U.K. as their destination of choice. The United Kingdom was also the most cited alternative destination, listed by 36 percent of respondents from Nigeria. Canada was the second most cited alternate destination among Nigerian students, with 30 percent of the total.
The U.S. was perceived to have a high quality higher education system by 78 percent of Nigerian respondents (fig. 5). The majority of respondents also felt the U.S. to have a wide range of schools and programs (81 percent) and many scholarship opportunities (80 percent), to welcome international students (73 percent) and to have good student support services (71 percent).
A. Nigeria
Students in Nigeria Students in South Africa U.S. U.K. Australia U.S. U.K. Australia
Wide range of schools and programs 80.6 18.0 3.8 59.6 16.6 5.3
Many scholarship opportunities 79.6 22.4 2.8 57.6 11.9 6.0
High quality higher education system 77.7 10.4 3.8 100.0 25.2 10.6
Welcomes international students 73.0 18.0 5.2 59.6 15.9 2.0
Good student support services 71.1 8.7 5.2 60.9 13.9 4.6
Safe place to study 64.0 25.1 10.9 57.0 18.5 9.3
Difficult to get a student visa 48.8 17.1 4.3 23.8 17.2 5.3
Expensive tuition 40.8 47.9 7.1 45.0 14.9 6.6
Costly application process 33.2 35.1 4.3 36.4 23.8 4.6
High cost of living 30.8 50.7 4.7 43.0 26.5 6.6
Language barrier 4.3 2.4 10.4 14.9 6.0 5.3
Figure 5: Percent of African Students Who Agree the Statement Applies to the Study Destination
However, almost half (49 percent) of respondents in Nigeria felt that it was difficult to get a visa to study in the U.S.; 41 percent perceived tuition at U.S. colleges and universities to be expensive; and 31 percent felt the cost of living in the U.S. to be high. Even higher percentages felt that U.K. tuition and living costs were high (48 percent and 51 percent, respectively).
Among Nigerian respondents, the top sources of information on study in the U.S. were EducationUSA (40 percent), parents or relatives (38 percent), the internet (32 percent) and friends or classmates (30 percent).
EducationUSA has two comprehensive advising centers in Nigeria, one in Abuja and one in Lagos, that advise potential undergraduate and graduate students on opportunities for study in the U.S. For more information about EducationUSA in Nigeria, please visit their website: http://nigeria.usembassy.gov/educational_advising.html.
8 What International Students Think About U.S. Higher Education

Institute of International Education
B. South Africa
First Alternate Destination Choice Choice
United States 91.8% 9.9%
United Kingdom 4.1% 45.5%
Canada 1.4% 14.9%
Australia 0.7% 13.2%
Other Europe 0.7% 12.4%
Asia n/a 5.8%
Africa 0.7% 5.0%
Middle East n/a 1.7%
Other 0.6% 1.7%
TOTAL 100.0% n/a
Figure 6: Preferred Study Abroad Destinations of Prospective Students from South AfricaIn 2009/10, 1,656 South African students were studying
at U.S. colleges and universities, a three percent decline from the previous year’s total. In fall 2010,
IIE and EducationUSA conducted a survey of prospective students in South Africa, regarding their attitudes and perceptions of U.S. higher education, compared to other potential host destinations. Respondents were asked about perceived obstacles to international study, their preferred study destinations, intended major or field of study, reasons for wishing to study internationally and main sources of information on studying in the U.S. Respondents were drawn from attendees at an EducationUSA-sponsored college fair in Johannesburg. A total of 164 valid student responses were received.
Among respondents from South Africa, 69 percent were female and 31 percent were male. 55 percent had already decided to study overseas, and 45 percent were only beginning to consider it. In addition, 48 percent were interested in undergraduate studies; 23 percent in graduate studies; 22 percent in a professional degree and nine percent each in two-year degree/certificate programs and in foreign language study (including intensive English).
Students from South Africa were most interested in studying business and management (27 percent), engineering (23 percent) and fine or applied arts (12 percent) overseas.
The overwhelming first-choice overseas study destination was the United States. Over nine out of every ten respondents (92 percent) listed the U.S. as their top choice in an open-ended question (fig. 6). The United Kingdom was the next most cited first-choice destination, with four percent of the total. The U.K. was the most frequently cited alternative destination, with 46 percent of the total, followed by Canada, with 15 percent.
The U.S. was perceived to have a high quality higher education system by 100 percent of respondents (fig. 5). In addition, the majority of respondents felt the U.S. to have a wide range of schools and programs (60 percent), many scholarship opportunities (58 percent), be welcoming to international students (60 percent) and have good student support services (61 percent).
However, 45 percent of respondents in South Africa perceived tuition at U.S. colleges and universities to be expensive, 43 percent of respondents felt that the cost of living in the U.S. is high and a quarter of respondents (24 percent) indicated that they felt it was difficult to get a visa to study in the U.S.
When asked about perceived obstacles to international study in any country, 52 percent of respondents in South Africa cited cost as a major obstacle, regardless of destination, followed by gaining acceptance to the institution of their choice (24 percent). Only five percent of respondents in South Africa indicated they felt that obtaining a student visa would be a major obstacle.
The top sources of information on study in the U.S. for South African respondents were EducationUSA (46 percent), teachers or professors (21 percent) and the internet (21 percent). For more information about EducationUSA in South Africa, please visit http://southafrica.usembassy.gov/educational-advising.html.
9

What International Students Think About U.S. Higher Education
III. Asia
Students from Asia comprise 43 percent of globally mobile students, the largest group of international students in the world. The over
820,000 students from China alone who are studying in other countries comprise 15 percent of the world total. In addition, over 268,000 Indian students are studying outside their home country.
In 2009/10, there were 435,667 students from Asia studying at U.S. colleges and universities, a five percent increase over the previous year’s total and 63 percent of the overall total of 690,923 international students in the U.S. (Open Doors, 2010). Sixty percent of these students came from East Asia (261,125), 30 percent were from South and Central Asia (130,725) and ten percent were from Southeast Asia (43,817).
China is the top place of origin of all international students studying in the U.S., with 127,628 students in 2009/10. India is the second leading place of origin with 104,897 students, followed by South Korea with 72,153 students. Students from these three countries comprise 44 percent of all international students in the U.S.
Among Asian students coming to the U.S. to study, the largest growth has been in the number of students from China, which increased 30 percent in 2009/10. The number of undergraduate students from China has surged in recent years, increasing 300 percent from just under 10,000 in 2006/07 to almost 40,000 in 2009/10.
Students from Asia are primarily studying in degree programs at the graduate level (46 percent of the total), and at the undergraduate level (36 percent), with the remaining 18 percent studying in non-degree programs or on Optional Practical Training (OPT). Academic level varies by place of origin and sub-region, with students from South and Central Asia more heavily concentrated at the graduate level, and students from Southeast Asia more concentrated at the undergraduate level, while students from East Asia are almost evenly split between undergraduates and graduate students.
Hong Kong is the fifth top place of origin in East Asia, ninth in all of Asia and 16th among all places of origin of international students in the
U.S. In 2009/10 there were 8,034 students from Hong Kong studying at U.S. colleges and universities, a four percent decline over the previous year’s total. Seventy percent of students from Hong Kong were studying in undergraduate degree programs, 16 percent were studying in graduate degree programs, six percent were studying in non-degree programs and eight percent were on Optional Practical Training (OPT).
In fall 2010, IIE’s office in Hong Kong conducted a survey of students in Hong Kong who were interested in studying overseas. Respondents were drawn from visitors to the EducationUSA advising office in Hong Kong and the IIE-sponsored college fair. 229 valid responses were received; 63 percent were female and 37 percent were male. Most (68 percent) were interested in pursuing an undergraduate degree abroad and 52 percent were also interested in a graduate or professional degree.
Business and management was the most popular intended field of study (28 percent of the total), followed by fine or applied arts (17 percent), physical or life sciences (16 percent), social sciences (14 percent) and humanities (11 percent).
The U.S. was the most frequently cited first-choice destination, with 78 percent of respondents listing the U.S. in an open-ended question (fig. 7). The U.K. was the next most cited first-choice destination (with 12 percent of the total), followed by Australia and Canada (four percent each). Among alternative destinations, the United Kingdom was the most popular, with 39 percent of the total, followed by the United States (17 percent), Australia (16 percent) and Canada (14 percent).
The majority of respondents perceived the U.S. to have a wide range of schools and programs (81 percent), a high quality higher education system (77 percent) and be welcoming to international students (76 percent) (fig. 8). However, many respondents also felt that tuition in the U.S. is expensive (61 percent) and that the cost of living in the U.S. is high (57 percent).
10

Institute of International Education
A. Hong Kong
First Alternate Destination Choice Choice
United States 78.1% 17.0%
United Kingdom 11.8% 38.8%
Australia 3.9% 15.4%
Canada 3.9% 13.8%
Mainland China 0.6% 1.1%
Other Asian destination n/a 3.8%
No alternate choice n/a 18.1%
TOTAL 100.0% n/a
Figure 7: Preferred Study Abroad Destinations of Prospective Students from Hong Kong
Mainland Singapore/ U.S. U.K. Canada Australia China Malaysia
Wide range of schools and programs 81.4 44.1 14.9 17.6 3.7 1.7
High quality higher education system 77.1 58.0 16.5 16.5 4.3 6.4
Welcomes international students 75.5 49.5 33.5 33.5 12.2 11.7
Availability of general education studies 75.0 22.9 14.4 12.2 2.1 2.1
Good student support services 64.9 40.4 17.6 18.6 5.9 7.4
Many internship opportunities 64.4 29.8 15.4 18.6 6.9 5.3
Expensive tuition 61.2 58.0 9.6 9.6 1.7 2.7
Many scholarship opportunities 57.4 25.0 9.6 9.6 3.7 2.7
High cost of living 56.9 60.6 17.0 13.3 0.5 3.7
Costly application process 48.9 38.3 10.6 8.5 1.1 1.1
Difficult to get a student visa 36.2 18.6 5.9 6.4 3.2 3.2
Safe place to study 30.3 42.6 32.4 30.9 9.6 16.0
Language barrier 17.6 11.2 3.2 5.3 14.9 12.8
Figure 8: Percent of Students in Hong Kong Who Agree the Statement Describes the Study Destination
Half (50 percent) of respondents cited cost as a major obstacle to being able to study overseas (regardless of destination). Other obstacles included gaining acceptance to the institution of their choice (42 percent), choosing from the many available options (37 percent) and finding accurate information (36 percent).
IIE/Hong Kong coordinates the annual IIE U.S. Higher Education Fair series in key cities in six countries across Asia as well as the annual North American boarding school fair in Hong Kong. IIE/Hong Kong also offers a number of scholarship, fellowship and leadership training opportunities for students from Hong Kong, Macau, China and across Asia, and offers a range of English assessment and academic and professional tests for schools, businesses and individuals, as the official representative of ETS TOEIC®, TOEFL ITP® and SSAT in Hong Kong and Macau.
For more information about IIE’s Hong Kong office or IIE-sponsored college fairs across Asia, please visit their website: http://www.iie.org/en/offices/hong-kong.
11

What International Students Think About U.S. Higher Education
III. Asia (cont.)
I ndia was the top place of origin of international students in the U.S. from 2001/02 through 2008/09, with China re-taking the top position in 2009/10. In
summer 2009, IIE conducted a survey in India of 1,044 students regarding their attitudes and perceptions of U.S. higher education compared to five other potential host destinations: the United Kingdom, Australia, continental Europe, Southeast/East Asia and the Middle East. Respondents were also asked about perceived obstacles, preferred international study destinations, intended major or field of study, reasons for wishing to study overseas, main sources of information on overseas study.
Respondents were drawn from visitors to the U.S. Department of State-funded EducationUSA advising centers in four cities in India: Mumbai (31 percent), Chennai (27 percent), Delhi (23 percent) and Kolkata (19 percent). Sixty percent of respondents were male and 40 percent were female. Over two-thirds of respondents indicated that they had already decided to study internationally at the time of the survey, while less than one-third were just starting to think about international study.
Engineering was the most popular intended field of study, chosen by 30 percent of respondents, followed by business and management (26 percent), physical and life sciences (nine percent) and math and computer science (five percent). A higher proportion of men than women indicated engineering as their intended field; among women, business was slightly more popular. Business was also more popular than engineering among respondents in Mumbai and Delhi.
The most frequently cited reason for studying abroad was the quality or type of academic program (cited by 76 percent of respondents). Over one-third (37 percent) cited preparing for a future career in a foreign country or foreign-based company and about one-fifth each cited the cultural experience (21 percent) and making professional contacts (19 percent).
The overwhelming first-choice study abroad destination for these prospective students from India was the United States (fig. 9). More than nine out of every ten respondents (91 percent) listed the U.S. as their first-choice destination in an open-ended question. The United Kingdom was the second most cited first-choice destination, with four percent of the total, followed by Canada with two percent and Australia with one percent. A number of continental European countries were also mentioned as first-choice destinations: Germany, France, Norway and Russia, as well as Singapore and the United Arab Emirates.
The United Kingdom was the most frequently cited alternate destination, with 36 percent of the total, followed by Canada (14 percent) and Australia (11 percent). The U.S. was the fourth most popular alternate destination, with seven percent of the total.
The U.S. was perceived to have an excellent higher education system by 88 percent of respondents, a much higher percentage than for the United Kingdom (32 percent), Australia (nine percent), continental Europe (also nine percent), Southeast/East Asia (six percent) or the Middle East (one percent) (fig. 10). Three-quarters of respondents considered the U.S. to have a wide range of schools and programs, also a much higher percentage than for the other destinations (ranging from one and 23 percent), and 68 percent felt that the U.S. welcomes international students (compared to between three and 24 percent for the other destinations). Most respondents also felt that the U.S. has good student support services (61 percent), many scholarship opportunities (60 percent) and is a safe place to study (60 percent).
However, about half (51 percent) of respondents perceived that the U.S. has a costly school application process, has expensive tuition (50 percent) and that it is difficult to obtain a visa to study in the U.S. (50 percent). In addition, 42 percent felt the U.S. has a high cost of living and 12 percent indicated that there was a significant language barrier.
12

Institute of International Education
B. India
The highest proportion of respondents (58 percent) listed cost as a major obstacle to studying internationally, regardless of destination, followed by gaining acceptance to the institution of their choice (38 percent), finding accurate information (37 percent) and obtaining a visa (15 percent). About five percent of respondents indicated that there were no obstacles facing them with regard to studying internationally.
The top sources of information on study in the U.S. were the U.S.-India Educational Foundation (USIEF)/EducationUSA advising center, fairs and online services; other internet sites or news media; and friends or classmates.
EducationUSA has seven comprehensive advising centers in India, located in Ahmedabad, Bangalore, Chennai, Hyderabad, Kolkata, Mumbai and New Delhi. For more information, please visit the United States-India Educational Foundation (USIEF) website at: http://www.usief.org.in/.
First Alternate Destination Choice Choice
United States 90.7% 6.7%
United Kingdom 3.7% 35.8%
Canada 1.6% 13.5%
Australia 1.2% 10.5%
Continental Europe 1.1% 17.7%
Southeast/East Asia 1.0% 12.3%
Undecided 0.5% 0.2%
Other 0.2% 1.8%
None (India) n/a 1.5%
TOTAL 100.0% n/a
Figure 9: Preferred Study Abroad Destinations of Prospective Students from India
Continental U.S. U.K. Australia Europe Asia Middle East
High quality higher education system 87.8 31.6 9.0 8.6 5.7 0.5
Wide range of schools and programs 74.9 22.5 8.9 4.7 3.7 0.6
Welcomes international students 68.0 24.1 13.1 7.1 7.8 3.2
Good student support services 60.6 19.2 7.9 6.1 5.0 1.3
Many scholarship opportunities 59.8 15.4 8.0 10.2 4.1 0.9
Safe place to study 59.7 24.1 4.7 11.2 9.6 2.3
Costly application process 51.1 39.5 7.7 8.4 1.8 0.7
Expensive tuition 50.4 41.2 10.2 8.5 1.9 1.1
Difficult to get a student visa 50.2 14.4 5.7 7.5 1.2 1.8
High cost of living 42.4 45.6 9.8 4.1 1.9 2.4
Language barrier 11.8 4.8 3.5 24.0 14.8 21.4
Figure 10: Percent of Students in India Who Agree the Statement Applies to the Study Destination
13

What International Students Think About U.S. Higher Education
III. Asia (cont.)
T hailand is currently the second leading place of origin in Southeast Asia (after Vietnam), the eighth place of origin in all of Asia and the 15th
leading place of origin worldwide of international students studying in the U.S. In 2009/10, 8,531 students from Thailand were studying at U.S. colleges and universities, a two percent decline over the previous year’s total.
Thirty percent of Thai students are studying in undergraduate degree programs, 53 percent are studying in graduate degree programs, seven percent are studying in non-degree programs and ten percent are participating in Optional Practical Training (OPT).
In spring 2010, IIE’s office in Bangkok conducted online and paper surveys of prospective international students in Thailand regarding their attitudes and perceptions of higher education in the U.S. and other potential host destinations. Students were also asked about their preferred study destinations, field of study, perceived obstacles facing overseas study, reasons for wishing to studying overseas and primary sources of information on U.S. study.
A total of 1,103 valid responses were received from five regions of Thailand: Bangkok (Central Thailand), the East, the North, the Northeast and the South. Just under half (46 percent) of the responses were from Bangkok; 65 percent of respondents were female and 35 percent were male.
Half (50 percent) were interested in pursuing graduate and/or professional studies abroad, about one quarter were interested in an undergraduate degree (23 percent in a bachelor’s degree and four percent in an associate’s degree), and 35 percent were also interested in language study abroad (respondents could select more than one choice).
The most popular reason for wishing to study in another country was to improve foreign language skills (cited by 54 percent of respondents). Quality or type of academic
program abroad was cited by 40 percent, 34 percent indicated preparing for a future career and 32 percent indicated the cultural experience (respondents could select more than one choice).
Business and management was the most popular field of study (chosen by 25 percent of the total), followed by physical and life sciences (15 percent), engineering and humanities (12 percent each).
The most frequently cited first-choice destination was the United States, with 55 percent of respondents listing the U.S. as their preferred destination in an open-ended question (fig. 11). The United Kingdom was the second most cited first-choice destination, with 19 percent of the total, followed by Australia (seven percent) and Japan (six percent). Other potential host destinations received less than five percent of the total.
The United Kingdom was the most popular alternative destination, with 34 percent of the total, followed by the U.S. with 24 percent and Australia with 12 percent. Eight percent each were interested in studying in Japan or in Continental Europe as an alternative if their first-choice was not available.
The majority of respondents perceived the U.S. to have a wide range of schools and programs (71 percent) and be welcoming to international students (70 percent) (fig. 12). The majority of respondents also felt the U.S. to have a high quality higher education system (65 percent) and many opportunities for student scholarships (61 percent). The percentages reported for the U.S. for all four of the above dimensions are significantly higher than those reported for the other four potential host destinations (the U.K., Australia, Japan and Germany).
However, many respondents also felt that it is difficult to get a visa to study in the U.S. (57 percent - the highest among the five potential host destinations) and that tuition in the U.S. is expensive (54 percent - about equal to the 53 percent reported for the U.K., and significantly higher than the percentages reported for the other potential host destinations).
14

Institute of International Education
C. Thailand
First Alternate Destination Choice Choice
United States 55.0% 24.1%
United Kingdom 18.9% 34.3%
Australia 7.2% 12.2%
Japan 6.3% 7.8%
Continental Europe 4.4% 8.0%
Asia 4.0% 5.5%
New Zealand 2.5% 3.4%
Canada 1.6% 4.9%
Other n/a n/a
TOTAL 100.0% n/a
Figure 11: Preferred Study Abroad Destinations of Prospective Students from Thailand
U.S. U.K. Australia Japan Germany
Wide range of schools and programs 71.2 42.6 27.0 14.2 10.1
Welcomes international students 70.1 33.9 39.5 20.4 15.7
High quality higher education system 65.1 49.4 19.6 18.6 14.2
Many scholarship opportunities 60.5 27.0 19.0 19.5 10.9
Difficult to get a student visa 57.0 31.0 9.4 18.1 10.8
Expensive tuition 53.8 53.3 13.2 20.7 13.1
High cost of living 50.4 55.1 13.6 29.0 14.5
Complicated application process 49.2 30.9 12.0 18.0 13.8
Safe place to study 31.8 39.6 22.8 23.8 14.0
Language barrier 26.5 18.7 11.5 51.9 40.2
Figure 12: Percent of Students in Thailand Who Agree the Statement Applies to the Study Destination
Almost 60 percent of respondents cited cost as a major obstacle to studying overseas, regardless of destination. Other obstacles cited were language difficulties (43 percent), finding accurate information (25 percent), cultural differences (18 percent) and distance from home or family (18 percent).
IIE’s Southeast Asia regional center, based in Bangkok, Thailand, was opened in 1962 as IIE’s first office in Asia. The Bangkok office provides educational programming and offers a wide range of services to local students, advisors and educators. The office represents the Educational Testing Service (ETS) with the TOEFL program and administers a number of scholarship programs.
For more information about IIE-Bangkok and its programs and services, please visit the IIE-Bangkok website at http://www.iiethai.org/.
15

What International Students Think About U.S. Higher Education: A Survey of Prospective Students in Eleven Key Places of Origin
Characteristic U.S. U.K. France Germany Australia Canada
Wide range of schools and programs 75.9 34.5 15.5 14.3 20.7 27.9
High quality higher education system 75.6 49.9 23.2 30.7 19.2 33.2
Welcomes international students 69.1 33.0 19.6 22.2 33.8 41.5
Tuition is expensive 60.1 51.0 19.2 11.2 17.5 23.1
Many scholarship opportunities 58.5 18.5 10.8 8.7 14.9 22.3
Good student support services 56.9 26.0 13.9 13.1 17.9 29.6
Difficult or complex visa procedures 49.3 23.2 9.3 5.9 10.9 13.4
Safe place to study 46.3 37.5 32.4 27.2 31.6 45.8
High cost of living 44.7 53.9 33.3 19.0 17.0 19.7
Language barrier 10.7 9.5 55.6 56.4 6.2 3.6
Number of responses 9,379 7,781 5,045 2,701 8,965 4,153
Percent of Respondents Who Felt the Characteristic Applied to the Study Destination
Respondents’ First-Choice InternationalStudy Destination
Destination % of Total
United States 74.9% United Kingdom 8.4% Canada 5.0% Australia 3.0% France 1.4% Germany 1.0% Spain 1.0% Japan 1.0% Other 4.3%
TOTAL (N=9,330) 100.0%
This report was funded by a grant from the United States Department of State. The opinions, findings and conclusions stated herein are those of the authors and do not necessarily reflect those of the United States Department of State.
POTENTIAL INTERNATIONAL STUDY DESTINATIONS
COUNTRIES WHERE THE SURVEY WAS CONDUCTED*
*Germany and the United Kingdom are both potential destinations and countries where the survey was conducted.

What International Students Think About U.S. Higher Education: A Survey of Prospective Students in Eleven Key Places of Origin
Number of International Students Studying in the Top Five Global Host Destinations by Place of Origin, 2009
PLACES OF ORIGIN WHERE SURVEY WAS CONDUCTED
All China (incl. HOST Places of Hong South COUNTRY Origin Brazil Germany Kong) India Mexico Nigeria Africa Thailand Turkey Vietnam U.K.
U.S. 690,923 8,786 9,548 135,662 104,897 13,450 6,568 1,656 8,531 12,397 13,112 8,861
U.K. 415,585 1,385 17,980 50,460 36,105 1,303 15,105 1,539 4,181 2,370 no data n/a
France 278,213 2,931 8,346 28,934 756 1,546 179 90 637 2,011 6,399 2,549
Germany 244,776 2,246 n/a 24,478 3,516 1,584 555 156 993 24,233 3,671 1,781
Australia 245,593 4,938 no data 82,203 26,398 no data no data 763 4,573 no data 7,595 1,696
Sources: Project Atlas, AEI, DAAD, French Ministry of Higher Education and Research, HESA (2007 data), UNESCO (2008 data)
Conducted by IIE in cooperation with EducationUSA

What International Students Think About U.S. Higher Education
III. Asia (cont.)
V ietnam has experienced one of the largest and fastest growth rates for international students coming to the U.S. over the past
decade. The number of students from Vietnam studying at U.S. colleges and universities increased eightfold during this period, to 13,112 students in 2009/10. This increase took place largely between 2006 and 2009, with annual percentage increases of 46 percent in 2008/09 and 45 percent in 2007/08, following an increase of 31 percent in 2006/07. During the same period, the average rate of increase for all places of origin ranged from three percent in 2006/07 to eight percent in 2008/09.
As a consequence of this rapid growth, Vietnam entered the top 20 places of origin of international students in the U.S. in 2006/07 at 20th place, moving up to 13th place in 2007/08 and to ninth place in 2008/09. While the growth rate slowed to two percent in 2009/10, Vietnam remains in ninth place, just ahead of Turkey and behind Mexico. At community colleges, Vietnam is the second leading place of origin, after South Korea. About 68 percent of students from Vietnam are studying in undergraduate degree programs, 19 percent are studying in graduate degree programs, ten percent are in non-degree programs and four percent are participating in Optional Practical Training (OPT).
IIE conducted an online survey in March 2009 of 707 prospective students in Vietnam who had visited the U.S. Department of State-funded EducationUSA advising centers in Ho Chi Minh City and Hanoi and/or had attended one of the IIE Higher Education Fairs in Ho Chi Minh City, Hanoi or Danang. Students were surveyed regarding their preferred study destinations, reasons for wishing to study abroad, perceived obstacles, main sources of information on studying in the U.S. and their impressions of five potential host destinations (the United States, the United Kingdom, Australia, France and Singapore).
The U.S. was the overwhelming first-choice destination for respondents in Vietnam, with 82 percent of respondents listing the U.S. in an open-ended question, followed by
eight percent for Australia and five percent for the U.K. (fig. 13). Australia led among alternative destinations, with 31 percent of the total, followed by the United Kingdom (21 percent) and Singapore (14 percent).
The most important reason cited for studying abroad was the quality or type of academic program. Eighty-three percent of respondents indicated that this was one of their main reasons for wishing to study abroad. The cultural experience and improving language skills were selected by two-thirds of respondents and just over half of respondents indicated that preparing for a future career in a foreign country or foreign-based company and obtaining a degree were main reasons for studying abroad. Almost nine out of every ten respondents (89 percent) felt that good English language ability would aid them in a future job search and over 70 percent also felt that an international degree or international experience would aid them in their future job search.
Cost was the most frequently cited obstacle to being able to study in another country (cited by 84 percent of respondents), followed by finding accurate information (46 percent), obtaining a visa (36 percent), the language barrier (35 percent) and cultural differences (33 percent).
Over three-quarters of respondents (77 percent) indicated that the internet was one of their top three main sources of information on study in the U.S., followed by the EducationUSA advising center or U.S. embassy/consulate (51 percent), U.S. higher education fairs or information sessions (48 percent), friends or classmates (30 percent), foreign recruiters or school representatives (21 percent) and teachers or professors (19 percent).
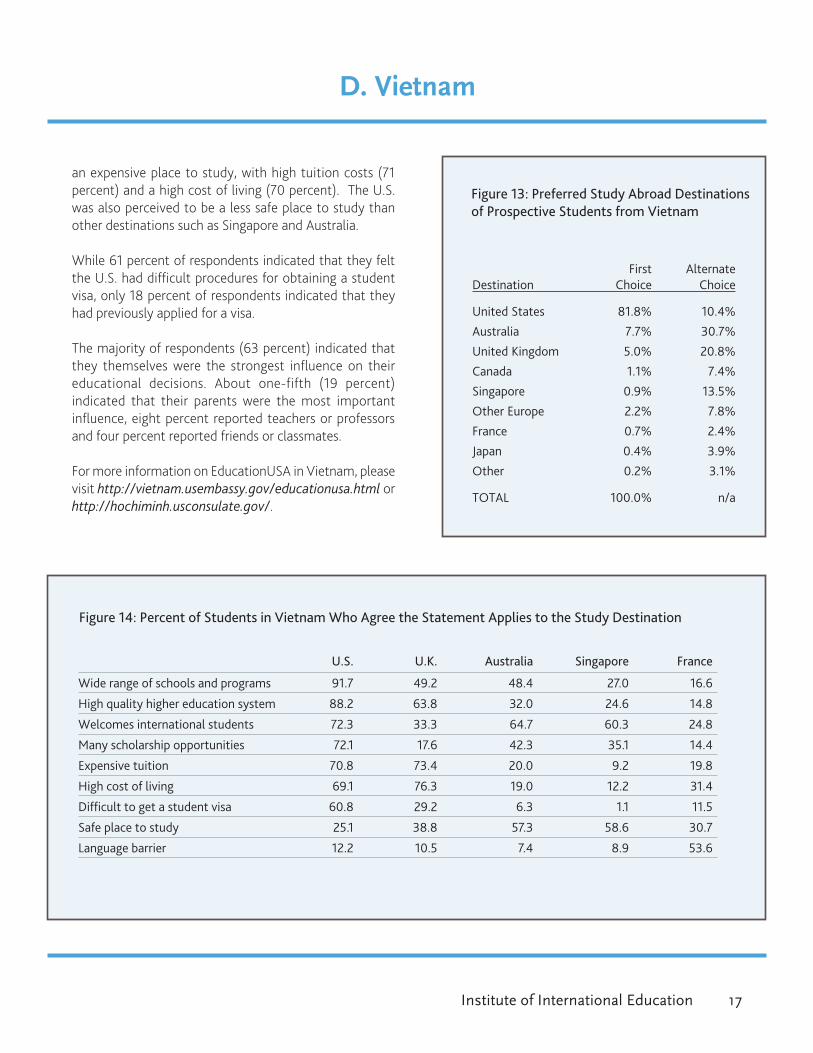
The U.S. was perceived by most respondents to have a wide range of schools and programs (92 percent) and a high quality higher education system (88 percent), and be welcoming to international students and to have many scholarships opportunities (72 percent each) (fig. 14).
However, many respondents also felt that the U.S. was
16
Institute of International Education
D. Vietnam
an expensive place to study, with high tuition costs (71 percent) and a high cost of living (70 percent). The U.S. was also perceived to be a less safe place to study than other destinations such as Singapore and Australia.
While 61 percent of respondents indicated that they felt the U.S. had difficult procedures for obtaining a student visa, only 18 percent of respondents indicated that they had previously applied for a visa.
The majority of respondents (63 percent) indicated that they themselves were the strongest influence on their educational decisions. About one-fifth (19 percent) indicated that their parents were the most important influence, eight percent reported teachers or professors and four percent reported friends or classmates.
For more information on EducationUSA in Vietnam, please visit http://vietnam.usembassy.gov/educationusa.html or http://hochiminh.usconsulate.gov/.
First Alternate Destination Choice Choice
United States 81.8% 10.4%
Australia 7.7% 30.7%
United Kingdom 5.0% 20.8%
Canada 1.1% 7.4%
Singapore 0.9% 13.5%
Other Europe 2.2% 7.8%
France 0.7% 2.4%
Japan 0.4% 3.9%
Other 0.2% 3.1%
TOTAL 100.0% n/a
Figure 13: Preferred Study Abroad Destinations of Prospective Students from Vietnam
U.S. U.K. Australia Singapore France
Wide range of schools and programs 91.7 49.2 48.4 27.0 16.6
High quality higher education system 88.2 63.8 32.0 24.6 14.8
Welcomes international students 72.3 33.3 64.7 60.3 24.8
Many scholarship opportunities 72.1 17.6 42.3 35.1 14.4
Expensive tuition 70.8 73.4 20.0 9.2 19.8
High cost of living 69.1 76.3 19.0 12.2 31.4
Difficult to get a student visa 60.8 29.2 6.3 1.1 11.5
Safe place to study 25.1 38.8 57.3 58.6 30.7
Language barrier 12.2 10.5 7.4 8.9 53.6
Figure 14: Percent of Students in Vietnam Who Agree the Statement Applies to the Study Destination
17

What International Students Think About U.S. Higher Education
IV. Europe
Europe is the largest host region of international students, receiving 39 percent of all globally mobile students (UNESCO, 2010). However, the
majority of international students studying at European higher education institutions come from other countries in Europe and approximately 77 percent of mobile students from Western Europe remain within Western Europe.
The 85,084 students from Europe studying in the U.S. in 2009/10 comprised 12 percent of the international student total (Open Doors, 2010). The top European places of origin (in rank order) are Turkey, Germany and the United Kingdom. European students in the U.S. participate in both undergraduate (38 percent) and graduate (39 percent) degree programs, as well as in non-degree programs (15 percent) and on Optional Practical Training (eight percent).
Germany is the second leading European place of origin of international students in the U.S. and the 12th leading place of origin overall. In 2009/10,
9,548 German students were studying at U.S. colleges and universities, a one percent decline over the previous year.
In fall 2010, IIE worked with EducationUSA in Germany to survey prospective German students on their attitudes and perceptions of U.S. higher education and other potential host destinations. A total of 429 valid responses were received; 61 percent were from women and 39 percent were from men. The majority of respondents (59 percent) were just beginning to think about international study at the time of the survey, but 32 percent had already decided to study internationally and nine percent had already studied in another country.
The cultural experience was the reason cited by the most respondents (81 percent) when asked about their main reasons for wishing to study internationally. Other reasons cited were preparing for a future career (47 percent), making professional contacts (32 percent), the quality or type of academic programs abroad (28 percent) and improving foreign language skills (15 percent).
Respondents were interested in pursuing a variety of different types of study overseas, including language study (36 percent), graduate degrees (27 percent), undergraduate degrees (17 percent), short-term exchanges or non-degree study (nine percent), internships or practical training (six percent), professional degrees, such as an MBA, JD or MD (five percent) and two-year degrees or certificates (four percent) (respondents could select more than one choice). About 19 percent were still undecided as to what type of study abroad they wished to pursue.
Business and management was the most popular intended field of study, chosen by one-fifth (20 percent) of respondents, followed the humanities (17 percent) and language study (16 percent). Education was selected by nine percent of respondents, social sciences by eight percent, physical and life sciences and engineering by seven percent each.
The United States was the most frequently cited first-choice destination in an open response question, with 54 percent of respondents listing the U.S. as their top choice (fig. 15). The United Kingdom was the second most frequently cited first-choice destination, with 14 percent of the total, followed by France (six percent), Canada (four percent), Spain (three percent), Australia (two percent) and New Zealand (also two percent).
Among alternative study destinations, 29 percent each chose the U.S. and the U.K., with 19 percent choosing Canada, 18 percent choosing Australia, 11 percent choosing France and ten percent choosing New Zealand.
The majority of respondents felt that the U.S. welcomes international students (71 percent), has a wide range of schools and programs (66 percent) and has a high quality higher education system (57 percent). These are in most cases much higher percentages than were reported for the other host destinations (fig. 16). Many respondents also felt that the U.S. offers many scholarship opportunities (47 percent) and has good student support services (43 percent).
18

Institute of International Education
A. Germany
However, the majority of respondents also felt that tuition in the U.S. is expensive (69 percent), and some felt that it is difficult to obtain a visa to study in the U.S. (43 percent) and that the school application process is costly (37 percent).
More than three-fourths of respondents (78 percent) cited the cost of study abroad as a major obstacle to international study, regardless of destination, followed by gaining acceptance to the institution of their choice (44 percent) and finding accurate information (30 percent). Other obstacles cited included the cost of the visa and application process (22 percent), distance from home or family (19 percent), the language barrier (17 percent) and obtaining a visa (10 percent).
Respondents cited teachers and professors and the EducationUSA advising center as their top sources of information on study in the U.S. (35 percent each), followed by friends or classmates (30 percent), and the internet or news media (21 percent).
For more information about EducationUSA in Germany, please visit http://www.educationusa.de/.
First Alternate Destination Choice Choice
United States 53.9% 29.4%
United Kingdom 14.0% 29.2%
France 5.7% 10.8%
Canada 4.0% 19.2%
Spain 3.2% 8.5%
Australia 2.4% 18.1%
New Zealand 1.9% 10.2%
Other Europe 9.2% 25.1%
Other 5.7% 23.3%
No alternate choice n/a 1.6%
TOTAL 100.0% n/a
Figure 15: Preferred Study Abroad Destinations of Prospective Students from Germany
U.S. U.K. France Netherlands Switzerland Austria
Welcomes international students 71.0 46.6 28.7 40.1 28.0 24.4
Expensive tuition 68.8 38.2 8.5 7.2 18.6 4.3
Wide range of schools and programs 66.4 31.2 17.1 18.1 15.2 10.4
High quality higher education system 57.2 57.2 20.3 22.9 36.7 14.5
Many scholarships available 47.1 18.6 8.0 7.0 4.3 4.8
Difficult to get a student visa 43.2 3.6 1.9 1.2 5.3 1.4
Good student support services 42.8 27.1 12.3 19.1 22.2 15.5
Costly application process 37.2 16.9 2.1 5.1 9.4 2.2
Safe place to study 36.5 36.5 31.2 34.5 39.1 36.5
High cost of living 30.4 45.7 22.2 8.0 48.8 11.1
Language barrier 5.1 3.1 42.3 36.2 6.0 2.9
Figure 16: Percent of Students in Germany Who Agree the Statement Describes the Study Destination
19

What International Students Think About U.S. Higher Education
IV. Europe (cont.)
T urkey is the top European place of origin of international students in the U.S. and the tenth leading place of origin worldwide. In 2009/10,
there were 12,397 Turkish students studying at U.S. colleges and universities, a two percent increase over the previous year’s total.
In fall 2010, IIE worked with EducationUSA, the Turkish Fulbright Commission and the Turkish-American Association in Ankara to survey Turkish students interested in coming to the U.S. to study regarding their attitudes and perceptions of U.S. higher education compared to other potential host destinations. Students were also asked about perceived obstacles to overseas study, preferred destinations, intended fields of study, reasons for wishing to study internationally and primary sources of information on studying in the U.S.
A total of 1,189 valid responses were received, about equally distributed among male and female respondents. Almost three-quarters (73 percent) had already decided to study overseas, while the remaining 27 percent were just beginning to consider international study.
Most respondents (71 percent) were interested in pursuing a graduate degree abroad; 28 percent were interested in non-degree foreign language study, 17 percent were interested in pursuing an undergraduate degree abroad, 14 percent were interested in a professional degree (e.g., MBA, JD, MD, etc.), and nine percent were interested in obtaining a two-year degree or certificate (respondents could select more than one choice).
The main reason cited for wishing to study in another country was the quality or type of academic programs available (cited by 69 percent of respondents), followed by the cultural experience (51 percent), preparing for a future career (43 percent) and making professional contacts (42 percent).
The most popular intended field of study was engineering, chosen by 21 percent of respondents, followed social sciences (19 percent), business and/or management (12
percent) and education (10 percent). Physical or life sciences were chosen by seven percent, mathematics or computer science by six percent and fine or applied arts by four percent.
The U.S. was the preferred destination listed by 82 percent of respondents in an open-response question. The United Kingdom was the second most cited first-choice destination, with nine percent of the total, followed by Germany (two percent) (fig. 17).
The United Kingdom was the most cited alternative destination, with 64 percent of respondents considering the U.K. as a possible second-choice if their first choice was not available. Germany followed with 32 percent, and Canada with 27 percent. About 14 percent chose the U.S. as a possible alternate destination. The majority (78 percent) of the respondents who did not select the U.S. as their first-choice destination did select it as an alternate choice.
The U.S. was considered a welcoming country for international students by about three-quarters (74 percent) of respondents (fig. 18). Over two-thirds (67 percent) felt that the U.S. has a high quality higher education system, and 61 percent felt that the U.S. has a wide range of schools and programs.
However, half of respondents also felt that tuition in the U.S is expensive (51 percent), and about one-third felt that the school application process is expensive (35 percent) and the cost of living in the U.S. is expensive (32 percent). Just over one-fifth (22 percent) felt that it is difficult to obtain a visa to study in the U.S. Eleven percent felt that American English presented a significant language barrier.
When asked about potential obstacles to international study, 76 percent of respondents cited cost as a major obstacle, regardless of destination. About one-third cited gaining acceptance to the institution of their choice (36 percent) and the cost of the visa and application process (32 percent) ,and just over one quarter cited finding accurate information as a major obstacle (26 percent).
20

Institute of International Education
B. Turkey
The Turkish Fulbright Commission provides scholarships for American and Turkish citizens to study in the other country, as well as educational advising and accurate, unbiased information about all accredited U.S. higher edducation institutions free of charge as part of the EducationUSA network. The Turkish Fulbright Commission has granted study and research funds for over 1,000 American and nearly 3,000 Turkish students, scholars and professionals since 1949. For more information, please visit http://www.fulbright.org.tr/.
The Turkish-American Association (TAA) in Ankara, is one of the oldest and most prestigious binational centers in Turkey. The association promotes understanding between Turks and Americans and strengthens “the friendship and cultural ties between the two countries.” TAA organizes lectures, cultural activities and English and Turkish language classes. For more information, please visit http://www.taa-ankara.org.tr/.
First Alternate Destination Choice Choice
United States 82.3% 13.5%
United Kingdom 9.3% 64.0%
Germany 2.0% 32.0%
Spain 1.3% 15.2%
France 1.2% 16.7%
Canada 1.1% 26.6%
Australia 0.2% 13.8%
Other Europe 1.9% 42.8%
Other 0.7% 10.4%
TOTAL 100.0% n/a
Figure 17: Preferred Study Abroad Destinations of Prospective Students from Turkey
Continental Turkic U.S. U.K. Australia Europe Republics
Welcomes international students 74.0 44.0 26.2 44.4 21.2
High quality higher education system 67.4 55.8 20.0 40.6 5.7
Wide range of schools and programs 61.2 40.1 20.3 40.8 9.5
Expensive tuition 50.6 52.8 16.9 25.8 8.2
Good student support services 39.1 25.1 25.1 14.5 8.2
Many scholarship opportunities 36.8 13.5 16.2 8.1 6.0
Costly application process 35.3 31.3 18.8 13.6 4.6
High cost of living 31.8 43.5 22.5 14.0 5.7
Safe place to study 24.4 33.1 24.6 14.6 12.2
Difficult to get a student visa 22.1 26.1 11.9 8.2 1.6
Language barrier 10.7 9.7 11.7 7.5 5.6
Figure 18: Percent of Students in Turkey Who Agree the Statement Describes the Study Destination
21

What International Students Think About U.S. Higher Education
IV. Europe (cont.)
T he United Kingdom is the third leading place of origin in Europe and the 13th leading place of origin worldwide of international students in
the U.S. There were 8,861 British students in the U.S. in 2009/10, a two percent increase over the previous year.
In fall 2010, IIE collaborated with EducationUSA and the U.S.-U.K. Fulbright Commission to conduct a survey of prospective British students regarding their attitudes and perceptions of U.S. higher education compared to other potential host destinations. Students were also asked about perceived obstacles to international study, preferred study destinations, intended major or field of study, reasons for wishing to study overseas and primary sources of information on studying in the U.S.
Of the 1,598 valid student responses received, 58 percent were from female respondents and 42 percent were from male respondents. The majority (61 percent) were just beginning to consider international study, while 38 percent had already decided to study internationally and one percent had already studied in another country.
About half (49 percent) of respondents were interested in pursuing an undergraduate degree abroad, while 42 percent were interested in a graduate degree, eight percent each were interested in a professional degree (e.g., MBA, JD, MD, etc.), a two-year degree or certificate, or non-degree study, including exchange programs (respondents could select more than one choice). Nine percent were still undecided as to what level of studies they wished to pursue abroad.
The cultural experience was the main reason cited for wishing to study overseas (78 percent of respondents), followed by preparing for a future career (52 percent) and making professional contacts (36 percent).
The highest proportion of respondents (84 percent) cited cost as a major obstacle to international study, regardless of destination, followed by gaining acceptance to the institution of their choice (46 percent) and finding accurate information (35 percent). Other obstacles included distance from home or family (cited by 25 percent of respondents),
the length of the application process (24 percent) and obtaining a visa (23 percent).
Social science was the most popular intended field of study, chosen by 31 percent of respondents, followed humanities (25 percent) and business/management (21 percent). Physical and life sciences were chosen by 15 percent, fine or applied arts by 14 percent, mathematics or computer science by nine percent, engineering by seven percent and education by six percent.
The most frequently cited first-choice destination by an overwhelming margin was the United States, with 85 percent of respondents listing the U.S. as their first-choice destination in an open-ended question. Australia was the second most frequently cited first-choice destination, with four percent of the total, followed by Canada with three percent (fig. 19).
Among possible alternate destinations, 23 percent listed Canada, followed by Australia (19 percent) and the United States (11 percent). About one-third of respondents (32 percent) indicated that they did not have a second-choice destination and preferred instead to remain in the United Kingdom for their studies if they could not study in their first-choice destination.
Over 80 percent of respondents perceived the U.S. to have a wide range of schools and programs (89 percent), welcome international students (82 percent) and have a high quality higher education system (81 percent). These are more than double the percentages that were reported for most of the other host destinations (fig. 20).
More than half of respondents also felt that the U.S. offers many scholarship opportunities (63 percent), is a safe place to study (61 percent) and has good student support services (59 percent).
However, the majority of respondents also felt that tuition in the U.S is expensive (86 percent), the school application process is expensive (63 percent) and the cost of living in the U.S. is expensive (51 percent). Half (50 percent) felt that it is difficult to obtain a visa to study in the U.S.
22

Institute of International Education
C. United Kingdom
The top source of information on study in the U.S. was the Fulbright/EducationUSA advising team (57 percent), followed by the internet or news media (50 percent), teachers or professors (33 percent), career advisors or study abroad staff (27 percent) and friends or classmates (26 percent).
The U.S.-U.K. Fulbright Commission promotes peace and cultural understanding through educational exchange. The Commission offers awards and summer programs for U.K. citizens to study, lecture or conduct research in the U.S. and vice versa. As part of the EducationUSA network, the Commission is also the official source of information on applying to U.S. universities for the United Kingdom. In addition to their website on U.S.-U.K. exchange, the Commission organizes a number of recruitment events annually, such as a USA College Day fair, USA Grad School Day workshop, outreach to U.K. schools and various seminars. For more information, please visit the Commission’s website: http://www.fulbright.co.uk/.
First Alternate Destination Choice Choice
United States 85.0% 10.5%
Australia 3.5% 18.5%
Canada 3.2% 23.2%
France 1.3% 8.2%
New Zealand 0.8% 3.9%
Other Europe 2.8% 23.0%
Asia 2.0% 7.9%
Latin America 0.5% 0.9%
Other n/a n/a
No alternate choice n/a 32.4%
TOTAL 100.0% n/a
Figure 19: Preferred Study Abroad Destinations of Prospective Students from the United Kingdom
U.S. Canada Australia France Germany Ireland
Wide range of schools and programs 88.7 33.0 24.9 16.8 17.3 10.8
Expensive tuition 85.5 31.98 23.4 10.7 9.9 9.5
Welcomes international students 81.6 46.4 41.1 26.0 26.7 28.3
High quality higher education system 81.0 36.0 24.1 21.9 25.1 15.9
Many scholarship opportunities 63.3 17.0 10.6 6.4 7.3 5.6
Costly application process 63.3 20.2 14.1 5.8 5.3 4.9
Safe place to study 60.5 50.2 44.6 36.5 36.4 38.8
Good student support services 58.6 27.3 21.8 12.0 13.1 19.1
High cost of living 51.0 22.3 22.0 28.7 22.1 23.8
Difficult to get a student visa 49.7 20.9 25.7 2.4 2.6 1.3
Language barrier 1.3 1.8 0.6 60.8 67.6 2.0
Figure 20: Percent of Students in the U.K. Who Agree the Statement Describes the Study Destination
23

What International Students Think About U.S. Higher Education
V. Latin America
The 65,632 students from Latin America (including Mexico and the Caribbean) comprised nine percent of the total international student
population of 690,923 in the U.S. in 2009/10 (Open Doors, 2010). The top places of origin in Latin America are Mexico, Brazil and Colombia. The majority (52 percent) of students from Latin America are studying in undergraduate degree programs, with 33 percent enrolled in graduate degree programs and 15 percent in non-degree programs or Optional Practical Training (OPT).
B razil is the second leading place of origin in Latin America and the 14th leading places of origin worldwide of international students in
the U.S. In 2009/10, 8,786 students from Brazil were studying at U.S. colleges and universities, 47 percent at the undergraduate level, 36 percent at the graduate level and the remainder in non-degree programs and Optional Practical Training (OPT).
In fall 2010, IIE and EducationUSA in Brazil conducted a survey of Brazilian students who were considering studying internationally on their attitudes and perceptions of U.S. higher education and other potential host destinations. A total of 2,326 valid responses were received from across Brazil; 55 percent were from women and 45 percent were from men. Half (50 percent) had just begun to think about international study, while slightly less than half (48 percent) had already decided to study internationally, and the remainder had previously studied in another country and wished to do so again.
The cultural experience was the main reason cited (by 70 percent of respondents), followed by the quality or type of academic programs abroad (56 percent), preparing for a future career (54 percent) and making professional contacts (33 percent) (respondents could cite more than one reason).
The majority of respondents (57 percent) were interested in pursuing foreign language study, particularly intensive English; 38 percent were interested in pursuing a graduate
degree; 25 percent were interested in a professional degree (e.g., MBA, MD, JD, etc.) and 20 percent were interested in an undergraduate degree (respondents could select more than one choice).
Business and management was the most popular intended field of study, chosen by 19 percent of respondents, followed by intensive language study (16 percent), humanities (14 percent) and engineering (12 percent). Physical/life sciences were chosen by nine percent, education by eight percent, social sciences and fine/applied arts by six percent each, mathematics or computer science by five percent and other fields of study (including law, health professions and communications/journalism) by three percent.
The United States was the most frequently cited first-choice destination by a large margin, with 68 percent of respondents listing the U.S. in an open-response question. Canada was chosen by 13 percent and the United Kingdom by 11 percent (fig. 21). No other destination received more than three percent of the total.
Among alternative destinations, 35 percent chose the United Kingdom, followed by Canada (29 percent) and the United States (18 percent).
Almost three-quarters of respondents perceived the U.S. to have a wide range of schools and programs (74 percent), a high quality higher education system (73 percent), to offer good student support services (63 percent) and to have many scholarship opportunities (also 63 percent). These are significantly higher than the percentages reported for the other host destinations (fig. 22).
More than half of respondents also felt that the U.S. welcomes international students (55 percent) and is a safe place to study (54 percent).
However, many respondents also felt that it is difficult to obtain a visa to study in the U.S. (59 percent), that tuition at U.S colleges and universities is expensive (52 percent), that the school application process is costly (51 percent).
Two-thirds of respondents (66 percent) cited the cost of international study as a major obstacle, regardless of destination. Other significant obstacles were gaining
24

Institute of International Education
A. Brazil
acceptance to the institution of their choice (28 percent), distance from home or family and finding accurate information (22 percent each), the cost of the visa and application process (21 percent), obtaining a visa (15 percent), language difficulties (14 percent), cultural differences (nine percent) and personal obstacles such as work and family obligations (two percent). Four percent of respondents indicated that there were no obstacles.
The top source of information on study in the U.S. cited was the EducationUSA advising center, higher education fairs and online services (45 percent), followed closely by the internet or news media (42 percent), teachers or professors (36 percent) and friends or classmates (33 percent).
EducationUSA is present in over 20 offices across Brazil, with trained advisers based in several partner institutions, under the coordination of the Fulbright Commission in Brazil. For more information on EducationUSA in Brazil, please visit http://www.educationusa.org.br/.
First Alternate Destination Choice Choice
United States 67.6% 18.2%
Canada 12.5% 28.8%
United Kingdom 10.7% 34.7%
Australia 2.3% 12.9%
France 1.7% 9.9%
Germany 1.6% 6.6%
Other Europe 2.1% 15.3%
Other 1.5% 7.2%
No alternate choice n/a 2.1%
TOTAL 100.0% n/a
Figure 21: Preferred Study Abroad Destinations of Prospective Students from Brazil
U.S. U.K. Canada Australia France Argentina
Wide range of schools and programs 74.4 30.1 26.0 15.3 14.1 5.5
High quality higher education system 73.0 50.0 33.1 16.7 27.0 3.5
Good student support services 62.9 28.3 32.6 21.3 15.4 6.1
Many scholarship opportunities 62.5 19.0 27.4 15.7 13.2 7.6
Difficult to get a student visa 59.0 25.7 9.1 7.7 14.6 1.4
Welcomes international students 55.3 23.0 39.6 31.3 12.0 19.6
Safe place to study 54.4 43.0 44.7 35.4 30.1 8.1
Expensive tuition 51.6 48.0 18.7 19.1 26.7 3.1
Costly application process 51.0 37.5 18.4 17.5 19.6 4.0
High cost of living 40.7 57.1 19.9 18.6 38.9 2.3
Language barrier 8.0 8.0 6.5 5.0 53.3 6.7
Figure 22: Percent of Students in Brazil Who Agree the Statement Describes the Study Destination
25

What International Students Think About U.S. Higher Education
V. Latin America (cont.)
M exico is the top Latin American place of origin of international students studying in the U.S., and the eighth leading place
of origin overall. In 2009/10, 13,450 Mexican students were studying at U.S. colleges and universities, a decline of nine percent over the previous year’s total. The majority (57 percent) are studying at the undergraduate level, 29 percent are studying at the graduate level and the remainder are enrolled in non-degree programs and Optional Practical Training (OPT).
In summer 2010, IIE and EducationUSA conducted a survey of Mexican students interested in studying in the U.S. regarding their attitudes and perceptions of the U.S. as a study destination compared to other potential host destinations. A total of 396 valid responses were received. Respondents were drawn from four regions in Mexico: the Center (including Mexico City) (47 percent of respondents), the South (26 percent), the North (16 percent), the East (seven percent) and the West (four percent). About 33 percent of respondents were from Mexico City itself; 52 percent of respondents were female and 48 percent were male.
The majority of respondents (74 percent) were interested in pursuing graduate and/or professional studies abroad, with 34 percent also interested in language study (e.g., intensive English), 18 percent interested in undergraduate studies and 11 percent interested in an associate’s degree or certificate program (respondents could select more than one choice).
Business and management was the most popular intended field of study, chosen by 28 percent of respondents, followed by engineering and social science (12 percent each) and education (10 percent).
The most frequently cited first-choice destination was the United States, with 59 percent of respondents listing the U.S. as their first-choice destination in an open-ended question. Spain was the next most often cited first-choice destination, with 11 percent of the total, followed by Canada with nine percent (fig. 23). Male respondents and respondents from Mexico City were more likely than
women and those outside Mexico City to choose the U.S. as their first choice, while those outside Mexico City were more likely to choose Spain and Canada.
The United Kingdom was the most popular alternative destination, with 16 percent of the total, followed closely by Canada and the U.S. (15 percent each) and Spain (12 percent). Among respondents who did not select the U.S. as their first-choice destination, 61 percent did select it as an alternate destination.
The U.S. was perceived to have a high quality higher education system by 87 percent of respondents, significantly higher than the other host destinations (fig. 24). In addition, 86 percent of respondents felt the U.S. had a wide range of schools and programs and that the U.S. welcomes international students, also significantly higher than for the other host destinations. More than two-thirds (68 percent) of respondents also felt that the U.S. offers good student support services, 61 percent felt that the U.S. was a safe place to study and 58 percent felt that there were many scholarship opportunities for study in the U.S.
However, almost three-quarters (74 percent) of respondents felt tuition in the the U.S. to be expensive, 64 percent felt that the school application process was costly and 51 percent felt that the cost of living in the U.S. was expensive. More than half of respondents (58 percent) felt that the process to obtain a student visa was complicated. About 16 percent felt that American English posed a language barrier, slightly higher than for British and Australian English.
The highest proportion of respondents (81 percent) cited cost as a major obstacle to international study, regardless of destination, followed by gaining acceptance to the institution of their choice (34 percent) and the cost of the visa and application process (28 percent). Men were more concerned about cost and visa issues than women. Respondents from Mexico City were more concerned about gaining acceptance than those outside the capital, while respondents from outside Mexico City were more likely to be concerned about cost and the language barrier.
26
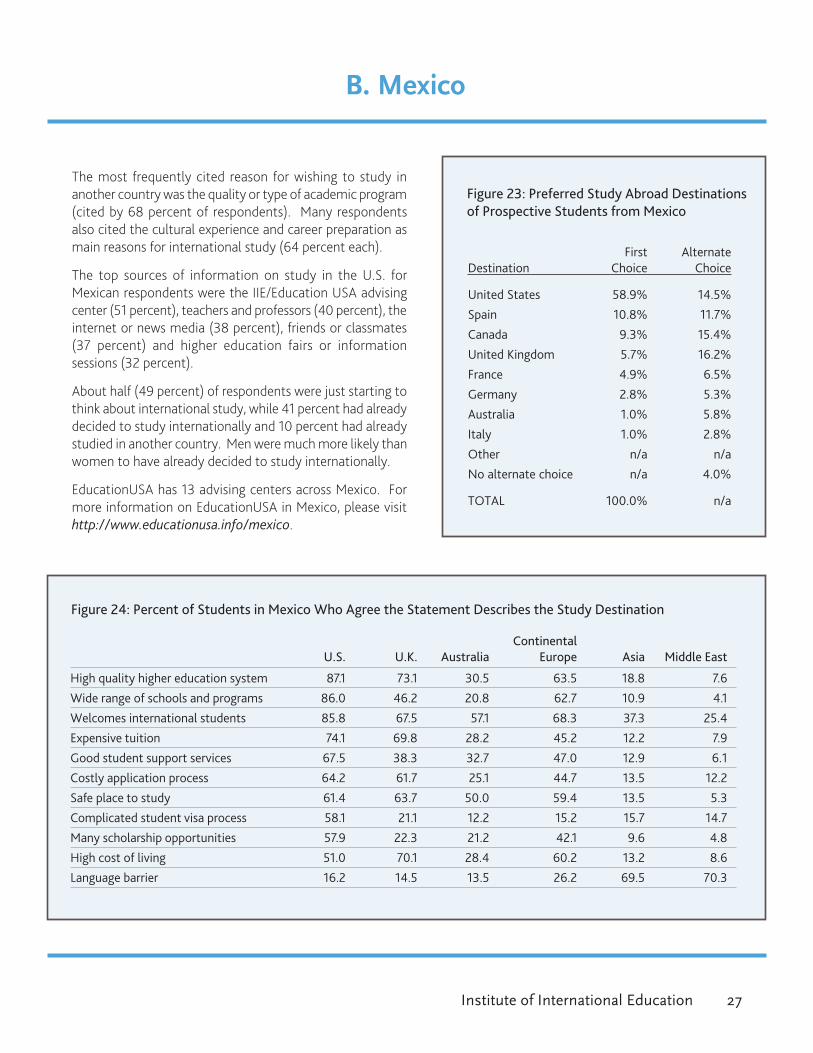
Institute of International Education
B. Mexico
The most frequently cited reason for wishing to study in another country was the quality or type of academic program (cited by 68 percent of respondents). Many respondents also cited the cultural experience and career preparation as main reasons for international study (64 percent each).
The top sources of information on study in the U.S. for Mexican respondents were the IIE/Education USA advising center (51 percent), teachers and professors (40 percent), the internet or news media (38 percent), friends or classmates (37 percent) and higher education fairs or information sessions (32 percent).
About half (49 percent) of respondents were just starting to think about international study, while 41 percent had already decided to study internationally and 10 percent had already studied in another country. Men were much more likely than women to have already decided to study internationally.
EducationUSA has 13 advising centers across Mexico. For more information on EducationUSA in Mexico, please visit http://www.educationusa.info/mexico.
First Alternate Destination Choice Choice
United States 58.9% 14.5%
Spain 10.8% 11.7%
Canada 9.3% 15.4%
United Kingdom 5.7% 16.2%
France 4.9% 6.5%
Germany 2.8% 5.3%
Australia 1.0% 5.8%
Italy 1.0% 2.8%
Other n/a n/a
No alternate choice n/a 4.0%
TOTAL 100.0% n/a
Figure 23: Preferred Study Abroad Destinations of Prospective Students from Mexico
Continental U.S. U.K. Australia Europe Asia Middle East
High quality higher education system 87.1 73.1 30.5 63.5 18.8 7.6
Wide range of schools and programs 86.0 46.2 20.8 62.7 10.9 4.1
Welcomes international students 85.8 67.5 57.1 68.3 37.3 25.4
Expensive tuition 74.1 69.8 28.2 45.2 12.2 7.9
Good student support services 67.5 38.3 32.7 47.0 12.9 6.1
Costly application process 64.2 61.7 25.1 44.7 13.5 12.2
Safe place to study 61.4 63.7 50.0 59.4 13.5 5.3
Complicated student visa process 58.1 21.1 12.2 15.2 15.7 14.7
Many scholarship opportunities 57.9 22.3 21.2 42.1 9.6 4.8
High cost of living 51.0 70.1 28.4 60.2 13.2 8.6
Language barrier 16.2 14.5 13.5 26.2 69.5 70.3
Figure 24: Percent of Students in Mexico Who Agree the Statement Describes the Study Destination
27

What International Students Think About U.S. Higher Education
VI. Conclusion
The United States hosted a record high of over 690,000 international students during the 2009/10 academic year (Open Doors, 2010).
In the recent IIE/AIFS publication Who Goes Where and Why? (IIE, 2011), Caroline Macready and Clive Tucker identify several reasons for optimism that the flow of international students will continue to increase in the coming years. These include population demographics - as the world population becomes increasingly concentrated in developing countries with high birth rates, the resulting increase in demand for higher education in these countries will not be met by the existing domestic higher education capacity; the new global economy in which China, India and other Asian countries have become major economic powers; and the importance of being taught in English and other world languages in degree programs that are internationally recognized.
Macready and Tucker also identify reasons for caution, which also need to be taken into account. For example, traditional sending destinations are now strengthening their own domestic higher education sectors; and the emergence of transnational “borderless” education, which allows students to take advantage of international degree programs while remaining in their home countries.
Students take into account a variety of different factors when making the decision to study in another country. “Push factors” are those that encourage students to leave their home country to study internationally. These include not being able to find the specific course or type of course they wish to pursue in their home country, including not being able to find an appropriate course for the student’s background and level of training at home and/or not being able to enroll in their preferred course at home due to capacity controls or competitive entry requirements. In addition, students may wish to study internationally in order to broaden their cultural and intellectual horizons and improve their job prospects, as well as to prepare for the next stage of their education or career.
In opposition to push factors are “anti-push factors”, which function as roadblocks for students who otherwise might
wish to study internationally. These include financial, travel and/or visa difficulties, as well as personal or family commitments and/or cultural issues.
“Pull factors” are the factors that cause students to choose a specific destination over others. These include the quality of the education provided; special courses not offered in other countries; preferred language of instruction (English in particular); historical and political relations between countries and migration patterns; cost; internationally-recognized degrees; opportunities to work in the country of study; being able to finish the degree in a specified period of time; successful marketing campaigns organized by the destination country or institution(s); financial support and incentives; and less stringent student visa regulations, including the ability to work while studying.
Many host destinations, both traditional and emerging, have developed national-level plans and strategies to attract more international students, creating a competitive environment for international student recruitment. Several of these national policies are examined in the recent IIE Project Atlas publication Student Mobility and the Internationalization of Higher Education (IIE, 2011). In the introduction to the volume, Bhandari explains that as the overall number of globally mobile students continues to grow and more countries emerge as important destinations, newer hosts such as China are receiving a growing share of the pie, as their international student numbers increase. While this has resulted in smaller market shares for the traditional host countries, it has had the positive effect of bringing more countries into the field of international education, and has also changed the traditional relationship between sending and receiving countries from unidrectional ‘brain drain’ to one of more balanced, mutually beneficial exchange.
Though the U.S. market share of the world’s mobile students has declined over the past decade, the U.S. remains the destination of choice for the greatest number of globally mobile students, and has sufficient capacity to absorb expanded numbers of international students in its large and diverse higher education system. Furthermore, in spite of its highly decentralized recruitment system,
28

Institute of International Education
VI. Conclusion (cont.)
the United States is well-positioned in the international student marketplace, with various pull factors attracting students to the U.S. The high quality of U.S. education is a prime factor, with over three-quarters of respondents worldwide rating the U.S. positively in this dimension. The wide range of schools and programs in the U.S. is another pull factor that attracts international students to its shores. Over three-quarters of respondents worldwide felt that the U.S. system of higher education was diverse with many options for different types of students. The U.S. is also seen as a country that welcomes international students to its shores, much more so than the other potential host destinations included in the survey.
Despite the predominance of pull factors attracting students to the U.S., anti-push factors also exist, with cost predominating. Cost was cited as the number one barrier to being able to study internationally, regardless of destination, by respondents from all countries surveyed. In addition, 60 percent of respondents worldwide perceived the U.S. to have expensive tuition. Interestingly, it was not exclusively students from less developed countries that perceived the U.S. to be the most expensive, but also students from developed countries that offer government subsidies for the pursuit of higher education. For example, 86 percent of students in the U.K. felt tuition in the U.S. to be expensive.
The difficulty of obtaining a student visa is also an anti-push factor, although it is not perceived to be as great a barrier as cost. As expected, perceptions about the difficulty of obtaining a visa to study in the U.S. vary by country and region: almost 60 percent of students in Latin America felt that it was difficult, but less than one quarter of students in South Africa and Turkey felt the same way. It is important to note that the majority of students surveyed had never themselves applied for a student visa. Those who had previously applied reported very little difficulty in obtaining it. This points to the success of efforts made by the U.S. Department of State to address the visa processing delays which occurred in some countries in the immediate aftermath of 9/11, as well as to clear misconceptions about the visa application process.
While each individual will ultimately make his or her decision
on where to study based on a unique set of circumstances, certain factors do affect students from some countries more than others. The language of instruction is one of the pull factors that attract international students to predominantly English-speaking countries. The importance of English as a language of scholarship, commerce and science, contributes to the popularity of English-medium courses worldwide, and international students who study in English-speaking countries have the added benefit of being able to improve their English language skills while they complete their academic coursework. While English-medium courses are offered in many countries where English is not a predominant language, students are nevertheless aware that their daily lives outside the classroom will need to be conducted in another language. Germany and France, for example, were perceived as destinations posing a significant language barrier by 56 percent of respondents each, as compared with an average of eight percent for the four English-speaking destinations (the U.S., the U.K., Australia and Canada).
As the availability and quality of English as a foreign language instruction in secondary schools around the world varies widely, students from different countries have different perceptions of English as a barrier. Students in East and Southeast Asia were most likely to perceive English as a barrier to international study. In Mexico, as in many other countries, students living in urban centers, who tend to be from less disadvantaged socio-economic backgrounds, are less likely to perceive English as a barrier. Intensive English language programs (a known pathway to degree study in the U.S.) can assist students with low levels of English proficiency in transitioning to full degree programs. It is likely that English language instruction and other pull factors will continue to draw large numbers of students to the U.S. in the foreseeable future.
For the U.S. to continue to attract the best and the brightest students, access to accurate information is crucial, and EducationUSA advising offices worldwide will continue to play an important role in disseminating impartial, accurate and timely information about U.S. higher education to prospective international students around the world.
29

What International Students Think About U.S. Higher Education
The Institute of International Education (IIE) has conducted an annual census of international students in the United States since its founding in 1919. IIE’s first independent publication of the results of the annual census was titled Education for One World, and reported on data for the 1948/49 academic year. It was renamed the Open Doors Report on International Educational Exchange in 1954/55, and began receiving support from the Bureau of Educational and Cultural Affairs of the United States Information Agency (USIA), now part of the U.S. Department of State, in 1972. Open Doors has long been regarded as the comprehensive source of data on trends in the enrollment of international students in U.S. higher education.
In order to provide a contextual background for the international student enrollment trends seen in Open Doors, IIE initiated a series of student attitudinal surveys in key sending countries, beginning with a pilot survey in March 2009 in Vietnam, which had at that time the fastest growing number of international students coming to the U.S. Prospective Vietnamese students from three regions in Vietnam (the South, Central Vietnam and the North) were surveyed in country via an online survey instrument regarding their preferred international study destinations, their reasons for wishing to study in another country, perceived obstacles facing international study and main sources of information on overseas study, as well as their opinions of the U.S. as a potential study destination compared to other potential host destinations.
The successful pilot survey in Vietnam was followed in summer 2009 by a paper-based survey of potential students in India, at that time the top place of origin of international students in the U.S. The student surveys in India were conducted in cooperation with the U.S.-India Educational Foundation (USIEF) and EducationUSA offices in Delhi, Mumbai, Kolkata and Chennai, representing North, West, East and South India. A summary of the results of the Vietnam and India student surveys was published in the Open Doors 2009 Report on International Educational Exchange.
The following year, IIE offices in Mexico City and Bangkok administered both online and paper surveys to prospective students in their respective countries, including conducting outreach to regions outside large cities for more representative coverage. In Mexico, student surveys were conducted in five regions: the Center (including Mexico City), the South, the North, the East and the West. In Thailand, student surveys were conducted in Central Thailand (including Bangkok), the East, the North, the Northeast and the South. IIE’s office in Hong Kong also surveyed prospective students in Hong Kong.
VII. Appendix: Methodology
Number of validPlace of origin student surveys Brazil 2,326 Germany 415 Hong Kong 179 India 1,044 Mexico 394 Nigeria 211 South Africa 164 Thailand 1,103 Turkey 1,189 United Kingdom 1,598 Vietnam 707 TOTAL 9,330
IIE also worked closely with EducationUSA offices around the world throughout 2010 to survey prospective students in Brazil, Germany, Nigeria, South Africa, Turkey and the United Kingdom. The student surveys were conducted online in Brazil, with respondents covering 25 of the 26 states in Brazil as well as the federal district (Brasília). Both online and paper surveys were conducted in Germany, with responses coming from five EducationUSA centers across Germany. Paper surveys were administered to students attending EducationUSA-sponsored college fairs in Abuja and Lagos in Nigeria and in Johannesburg in South Africa. In Turkey, both online and paper surveys were administered by EducationUSA advisers in the Turkish Fulbright Commission offices in Istanbul and Ankara and the Turkish-American Association in Ankara. The U.S.-U.K. Fulbright Commission’s EducationUSA office administered the student surveys in the U.K. at College Day fair days and other outreach and recruitment events.
Over 10,000 valid responses were received worldwide. However, only students who were citizens and/or permanent residents of the country where the survey was administered were included in this analysis, bringing the total number of valid student responses to 9,330. Individual response rates for each place of origin vary (fig. 25). In the United Kingdom, in addition to the survey responses received from students, over 600 responses were received from parents, career advisers and other interested parties. Data from non-students was not included in this report.
Figure 25: Response by Place of Origin
30

About IIE
Founded in 1919, the Institute of International Education (IIE) is a private nonprofit leader in the
international exchange of people and ideas. In collaboration with governments, foundations and
other sponsors, IIE creates and manages programs of study and training for students, educators and
professionals from all sectors. These programs include the flagship Fulbright Program and Gilman
Scholarships administered for the U.S. Department of State. IIE also conducts policy research,
provides resources on international exchange opportunities and offers support to scholars in
danger. IIE’s annual survey of student mobility into and out of the U.S. is published as the Open
Doors Report on International Educational Exchange.
About Open Doors
The Open Doors Report on International Educational Exchange, supported by the Bureau of
Educational and Cultural Affairs of the U.S. Department of State, is the only long-standing,
comprehensive information resource on international students and scholars in the United States,
and on U.S. students studying abroad for academic credit. The 2010 report provides 120 pages
of detailed data on the 690,923 international students in the U.S. in 2009/10; on the 260,327
U.S. students who studied abroad for academic credit in 2008/09; on the 115,098 international
scholars who taught and conducted research at U.S. colleges and universities in 2009/10; and on
the 51,282 international students enrolled in intensive English programs in the U.S. in 2009. For
more information, including online data tables, or to order a copy of the Open Doors print report
and other publications, please visit http://www.iie.org/opendoors.
Opening Minds to the World®

809 United Nations PlazaNew York, NY 10017-3580 http://www.iie.org