What If Your Boss Is a Woman? Work Organization, Work ...ftp.iza.org/dp9737.pdfWhat If Your Boss Is...
41
Forschungsinstitut zur Zukunft der Arbeit Institute for the Study of Labor DISCUSSION PAPER SERIES What If Your Boss Is a Woman? Work Organization, Work-Life Balance and Gender Discrimination at the Workplace IZA DP No. 9737 February 2016 Claudio Lucifora Daria Vigani
Transcript of What If Your Boss Is a Woman? Work Organization, Work ...ftp.iza.org/dp9737.pdfWhat If Your Boss Is...

Forschungsinstitut zur Zukunft der ArbeitInstitute for the Study of Labor
DI
SC
US
SI
ON
P
AP
ER
S
ER
IE
S
What If Your Boss Is a Woman?Work Organization, Work-Life Balance andGender Discrimination at the Workplace
IZA DP No. 9737
February 2016
Claudio LuciforaDaria Vigani
What If Your Boss Is a Woman?
Work Organization, Work-Life Balance and Gender Discrimination at the Workplace
Claudio Lucifora Università Cattolica del Sacro Cuore
and IZA
Daria Vigani
Università Cattolica del Sacro Cuore
Discussion Paper No. 9737 February 2016
IZA
P.O. Box 7240 53072 Bonn
Germany
Phone: +49-228-3894-0 Fax: +49-228-3894-180
E-mail: [email protected]
Any opinions expressed here are those of the author(s) and not those of IZA. Research published in this series may include views on policy, but the institute itself takes no institutional policy positions. The IZA research network is committed to the IZA Guiding Principles of Research Integrity. The Institute for the Study of Labor (IZA) in Bonn is a local and virtual international research center and a place of communication between science, politics and business. IZA is an independent nonprofit organization supported by Deutsche Post Foundation. The center is associated with the University of Bonn and offers a stimulating research environment through its international network, workshops and conferences, data service, project support, research visits and doctoral program. IZA engages in (i) original and internationally competitive research in all fields of labor economics, (ii) development of policy concepts, and (iii) dissemination of research results and concepts to the interested public. IZA Discussion Papers often represent preliminary work and are circulated to encourage discussion. Citation of such a paper should account for its provisional character. A revised version may be available directly from the author.

IZA Discussion Paper No. 9737 February 2016
ABSTRACT
What If Your Boss Is a Woman? Work Organization, Work-Life Balance and Gender Discrimination at the Workplace1
In this paper, we investigate the association between female leadership, work organization practices and perceived gender discrimination within firms. Using data for 30 European countries for the period 1995-2010, we find that having a female “boss” is associated with lower overall gender discrimination at work. The female boss effect, however, differs across gender: it is associated with lower discrimination among female employees, but higher among male employees. We also investigate the underlying mechanisms that shape gender discrimination within firms. We find evidence of a “women helping women” pattern through spill-over effects which reduce discrimination among women, but increase discrimination among men, particularly in female-dominated jobs. A better balance between work and life, a supportive work environment and flexible working time, particularly for women in high-skilled jobs, are shown to be effective in reducing gender discrimination. The above findings are robust to a number of specification changes and different sub-populations in our sample. Further, similar results are found when more traditional measures of gender imbalance, such as wages or career prospects, are used. Finally, to account for potential endogeneity and selection, arising from the non-random distribution of females in higher-rank jobs, we jointly estimate the selection process and the discrimination equation, finding support for a causal interpretation of the results. JEL Classification: J16, J70, J81 Keywords: gender discrimination, female leadership, work organization Corresponding author: Daria Vigani Department of Economics and Finance Università Cattolica del Sacro Cuore Largo Gemelli 1 20123 Milan Italy E-mail: [email protected]
1 We would like to thank Eve Caroli, Lorenzo Cappellari, Maria De Paola, Paul Gregg, Jo Blanden and participants at the conferences “Reducing Inequality” NY City (June 2015), “Inequality and Social Mobility” Rome (September 2015), as well as in seminars held at Università Cattolica del S.C. (2015) and Collegio C.A. (2015) for helpful comments. Daria Vigani acknowledges financial support from UCSC. EWCS data have been kindly provided by Eurofound.

IZA Discussion Paper No. 9737 February 2016
NON-TECHNICAL SUMMARY
We investigate the association between female leadership, work organization practices and perceived gender discrimination within firms. Using data for 30 European countries for the period 1995-2010, we find that having a female “boss” is associated with lower overall gender discrimination at work. The female boss effect, however, differs across gender: it is associated with lower discrimination among female employees, while discrimination is higher among male employees. When we investigate the underlying mechanisms that shape gender discrimination within firms, we find evidence of a “women helping women” pattern through spill-over effects which reduce discrimination among women, and increase discrimination among men, particularly in female-dominated jobs. A better balance between work and life, a supportive work environment and flexible working time, particularly for women in high-skilled jobs, are shown to be effective in reducing gender discrimination. The above findings are robust to a number of specification changes and different sub-populations in our sample. We find similar results when more traditional measures of gender imbalance, such as wages or career prospects, are used. Finally, to account for potential endogeneity and selection, arising from the non-random distribution of females in higher-rank jobs, we jointly estimate the selection process and the discrimination equation, finding support for a causal interpretation of the results. The implications of the above findings for gender discrimination at work are numerous. First, promoting a higher presence of women in leadership positions, all along the occupational structure, is an effective way of reducing gender bias and discrimination toward women in workplaces. This has a direct (causal) effect, as well as an indirect (spill-over) effect on female subordinates in predominantly female jobs. While there is evidence of an adverse effect on male employees in predominantly female jobs, it is difficult to say whether this is the result of reversal of (taste or statistical) discrimination against women, or a genuine behavioral effect of women discrimination toward men. Second, our results show that when there is a gender bias in the way work is organized (long working hours, rigid working-time schedules and low work-life balance) women are more likely to be penalized, as compared to men. Thus, promoting family-friendly work practices such as part-time work, flexible working time and parental leave arrangements is another effective way to better balance work and life across gender, particularly for women (and men) with caring responsibilities. Whether this should be done through company’s welfare provided schemes, through public subsidies for part-time work and child care facilities, or both is yet to be assessed. Conversely, any company or public policy that disproportionately rewards long and inflexible working time schedules, either through company bonuses or tax-breaks on overtime work, as well as career concerns that are centered on high work intensity and rank-ordered tournaments are most likely to reduce equality of opportunities for women in organizations. While affirmative action and mandatory quotas for women in executive boards may reverse this pattern, our results suggest that female leadership can have a welfare improving effect on gender discrimination all along the occupational hierarchy.

1 Introduction
Despite the remarkable increase, over the past decades, of female participation ineducation, labor market and political life, women are still paid less than men andare largely under-represented in supervisory, managerial and executive positions. Asreported in a recent study by the European Commission, even if women in Europeaccount for around 45 per cent of employment and over 55 per cent of people intertiary education, their proportion in high-level economic decision-making is stillvery low, as compared to men, with large differences across countries (between 15and 3 per cent, European Commission, 2012). Empirical studies show that, besidescultural factors, market imperfections and social norms, women segregation in lowerlayers of the occupational hierarchy also depends on work organization and equalopportunity practices adopted within firms (Bertrand et al., 2014; Goldin, 2014). Inparticular, when the standards for pay rise, performance-related-pay bonuses andpromotions are centered on long working hours, rigid work schedule and seniority,women are less likely to close the wage gap with men and move up the companyhierarchy. Conversely, family-friendly work practices such as part-time work, flexibleworking time and parental leave arrangements make it easier for women with caringresponsibilities to balance work and life (OECD, 2007).
Along with the evidence showing the existence of a gender pay gap and therelative under-representation of women in leadership positions, a growing body ofliterature has investigated the existence of differences in behavioral characteristicsacross gender (Bertrand, 2011; Niederle, 2014). While the empirical evidence is stillcontroversial, different studies, using both experimental and survey-based methods,have shown that women tend to be less individually oriented and more likely toexhibit a cooperative behavior (Croson and Gneezy, 2009; Fortin, 2008). Women arealso generally considered more trust-worthy and oriented toward ethical behavior andintegrity (Dollar et al., 2001; Goldin, 2006), they often shy away from competition,are more risk averse and behave more generously when faced with economic decisions(Dohmen et al., 2011; Niederle and Vesterlund, 2007).
These differences in behavior across gender, particularly when considering highranked and leadership positions, may have important implications in terms of eco-nomic and social outcomes within firms. Several contributions in the literature havelooked at the effect of gender in top management positions, in terms of managementstyle (Bertrand and Schoar, 2003; Matsa and Miller, 2013) as well as gender com-position of the board (Ahern and Dittmar, 2012), on firms’ economic and financialperformance.
Other studies have explicitly focused attention on the effect of gender, in leader-ship positions, on wage policies and equal opportunity practices within firms (Flabbiet al., 2014; Fortin, 2008). While there is evidence that the introduction of equalopportunity and equal treatment laws has contributed to reduce gender inequalitiesin the labor market, the gender gap in both pay and access to high-rank occupationsis still remarkable (IMF, 2013; Olivetti and Petrongolo, 2016; Weichselbaumer andWinter-Ebmer, 2007).
One aspect that has been less investigated in the economics literature is the direct
2

effect of female leadership and organizational arrangements on gender inequality infirms. Although the relationship between an employee and her supervisor or boss iscentral to the performance of the firm and the well-being of employees they oversee,still relatively little is known about whether having a female manager or supervi-sor makes a difference in terms of gender balance and discriminatory behavior at theworkplace, and whether that differs for men and women (Artz et al., 2014; Booth andLeigh, 2010; Cardoso and Winter-Ebmer, 2007; Gagliarducci and Paserman, 2015;Lazear et al., 2012; Neumark and Gardecki, 1998).
In this paper, we take a step in this direction and investigate the association be-tween female leadership (i.e. having a female “boss”), work organization practices andperceived gender discrimination, reported by employees within firms. We contributeto different strands of the literature. First, to the literature on discrimination whichhas mainly used indirect measures - such as gender differentials in wages, call-backrates, promotions, etc. -, while we rely on a direct measure of perceived gender dis-crimination, experienced and reported by the individuals at the workplace. Second,to the literature on the effect of leadership on employees’ outcomes, investigatingthe effects of female leadership on gender discrimination at work, which we matchwith work organization and work-life balance arrangements to assess whether family-friendly work practices play a role. Third, we complement existing evidence fromlaboratory or field experiments on the behavioral determinants of gender discrimi-nation, using survey-based evidence on a large number of countries and over a longspan of time. Finally, we address the potential endogeneity and selection arisingfrom the non-random distribution of females, across jobs and occupations, explicitlymodeling the selection process for accessing supervisory and managerial positionsjointly with the probability of reporting discrimination.
The paper is organized as follows. In section 2 we review the evidence on the linksbetween female leadership, work organization arrangements and discrimination at theworkplace. Section 3 describes the data and the main variables of interest. Section4 presents the empirical strategy and our baseline results. In section 5, we delvedeeper into the mechanisms that are at work in shaping the relationship betweenfemale leadership and gender discrimination, testing several behavioral hypotheses.Section 6 and 7 address selection issues and present a number of robustness checks.In section 8 we discuss the main implications of our findings for firms and for publicpolicy.
2 Female leadership, work organization and gender dis-crimination
There are several reasons why female leadership may have an effect on gender in-equalities within firms. First, if wage determination and career advancements areaffected by taste-discriminatory behavior of (mainly male) supervisors and managers,a larger representation of women at the top of the occupational hierarchy is expected
3
to reduce the gender wage gap and provide more opportunities (for women) to be pro-moted (Albrecht et al., 2003; Becker, 1957). Second, it has been argued that underimperfect information female managers might be better at inferring other womenunobserved productivity, hence reducing statistical discrimination toward women(Aigner and Cain, 1977). In this respect, females are likely to receive higher wageswhen employed by a female manager rather than by a male, while lower wages arelikely to be paid to males by female managers. Third, on top of the effect on wages,female leadership may be expected to adopt a management style that is less biasedtoward women, introducing family-friendly policies and balanced work-life practices.However, while this is expected to be beneficial for women and their well-being, it isless obvious what the effects on men would be. Fourth, behavioral differences acrossgender - i.e. risk aversion, competitive attitude and gender identity - may affect theway women behave in predominantly male work environments, as opposed to womenwho are in predominantly female jobs. Finally, quite independently from genderattributes, work practices and pay policies within firms can influence both the shareand the distribution of women in the occupational hierarchy as well as the genderwage gap.
The above propositions have been extensively investigated in a number of papers,which have focused on specific segments of the labor market and on selected countries,reporting mixed evidence. Cardoso and Winter-Ebmer (2007) find evidence, forPortugal, that female executives, compared to male executives, increase women’swages within firms, while they lower men’s wages. Bell (2005) investigates the genderpay gap in executive positions in US firms and shows that the magnitude of thegender pay gap is statistically related to the gender of the CEO, such that femaleexecutives are found to promote more women and pay them more as compared tomale executives.
A recent study, by Flabbi et al. (2014), looks at the effect of female leadership,among Italian CEO, on the entire distribution of wages. Their findings show thatfemales at the top (bottom) of the wage distribution receive higher (lower) wageswhen employed in a firm led by a female CEO; while the opposite holds for men (i.e.lower wages at the top and higher at the bottom). The idea is that female leadershipis able to reverse statistical discrimination against women, but the side effect is asimilar distortion on men’s wages. Another interesting implication is that a changefrom male to female leadership reduces gender pay inequalities at the top of the dis-tribution and increases them at the bottom, while there is virtually no effects on theaverage wage. These findings have been challenged in a paper by Gagliarducci andPaserman (2015), who study the effect of the gender composition of top managers inGermany on workplace arrangements and pay. They find no statistically significanteffect of female leadership, or the share of women in high-rank occupations, on thegender wage gap. A similar result is found by Bertrand et al. (2014), in the contextof Norwegian firms, who find no effect of female board members on the overall genderwage gap.
4
Experimental and field studies have focused more on the role of behavioral traits.Women are shown to be more likely to enter competitive settings if surrounded byother women rather than men (Niederle and Vesterlund, 2007). Also women apply-ing to predominantly male jobs seem to experience lower levels of discrimination ascompared to men applying to predominantly female jobs (Niederle, 2014). There isalso evidence of a so-called “Queen bee syndrome” whereby women who have reachedthe top ranks of the occupational hierarchy, particularly in male dominated occupa-tions, often hinder the career progression of other females (Bagues et al., 2014).
While, as discussed above, female leadership is expected to organize work in away that is less gender biased and more family-friendly, evidence in this respect isscarce and rather controversial. Results show that the effect of female leadership isheterogeneous and depends on a number of factors, such as: the gender composi-tion of lower layers within the organization, whether the occupation considered ispredominantly male or female and how pay incentives are designed. Greater femalerepresentation at higher ranks is found to generate positive spillovers on women’scareer advancements in Norway (Kunze and Miller, 2014) and in promoting femalerepresentation among directors and executives in the US: a pattern that has beencalled “women helping women” (Matsa and Miller, 2013). In an analysis of thepropensity to hire and retain females among athletic directors, Bednar and Gicheva(2014), find instead no evidence that gender is strongly predictive of a supervisor’sfemale-friendliness.
The general idea behind the “women helping women” hypothesis is that spilloversfrom female bosses are assumed to be effective in reducing gender imbalances, whichis what justifies public policies to promote female leadership (such as affirmativeaction and quotas). However, as shown in the empirical literature, spillovers from(female) bosses are likely to be very heterogeneous according to the gender of thesubordinate, the share of females in the occupation and other workplace attributes.Although the evidence from existing studies is mixed, the main findings suggest thatfemale bosses are more likely to promote women and pay them more, as comparedto male bosses, which should reduce gender inequalities and discrimination againstfemales. Spillover effects often work in opposite direction when the subordinate isa male, so that men may lose out when their boss is female rather than male (Car-doso and Winter-Ebmer, 2007; Flabbi et al., 2014). Moreover, these effects are likelyto differ in predominantly female (male) jobs, due to behavioral differences acrossgender - such as risk aversion, competitive attitude and gender identity -, as well asto composition effects, since it is more difficult to promote a woman when femaleemployees are the majority in a given layer of the occupational hierarchy. Femaleleadership can also have negative spillovers on gender discrimination, when for ex-ample women in managerial or supervisory positions use their discretionary power toprevent other women from receiving pay bonuses or progressing in the occupationalhierarchy (Bagues et al., 2014).
Finally, female leadership and a higher share of women in the firm are also fre-
5

quently associated with a more favorable work environment in terms of time flexibilityand work-life balance practices, with beneficial effects on wage inequalities and gen-der balance in occupational attainment. Of course, working time flexibility, whilebeing of great value for women, may also entail a cost for the firm. Most of thestudies that have investigated the effects of female leadership on gender inequalityhave mainly focused on the patterns between occupations, for example analyzinghow female CEO and women in executive positions affect the gender pay gap orthe promotion opportunities of male and female employees within firms (Cardosoand Winter-Ebmer, 2007; Flabbi et al., 2014), as well as asking why females tendto be segregated in selected occupations (Barbulescu and Bidwell, 2013; Bertrandet al., 2014). However, since a large part of gender inequalities and discriminationtake place within occupations, the above explanations miss an important part of thestory2.
The traditional view has always claimed that work-life balance practices areamenities introduced in organizations at the expense of efficiency, such that paylevels in more favorable work environment are expected to be lower. Hence, compen-sating differentials should explain why there is a gender pay gap within firms, andwhy women tend to be concentrated in selected occupations. In particular, much ofthe existing gender gap in firms appears to be due to how firms select, reward andorganize the work of their employees who have different preferences in terms of timeflexibility and work-life arrangements (Goldin, 2014; Goldin and Katz, 2012).
In a recent paper, Goldin (2014) shows that occupations where work is organizedaround long working hours, inflexible work schedules and where employees are noteasily substitutable, pay and promotion probabilities exhibit non-linearities that dis-proportionately benefit those employees (mostly men) who are able (or prefer) towork under tight constraints, thus increasing gender inequalities. This is likely to beobserved in high-rank/high-pay occupations, involving high commitment and effort,in occupations selecting employees through highly competitive rank-ordered tourna-ments, that disproportionately reward winners, as well as where the organization ofwork is rather inflexible. In such occupations the penalty attached to time flexibilityand other job-related amenities is very large and affects mostly women. Conversely,in jobs where work is organized around more standardized tasks and flexible timeschedules, where responsibilities are more evenly shared among employees and part-time work is more diffused, gender differences in pay and promotion are likely tobe less pronounced (Bloom et al., 2009; Datta Gupta and Eriksson, 2012; Kato andKodama, 2015).
2Goldin (2014) shows that saturating a traditional Mincerian wage equation with 3 digit occu-pational dummies, or weighting equally male and females across occupations, the residual genderpay inequality is reduced by less than 1/3, meaning that the other 2/3 depend on other factors. Arelevant part of the residual gender inequality is shown to be related to how the work is organizedand rewarded in firms, and how the tasks and responsibilities are allocated across gender.
6

3 Data and descriptive statistics
3.1 Sample selection and variables description
We use four waves (1995, 2000, 2005 and 2010) of the European Working ConditionsSurvey (EWCS), a unique source of data combining a large coverage of countries (EU-28 plus Turkey and Norway)3, with detailed information on employees demographics,job attributes, working conditions and indicators of self-reported satisfaction, healthand discrimination at the workplace. The survey is also very rich in terms of manage-ment and work organization arrangements (Eurofound, 2012). Our sample includesworkers, aged 15 to 65, employed in the non-agricultural sector4. Overall, our finalsample consists of 63, 318 observations.
Gender discrimination in our dataset is assessed asking respondents to answerthe following question: “Over the past 12 months, have you been subjected at workto discrimination on the basis of your sex?”. Hence, what we observe are specificepisodes of discrimination as perceived and reported by employees, likely to reflect:either a missed promotion or pay increase which was granted to a co-worker of theopposite sex, or a bias in the allocation of tasks across gender. Notice that both thewording of the question, as well as the recall time limit, may induce reporting bias inour measure of discrimination, such that for employees may be more likely to reportdirect discrimination episodes occurred at the workplace, neglecting other forms ofhidden discrimination and occupational segregation. In our sample, around 2% ofrespondents reported to have been subjected to gender discrimination, this sharegoes up to 3% when we look at women only, conversely the share of men reportinggender discrimination is much lower.
Since measures of direct discrimination are not common in the literature and areopen to criticism for being sensitive to individual judgment, as well as to variationsin the work environment, we also replicate the analysis using more standard variablessuch as earnings and career advancements. The earnings variable we use is definedas net monthly earnings, while for career advancements we rely on a specific questionabout employees’ expectations over career prospects in the current job 5. Since bothvariables are available only in the 2010 survey, the analysis on earnings and careeradvancement is restricted to the last wave of EWCS data.
Female leadership is measured through the question “Is your immediate boss aman or a woman?”. Respondents whose immediate “boss” is a woman account for24,4% of the sample, and over 3/4 of employees with a female boss are women. Theshare of female bosses has been growing over time, it was 21% in the 1995 wave and
3Belgium, Denmark, Germany, Greece, Spain, France, Ireland, Italy, Luxembourg, Netherlands,Austria, Portugal, Finland, Sweden and UK are present in each wave, while Norway, Bulgaria,Czech Republic, Estonia, Latvia, Lithuania, Hungary, Poland, Romania, Slovenia, Slovakia, Croatia,Malta, Cyprus and Turkey entered the survey in 2005. The whole empirical analysis is carried outusing either country level post-stratification weight or cross-national weights (Eurofound, 2010)
4Retired individuals, students in full-time education, self-employed and employees in the armedforce have been excluded. We also set to missing all observations in which the respondent replied“Don’t Know” or “Refusal”.
5The exact wording of the question is, “my job offers good prospects for career advancement” andrespondents have to agree or disagree (on a 5-point scale, from strongly agree to strongly disagree)with the statement. We recoded the variable as a dummy taking value one if the respondent agreesor strongly agrees and zero otherwise.
7

27% in 2010. It is worth noting that the above definition of female leadership differs,in several ways, from the definition used in most studies in the literature. First, it isdirectly reported by the worker and not indirectly inferred from occupational classifi-cations or other external information, which in our case should reduce measurementerror and missclassifications. Second, the definition of female boss encompasses anyleadership position along the whole hierarchical structure and not just female CEOor other executive positions. In this respect, while women who have reached the verytop of the organizational hierarchy can certainly make a difference in contrasting dis-crimination within firms and promoting more family-friendly work environment, itis probably true that the immediate boss (whether manager or supervisor) is whatmatters most for gender imbalances and discriminatory behaviors at the workplace interms of allocation of workloads, discretionary pay increase and career advancements.
In the empirical analysis we include a large set of controls capturing individual,firm and job characteristics. Managerial policies and work organization practices,which may be relevant for gender inequalities within firms (such as, work-life balance,flexible working time and other family-friendly arrangements), have been groupedinto 3 broad areas: work intensity (job involves working at high speed or tight dead-lines; having enough time to get the job done), time flexibility (working more than40 hours a week/10 hours a day at least once a month; having the chance to takea break when wished), and work environment (receiving support from colleagues;able to balance work and life). Further information on other working conditions andsocial activities in which respondents are involved outside work are used to carry outrobustness and sensitivity analyses. The full list of variables used and their meansare reported in Table A1 in the Appendix.
While the information available in EWCS data are ideal to exploit the widedifferences in management, work organization and other institutional arrangementsacross European workplaces, there are also some obvious limitations. Two in par-ticular are worth mentioning: first, data are not drawn from an employer-employeesurvey, which makes impossible to identify employees that work in the same firm andaccount for their common unobserved characteristics; second, data do not allow tofollow the same individual over time and thus account for individual time invariantunobserved heterogeneity. The trade-off, with respect to some existing studies whichuse employer-employee panel data drawn from administrative data, is that thosestudies (with few exceptions) have to rely on more limited or imprecise informationon work practices and firms’ attributes, and generally focus on a single country6. Inour data, the availability of detailed information on employees’ work tasks, firm’s
6Cardoso and Winter-Ebmer (2007) use administrative data from the Ministry of Employmentin Portugal; Flabbi et al. (2014) match the Italian social security archive with two company surveys;Bertrand et al. (2014) used data from the Norwegian Registry Archives merged with the Register ofBusiness Enterprises and the Register of Company Accounts. Datta Gupta and Eriksson (2012) andGagliarducci and Paserman (2015) are able to match their employer-employee panel data (the firstfrom Statistic Denmark, the second from IAB and social security data for Germany) with ad-hocworkplace surveys with information on management and work organization practices similar to ourown. Kato and Kodama (2015) use firm-level data from Japan.
8
attributes and work organization practices, allows us also to investigate the mecha-nisms through which female leadership and family-friendly arrangements are relatedto gender discrimination, without relegating them to fixed effects. Moreover, thecoverage of up to 30 European countries for nearly two decades, constitutes a clearadvantage in terms of generalizability and external validity of our results (Bloomet al., 2009).
3.2 Descriptive statistics
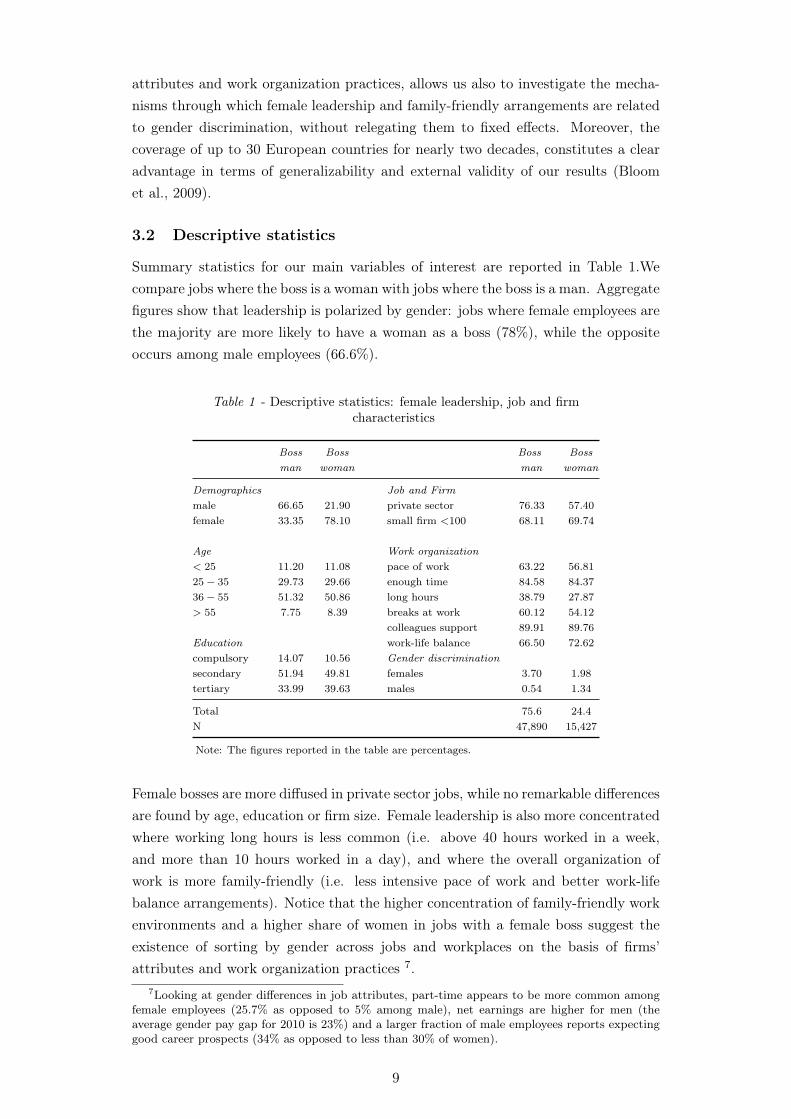
Summary statistics for our main variables of interest are reported in Table 1.Wecompare jobs where the boss is a woman with jobs where the boss is a man. Aggregatefigures show that leadership is polarized by gender: jobs where female employees arethe majority are more likely to have a woman as a boss (78%), while the oppositeoccurs among male employees (66.6%).
Table 1 - Descriptive statistics: female leadership, job and firmcharacteristics
Boss Boss Boss Bossman woman man woman
Demographics Job and Firmmale 66.65 21.90 private sector 76.33 57.40female 33.35 78.10 small firm <100 68.11 69.74
Age Work organization< 25 11.20 11.08 pace of work 63.22 56.8125− 35 29.73 29.66 enough time 84.58 84.3736− 55 51.32 50.86 long hours 38.79 27.87> 55 7.75 8.39 breaks at work 60.12 54.12
colleagues support 89.91 89.76Education work-life balance 66.50 72.62compulsory 14.07 10.56 Gender discriminationsecondary 51.94 49.81 females 3.70 1.98tertiary 33.99 39.63 males 0.54 1.34
Total 75.6 24.4N 47,890 15,427
Note: The figures reported in the table are percentages.
Female bosses are more diffused in private sector jobs, while no remarkable differencesare found by age, education or firm size. Female leadership is also more concentratedwhere working long hours is less common (i.e. above 40 hours worked in a week,and more than 10 hours worked in a day), and where the overall organization ofwork is more family-friendly (i.e. less intensive pace of work and better work-lifebalance arrangements). Notice that the higher concentration of family-friendly workenvironments and a higher share of women in jobs with a female boss suggest theexistence of sorting by gender across jobs and workplaces on the basis of firms’attributes and work organization practices 7.
7Looking at gender differences in job attributes, part-time appears to be more common amongfemale employees (25.7% as opposed to 5% among male), net earnings are higher for men (theaverage gender pay gap for 2010 is 23%) and a larger fraction of male employees reports expectinggood career prospects (34% as opposed to less than 30% of women).
9

Gender discrimination also shows a lower incidence among female employees whenthe immediate boss is a woman (2% for females, 1.3 % for males), while the oppositeoccurs in jobs with a male boss (4% for females, less than 1% for males).
Below we further inspect the association between gender discrimination and theshare of females in selected occupations. In Figure 1 we plot the share of femaleemployees in the job (left panel) and the share of bosses who are women (rightpanel) against gender discrimination (separately for males and females). The figureshows that gender discrimination perceived by female (male) employees is highestin predominantly male (female) occupations and it decreases as the share of womenincreases (decreases). A similar pattern is found when the share of female bosses inthe occupation is considered, showing that discrimination among women decreasesalso when the share of female bosses increases, while the opposite holds for males.
Figure 1 Gender discrimination, female share and share of female bosses by occupation
The similarity of trends with respect to gender discrimination between the share offemale employees in the job and the share of female bosses are also indicative of apattern where the presence of a woman as immediate boss is associated to a largershare of females in the occupation and a lower gender discrimination for women, buthigher for men.
4 Empirical analysis: does having a female “boss” makea difference?
To investigate the relationship between female leadership and perceived gender dis-crimination, we estimate a probability model where discrimination is a binary out-come and having a woman as immediate boss is our variable of interest. Since, asshown in the descriptive analysis, female leadership is more likely to be found injobs where women are over-represented and the organization of work is more family-
10
friendly, we always control for the share of female employees in the job, as well as anumber of work organization attributes. In practice, our baseline model is specifiedas follows:
Pr(Discrijt = 1) = φ(α+ γbosswomanijt + δfemaleshareijt + β1WOijt + (1)
+ β2Xijt + cj + tt + εijt)
where Discrijt is a latent dummy variable that takes value 1 if individual i, incountry j at time t experienced and reported gender discrimination at the workplace.The variable bosswomanijt is a binary indicator that takes value 1 when the employeehas a woman as immediate boss, while femaleshareijt is the share of female employ-ees in the job8. WOijt is a set of work organization variables that describe employees’work intensity (working at high speed or tight deadlines, not-having enough time toget the job done), working time flexibility (working more than 40 hours a week/morethan 10 hours a day, taking a break when wished), and whether there is a good workenvironment (work-life balance and receiving support from colleagues). Finally, Xijt
is a set of covariates, controlling for demographics (gender, age groups, educationalattainment and marital status), job-related attributes (occupational dummies at 2-digit ISCO-88 and tenure) and other firm characteristics (industry dummies at 2-digitNACE, log of firm’s size and public sector). All specifications also include country(cj) and time fixed effects (tt).
Equation (1) is estimated as a simple probit on the pooled sample, as well asseparately for females and males. In the robustness analysis we experiment fur-ther specifications where we include additional controls for the work environment(employees’ satisfaction with working conditions, job security, favorable work envi-ronment and having friends at work), as well as information on individual attitudes(risk aversion9), and social preferences (activities outside work). We also replicatethe analysis replacing our direct measure of perceived discrimination with more tra-ditional variables used in the gender discrimination literature, such as earnings andcareer advancements.
One additional fundamental problem in estimating equation (1) is that the pres-ence of women in higher rank of the occupational hierarchy (i.e. supervisory andmanagerial positions) within firms is unlikely to be randomly distributed across jobsand workplaces. In other words, differences between jobs where the boss is femaleand those where the boss is male might depend, on top of the observed factors, alsoon job and workplace characteristics that are unobserved. Moreover, the likelihoodof observing more females in some jobs, as well as more female bosses, may alsodepend on the lower propensity to discriminate against women, such that reverse
8Female share represents the average share of female employees in the job, where the latter isidentified by occupation, firmsize, country and year.
9To measure employees’ risk aversion we exploit the following questions: “Does your job requirethe use of protective equipment?” and “Do you always use it when it’s required?”. We then built abinary indicator for risk aversion that takes value 1 if the answer to both questions is “yes”, whileit is 0 if the job requires the use of protective equipment but the individual answered “no” to thesecond question. The latter question however is available only in the 5th wave (2010).
11

causation is also likely to affect our estimates. While we do a good job in controllingfor most factors that, in the gender discrimination literature, have been shown to berelevant in explaining inequalities across gender at the workplace, still estimates ofthe effect of bosswoman in equation (1) cannot be interpreted in a causal way. Inthis respect, to account for unobserved heterogeneity, we estimate the model satu-rating our baseline specification with country-time-firm size fixed effects, as well aswith country specific time trends. Also, to address the potential problems associatedwith the existence of a selection process driving females in leadership positions, wecomplement our analysis estimating the selection process for a woman to become a“boss” jointly with the gender discrimination equation. In this case, our identificationstrategy is based on a set of instruments drawn from external information relatedto both institutional differences in the generosity of national parental leave systems,and labor market institutions influencing employees’ career opportunities.
5 Results
We begin estimating equation (1) on the pooled male-female sample. Table 2 reportsthe estimated coefficients under different specifications. We include the bosswomandummy variable, the female dummy and the femaleshare variable indicating the shareof females in the job, while the list of other controls is reported at the bottom of Table2. In columns 2 to 4 additional variables are added to control for work intensity, timeflexibility and work environment. The estimated coefficient on the female dummyindicates that female employees always report higher gender discrimination at theworkplace, as opposed to male employees.
Other controls for demographic attributes (not reported in Table 2) show thatdiscrimination is lower for older workers and those in couple, while the share ofwomen in the job and educational attainment are never statistically significant10.
The presence of a female boss is statistically significant and negatively associatedwith gender discrimination, and the results do not change (see the estimated coeffi-cient of bosswoman in columns 2, 3 and 4) as we include additional controls on workorganization practices, work-life balance and work environment characteristics.
In our preferred specification, reported in column 4, work organization attributesshow that high work intensity (in terms of pace of work together with not-havingenough time to get the job done) is positively correlated with gender discrimina-tion, while time flexibility (in terms of working long hours and being able to take abreak when needed) and a favorable work environment (work-life balance and sup-port from colleagues) are negatively correlated with discrimination. These findingsprovide support for the hypothesis that female leadership is associated to lower per-ceived gender discrimination at work, and that the presence of a supportive workenvironment and a better balance between work and life further contribute to rein-force their perception.
In terms of (average) marginal effects, simply shifting from a male to a femaleboss - ceteris paribus - implies an overall reduction of 0.6 per cent in the likelihood
10The full set of results (column 4) is presented in the Appendix; Tables A2 and A3.
12

of reporting gender discrimination.
Table 2 - Gender discrimination and female leadership
Pooled sample
(1) (2) (3) (4)
bosswoman -0.165*** -0.183*** -0.187*** -0.183***(0.0536) (0.0531) (0.0528) (0.0528)
female 0.701*** 0.713*** 0.746*** 0.753***(0.0591) (0.0592) (0.0605) (0.0612)
Work intensitypace of work 0.241*** 0.210*** 0.193***
(0.0512) (0.0516) (0.0522)enough time -0.290*** -0.239*** -0.195***
(0.0513) (0.0512) (0.0514)Time Flexibilitylong hours 0.245*** 0.193***
(0.0471) (0.0484)breaks at work -0.193*** -0.168***
(0.0437) (0.0437)Work Environmentcolleagues support -0.0983
(0.0599)work-life balance -0.363***
(0.0538)
constant -2.620*** -2.491*** -2.527*** -2.155***(0.189) (0.199) (0.210) (0.222)
Female share X X X XDemographics X X X XIndustry and occupation X X X XCountry and Year dummies X X X X
pseudo-R2 0.0847 0.1012 0.1111 0.1216N 63,318 63,318 63,318 63,318
* p < 0.1, ** p < 0.05, *** p < 0.01; robust standard errors in parentheses.Demographics (3 age classes, 2 dummies for educational attainment, dummy forthe presence of a partner); Industry and occupation (7 dummies for occupation, 9dummies for industry, tenure, log of firm size and a public sector dummy).
These findings are consistent with both taste and statistical theories of discrimina-tion. In the first case, female bosses are found to have no (or at least lower) tastefor gender discrimination, as opposed to male bosses, which could be rationalized interms of prejudice, cultural factors and social norms (Bertrand, 2011). In the secondcase, female bosses are deemed to be better at assessing the (unobserved) produc-tivity of their female subordinates, thus improving the (gender) allocation of work,as well as the rewards, thereby reducing discrimination (Aigner and Cain, 1977).
An underlying hypothesis of the empirical specification reported in Table 2 is that,while gender discrimination is found to be higher among women, the association ofhaving a female boss (as well as other characteristics) with gender discriminationis restricted to be the same across males and females. However, as found in theliterature, the gender of the boss may be expected to play a role in shaping therelationship between discrimination, work environment and leadership. To assessthis, in Table 3, we estimate our preferred specification separately for male andfemale employees11. Interestingly, the coefficient of the variable bosswoman shows
11Since there are no male employees that report gender discrimination in the “Electricity, gasand water supply” industry, as well as in Estonia, 1, 057 observations are dropped from the maleequation.
13
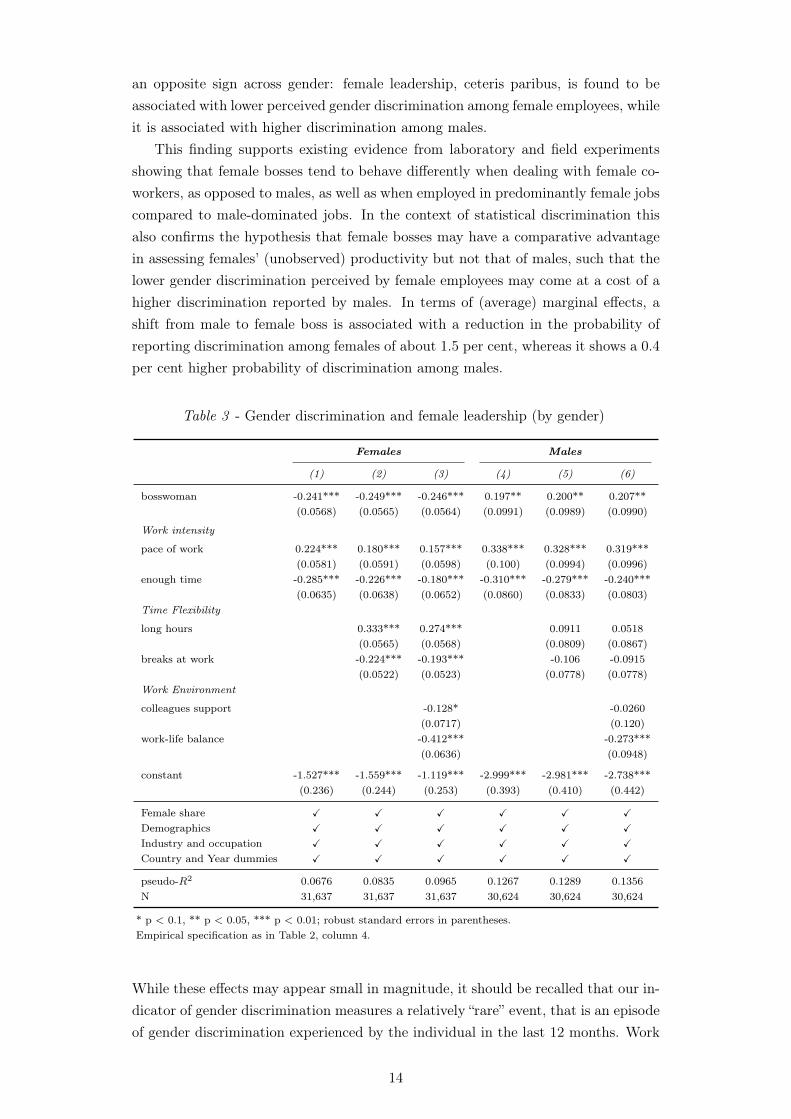
an opposite sign across gender: female leadership, ceteris paribus, is found to beassociated with lower perceived gender discrimination among female employees, whileit is associated with higher discrimination among males.
This finding supports existing evidence from laboratory and field experimentsshowing that female bosses tend to behave differently when dealing with female co-workers, as opposed to males, as well as when employed in predominantly female jobscompared to male-dominated jobs. In the context of statistical discrimination thisalso confirms the hypothesis that female bosses may have a comparative advantagein assessing females’ (unobserved) productivity but not that of males, such that thelower gender discrimination perceived by female employees may come at a cost of ahigher discrimination reported by males. In terms of (average) marginal effects, ashift from male to female boss is associated with a reduction in the probability ofreporting discrimination among females of about 1.5 per cent, whereas it shows a 0.4per cent higher probability of discrimination among males.
Table 3 - Gender discrimination and female leadership (by gender)
Females Males
(1) (2) (3) (4) (5) (6)
bosswoman -0.241*** -0.249*** -0.246*** 0.197** 0.200** 0.207**(0.0568) (0.0565) (0.0564) (0.0991) (0.0989) (0.0990)
Work intensity
pace of work 0.224*** 0.180*** 0.157*** 0.338*** 0.328*** 0.319***(0.0581) (0.0591) (0.0598) (0.100) (0.0994) (0.0996)
enough time -0.285*** -0.226*** -0.180*** -0.310*** -0.279*** -0.240***(0.0635) (0.0638) (0.0652) (0.0860) (0.0833) (0.0803)
Time Flexibility
long hours 0.333*** 0.274*** 0.0911 0.0518(0.0565) (0.0568) (0.0809) (0.0867)
breaks at work -0.224*** -0.193*** -0.106 -0.0915(0.0522) (0.0523) (0.0778) (0.0778)
Work Environment
colleagues support -0.128* -0.0260(0.0717) (0.120)
work-life balance -0.412*** -0.273***(0.0636) (0.0948)
constant -1.527*** -1.559*** -1.119*** -2.999*** -2.981*** -2.738***(0.236) (0.244) (0.253) (0.393) (0.410) (0.442)
Female share X X X X X X
Demographics X X X X X X
Industry and occupation X X X X X X
Country and Year dummies X X X X X X
pseudo-R2 0.0676 0.0835 0.0965 0.1267 0.1289 0.1356N 31,637 31,637 31,637 30,624 30,624 30,624
* p < 0.1, ** p < 0.05, *** p < 0.01; robust standard errors in parentheses.Empirical specification as in Table 2, column 4.
While these effects may appear small in magnitude, it should be recalled that our in-dicator of gender discrimination measures a relatively “rare” event, that is an episodeof gender discrimination experienced by the individual in the last 12 months. Work
14

organization attributes also show interesting differences and similarities across gen-der. Overall high work intensity, measured by the pace of work and not-havingenough time, is positively associated with gender discrimination for both males andfemales, suggesting that the workload in the allocation of tasks contributes to gen-der imbalances within firms. Conversely, time flexibility, in terms of not workinglong-hours and being able to take a break when needed, only affects discriminationfor female employees, having no effects on males. In line with the findings of Goldin(2014) - who argues that part of the gender pay gap found in most sectors and oc-cupations can be explained by the presence of high rewards for (long) hours worked- we find that long and rigid working time schedules contribute to perceived genderdiscrimination among women but not among men. In other words, since womentypically put more value on time flexibility than men, working long hours imposes alarger implicit cost on women and resulting higher perceived discrimination.
Practices directed at improving employees’ work-life balance are strongly and neg-atively associated with gender discrimination for both sexes, but with an estimated(average) marginal effect that is significantly larger for females. Other aspects ofthe work environment, such as getting colleagues’ support, are only weakly associ-ated with lower discrimination for females, while the relationship is not statisticallysignificant for men.
Overall, the above results confirm a number of stylized facts traditionally found inthe gender discrimination literature. First, the presence of women in leadership posi-tions is associated to a lower overall gender discrimination, both because women arethose who mainly experience discrimination within workplaces and because the esti-mated marginal effect of the bosswoman dummy is larger (and negative) for womenas compared to men (where it is positive), suggesting that the effect on women alwaysdominates that on men. In this respect, it could be argued that female leadership hasa welfare improving effect on employees’ perceived discrimination. Second, genderdiscrimination within firms is generally associated to unfavorable work organizationpractices, while it appears to be alleviated by better work-life balance arrangements,that are generally more diffused in predominantly female jobs.
While the above findings are indicative of the role of women bosses and workorganization practices on gender inequalities and discriminatory behaviors, they donot shed light on the channels through which female leadership and female represen-tation interact within firms. The next section is devoted to the investigation of themechanisms that shape gender differences and perceived discrimination in organiza-tions.
6 Mechanisms
There are several ways through which female leadership may influence gender im-balances and discrimination within firms. As discussed above, bosses are expectedto generate spillovers on subordinates in terms of firms’ hiring, promotion and com-pensation policies. Moreover, the gender composition of an organization, or thegender of the boss may shape the way these policies are implemented, as suggested
15
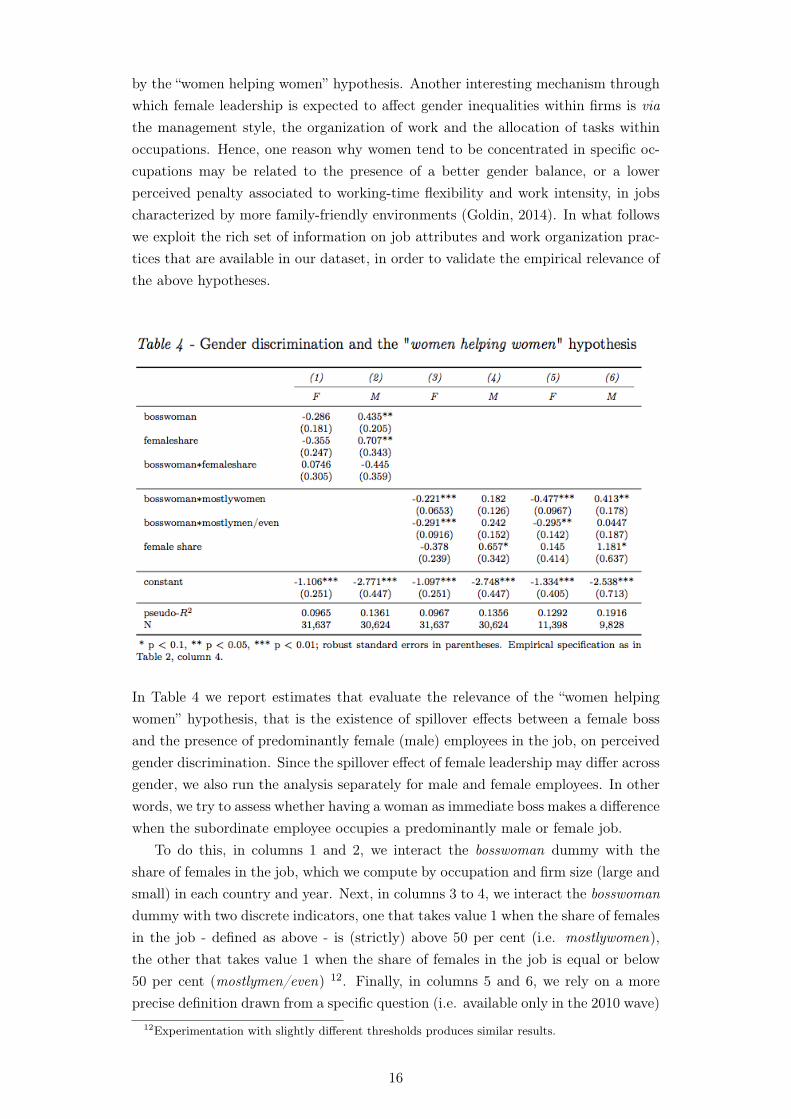
by the “women helping women” hypothesis. Another interesting mechanism throughwhich female leadership is expected to affect gender inequalities within firms is viathe management style, the organization of work and the allocation of tasks withinoccupations. Hence, one reason why women tend to be concentrated in specific oc-cupations may be related to the presence of a better gender balance, or a lowerperceived penalty associated to working-time flexibility and work intensity, in jobscharacterized by more family-friendly environments (Goldin, 2014). In what followswe exploit the rich set of information on job attributes and work organization prac-tices that are available in our dataset, in order to validate the empirical relevance ofthe above hypotheses.
In Table 4 we report estimates that evaluate the relevance of the “women helpingwomen” hypothesis, that is the existence of spillover effects between a female bossand the presence of predominantly female (male) employees in the job, on perceivedgender discrimination. Since the spillover effect of female leadership may differ acrossgender, we also run the analysis separately for male and female employees. In otherwords, we try to assess whether having a woman as immediate boss makes a differencewhen the subordinate employee occupies a predominantly male or female job.
To do this, in columns 1 and 2, we interact the bosswoman dummy with theshare of females in the job, which we compute by occupation and firm size (large andsmall) in each country and year. Next, in columns 3 to 4, we interact the bosswomandummy with two discrete indicators, one that takes value 1 when the share of femalesin the job - defined as above - is (strictly) above 50 per cent (i.e. mostlywomen),the other that takes value 1 when the share of females in the job is equal or below50 per cent (mostlymen/even) 12. Finally, in columns 5 and 6, we rely on a moreprecise definition drawn from a specific question (i.e. available only in the 2010 wave)
12Experimentation with slightly different thresholds produces similar results.
16

asking the respondent about the predominantly female (or male) nature of similarjobs within the firm 13.
The estimated coefficients on the interaction terms reported in columns 1 and2 show the expected sign but are never statistically significant. Since we rely onsurvey data to compute the share of females in the job, measurement error and thepresence of attenuation bias may drive our estimates towards zero. In columns 3and 5, the estimated coefficients on the interaction of the bosswoman dummy bothwith predominantly female and male type of jobs, show the expected negative signand are always statistically significant, indicating that female bosses are likely to beassociated with lower perceived discrimination by female employees across all type ofjobs. Conversely, in the male equation, a positive and statistically significant coeffi-cient is detected on the interaction of the bosswoman dummy and female dominatedjobs (column 6), suggesting that male employees perceive to be discriminated by afemale boss mainly when employed in female dominated jobs (or where the share offemales in the job is higher).
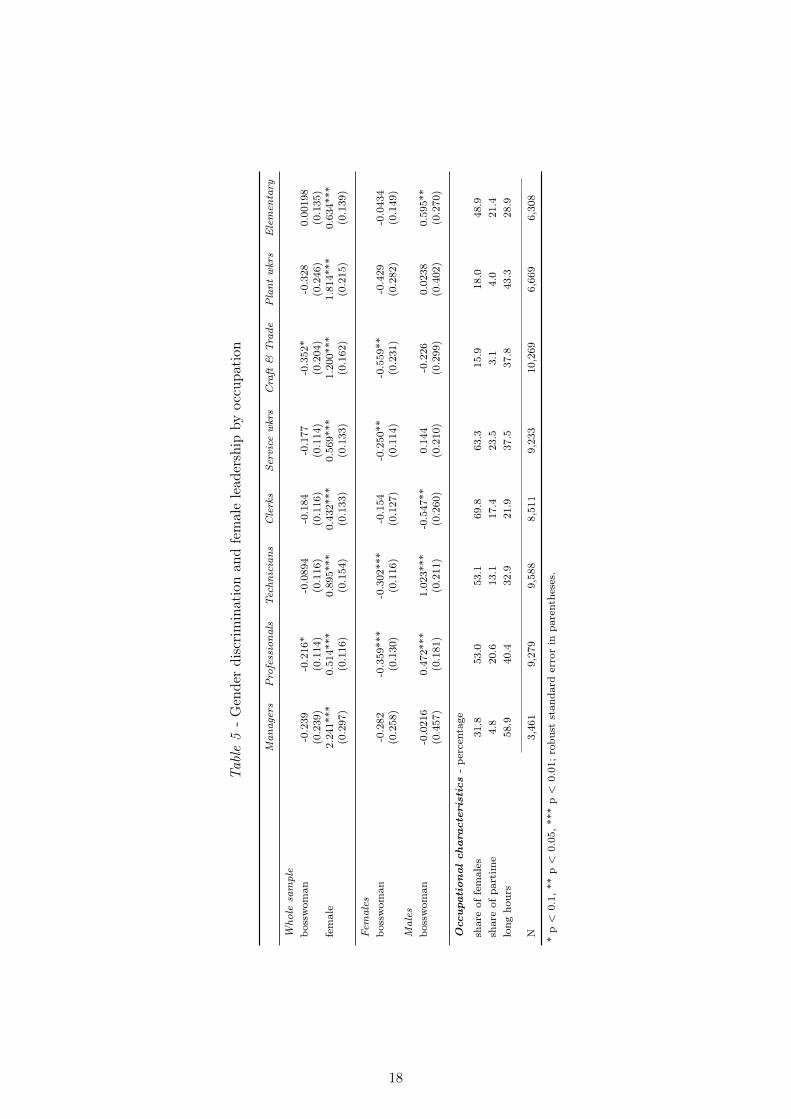
In the last part of this section, we investigate the role of female leadership ongender discrimination considering how work is organized within occupations. Weask whether having an immediate boss who is a woman has a pervasive effect allalong the hierarchical structure - i.e. higher ranks within occupations - and notjust in executive or managerial positions 14. In other words, we relate the way inwhich work is organized within occupations, to the role that female leadership canhave in mitigating the gender inequalities, or gender bias, arising from informationalasymmetries or differences across gender in work-life balance needs. We expect thismitigating effect of having a woman as a boss to be stronger in those occupationswhere work is organized around high commitment and effort, where time schedulesare rather inflexible and tasks are not easily substitutable, such that women are morelikely to be disadvantaged in terms of work-life balance (Goldin, 2014). The analysisby occupation also has some additional advantages, first it contributes to mitigate theselection bias induced by the endogenous allocation of women between occupations(although not within them), second it allows an analysis of how female leadershipinteracts with work organization practices in explaining gender discrimination withinworkplaces, instead of relegating the effects to the (firms) fixed effects.
In Table 5, we report the estimates of our baseline specification for eight dif-ferent occupational categories (1 digit ISCO-88 classification). Executive directorsand managers are grouped in the highest rank of the occupational hierarchy; thereare four different occupations for white-collar employees (Professionals, Technicians,Clerks and Service Workers), and three occupations for blue-collar workers (Craftand Trade, Plant operators and Elementary occupations). The above occupationalclassification is rather broad and likely to hide substantial heterogeneity, within eachoccupational level, across both skill levels and work tasks. Nevertheless, it tries
13The exact wording of the question is: “At your place of work are workers with the same jobtitle as you” (Mostly women/Mostly men/More or less equal numbers of men and women).
14Given the definition of the bosswoman dummy variable, the interpretation of female leadershipwithin each occupations is different compared to most existing studies in the literature.
17
Table
5-Gen
derdiscriminationan
dfemalelead
ership
byoccu
pation
Man
agers
Professiona
lsTechn
icians
Clerks
Servicewkrs
Craft&
Trade
Plant
wkrs
Elementary
Who
lesample
bosswom
an-0.239
-0.216*
-0.0894
-0.184
-0.177
-0.352*
-0.328
0.00198
(0.239)
(0.114)
(0.116)
(0.116)
(0.114)
(0.204)
(0.246)
(0.135)
female
2.241***
0.514***
0.895***
0.432***
0.569***
1.20
0***
1.814***
0.634***
(0.297)
(0.116)
(0.154)
(0.133)
(0.133)
(0.162)
(0.215)
(0.139)
Females
bosswom
an-0.282
-0.359***
-0.302***
-0.154
-0.250**
-0.559**
-0.429
-0.0434
(0.258)
(0.130)
(0.116)
(0.127)
(0.114)
(0.231)
(0.282)
(0.149)
Males
bosswom
an-0.0216
0.472***
1.023***
-0.547
**0.144
-0.226
0.0238
0.595**
(0.457)
(0.181)
(0.211)
(0.260)
(0.210)
(0.299)
(0.402)
(0.270)
Occupation
alcharacteristics-pe
rcentage
shareof
females
31.8
53.0
53.1
69.8
63.3
15.9
18.0
48.9
shareof
partim
e4.8
20.6
13.1
17.4
23.5
3.1
4.0
21.4
long
hours
58.9
40.4
32.9
21.9
37.5
37.8
43.3
28.9
N3,461
9,279
9,588
8,511
9,233
10,269
6,669
6,308
*p<
0.1,
**p<
0.05,***p<
0.01;robu
ststan
dard
errorin
parentheses.
18

to strike a balance between the number of observations necessary to run the anal-ysis in each occupational group and a disaggregation suitable to characterize therelationship between female leadership and work organization practices. For eachoccupational level, we report the coefficient estimates of our variables of interest forthe whole sample and separately for males and females. We also report the averagesfor selected characteristics, as the share of females, share of part-time and proportionof employees working long hours.
Estimates of the female dummy, in the pooled sample, confirm that discrimina-tion, within each occupation, is mainly perceived and reported by females. In termsof (average) marginal effects, the probability of reporting discrimination for a femaleemployee, as opposed to a male, is highest among Executives and Managers (9%),Craft and Trade (4.9%) and Plant workers (8.5%), while it is lowest among Clerks(1.8%). Incidentally, occupations in which the probability of reporting gender dis-crimination is estimated to be highest are all male-dominated and have in commonboth a low share of part-time workers and a high share of employees working longhours (see the bottom panel in Table 5). In the low discrimination occupations,perhaps not surprisingly, the share of females is higher and only a small share ofemployees work long hours. In other words, this pattern seems consistent with thehypothesis that gender discrimination, or gender bias, is higher where work is or-ganized on tight schedules and where there is little working time flexibility, whileit is lower where part-time and work-life balance arrangements are more diffused.The coefficients on the bosswoman dummy show the expected negative associationwith gender discrimination across all occupational categories, although estimates arealmost never statistically significant.
When the sample is split by gender, we get a negative and statistically significantassociation in the female equation and a positive, often not statistically significant,association in the male equation (with the only exception of Clerks). It is inter-esting to note that for Executives and Managers, we find no statistically significanteffect of female leadership on gender discrimination for both sexes. Given that inmanagerial occupations gender discrimination is reported to be highest, this mayappear surprising. One explanation is that female managers who reached the top ofthe occupational hierarchy are a very selected group and likely to behave “like men”toward their immediate subordinates, even showing an aversion toward women thatcompete for a similar position to their own (i.e. the so-called “Queen-bee syndrome”).
In high-skilled white-collar occupations, such as Professional and Technicians, wefind a statistically significant effect of female leadership (in terms of average partialeffect we find a 2% change in the probability of gender discrimination), which is againnegative in the female equation and positive for male employees. In such occupations,where high-educated women are largely represented, the demand for more family-friendly policies is high, and female leadership can (and does) make a difference inmitigating gender bias among female employees, while it has the opposite effect onmales. As we move down toward less-skilled white-collar and blue-collar occupations,the pattern is similar with a negative effect for females and virtually no-effect formales. In this respect, it is interesting to note that the only two occupations where
19

the bosswoman dummy is not statistically significant in the female equation areClerks and Elementary jobs, where the proportion of employees working long hoursis lowest and part-time is relatively high.
With respect to the other work organization variables included in the analysis(not reported here), we find, for all occupational groups, that work intensity and not-having enough time to do the job are unambiguously associated with higher genderdiscrimination for both male and female employees, conversely working long hoursis generally positive and statistically significant only in the female equation but notin the male equation. The variables concerning the family-friendliness of the workenvironment are negative and significant in the female equation and generally notsignificant in the male equation15.
While certainly some care is needed in interpreting the above results, as some un-observed attributes may drive the sorting of employees and female bosses across jobsand occupations, overall these findings provide robust evidence of a negative (posi-tive) association between women in higher ranks (within each occupational group)and perceived discrimination by female (male) employees, a pattern that is alsoconsistent with the way work is organized in terms of flexible working time andfamily-friendly practices 16.
Figure 2 - Predicted discrimination and family-friendly work environment by occupation
To show the relevance of the work environment for employees perceptions ofgender discrimination and gender bias in the organization of work, in Figure 2 wereport, for each occupation and sex, the extent of discrimination that would prevail
15The whole set of results, not reported in Table 5, is available upon request with the authors.16In this respect, Goldin (2014) shows that, even accounting for possible selection mechanisms,
still a significant fraction of wage differentials between men and women can be explained by occu-pational differences in time flexibility and its associated costs.
20
in a job with (or without) a family-friendly work environment. In practice, usingour coefficient estimates by occupation, we predict gender discrimination setting jobattributes - in terms of work intensity, time flexibility and work-life balance - torepresent a family-friendly as opposed to a non-family-friendly work environment.Comparing two jobs with and without family-friendly attributes in the same occu-pational category, we find that the latter is associated with a much higher perceivedgender discrimination among female employees, while it makes little or no differencefor male employees. In particular, the average predicted probability of reportinggender discrimination is estimated to be highest among female managers (45%) andin most white-collar occupations (from 13% to 19%), where such practices are rareor less common. These findings are consistent with the evidence reported in Goldin(2014), who finds that the penalties in terms of the gender pay gap are generallylarger for highly-educated workers.
7 Robustness checks
In order to test the robustness of our main findings, in this section we performa number of sensitivity checks. We experiment several changes with respect to themodel specification, different sub-samples of the population and clusters of countries,as well as alternative estimation methods. We report the coefficients of our mainvariables of interest (bosswoman and female dummies) in Table 6 17. All robustnesschecks are performed on our preferred specification (column 4 in Table 2) and usingthe male-female pooled sample to avoid small sample biases18.
Notice that, since the estimated coefficient on the bosswoman dummy has shownopposite signs across the female and male equations - with the marginal effect forfemales generally dominating, in magnitude, that of males -, a negative sign would bein line with an overall mitigating effect of female leadership on gender discrimination.First, we test whether our results are robust to changes in the reference sample(rows 1 to 7). Since our previous results showed that working long hours and beingemployed in larger establishments are positively associated with the probability ofreporting gender discrimination, we replicate our exercise for employees working full-time, part-time, in large and in small firms. In general, results show that the signand significance of the coefficients of interest are not altered by the change in thereference population.Second, we check the sensitivity of the results to the contribution of a specific countryor set of countries (rows 8 to 11). The estimates and the statistical significance weobtain re-estimating the model excluding one country at the time does not alterthe main findings. We always find that female employees are more likely to reportgender discrimination (estimates range from 0.66 to 0.80), as compared to men; andthat having a woman as immediate boss has an overall negative effect on perceiveddiscrimination which is always statistically significant (estimates range from -0.225to -0.16).
17For each model we also report the Wald-χ2 test for the joint significance of all predictors18Disaggregation by gender is not feasible in the specification checks, as we test the robustness
of our results across different sub-samples.
21

Table 6 - Robustness checks
Estimated coefficients Wald-χ2 Obs.
Bosswoman Female (p-value)
Different samples
1. Fulltime -0.159*** 0.789*** 575.04 54,760(0.0592) (0.0634) (0.000)
2. Part-time -0.239** 0.509*** 269.03 7,839(0.104) (0.183) (0.000)
3. Fulltime & high_edu -0.246*** 0.849*** 361.62 20,107(0.0795) (0.0947) (0.000)
4. Large firm(>=100) -0.334*** 0.793*** 323.29 18,704(0.0905) (0.106) (0.000)
5. Small firm (<100) -0.114* 0.762*** 480.80 44,614(0.0635) (0.0714) (0.000)
6. Public sector -0.267*** 0.705*** 352.61 21,310(0.0859) (0.101) (0.000)
7. Private sector -0.123* 0.798*** 487.82 42,008(0.0639) (0.0758) (0.000)
Different samples by country
8. Drop countries:range [min;max]a [-0.225***;-0.157***] [0.657***; 0.803***]
9. Drop outliersb -0.181*** 0.754*** 573.44 59,629(0.053) (0.062) (0.000)
10. Drop outliersc -0.221*** 0.796*** 555.01 59,960(0.053) (0.065) (0.000)
11.Only EU28 -0.224*** 0.798*** 572.52 60,449(0.053) (0.064) (0.000)
Different specifications
12. control for income -0.176*** 0.677*** 426.26 44,279(0.0647) (0.0731) (0.000)
13. control for satisfaction -0.185*** 0.761*** 658.99 62,970(0.0537) (0.0061) (0.000)
14.control for social preferences -0.167** 0.737*** 537.36 45,624(0.0645) (0.0710) (0.000)
15.control for psychosocial environment -0.218*** 0.676*** 511.87 40,093(0.0689) (0.0733) (0.000)
16. control for risk aversion -0.361** 0.767*** 461.58 9,225(0.1404) (0.1491) (0.000)
Different estimation methods
17. Complementary log-log model -0.412*** 1.866*** 683.04 63,318(0.1289) (0.1657) (0.000)
18. Penalized likelihood model -0.439*** 1.706*** 1078.89 63,318(0.0741) (0.0880) (0.000)
19. Clustered std errors (country*year) -0.183*** 0.753*** 10427.40 63,318(0.0614) (0.0752) (0.000)
* p < 0.1, ** p < 0.05, *** p < 0.01; robust standard errors in parentheses (columns 2 and 3).a The range of estimates is obtained excluding one country at a time from our preferred specification.b,c Countries characterized by high bosswoman/low discrimination, i.e. Estonia, Latvia and Lithuania; and bylow bosswoman/high discrimination, i.e. Turkey and Greece.
We also check whether some countries, that could be regarded as outliers in termsof either average reported discrimination or share of women in leadership position,may influence the results. In particular, Baltic countries (Estonia, Lithuania andLatvia) appear to be characterized by a higher than average share of women in
22

leadership positions and by lower levels of perceived gender discrimination (evenafter controlling for the gender composition of the sample). Conversely, Turkey andGreece are at the other extreme, reporting high gender discrimination and a lowshare of female bosses. In row 11, we restrict the sample to the EU28 membercountries, thus excluding Norway and Turkey which may have different institutionsand cultural attitudes across gender. In all the above experimentations, we find noevidence that our main findings were affected or altered in any significant way.Third, we check whether results are robust to the inclusion of additional controlsthat may be relevant in affecting gender discrimination at the workplace (rows 12and 13). In particular, we augment the baseline specification including additionalcontrol variables for low income level (household income below the median) and lowsatisfaction with working conditions.
Since evidence from experimental and field studies has shown the importanceof behavioral characteristics of men and women on discrimination and other labor-related outcomes (Bertrand, 2011; Dollar et al., 2001; Niederle and Vesterlund, 2007),we also include in our estimated model (rows 14 to 16) information on preferencesfor social activities outside work, psycho-social work environment (i.e. perceivedjob security and social relationships at the workplace) and attitudes toward risk(Dohmen et al., 2011)19. In general, results are not altered by the inclusion of allthe above control variables.
We also investigate the sensitivity of our estimates to the limited incidence ofnon-zero outcomes in our dependent variable using alternative estimation methodsthat are robust to distributions with a large number of zeros, such as complementarylog-log models (“zero-inflated” model) and penalized likelihood techniques20. Fur-ther, given the cross-country time-series dimension of our dataset, to account forpossible country and time specific heteroskedasticity we also estimated our preferredspecification using standard errors clustered at the country and year level. Whenwe correct for the “rare” nature of our outcome (rows 17 and 18) or for the presenceof heteroskedasticity (row 19) estimates of our variables of interest remain stronglysignificant and bear the expected sign.
Since our measure of discrimination may be sensitive to individual judgment andreporting bias, we test whether female employees systematically under-report genderdiscrimination when in a job with a female boss (see Table A4 in Appendix). Ifthis is the case, we should expect women to report lower or no discrimination alsoin other domains of discrimination for which we have information, such as age, raceor nationality. We experimented alternative measures of discrimination reportedby employees, and found no evidence of reporting bias. In a similar exercise, weuse measures of perceived health or work hazards21, and also found no evidence of
19Detailed information on variables’ specification can be found in the Appendix.20Recent literature in political and social sciences has raised the issue of explaining and predicting
rare events (i.e. binary dependent variables with fewer ones than zeroes) with binary choice models.Besides the bias due to small samples, recent studies (King and Zeng, 2001) have argued that inrare events data the biases in probabilities can be meaningful even with big sample sizes and thatthese biases result in an underestimation of event probabilities. To address these concerns weexperimented both complementary log-log and penalized likelihood methods.
21We selected two questions available in each wave of the EWCS: “Do you think your health orsafety is at risk because of your work?” and “does your work effect your health? ”.
23

reporting bias.Finally, we investigate the hypothesis that gender discrimination and female lead-
ership may differ across clusters of countries (see Table A5 in the Appendix). Inparticular, since estimation by single country is unfeasible due to the small samplesizes, we group countries in clusters, according to some ad hoc common cultural orinstitutional attributes. 22.
Overall, we do not find evidence of significant differences across country-clustersin the way female leadership is associated to gender inequalities within firms. In allclusters women (compared to men) are more likely to report gender discriminationat the workplace, and female leadership is negatively associated with gender dis-crimination (or not statistically significant)23. The association of bosswoman withoverall gender discrimination in terms of (average) marginal effect shows a strongerrelationship in Baltic and Eastern European (Northern) countries (around -1%),while the effect is milder for Mediterranean countries and not statistically significantfor Anglosaxon and Eastern European (Southern) countries. Whilst particular careshould be used in interpreting the differences across clusters of countries - as due tosmall sample sizes point estimates are less precise and in some case not statisticallysignificant -, still results are consistent with female leadership being stronger wherethe cultural environment is more favorable to women, and where women are morepresent in higher ranks of the occupational hierarchy 24.
7.1 Earnings and Career Advancement
The measure of direct gender discrimination, or gender bias, used in this study is notstandard in the literature, where variables such as pay or promotions have been usedinstead. To compare our main findings with existing studies, we replicate our analysisusing more traditional variables. In particular, we estimate different specificationsof equation (1) - on the male-female pooled sample - where the association of femaleleadership with gender discrimination is assessed with respect to earnings and careeradvancements. In order to see whether having a female boss, as opposed to a maleone, is associated to a lower wage penalty or better prospects for career advancementfor women (compared to men), we interact the bosswoman dummy with the femaledummy. In Table 7, we also investigate the heterogeneity of the female leadership
22Country-clusters are generally classified according to welfare regimes and labor market insti-tutions (see (Muffels and Luijkx, 2005)). In practice, we have used the following classification:Nordic (DK, SE, FI), Continental (AT, BE, DE, LU, NL, FR), Mediterranean (GR, IT, SP, PO),Anglosaxon (IRL, UK), Baltic (EE, LT, LV), Eastern/North (BG, CZ, HU, PL, SLV, SLK, RO)and Eastern/South (CY, MT, HR).
23In terms of (average) marginal effect, the probability of female employees to perceive discrim-ination (compared to male employees) is found to be higher in Anglosaxons (around 4%), Nordicand Continental countries (around 3.2%); while it is significantly lower in South-Eastern Europeancountries (below 2%).
24In Baltic countries where both the female employment to population ratio, and the share of fe-males in managerial and supervisory positions are high, we find a much stronger association betweenfemale leadership and gender discrimination as compared to other country-clusters. Conversely, inMediterranean and Eastern European (Southern) countries that are characterized by a lower shareof women in leadership positions, the estimated marginal effect of female leadership on genderdiscrimination is significantly smaller.
24
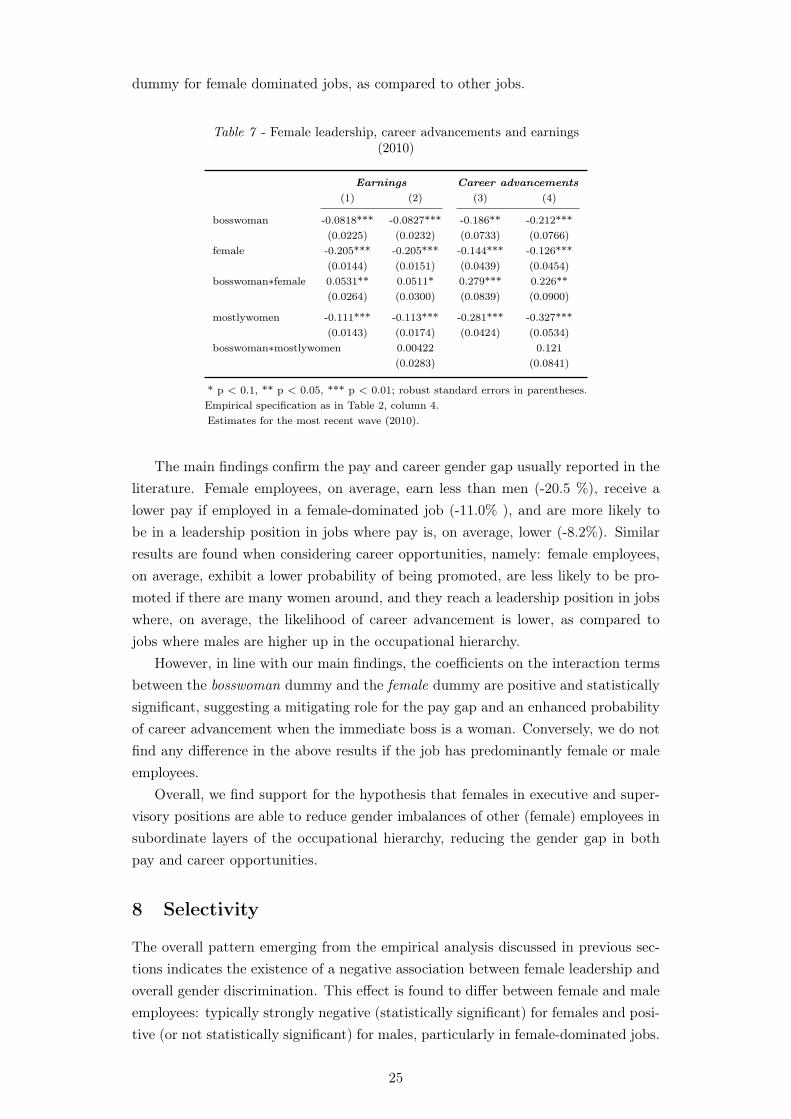
dummy for female dominated jobs, as compared to other jobs.
Table 7 - Female leadership, career advancements and earnings(2010)
Earnings Career advancements(1) (2) (3) (4)
bosswoman -0.0818*** -0.0827*** -0.186** -0.212***(0.0225) (0.0232) (0.0733) (0.0766)
female -0.205*** -0.205*** -0.144*** -0.126***(0.0144) (0.0151) (0.0439) (0.0454)
bosswoman∗female 0.0531** 0.0511* 0.279*** 0.226**(0.0264) (0.0300) (0.0839) (0.0900)
mostlywomen -0.111*** -0.113*** -0.281*** -0.327***(0.0143) (0.0174) (0.0424) (0.0534)
bosswoman∗mostlywomen 0.00422 0.121(0.0283) (0.0841)
* p < 0.1, ** p < 0.05, *** p < 0.01; robust standard errors in parentheses.Empirical specification as in Table 2, column 4.Estimates for the most recent wave (2010).
The main findings confirm the pay and career gender gap usually reported in theliterature. Female employees, on average, earn less than men (-20.5 %), receive alower pay if employed in a female-dominated job (-11.0% ), and are more likely tobe in a leadership position in jobs where pay is, on average, lower (-8.2%). Similarresults are found when considering career opportunities, namely: female employees,on average, exhibit a lower probability of being promoted, are less likely to be pro-moted if there are many women around, and they reach a leadership position in jobswhere, on average, the likelihood of career advancement is lower, as compared tojobs where males are higher up in the occupational hierarchy.
However, in line with our main findings, the coefficients on the interaction termsbetween the bosswoman dummy and the female dummy are positive and statisticallysignificant, suggesting a mitigating role for the pay gap and an enhanced probabilityof career advancement when the immediate boss is a woman. Conversely, we do notfind any difference in the above results if the job has predominantly female or maleemployees.
Overall, we find support for the hypothesis that females in executive and super-visory positions are able to reduce gender imbalances of other (female) employees insubordinate layers of the occupational hierarchy, reducing the gender gap in bothpay and career opportunities.
8 Selectivity
The overall pattern emerging from the empirical analysis discussed in previous sec-tions indicates the existence of a negative association between female leadership andoverall gender discrimination. This effect is found to differ between female and maleemployees: typically strongly negative (statistically significant) for females and posi-tive (or not statistically significant) for males, particularly in female-dominated jobs.
25

Moreover, the family-friendliness of the work environment, in terms of time flexibilityand work-life balance practices, is found to play a relevant role in further reducinggender discrimination.
However, since work organization practices are chosen by firms, and women arelikely to sort themselves in jobs where the work environment is more family-friendlyand career advancements more probable, it is difficult to discern whether the esti-mated effects of female leadership on gender discrimination are causal or capturesimple correlations. As already discussed, the estimated effect of female leader-ship could reflect the fact that in firms with more family-friendly work environment(mainly demanded by women), women are more likely to be promoted in managerialand supervisory positions and gender inequalities are expected to be lower. Whilecontrolling for a large set of workplace characteristics and work organization prac-tices, or estimating the relationship within occupational categories, should reducethe likelihood of a spurious correlation, we cannot exclude that unobserved job andworkplace characteristics (i.e. unobserved heterogeneity) or the lower propensityto discriminate against women (i.e. reverse causality) affect our estimates. In allthe circumstances described above, the endogenous selection process - i.e. matchingfamily-friendly job attributes and the presence of women in managerial and supervi-sory positions with lower gender discrimination - is likely to provide biased estimatesof the true effect of female bosses on gender discrimination.
In this section, to address the above problems, we complement our empiricalstrategy in two different ways. First, to account for unobserved heterogeneity, westart by saturating the baseline specification with a large set of fixed-effects obtainedinteracting country, industry and firm-size dummies (for a total of 660 dummies).Next, we include country-specific time trends to control for time-varying unobserv-ables that change over time, such as changes in social norms or cultural attitudestoward gender discrimination or women in leadership positions. Second, we specifya selection equation for the probability of having a woman as boss and estimateit jointly with the probability of reporting discrimination. In practice we estimatea bivariate probit model allowing for the correlation in the error terms of the twoequations. Our identification strategy exploits information on the variation, acrosscountries and over time, in the Generosity of national Parental Leave systems (GPL),and in the stringency of Employment Protection Legislation (EPL). In particular,we instrument the probability of having a woman as immediate boss with an indexof GPL that increases with the number of weeks available for maternity, parentaland childcare leave (and the associated cash benefits), as well as with an EPL in-dex which increases with the stringency of the regulation for regular and temporaryemployment contracts25.
The rationale behind the choice of these instruments is the following. The gen-erosity of the welfare system with respect to parental leave, by increasing the at-tachment of females to their job also increases their probability of being promotedto higher ranks of the occupational hierarchy (Bøler et al., 2014). Similarly, the
25Detailed information on how we constructed of our instruments are provided in the Appendix.
26

stringency of employment protection regulations, by protecting insiders from compe-tition, is likely to favor employment and career progression of employees with higherseniority. Hence, in labor market segments where women are sufficiently represented,stricter EPL can foster career progression and result in a larger share of females inleadership positions. Moreover, since there are obvious complementarities betweenthe above policies - i.e. high employment protection and high generosity mutuallyreinforcing the likelihood of career advancement for women - we also include aninteraction term between the two indices.
Notice, however, that since the information on the GPL and EPL indices isavailable only for a subset of the countries in our dataset (namely EU15 and Norway),estimates of the bivariate probit model are based on this restricted sample. Forcomparison purposes, we also re-estimated our baseline probit model on the samerestricted sample (column 3 in Table 8).
Table 8 - Gender discrimination and female leadership (heterogeneity andselection)
Heterogeneity Selection
(1) (2) (3) (4)
bosswoman -0.171*** -0.1858*** -0.199*** -0.720***(0.0528) (0.0528) (0.0567) (0.0992)
female 0.758*** 0.758*** 0.811*** 0.923***(0.0609) (0.0610) (0.0696) (0.0678)
FE (country*industry*firmsize) X
Country trends X
Selection Equation
GPL 0.276***(0.1003)
EPL 0.128*(0.0712)
GPL∗EPL -0.0803**(0.0328)
Wald Test of rho=0, χ2 27.49 (p=0.0000)Overidentification test statistic, χ2 5.10 (p=0.1644)N 53,409 63,318 44,475 44,475
* p < 0.1, ** p < 0.05, *** p < 0.01. Robust standard errors in parentheses (columns 1 to 4);robust standard errors clustered the country, year and firmsize level are used in columns 5 and6.
As in the robustness checks section, to avoid a loss of precision in our point estimatesdue to small sample size, we implement the above estimations only on the male-femalepooled sample.
The main set of results are reported in upper panel of Table 8, while in the lowerpanel we report estimates of the selection equation, as well as some statistics for thevalidity of the instruments26.
26The set of instruments allows for an over-identification test for the validity of the exclusionrestrictions.
27

In columns 1 and 2, we report the coefficients of our variables of interest es-timated adding respectively a large set of fixed effects and country specific trendsto the baseline specification. Results show that both the negative sign, the magni-tude of coefficients as well as the statistical significance of the bosswoman dummyare not altered when an alternative specification is used. This suggests that time-invariant unobserved characteristics by country, industry and firm size, or, alterna-tively, country-specific unobserved trends are not driving our results.
Results for the bivariate probit model are reported in column 4. Notice that theWald test for the correlation of the error terms across the two equations stronglyrejects the hypothesis of exogeneity, implying that gender discrimination and femaleleadership are not likely to be independent. Also, standard diagnostic tests indicatethat our instruments are not weak 27 and that exclusion restrictions for the validityof the instruments hold28.
Hence, when we model the potential endogeneity of the bosswoman dummy, wefind a larger and statistically significant negative effect of female leadership on per-ceived gender discrimination, suggesting that our previous estimates might have beenbias downward. We interpret this evidence as providing support for a causal inter-pretation of the effect of female leadership on gender discrimination within firms.
9 Conclusions
This study presents evidence that women in leadership positions can contribute toreduce gender discrimination and perceptions of gender bias within firms. We showthat female leadership is associated with an overall lower probability for employeesto report being discriminated on the basis of their sex. However, this effect is shownto differ between female and male employees: lower discrimination among femalesand higher discrimination for males, with the former effect always dominating inmagnitude. When we investigate the mechanisms underlying gender differences, wefind evidence of a “women helping women” effect, suggesting that female leadershipgenerates positive spillovers reducing discrimination, particularly where women areover-represented. We also find that the way work is organized, in terms of flexi-ble working time and family-friendly practices, matters for gender discrimination allalong the occupational hierarchy, but in particularly among women in high-skilledoccupations. We find support for the above findings even when we consider more tra-ditional variables, such as pay and career advancement. Finally, when we explicitlymodel the potential endogeneity of female leadership, arising from the non-randomdistribution of females in managerial and supervisory positions in the occupationalhierarchy, we find support for a causal interpretation of our main findings. The ev-idence reported in this study is consistent with most of the existing literature ongender discrimination which predicts that women in leadership positions have less
27A simple χ2-test for the joint significance of the instruments in the selection equation confirmsthe relevance of the instruments.
28Overidentification test statistic in bivariate probit models is the χ2 statistic for the joint signif-icance of the instruments in the structural equation for discrimination. The null hypothesis is thatinstruments are not jointly significant regressors in such equation.
28

discriminatory tastes, better information to assess the productivity of other womenand are less likely to introduce gender imbalances in the organization of work. Inthis respect, we also show that women who are in supervisory or managerial po-sitions are an important complement to firms’ practices that are more friendly toemployees with family obligations (mostly women), resulting in a lower gender dis-crimination. We find no evidence, however, that any of the above effects hold amongwomen at the very top of the company’s occupational hierarchy (i.e. CEO or ex-ecutive managers), which seems to suggest that women who are selected for thosepositions through highly competitive rank-ordered tournaments do not behave dif-ferently from men in similar positions. The implications of the above findings forgender discrimination at work are numerous. First, promoting a higher presence ofwomen in leadership positions, all along the occupational structure, is an effectiveway of reducing gender bias and discrimination toward women in workplaces. Thishas a direct (causal) effect, as well as an indirect (spill-over) effect on female subor-dinates in predominantly female jobs. While there is evidence of an adverse effect onmale employees in predominantly female jobs, it is difficult to say whether this is theresult of reversal of (taste or statistical) discrimination against women, or a genuinebehavioral effect of women discrimination toward men. Second, our results showthat when there is a gender bias in the way work is organized (long working hours,rigid working-time schedules and low work-life balance) women are more likely to bepenalized, as compared to men. Thus, promoting family-friendly work practices suchas part-time work, flexible working time and parental leave arrangements is anothereffective way to better balance work and life across gender, particularly for women(and men) with caring responsibilities. Whether this should be done through com-pany’s welfare provided schemes, through public subsidies for part-time work andchild care facilities, or both is yet to be assessed. Conversely, any company or publicpolicy that disproportionately rewards long and inflexible working time schedules,either through company bonuses or tax-breaks on overtime work, as well as careerconcerns that are centered on high work intensity and rank-ordered tournaments aremost likely to reduce equality of opportunities for women in organizations. Whileaffirmative action and mandatory quotas for women in executive boards may reversethis pattern, our results suggest that female leadership can have a welfare improvingeffect on gender discrimination all along the occupational hierarchy.
References
Ahern, K. R. and Dittmar, A. K. (2012), ‘The changing of the boards: The impact on firm valuationof mandated female board representation’, Quarterly Journal of Economics 127(1), 137–197.
Aigner, D. J. and Cain, G. G. (1977), ‘Statistical theories of discrimination in labor markets’,Industrial and Labor Relations Review 30(2), 175–187.
Albrecht, J., Bjorklund, A. and Vroman, S. (2003), ‘Is there a glass ceiling in Sweden?’, Journal ofLabor Economics 21(1), 145–177.
Artz, B., Goodall, A. H. and Oswald, A. J. (2014), ‘Boss competence and worker well-being’, IZADiscussion Paper (DP No. 8559).
29

Bagues, M., Sylos-Labini, M. and Zinovyeva, N. (2014), ‘Do gender quotas pass the test? Evidencefrom academic evaluations in italy’, Scuola Superiore Sant’Anna, LEM Working Paper Series14.
Barbulescu, R. and Bidwell, M. (2013), ‘Do women choose different jobs from men? Mechanisms ofapplication segregation in the market for managerial workers’, Organization Science 24(3), 737–756.
Becker, G. S. (1957), The economics of discrimination, University of Chicago press.
Bednar, S. and Gicheva, D. (2014), ‘Are Female Supervisors More Female-Friendly?’, AmericanEconomic Review 104(5), 370–375.
Bell, L. A. (2005), ‘Women-led firms and the gender gap in top executive jobs’, IZA DiscussionPaper (DP No.1689).
Bertrand, M. (2011), ‘New perspectives on gender’, Handbook of labor economics 4, 1543–1590.
Bertrand, M., Black, S. E., Jensen, S. and Lleras-Muney, A. (2014), ‘Breaking the glass ceiling?The effect of board quotas on female labor market outcomes in norway’, NBER Working Paper(WP No.20256).
Bertrand, M. and Schoar, A. (2003), ‘Managing with style: The effect of managers on firm policies’,The Quarterly Journal of Economics 118(4), 1169–1208.
Bloom, N., Kretschmer, T. and Van Reenan, J. (2009), ‘Work-life balance, management practicesand productivity’, International differences in the business practices and productivity of firmspp. 15–54.
Bøler, E. A., Javorcik, B. and Ulltveit-Moe, K. H. (2014), ‘Globalization: A Woman’s Best Friend?Exporters and the Gender Wage Gap’, CEPR Discussion Paper .
Booth, A. and Leigh, A. (2010), ‘Do employers discriminate by gender? A field experiment infemale-dominated occupations’, Economics Letters 107(2), 236–238.
Cardoso, A. R. and Winter-Ebmer, R. (2007), ‘Female-Led Firms and Gender Wage Policies’,Industrial and Labor Relations Review 64(1), 143–163.
Croson, R. and Gneezy, U. (2009), ‘Gender differences in preferences’, Journal of Economic literature47(2), 448–474.
Datta Gupta, N. and Eriksson, T. (2012), ‘HRM Practices and the Within-Firm Gender Wage Gap’,British Journal of Industrial Relations 50(3), 554–580.
Dohmen, T., Falk, A., Huffman, D., Sunde, U., Schupp, J. andWagner, G. G. (2011), ‘Individual riskattitudes: Measurement, determinants, and behavioral consequences’, Journal of the EuropeanEconomic Association 9(3), 522–550.
Dollar, D., Fisman, R. and Gatti, R. (2001), ‘Are women really the “fairer” sex? Corruption andwomen in government’, Journal of Economic Behavior & Organization 46(4), 423–429.
Eurofound (2010), ‘Fifth European Working Conditions Survey - Weighting Report’.
Eurofound (2012), ‘Fifth European Working Conditions Survey - Overview Report’.
Flabbi, L., Macis, M., Moro, A. and Schivardi, F. (2014), ‘Do Female Executives Make a Difference?The Impact of Female Leadership on Gender Gaps and Firm Performance’, CEPR DiscussionPaper (No.10228).
Fortin, N. M. (2008), ‘The gender wage gap among young adults in the united states the importanceof money versus people’, Journal of Human Resources 43(4), 884–918.
30
Gagliarducci, S. and Paserman, D. (2015), ‘The Effect of Female Leadership on Establishmentand Employee Outcomes: Evidence from Linked Employer-Employee Data’, Research in LaborEconomics 41, 341–372.
Gauthier, A. H. (2002), ‘Family policies in industrialized countries: is there convergence?’, Popula-tion 57(3), 447–474.
Goldin, C. (2006), ‘The quiet revolution that transformed women’s employment, education, andfamily’, American Economic Review 96(2), 1–21.
Goldin, C. (2014), ‘A grand gender convergence: Its last chapter’, American Economic Review104(4), 1091–1119.
Goldin, C. and Katz, L. F. (2012), ‘The most egalitarian of all professions: Pharmacy and theevolution of a family-friendly occupation’, NBER Working Paper (WP No.18410).
IMF (2013), ‘Women, Work, and the Economy: Macroeconomic Gains from Gender Equity’.
Kato, T. and Kodama, N. (2015), ‘Work-Life Balance Practices, Performance-Related Pay, andGender Equality in the Workplace: Evidence from Japan’, IZA Discussion Paper (DP No.9379).
King, G. and Zeng, L. (2001), ‘Logistic regression in rare events data’, Political analysis 9(2), 137–163.
Kunze, A. and Miller, A. R. (2014), ‘Women Helping Women? Evidence from Private Sector Dataon Workplace Hierarchies’, NBER Working Paper (WP No. 20761).
Lazear, E. P., Shaw, K. L. and Stanton, C. T. (2012), ‘The value of bosses’, NBER Working Paper(WP No.18317).
Matsa, D. A. and Miller, A. R. (2013), ‘A female style in corporate leadership? Evidence fromquotas’, American Economic Journal: Applied Economics 5(3), 136–169.
Muffels, R. and Luijkx, R. (2005), ‘Job mobility and employment patterns across European welfarestates. Is there a “trade-off” or a “double bind” between flexibility and security?’, Institute forLabour Studies, Amsterdam 25(05), 2010.
Neumark, D. and Gardecki, R. (1998), ‘Women helping women? Role-model and mentoring effectson female Ph. D. student in economics’, Journal of Human Resources, 33(1), 220–246.
Niederle, M. (2014), ‘Gender’, NBER Working Paper (WP No.20788).
Niederle, M. and Vesterlund, L. (2007), ‘Do women shy away from competition? Do men competetoo much?’, Quarterly Journal of Economics 122(3), 1067–1101.
OECD (2007), ‘Babies and bosses: reconciling work and family life: A synthesis of findings forOECD countries’.
Olivetti, C. and Petrongolo, B. (2016), ‘The evolution of gender gaps in industrialized countries’,NBER Working Paper (WP No.21887).
Weichselbaumer, D. and Winter-Ebmer, R. (2007), ‘The effects of competition and equal treatmentlaws on gender wage differentials’, Economic Policy 22(50), 236–287.
31

10 Appendix
Generosity of parental leave systems
Information on the generosity of parental leave systems in European Countriesare gathered from the dataset used in Gauthier (2002), whose sources are OECDand ILO statistics. Our index of generosity is constructed as a summary scale of 6items (normalized to [0, 1]): total number of paid weeks of maternal leave (includingweeks before and after childbirth), total number of weeks of childcare leave, totalnumber of weeks of parental leave, cash benefits received during maternity leave (asa percentage of female wages), cash benefits received during parental leave and cashbenefits received during childcare leave.
Employment Protection Legislation
EPL indexes refer to OECD summary indicators of Employment ProtectionLegislation, measuring the procedures and costs involved in dismissing individuals(www.oecd.org/employment/EPL).In particular, we used both the index of employment protection for regular workers,including additional provisions for collective dismissals, and the one for temporaryworkers, which measures the stringency of the regulation on the use of fixed-termand temporary work agency contracts.
32

Table A1 - Description and means of the variables used
Variable Description Mean
All Females Males
discrimination_sex dummy= 1 if respondent subjected to 0.017 0.03 0.006discrimination linked to sex
bosswoman dummy= 1 if respondent’s boss 0.244 0.43 0.096is a woman
Demographicsfemale dummy= 1 if female 0.443
Age Groups: dummies= 1 if in age group15− 24 0.112 0.115 0.10925− 35 0.297 0.29 0.30336− 55 0.512 0.521 0.50556+ 0.079 0.075 0.083partner dummy= 1 if respondent has a 0.699 0.685 0.709
partner/spouseEducationcompulsory 0.11 0.094 0.123secondary 0.555 0.551 0.558tertiary 0.335 0.355 0.319
femaleshare share of females in 0.446 0.566 0.351country, year, occupation and firm dimension (large/small)
Firm and Job characteristicsOccupation 1-digit ISCO-88ISCO 1 - Managers 0.055 0.041 0.066ISCO 2 - Professionals 0.147 0.171 0.127ISCO 3 - Technicians 0.151 0.178 0.131ISCO 4 - Clerks 0.134 0.209 0.075ISCO 5 - Service workers 0.146 0.208 0.097ISCO 6 and 7 - Craft & Trade 0.162 0.048 0.253ISCO 8 - Plant & Machinery 0.105 0.043 0.155ISCO 9 - Elementary occupations 0.1 0.102 0.097
Industry 1-digit NACE rev.1.1Mining and Manufacturing 0.225 0.154 0.282Electricity, gas, and water supply 0.016 0.006 0.024Construction 0.083 0.022 0.132Wholesale and trade 0.153 0.183 0.128Hotels and restaurants 0.038 0.046 0.032Transport and communication 0.07 0.038 0.096Financial intermediation 0.037 0.041 0.035RE activities 0.067 0.067 0.068PA 0.078 0.082 0.075Other services 0.232 0.36 0.13
ln(dimension) log of firm size 3.829 3.667 3.958tenure years in the company 9.403 8.588 10.049pubsector dummy= 1 if respondent 0.283 0.355 0.225
works in the public sector
Work Organization
Work Intensitypace of work dummy= 1 if the job involves 0.617 0.576 0.649
-working at high speed-working with tight deadlines
enough time dummy= 1 if respondent has enough 0.845 0.846 0.845time to get the job done
Time flexibilitylong hours dummy= 1 if respondent works 0.361 0.253 0.447
->40 hours a week or
Continues from previous page
33

... table A.1 continued
Variable Description Mean
All Females Males
->10 hours a day at least once a monthbreaks at work dummy= 1 if respondent is able to 0.587 0.55 0.615
take a break when wishedWork environmentcolleagues support dummy= 1 if respondent receives 0.899 0.891 0.905
support from collegueswork-life balance dummy= 1 if ”well” or ”very well” to 0.68 0.705 0.66
Do your working hours fit in withyour family or social commitments?
partime dummy= 1 if respondent works 0.141 0.257 0.049less than 30 hours a week
career advancements dummy= 1 if respondent agrees or strongly agrees 0.32 0.296 0.339with ”My job offers good prospects for career advancements”
riskaversion dummy= 1 if respondent always uses 0.926 0.941 0.919protective equipment when required
low wage dummy= 1 if respondent’s wage 0.394 0.509 0.302lies below median
satisfaction dummy= 1 if respondent is very/satisfied 0.831 0.84 0.823with working conditions
Social preferences dummies = 1 if respondent involved involuntary 0.067 0.061 0.072political 0.017 0.011 0.021childcaring 0.49 0.538 0.45sport 0.48 0.446 0.506
Psycho-social environmentfavorable environment dummy= 1 if respondent agrees or strongly agrees 0.84 0.839 0.841
- ” I feel at home in this organization”- ”I have very good friends at work”
job security dummy= 1 if respondent strongly disagrees, 0.837 0.844 0.832disagrees or neither agrees nor disagrees with”I might lose my job in the next 6 months”
34
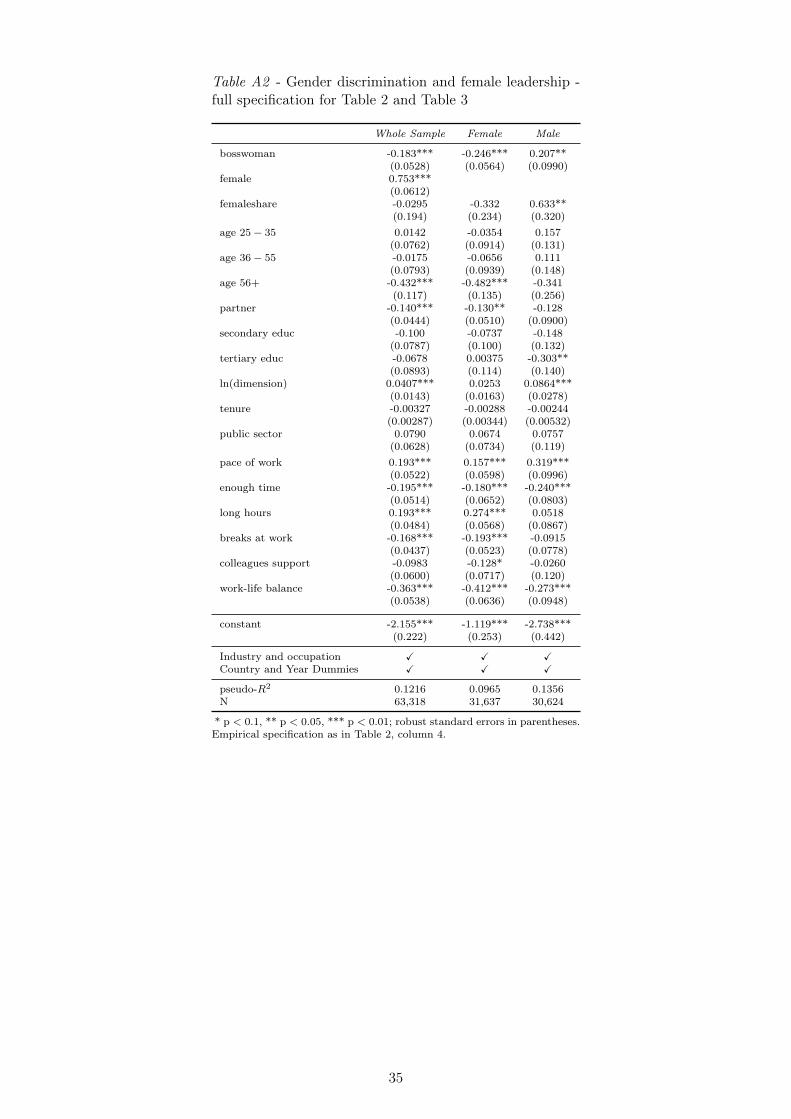
Table A2 - Gender discrimination and female leadership -full specification for Table 2 and Table 3
Whole Sample Female Male
bosswoman -0.183*** -0.246*** 0.207**(0.0528) (0.0564) (0.0990)
female 0.753***(0.0612)
femaleshare -0.0295 -0.332 0.633**(0.194) (0.234) (0.320)
age 25− 35 0.0142 -0.0354 0.157(0.0762) (0.0914) (0.131)
age 36− 55 -0.0175 -0.0656 0.111(0.0793) (0.0939) (0.148)
age 56+ -0.432*** -0.482*** -0.341(0.117) (0.135) (0.256)
partner -0.140*** -0.130** -0.128(0.0444) (0.0510) (0.0900)
secondary educ -0.100 -0.0737 -0.148(0.0787) (0.100) (0.132)
tertiary educ -0.0678 0.00375 -0.303**(0.0893) (0.114) (0.140)
ln(dimension) 0.0407*** 0.0253 0.0864***(0.0143) (0.0163) (0.0278)
tenure -0.00327 -0.00288 -0.00244(0.00287) (0.00344) (0.00532)
public sector 0.0790 0.0674 0.0757(0.0628) (0.0734) (0.119)
pace of work 0.193*** 0.157*** 0.319***(0.0522) (0.0598) (0.0996)
enough time -0.195*** -0.180*** -0.240***(0.0514) (0.0652) (0.0803)
long hours 0.193*** 0.274*** 0.0518(0.0484) (0.0568) (0.0867)
breaks at work -0.168*** -0.193*** -0.0915(0.0437) (0.0523) (0.0778)
colleagues support -0.0983 -0.128* -0.0260(0.0600) (0.0717) (0.120)
work-life balance -0.363*** -0.412*** -0.273***(0.0538) (0.0636) (0.0948)
constant -2.155*** -1.119*** -2.738***(0.222) (0.253) (0.442)
Industry and occupation X X XCountry and Year Dummies X X X
pseudo-R2 0.1216 0.0965 0.1356N 63,318 31,637 30,624
* p < 0.1, ** p < 0.05, *** p < 0.01; robust standard errors in parentheses.Empirical specification as in Table 2, column 4.
35

Table A3 - Full specification for Table 2 and Table 3(marginal effects)
Whole Sample Female Male
bosswoman -0.635*** -1.445*** 0.391*(0.174) (0.321) (0.217)
female 2.802***(0.260)
femaleshare -0.109 -2.050 1.009*(0.720) (1.46) (0.522)
age 25− 35 0.0526 -0.219 0.250(0.282) (0.566) (0.209)
age 36− 55 -0.0649 -0.405 0.178(0.294) (0.582) (0.234)
age 56+ -1.603*** -2.978*** -0.544(0.448) (0.867) (0.418)
partner -0.518*** -0.805** -0.205(0.164) (0.315) (0.143)
secondary educ -0.372 -0.455 -0.236(0.292) (0.619) (0.214)
tertiary educ -0.251 0.0232 -0.483**(0.332) (0.707) (0.229)
ln(dimension) 0.151*** 0.156 0.138***(0.0534) (0.101) (0.0478)
tenure -0.0121 -0.0178 -0.00389(0.0106) (0.0212) (0.00846)
public sector 0.293 0.416 0.121(0.234) (0.454) (0.190)
pace of work 0.669*** 0.929*** 0.441***(0.169) (0.334) (0.126)
enough time -0.807*** -1.223** -0.446***(0.236) (0.484) (0.172)
long hours 0.753*** 1.867*** 0.0826(0.199) (0.427) (0.139)
breaks at work -0.631*** -1.199*** -0.148(0.169) (0.335) (0.128)
colleagues support -0.393 -0.860* -0.0425(0.255) (0.520) (0.201)
work-life balance -1.487*** -2.844*** -0.473***(0.249) (0.505) (0.181)
constant -2.146*** -1.108*** -2.729***(0.222) (0.252) (0.446)
Industry and occupation X X XCountry and Year Dummies X X X
pseudo-R2 0.1216 0.0965 0.1356N 63,318 31,637 30,624
* p < 0.1, ** p < 0.05, *** p < 0.01; robust standard errors in parentheses.Empirical specification as in Table 2, column 4.Marginal effects and standard errors are multiplied by 100.
36

Table A4 - Robustness checks (reporting biason female sample)
Perceived discrimination
Age Race Nationality
bosswoman 0.0369 0.202** 0.145*(0.0537) (0.0864) (0.0795)
femaleshare 0.125 -0.0809 -0.177(0.255) (0.316) (0.321)
constant -1.183*** -1.784*** -2.144***(0.273) (0.372) (0.346)
pseudo-R2 0.0855 0.1060 0.1152N 30,517 30,517 30,517
Placebo test on other subjective measuresHealth safety Work affects
Risk Health
bosswoman -0.0139 0.00880(0.0305) (0.0273)
femaleshare 0.0748 0.0332(0.137) (0.125)
constant -0.537*** 0.0606(0.153) (0.141)
pseudo-R2 0.1177 0.1481N 30,517 30,517
* p < 0.1, ** p < 0.05, *** p < 0.01; robust standard errorsin parentheses. Empirical specification as in Table 2, column4.
37

Table A5 - Robustness checks (country-clusters)
Estimated coefficients Wald-χ2 Obs.
Bosswoman Female (p-value)
Nordic -0.199** 0.792*** 214.07 9,371(0.095) (0.123) (0.000)
Continental -0.214*** 0.857*** 295.84 19,515(0.076) (0.098) (0.000)
Mediterranean -0.204* 0.767*** 184.12 9,664(0.123) (0.116) (0.000)
Anglosaxons -0.155 0.929*** 181.34 5,763(0.143) (0.176) (0.000)
Baltic -0.421** 0.766*** 558.38 3,164(0.181) (0.251) (0.000)
East EU/North -0.572*** 0.879*** 131.32 8,635(0.124) (0.179) (0.000)
East EU/South 0.113 0.392** 156.98 2,811(0..189) (0.186) (0.000)
* p < 0.1, ** p < 0.05, *** p < 0.01; robust standard errors inparentheses. Empirical specification as in Table 2, column 4.
38