What If the World Went Gluten Free and Grain Free: …...2016/09/13 · • Humans -eating grains...
42
What If the World Went Gluten Free and Grain Free: The Role of Grains in the Diet and Feeding the World CIMMYT 50 Julie Miller Jones, PhD, CNS, CFS, LN, FICC, FAACCI Professor Emerita – St. Catherine University St. Paul, MN USA
Transcript of What If the World Went Gluten Free and Grain Free: …...2016/09/13 · • Humans -eating grains...

What If the World Went Gluten Free and Grain Free: The Role of Grains in the Diet and Feeding the World
CIMMYT 50Julie Miller Jones, PhD, CNS, CFS, LN, FICC, FAACCI
Professor Emerita – St. Catherine University St. Paul, MN USA

What this talk will cover
• Today’s environment – obesity, type 2 diabetes• What is being said about celiac, gluten-free and
grain- free (Paleo)? The gluten free trend.• What is the truth behind it?
• What are the nutritional ramifications of whole and refined grains and gluten free and grain free?
• What are the sustainability ramifications of gluten free and grain free as the world looks to feed itself by 2050?

FEAR THAT CARBOHYDRATES AND GRAINS CAUSING OBESITY AND CHRONIC DISEASE

White Flour is a poison that is
addictiive making us fat and causing
diabetes. We did not evolve
to eat wheat.Grains
developed by Borlaug are
slowly killing you.

Paleo, Gluten Free and Grain Free
… mega-sellers like Grain Brain and Wheat Belly suggestthat wheat may be the new asbestos

Celiac Disease Trifecta FactorsFactors that must be present1. Gluten in the diet2. Carry the gene- Human
leukocyte antigen HLA-DQ2or DQ8 plus others
3. Intestinal permeability• Emerging factor may be due to poor
diets, bacterial overgrowth
èInflammationFasano, A. (2009, August). Celiac Disease Insights: Clues to Solving Autoimmunity. Scientific American.
www.CeliacCentral.org/webinars©2014 All rights reserved. 6
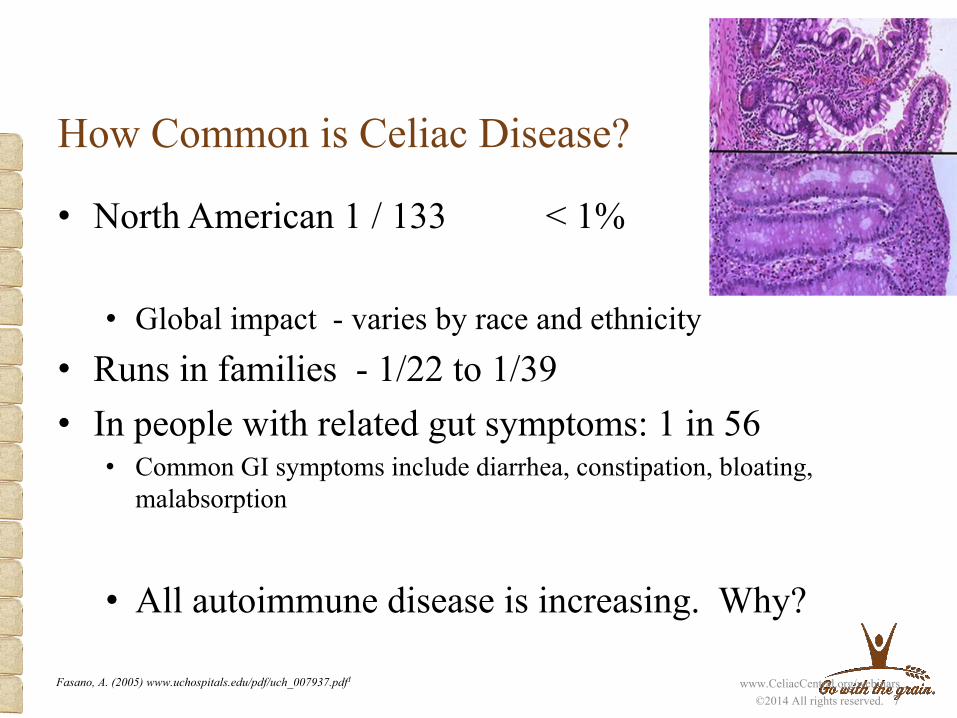
How Common is Celiac Disease?
• North American 1 / 133 < 1%
• Global impact - varies by race and ethnicity• Runs in families - 1/22 to 1/39• In people with related gut symptoms: 1 in 56
• Common GI symptoms include diarrhea, constipation, bloating, malabsorption
• All autoimmune disease is increasing. Why?
Fasano, A. (2005) www.uchospitals.edu/pdf/uch_007937.pdf1 www.CeliacCentral.org/webinars©2014 All rights reserved. 7

CLAIM: HUMANS DID NOT EVOLVE TO EAT GRAINS;PALEO DIETS ARE BETTER

Claim: Humans Did Not Evolve to Eat Grains
• Humans -eating grains >100,000 yrs• Dental record evidence
– Teeth show we were/ are omnivores.– Cooked grain DNA was found in
dental calculus of Paleolithic humans• Cave and cooking evidence*
– Grains (sorghum, wild maize, others) found in caves
– Grain DNA on stone tools and cooking pots èindicate processing and cooking of grains
*Caves in Iraq and the Low Countries; the AmericasHenry, A. et al. Ethology & Sociobiology 15: 219–35; Unger, P. The known, the unknown and the unknowable DOI:10.1016/0162-3095(94)90015-9.

Grains and CHOS and Evolution
• With the advent of Agriculture • Humans evolved to have 6 copies of amylase
– other primates - 2 copies
• Amylase & cooking – Enabled ready supply of glucose to the brain
– the brain’s preference for fuel
• Cooked CHO staples / food may have enabled evolution• Teleological argument - If wheat wasn’t eaten, why
would it be domesticated?
http://news.sciencemag.org/evolution/2012/10/raw-food-not-enough-feed-big-brainsnews.nationalgeographic.com/.../121026-human-cooking-e…- A surge in human brain size about 1.8 million years ago is linked to the innovation of cooking
Haslam & Rigby. A long look at obesity. Lancet.2010;376:85–86
CLAIM: GRAINS/ GLUTEN-CONTAINING CARBOHYDRATE STAPLES ARE BAD FOR THE HUMAN DIET

Recommendations for Carbohydrates (CHO)and CHO Staples
• Dietary recommendations - most countries /health promotion orgs
• Food guidelines recommend grains as a food group• CHO/ grain staples - Base of pyramid/ diet• 45-65% of E (up to 75%of E)
– Australia / New Zealand Dietary Guidelines – European Food Safety Authority– UK Scientific advisory Committee on Nutrition– US Dietary Guidelines / US Institute of Medicine– Singapore Health Promotion Board– Indian Health– Health promotion bodies such as heart, cancer and diabetes associations
• World Health Organization/ Food & Agriculture Organization (WHO/FAO) • “the macronutrient that humans need in the largest quantity.”Montagnese C et al Nutrition. 2015 ;31:908-915; Radhika G, et al Public Health Nutr. 2011 ;14:59http://www.hpb.gov.sg/HOPPortal/health-article/2638

Dietary Guidance - Some Examples

Too Many Calories = Excess Weight
~ 600 Kcal more overall, ~200 calories more each from fat and CHO; 50 cal more from sweeteners

Grain Intake Is Flat or Decreasing as Obesity Climbs
15http://www.fao.org/docrep/005/ac911e/ac911e05.htm

14% Bran“Outer shell” protects seed• Fiber• B Vitamins• Trace Minerals
83% Endo-spermProvides energy• Carbohydrate• Protein• Some B Vitamins
2-3% GermNourishment for the seed• B Vitamins• Vitamin E• Trace Minerals• Phytochemicals•Polyunsaturated fatty acids*
Whole Grain – Rich in Nutrients
AleuroneNutrient –rich layer under the bran

Betaine Vitamers and Vitamin-like compounds
Vitamins & Minerals
Phytate Phenolics and Antioxidants
Plant Stanols and Sterols
Sphingolipids Lignans(alkylresorcinols)
Whole Grain Nutrients and Phytochemicals
Methyl Donors
Slide adapted with permission from Gene Miller, GMI

Whole Grain vs Refined Grain
Whole Grain100% of
Phytonutrients
Mill Refined Grain15-35% of
Phytonutrients
REFINING REMOVES ABOUT 75% OF PHYTONUTRIENTS
Loses Most of the Fiber

Whole Grain
May be better absorption of minerals

Mix of Whole and Refined Grains Lowest Visceral Abdominal Fat
McKeown et al. Am J Clin Nutr 2010; 92:1165-71
Framingham Heart Study (n=2834)
20

Whole Grain Intake Lowers Relative Risk (RR)
90 g/day increase in whole grain intake (3 servings) 2 sl. bread, 1 bowl of cereal or 1/5 sv. pita bread made from whole grains)
Very similar Relative Risks (RR) for both incidence and mortality
0.49 Diabetes
0.81 Coronary heart disease
0.78 Cardiovascular disease
0.88 Stroke
0.85 Total cancers
0.83 Death from all causes
Meta-analysis of 45 prospective cohorts (64 publications) Aune D, et al BMJ. 2016 Jun 14;353:i2716
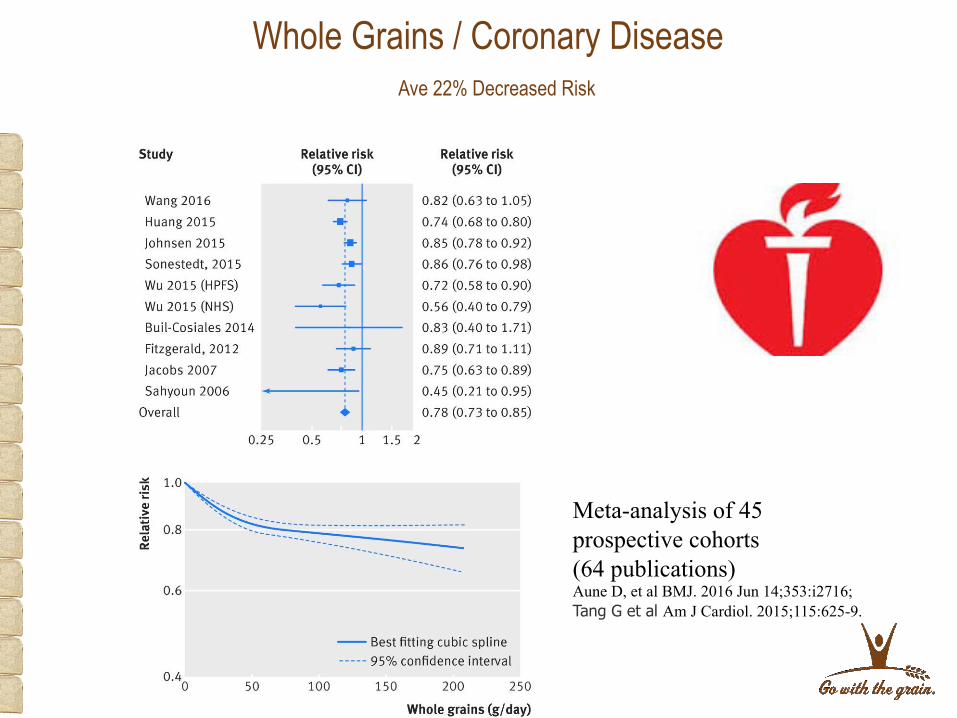
Whole Grains / Coronary DiseaseAve 22% Decreased Risk
Meta-analysis of 45 prospective cohorts (64 publications) Aune D, et al BMJ. 2016 Jun 14;353:i2716; Tang G et al Am J Cardiol. 2015;115:625-9.

CARBOHYDRATES, GRAINS AND WHOLE GRAINS
DIABETES23


Whole Grain Intake & Type 2 Diabetes Risk~ 25% Lower risk
<1 means lower risk risk
Meta-analysis of 45 prospective cohorts (64 publications) Aune D, et al BMJ. 2016 Jun 14;353:i2716

Carbohydrate Intake & Type 2 Diabetes Risk
Nurses Health Study N> 70,000
RR Type 2 diabetes (T2D)CHO RR = 0.98 ns Starch RR = 1.23**Total fiber RR = 0.80**Cereal fiber RR = 0.71** Fruit fiber RR = 0.79**CHO:cereal fiber RR = 1.28**
Diets with high starch, low fiber, and a high starch-to-cereal fiber ratio were associated with a higher risk of T2D.èneed to increase fiber and whole grain
Al Essa HB et al. Am J Clin Nutr. 2015;102:1543-53.

Total Fibre (a,b) and Cereal Fibre (c,d) Intake and Type 2 Diabetes Relative Risk
InteractConsortium. Diabetologia. 2015; 58: 1394–1408
Total Fibre Ave RR 0.91 Cereal Fibre Ave RR 0.75

Claim: All Fibers from All Sources Have the Same Impact So Grains Aren’t Necessary
Fibers & Small Intestinal Cancer RR
Total Dietary Fiber 0.79 ns
Cereal Fiber 0.51 P < 0.01
Whole Grain foods 0.59 P < 0.06
U.S.NIH AARP N= 560,000 older adults
Schatzkin et al Gastroenterology 2009 135:1163-7

Claim :All Fibers Are the SameFiber and Laxation
FIBER LAXATION per g fiber fed
Wheat bran 5.4 Psyllium 4.0 Oats 3.4 Corn 3.3 Legumes 2.2 Pectin 1.2 RS2 resistant starch 1.1 Inulin 1.0
29Cummings JH. 1993. CRC Handbook of Dietary Fiber in Human Nutrition
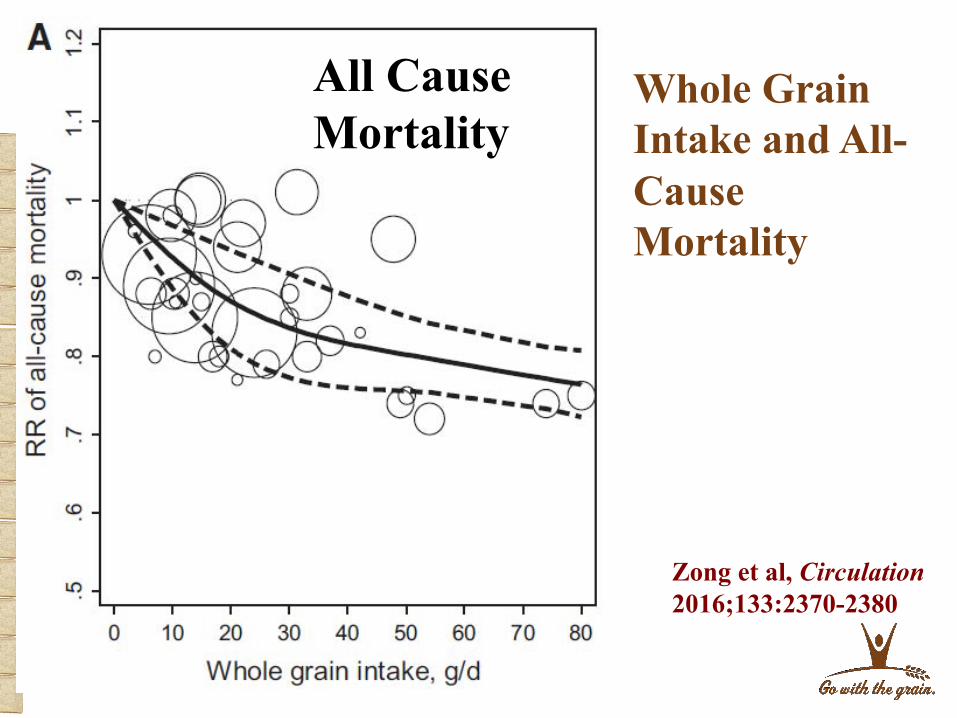
Zong et al, Circulation2016;133:2370-2380
Whole Grain Intake and All-Cause Mortality
All Cause Mortality

Americans are Missing OutNOT Getting the Recommended 3 Servings of Whole Grains Each Day!
Not Enough Cereal and Total Fiber
Not Getting Enough Whole Grain Getting the
Recommended 3 Servings of
Whole Grain/Day
NHANES 1999-2002

Low-carb diets and all-cause mortality
Meta-analysis - 17 studies n= 272,216
• High low-carb score associated with increase in all-cause mortality RR = 1.31
Noto H et al PLoS One. 2013;8(1):e55030. .

Cost and Quality of Grain/ Gluten Free/ Diets
• Gluten – free/ Grain -free diets – Cost 2x more $$– May be less nutritious and may not be fortified
– Inadequate B vitamins, Ca++ and cereal / legume fiber
• Environmentally expensive
Metzgar M et al. Nutr Res. 2011;31:444-51.

Feeding the 8 Billion in 2030
Grains 73% -harvested acres– >50% world’s calories
By 2050 Need é>>40%
esp if émeat-rich diet - intensive production é80%
– é20% - arable land (forests, parks???)
– "Sustainable intensification without further degradation of natural resources and environment still remains a challenge…"
FAO 2000 report Agriculture: Towards 2015/2030. Krishna&Chandrasekaran. Cereal Products in Valorization of Food
Processing By-Products. Ed M. Chandrasekaran. 2013, p.304.FAO, 2000. Agriculture: Towards 2015/2030.

Contribution of Grains to Feeding the World
• Maize, Wheat, Rice–⅔ calories for the world
• Maize, Wheat, Rice, Barley –¾ calories for the world
• Wheat, maize, rice, barley, sorghum, oats, rye, millet –½ the world’s protein
• 50,000 edible plants, but 15 crop plants – -90% world's calorieshttp://www.fao.org/docrep/u8480e/u8480e07.htmConte, R. Hunger Math: World Hunger by the numbers.

Nutritional Contribution of Various Plants
Cereal/Pseudocereal
Calories/ m3 Protein (kg/ha)
Maize (corn) 1,847 415Oats 1,508 384Rice (paddy) 1,482 307Triticale 1,256 470Amaranth 1,133 418Wheat 1,083 423Rye 914 271Teff 605 226Sorghum 529 165Millet 345 105Quinoa 275 109
Traditional Grains • >1000 kcal/m2
• >400 kg protein/ ha
Hunger Math: World Hunger by the Numbers. Conte, R. 2013
Non-grainSoybean 1,029 870Lentils 322 244Green Beans 229 127

With permission
Calories /Unit Area by Crop
Grains / carbohydrate staples deliver much calories

Protein (g) /m3 by Crop
With permission
Grains / carbohydratestaples deliver much needed protein

Summary
• Carbohydrates, grains and whole grains are recommended in dietary guidance around the world.
• Consumption of whole grain and grain foods in the right balance is associated with lower risks of diabetes, cardiovascular disease, stroke, certain cancers and all cause mortality.• They do not increase risk as alleged

Summary
– Real obesity cause = too many calories from all sources
– Gluten-free and grain-free diets are not necessarily healthier and are often less healthy.
• Little evidence to support claims that we did not evolve to eat grains
• Grains and carbohydrate staples are needed to help feed the world by 2015.

We need to convince consumers it’s something they’re not eating?

42