What Has Been Happening to Aggregate Concentration in the ... · What Has Been Happening to...
37
What Has Been Happening to Aggregate Concentration in the U.S. Economy in the 21 st Century? Lawrence J. White & Jasper Yang Stern School of Business New York University [email protected] [email protected] Presentation at CRESSE, Crete, July 1, 2017 1
-
Upload
nguyenlien -
Category
Documents
-
view
218 -
download
0
Transcript of What Has Been Happening to Aggregate Concentration in the ... · What Has Been Happening to...
What Has Been Happening to
Aggregate Concentration in the U.S.
Economy in the 21st Century?
Lawrence J. White & Jasper Yang Stern School of Business New York University [email protected] [email protected] Presentation at CRESSE, Crete, July 1, 2017
1
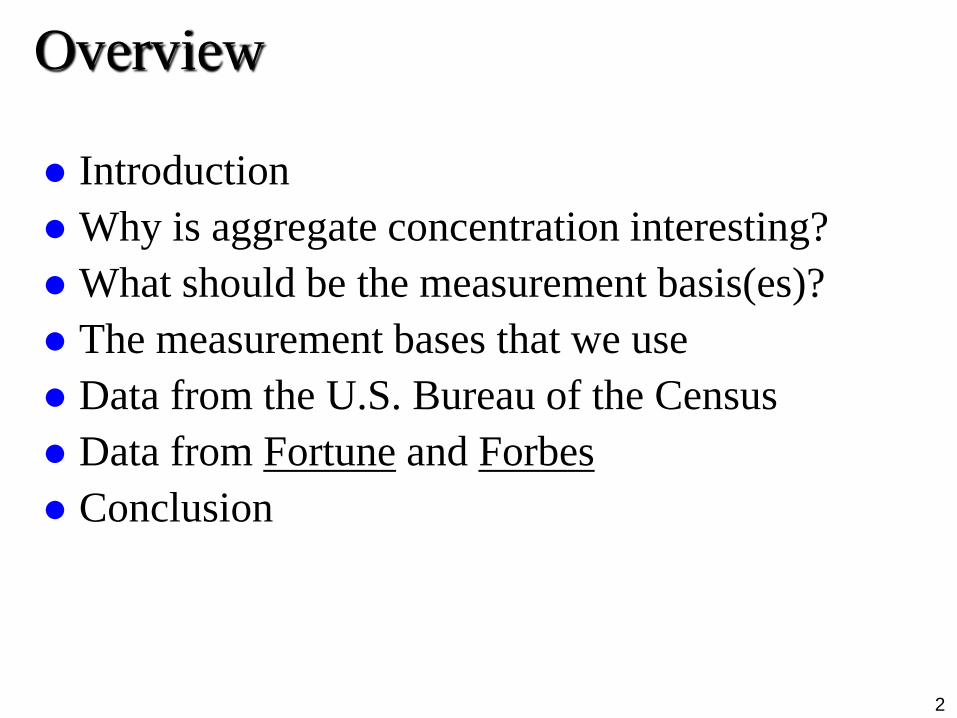
Overview
Introduction
Why is aggregate concentration interesting?
What should be the measurement basis(es)?
The measurement bases that we use
Data from the U.S. Bureau of the Census
Data from Fortune and Forbes
Conclusion
2

Introduction
Aggregate concentration is the percentage of overall economic activity that is accounted for by the largest X firms
– How “important” are the largest X companies?
Casual impressions from the media are that aggregate concentration is growing
– Lots of mega mergers
– Lots of references to “Big Pharma”, “Big Oil”,
“Wall Street”, “Big Food”, “Big Music”, etc., etc.
But the most recent study of aggregate concentration was for the last quarter of the 20th century 3
Why is aggregate concentration
interesting? (1)
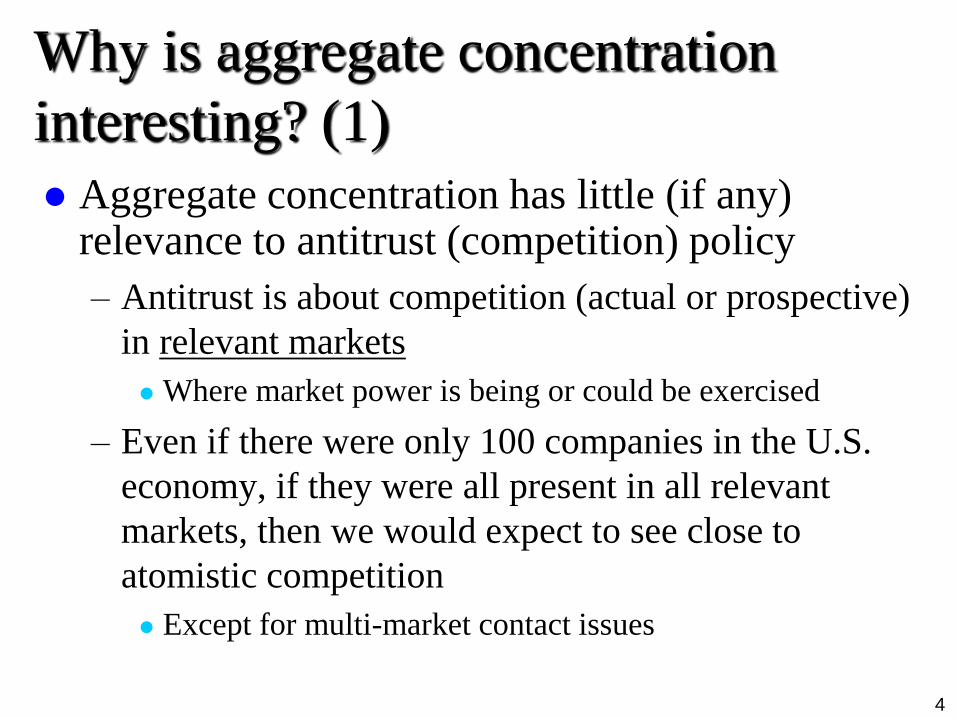
Aggregate concentration has little (if any) relevance to antitrust (competition) policy
– Antitrust is about competition (actual or prospective)
in relevant markets
Where market power is being or could be exercised
– Even if there were only 100 companies in the U.S.
economy, if they were all present in all relevant
markets, then we would expect to see close to
atomistic competition
Except for multi-market contact issues
4

Why is aggregate concentration
interesting? (2)
Instead, the issue of aggregate concentration is about the “tone” or “feel” of an overall economy
– How “important” are the largest X companies?
– What would it feel like to be in an economy where
there were only 100 – or even only 1000 – mega
companies?
There may be trade-offs
– Economies of scale and scope
versus
– A more diverse and diversified economy 5

What should be the measurement basis:
Sales? Sales (revenue or units or “shipments”) is often a
good basis for antitrust purposes in relevant markets
– Standard oligopoly models use “output”
Sales revenue is readily available for publicly traded (large) firms
Sales revenue is the basis for the Fortune “500” ranking
But for aggregation (of sales revenue) across firms in all markets: a double counting problem
– Suppose a vertically integrated company separates into
2 separate companies: a “supplier” and a “customer”… 6

What should be the measurement basis:
Assets? Assets may a basis for antitrust purposes if capacity
is relevant with respect to competition issues
Assets are readily available for publicly traded firms
But for an aggregation across firms in all markets that includes financial institutions: a double counting problem
– A loan by a bank to company counts as an asset for the
bank
– If the company invests the proceeds of the loan into a
factory or machinery or inventories…
Assets may be subject to accounting vagaries 7

What should be the measurement basis:
Employment? Employment is not relevant for antitrust purposes
Employment can be aggregated across companies
Employment data are available for publicly traded companies
Employment (jobs!) and employment growth is an important social issue
– What size firms provide what % of overall employment
(and/or what % of job growth) is often discussed in the
media
But employment numbers don’t tell us about “good jobs” (wages, human capital, etc.)
8

What should be the measurement basis:
Payroll? Payroll does tell us something about labor
income
– Maybe tell us something about income distribution?
Payroll can be aggregated across firms
Payroll is a component of value added
But payroll data ignore fringe benefits
But payroll data are not readily available for individual firms
9

What should be the measurement basis:
Profits? Profits can be aggregated across firms
Profits are available for publicly traded firms
Profits are a component of value added
Profits data are sometimes discussed in the media
– E.g., the % of corporate profits that were attributable
to the financial services sector in the 2000s
But profits data may be subject to accounting vagaries
10

What should be the measurement basis:
What about franchise operations? Franchise arrangements are important for many
multiple-location retail operations
– E.g., fast food, hotels/motels, auto rental agencies
McDonald’s: 90% of U.S. outlets, 82% of worldwide
outlets are owned by franchisees
– But not supermarkets, department stores
Franchisor data includes only royalty payments from franchisees (not brand-wide aggregates)
Is the impact of McDonald’s understated?
– McDonald’s was ranked #109 for 2015 by Fortune
based on sales (consolidated = worldwide)
If franchisees’ sales were included, the rank would be #31
11
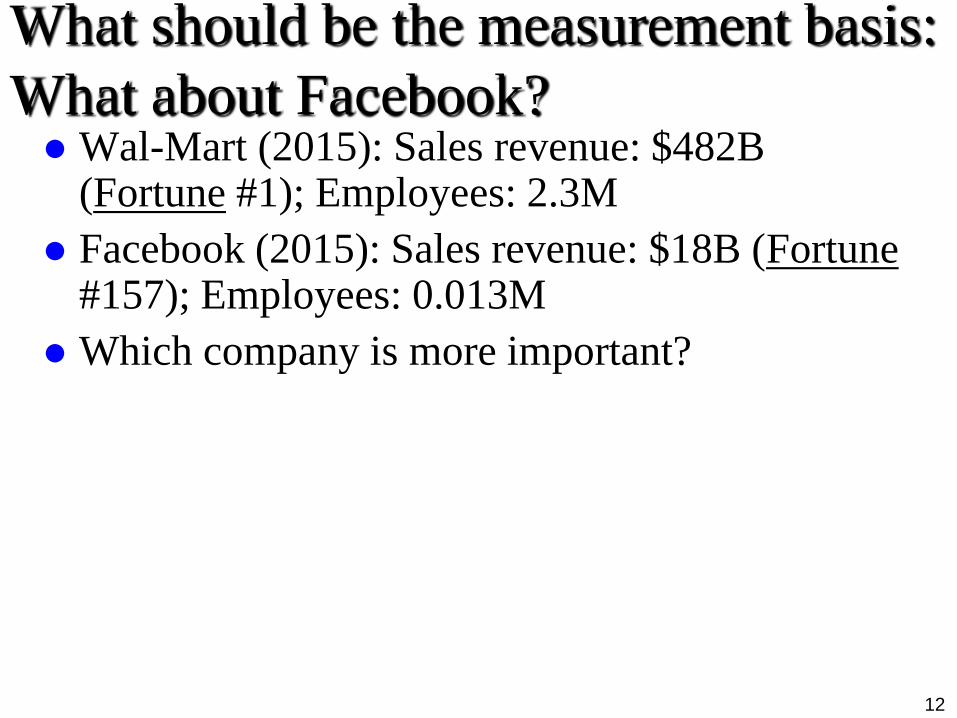
What should be the measurement basis:
What about Facebook? Wal-Mart (2015): Sales revenue: $482B
(Fortune #1); Employees: 2.3M
Facebook (2015): Sales revenue: $18B (Fortune #157); Employees: 0.013M
Which company is more important?
12

What should be the measurement basis:
Value added? Value added may be the best all-around measure
of a company’s impact/importance in the economy
But value added data are generally not available for individual companies
13
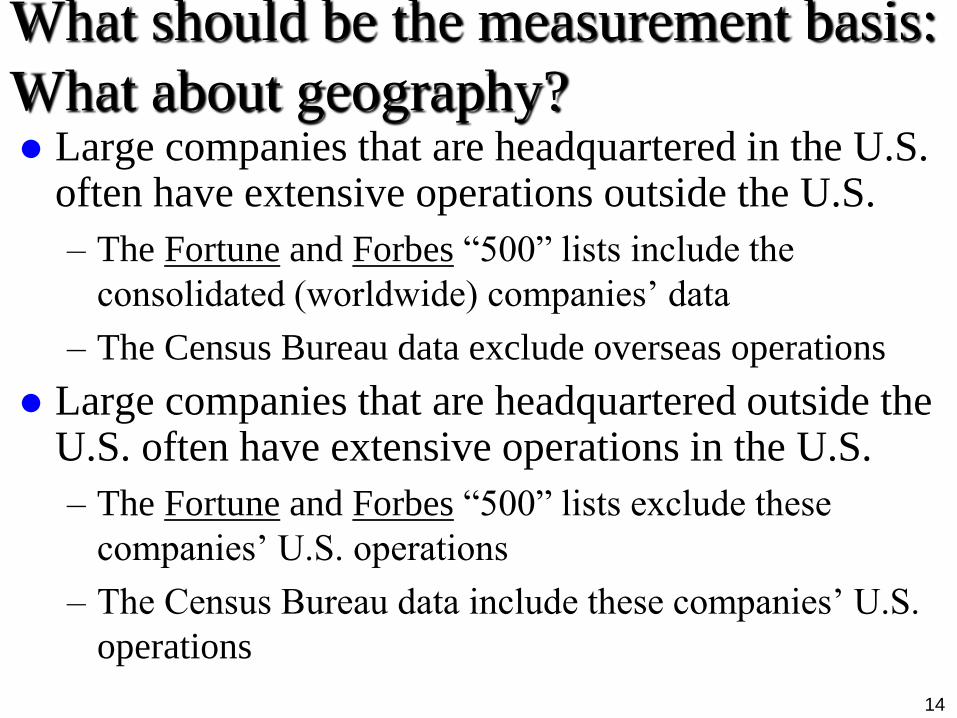
What should be the measurement basis:
What about geography? Large companies that are headquartered in the U.S.
often have extensive operations outside the U.S.
– The Fortune and Forbes “500” lists include the
consolidated (worldwide) companies’ data
– The Census Bureau data exclude overseas operations
Large companies that are headquartered outside the U.S. often have extensive operations in the U.S.
– The Fortune and Forbes “500” lists exclude these
companies’ U.S. operations
– The Census Bureau data include these companies’ U.S.
operations
14

The measurement bases: The Bureau of
the Census data Census of Manufactures
– Value added for U.S. manufacturing: 1947-2012
(census years)
Plus an occasional year from the Annual Survey of
Manufactures
Statistics of U.S. Businesses (SUSB)
– Employment and payroll for the U.S. operations of all
companies with operations in the U.S.: 1988-2014
(annual)
Separated into firm employment size “buckets” and a
special compilation of the largest 100, 500, and 1000
companies
15

The measurement bases: the Fortune
and Forbes “500” data
Annual employment and profits for the consolidated companies (worldwide) with headquarters in the U.S.
– Forbes: 1980-2000 (years with consistent, usable data)
But after 2000…
– Fortune: 1993-2016 (years with consistent, usable
data)
Began in 1954
But before 1993…
16

17
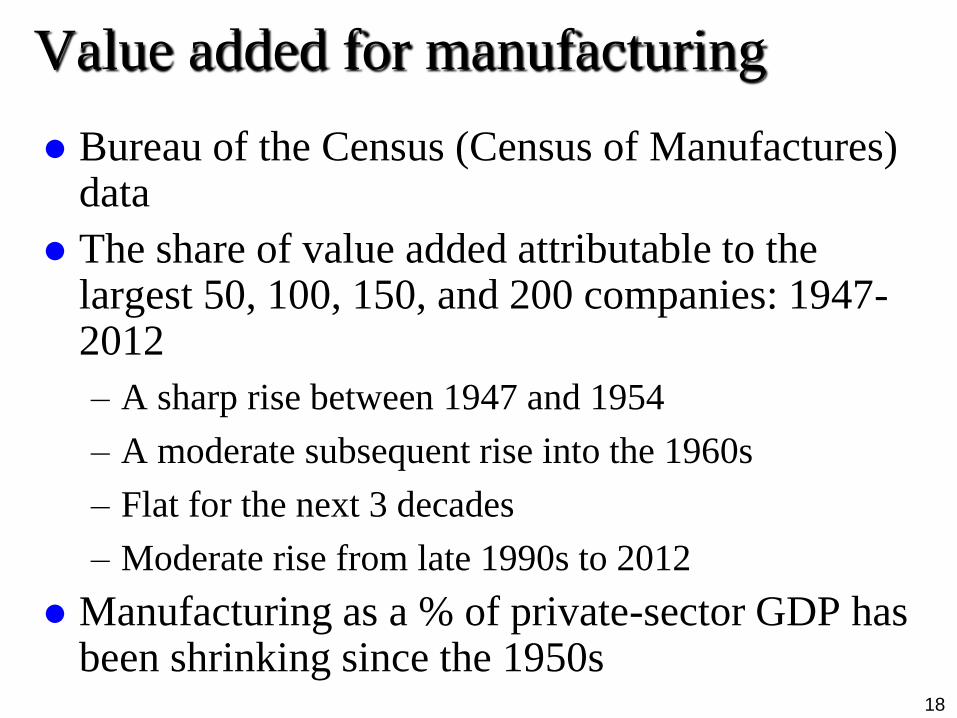
Value added for manufacturing
Bureau of the Census (Census of Manufactures) data
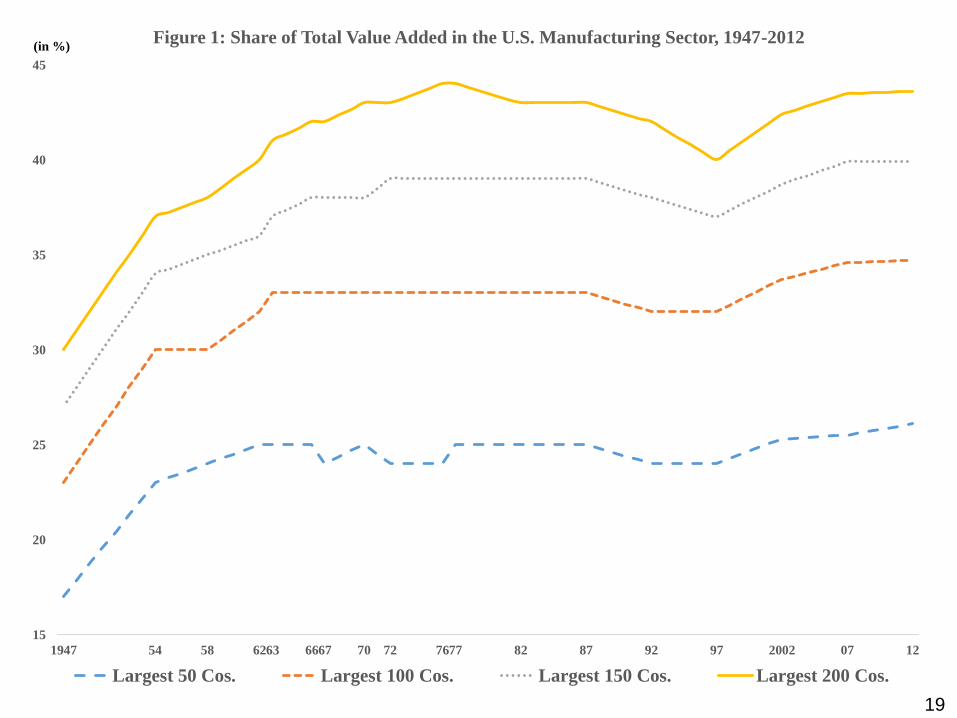
The share of value added attributable to the largest 50, 100, 150, and 200 companies: 1947-2012
– A sharp rise between 1947 and 1954
– A moderate subsequent rise into the 1960s
– Flat for the next 3 decades
– Moderate rise from late 1990s to 2012
Manufacturing as a % of private-sector GDP has been shrinking since the 1950s
18
19
15
20
25
30
35
40
45
1947 54 58 6263 6667 70 72 7677 82 87 92 97 2002 07 12
Figure 1: Share of Total Value Added in the U.S. Manufacturing Sector, 1947-2012
Largest 50 Cos. Largest 100 Cos. Largest 150 Cos. Largest 200 Cos.
(in %)

SUSB data: employment and payroll
Bureau of the Census (SUSB) annual data: 1988-2014
Largest bucket: firms with 10,000+ employees
– Increase in the number of largest firms
– Modest increase in their % of all firms
– Sharp increase in their % of private-sector employment,
1993-2001; then a dip; then modest increase 2004-2014
– Average employee size fell 1988-1994; rose 1994-
2004; level 2004-2014
– Varied pattern of their share of private-sector payroll:
overall a net increase
20

643
994
600
650
700
750
800
850
900
950
1000
1988 1990 1995 2000 2005 2010 2014
Figure 2: Numbers of U.S. Firms, 10,000+ Employees, 1988-2014
21
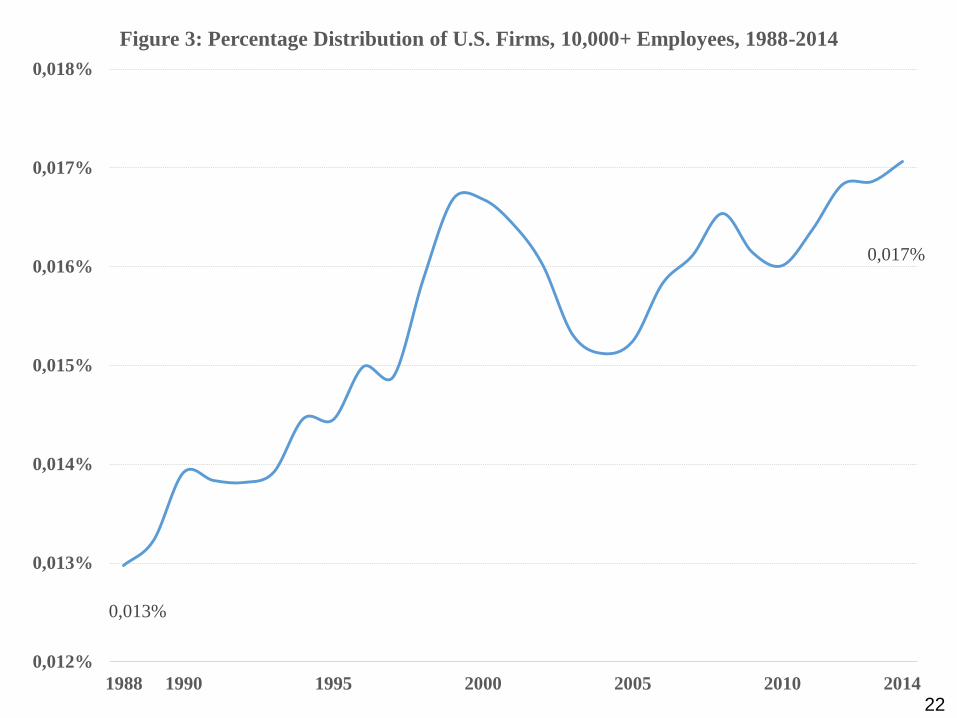
0,013%
0,017%
0,012%
0,013%
0,014%
0,015%
0,016%
0,017%
0,018%
1988 1990 1995 2000 2005 2010 2014
Figure 3: Percentage Distribution of U.S. Firms, 10,000+ Employees, 1988-2014
22

23,81%
28,30%
23%
24%
25%
26%
27%
28%
29%
1988 1990 1995 2000 2005 2010 2014
Figure 4: Percentage Distribution of Employees, 10,000+ Employees, 1988-2014
23

32.528,3
30,423.6 (1994)
34.464,4
30.000
30.500
31.000
31.500
32.000
32.500
33.000
33.500
34.000
34.500
35.000
1988 1990 1995 2000 2005 2010 2014
Figure 5: Average Employee Size of Enterprise, 10,000+ Employees, 1988-2014
24
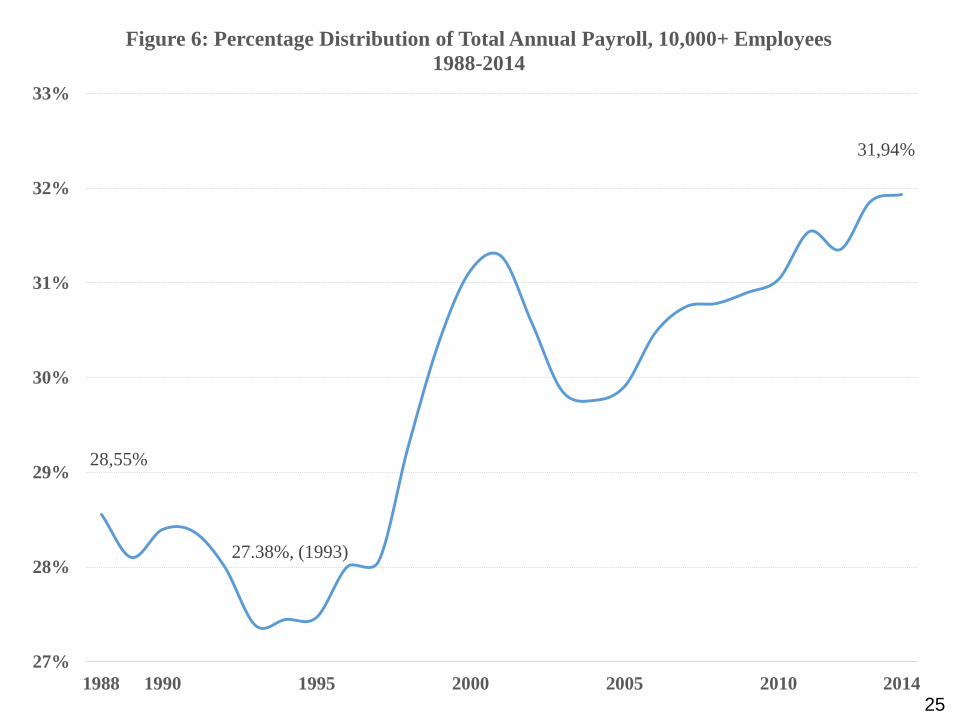
28,55%
27.38%, (1993)
31,94%
27%
28%
29%
30%
31%
32%
33%
1988 1990 1995 2000 2005 2010 2014
Figure 6: Percentage Distribution of Total Annual Payroll, 10,000+ Employees
1988-2014
25

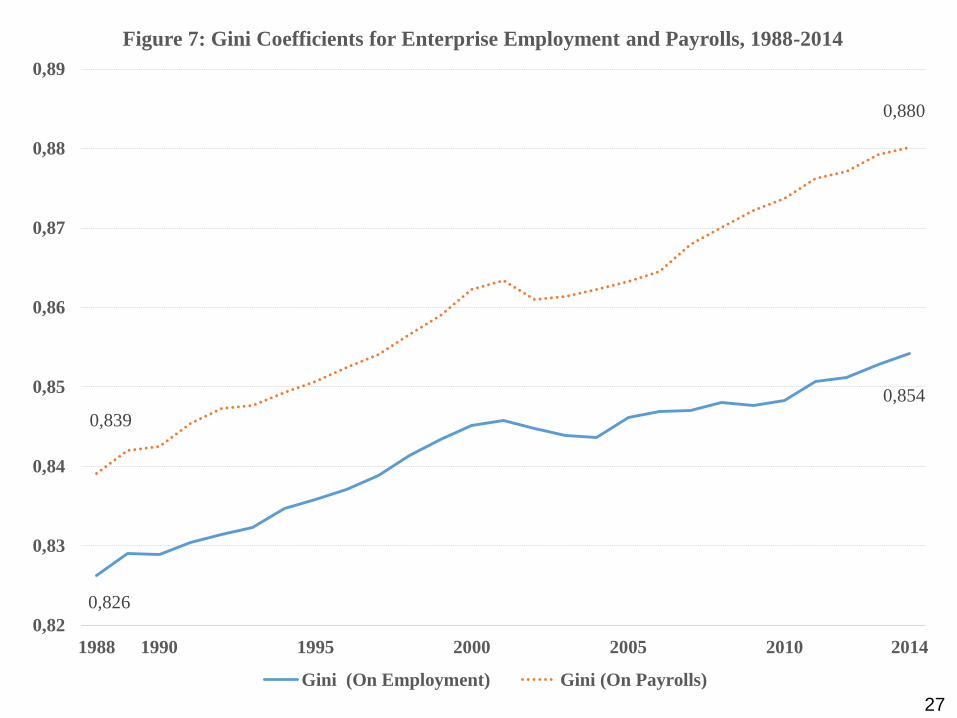
SUSB data: Gini coefficients (1)
Gini coefficients for employment (9-bucket data)
– 1988: 0.826
Equivalent to (for 2 buckets): Largest 8.7% of all firms
employ 91.3% of all employees
– 2014: 0.854
Equivalent to: Largest 7.3% of all firms employ 92.7% of
all employees
Gini coefficients for payroll (9-bucket data)
– 1988: 0.839
– 2014: 0.880
Gini for payroll > Gini for employment: Larger firms tend to pay their employees higher wages
26
0,826
0,854
0,839
0,880
0,82
0,83
0,84
0,85
0,86
0,87
0,88
0,89
1988 1990 1995 2000 2005 2010 2014
Figure 7: Gini Coefficients for Enterprise Employment and Payrolls, 1988-2014
Gini (On Employment) Gini (On Payrolls)
27
SUSB data: Gini coefficients (2)
Rising Gini coefficients between 1988 and 2014 are driven by larger % of employment (and of payrolls) by larger firms generally, not just the 10,000+ firms
– The 100-499 employees size category is the dividing
point
28
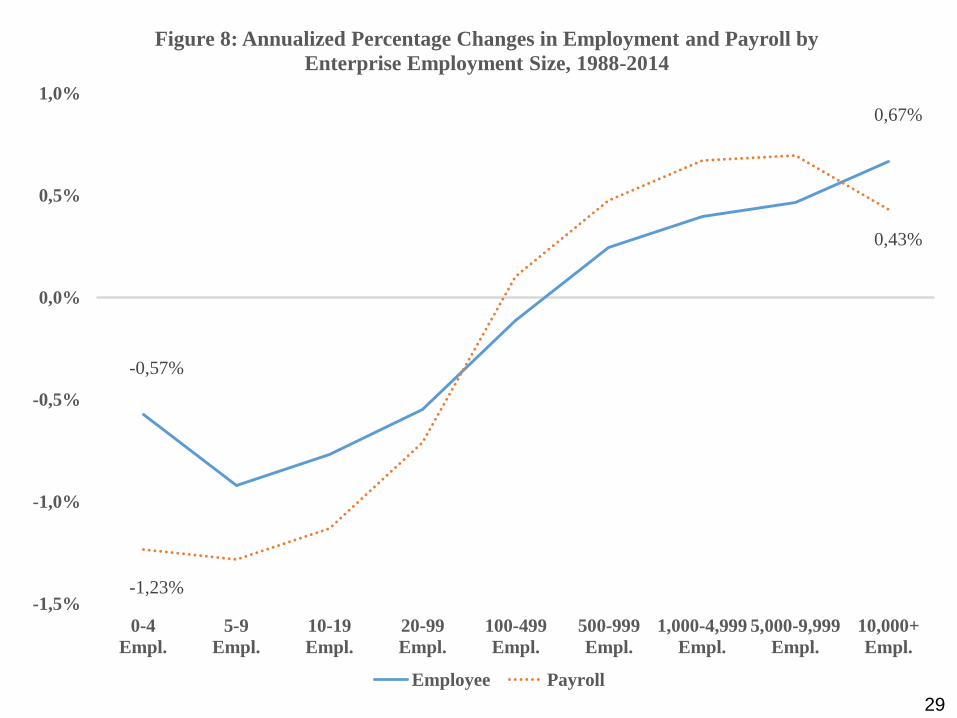
-0,57%
0,67%
-1,23%
0,43%
-1,5%
-1,0%
-0,5%
0,0%
0,5%
1,0%
0-4
Empl.
5-9
Empl.
10-19
Empl.
20-99
Empl.
100-499
Empl.
500-999
Empl.
1,000-4,999
Empl.
5,000-9,999
Empl.
10,000+
Empl.
Figure 8: Annualized Percentage Changes in Employment and Payroll by
Enterprise Employment Size, 1988-2014
Employee Payroll
29

SUSB data: largest firms
Largest 100, 500, 1000 firms: employment %
– Mild decrease from 1988 to mid 1990s; mild increase
since then
– Aggregate concentration slightly higher in 2014 than in
1988
Largest 100, 500, 1000 firms: payroll %
– Aggregate concentration slightly lower in 2014 than in
1988; more pronounced for largest 100
Largest 100 firms as of 2014
– % employment > % payroll: The largest 100 have
lower payroll/employee than for companies generally
30
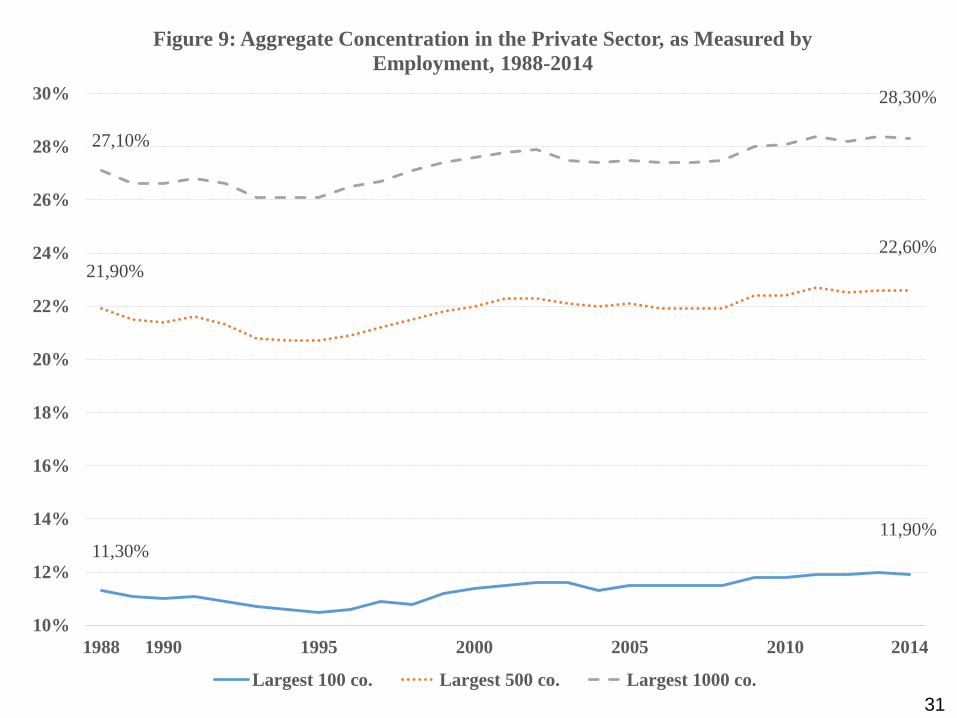
11,30%
11,90%
21,90%
22,60%
27,10%
28,30%
10%
12%
14%
16%
18%
20%
22%
24%
26%
28%
30%
1988 1990 1995 2000 2005 2010 2014
Figure 9: Aggregate Concentration in the Private Sector, as Measured by
Employment, 1988-2014
Largest 100 co. Largest 500 co. Largest 1000 co.
31
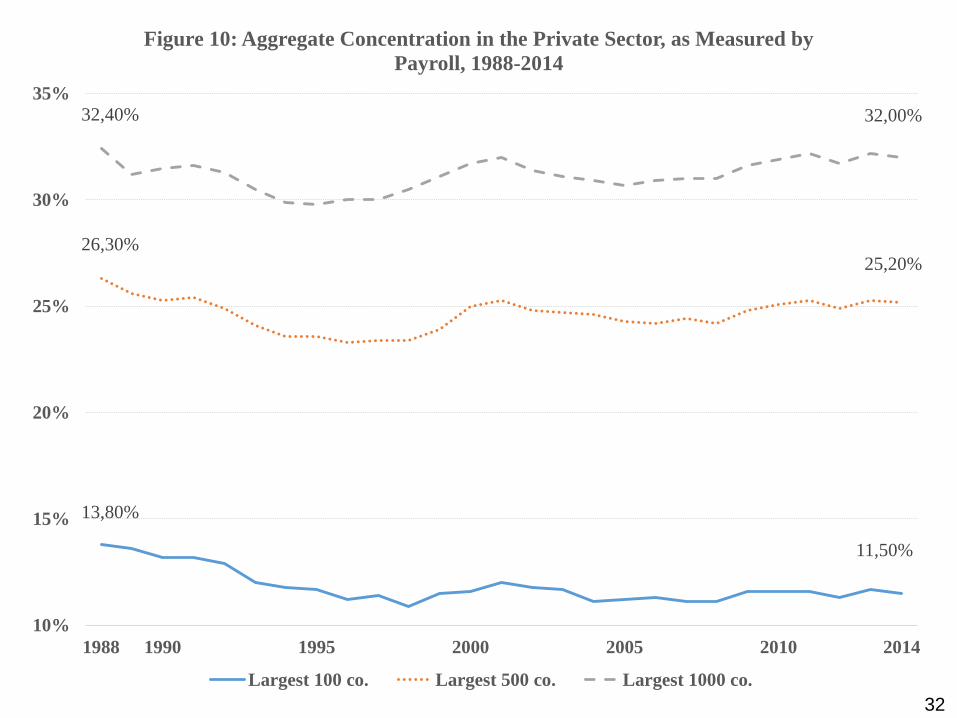
13,80%
11,50%
26,30% 25,20%
32,40% 32,00%
10%
15%
20%
25%
30%
35%
1988 1990 1995 2000 2005 2010 2014
Figure 10: Aggregate Concentration in the Private Sector, as Measured by
Payroll, 1988-2014
Largest 100 co. Largest 500 co. Largest 1000 co.
32
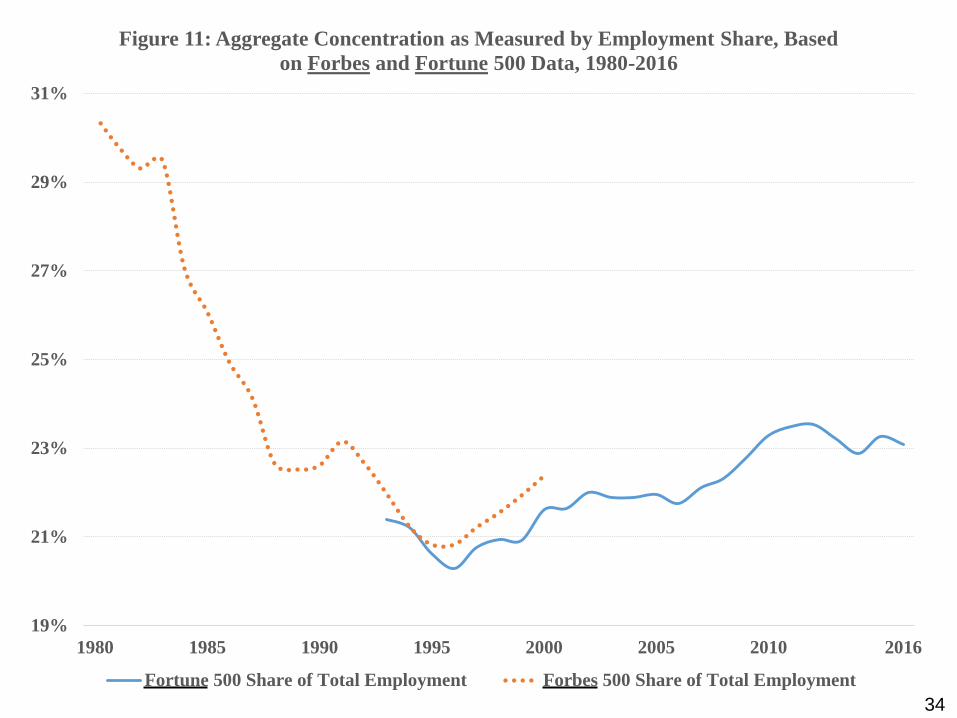
Fortune & Forbes “500” data
Fortune (1993-2016) and Forbes (1980-2000) “500” annual data
– The overlapping years are reasonably consistent
– Employment data are consistent with SUSB data for the
overlapping years
Employment
– Sharp fall in aggregate concentration from 1980 to mid
1990s; modest increases since then
Profits
– Rise and fall in reasonable patterns
– Variable over the years; probably a decrease since mid
1980s 33
34
19%
21%
23%
25%
27%
29%
31%
1980 1985 1990 1995 2000 2005 2010 2016
Figure 11: Aggregate Concentration as Measured by Employment Share, Based
on Forbes and Fortune 500 Data, 1980-2016
Fortune 500 Share of Total Employment Forbes 500 Share of Total Employment

35
0%
20%
40%
60%
80%
100%
120%
1980 1985 1990 1995 2000 2005 2010 2016
Figure 12: Aggregate Concentration as Measured by Profits Share, Based on
Forbes and Fortune 500 Data, 1980-2016
Fortune 500 Share of Total Corporate Profits Forbes 500 Share of Total Corporate Profits
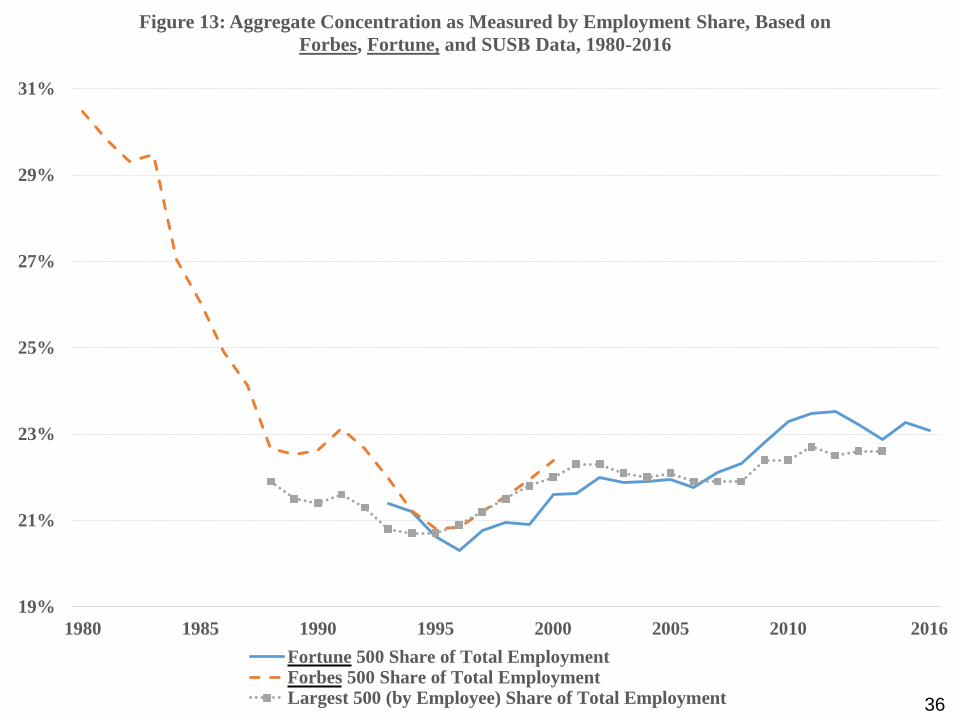
19%
21%
23%
25%
27%
29%
31%
1980 1985 1990 1995 2000 2005 2010 2016
Figure 13: Aggregate Concentration as Measured by Employment Share, Based on
Forbes, Fortune, and SUSB Data, 1980-2016
Fortune 500 Share of Total EmploymentForbes 500 Share of Total EmploymentLargest 500 (by Employee) Share of Total Employment 36
Conclusion
Aggregate concentration has been rising moderately during the first 1½ decades of the 21st century
Aggregate concentration is probably still below the levels of the early 1980s
– Clear for employment
– Probable for profits
Are these trends desirable?
What has been driving these trends?
37