What Engineering Can Do for You! Low Cost … Cos… · What Engineering Can Do for You! Low Cost...
79
What Engineering Can Do for You! Low Cost Countermeasures for Transportation Safety Adam Larsen Safety Engineer Federal Highway Administration 360-619-7751 [email protected]
Transcript of What Engineering Can Do for You! Low Cost … Cos… · What Engineering Can Do for You! Low Cost...
What Engineering Can Do for You!
Low Cost Countermeasures for Transportation Safety
Adam Larsen Safety Engineer
Federal Highway Administration 360-619-7751

Adam Larsen TTP Safety Engineer & Tribal Coordinator Federal Highway Administration 360-619-7751, [email protected]

Safety History
In several states, Native Americans are two times over represented in motor vehicle fatality rates

Safety History
According to the NHTSA Fatality Analysis Reporting System (FARS):
Five year total of 2,752 fatalities reported.
654 657 704 650
564 531 438
569
0
200
400
600
800
2004 2005 2006 2007 2008 2009 2010 2011
Native American Fatalitites

Safety History
Motor Vehicle Crashes are the leading cause of death for Native Americans and Alaska Natives ages 1 to 44.

∗Road User – Do I feel safe?
∗ Engineer – meets design standards or crash frequency below threshold
∗ Legislation – Crash Experience - No fatal or injury incidents
Define Safety

Countermeasure– An action expected to result in a reduction of crashes
Engineering Countermeasures

1. Data-Driven Problem ID
Strategic Safety Plans

1. Data-Driven Problem ID
2. Multi-disciplinary strategies to address problems
Strategic Safety Plans
∗ Enforcement ∗ EMS ∗ Education ∗ Engineering ∗ Spot Locations ∗ Systematic Improvement
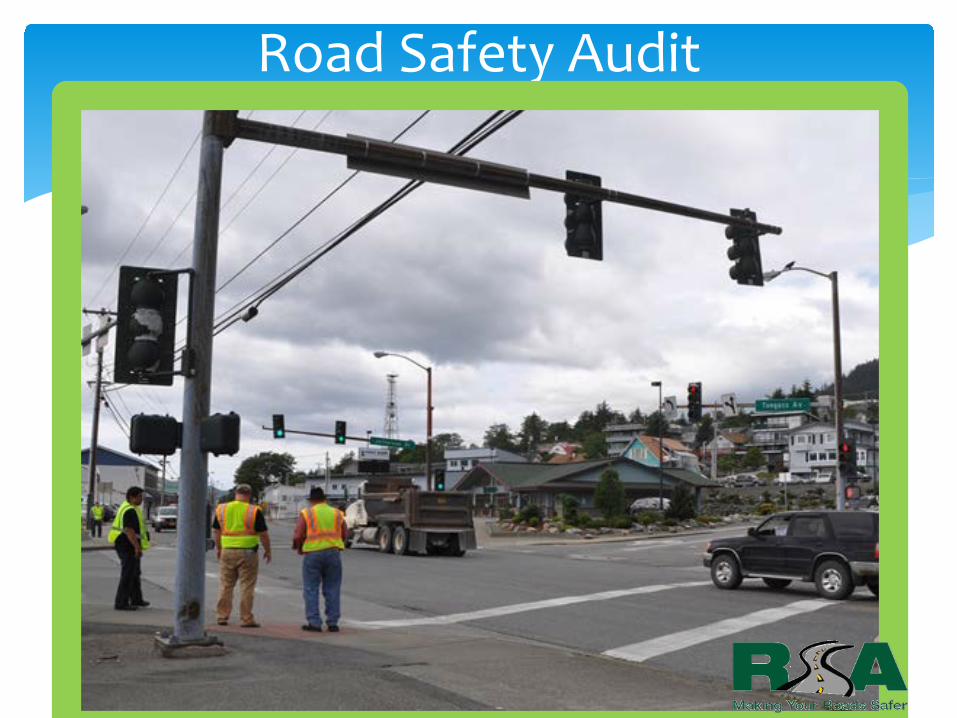
Road Safety Audit


Road Environment Factors (28%)
Vehicle Factors (8%)
Human Factors (95%)
4%
24% 67% 4%
4%
TYPICAL REPORTED CRASH CAUSES
Contributing Factors

Select and Install Countermeasures
∗ Before applying countermeasures, answer these questions:
1. What type of crash does it address? 2. Where should it be used? 3. Why will it work? 4. What is the estimated time and cost to deploy? 5. How effective will it be?
3-18
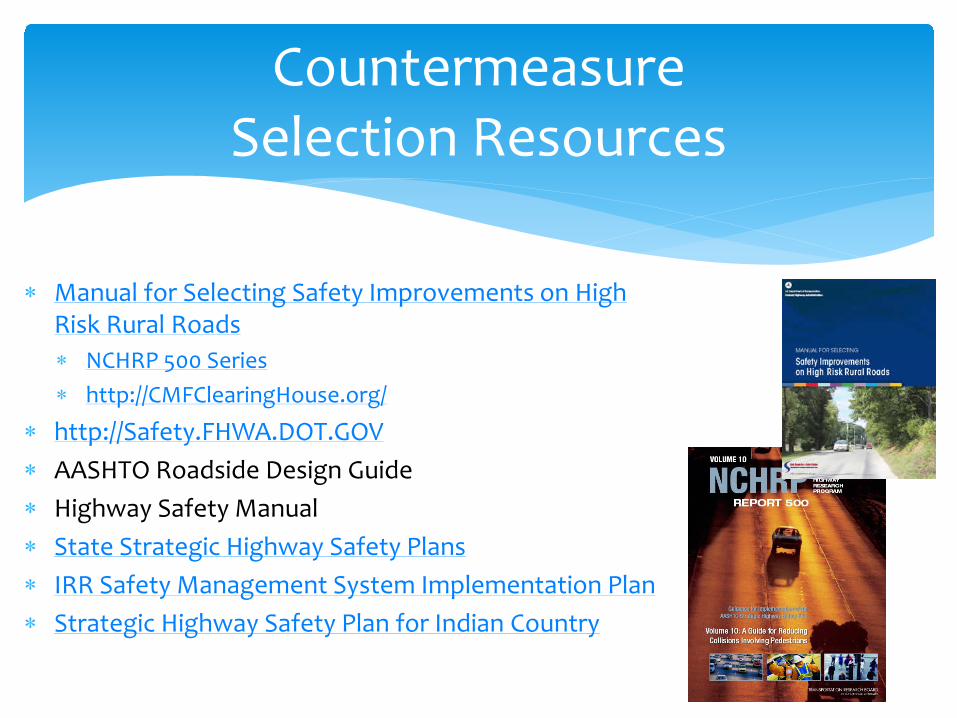
Countermeasure Selection Resources
∗ Manual for Selecting Safety Improvements on High Risk Rural Roads ∗ NCHRP 500 Series ∗ http://CMFClearingHouse.org/
∗ http://Safety.FHWA.DOT.GOV ∗ AASHTO Roadside Design Guide ∗ Highway Safety Manual ∗ State Strategic Highway Safety Plans ∗ IRR Safety Management System Implementation Plan ∗ Strategic Highway Safety Plan for Indian Country

Manual for Selecting Safety Improvements on High Risk Rural Roads (HRRR Manual)
• Assists State, local, and Tribal agencies in finding and comparing cost-effective treatments on high risk rural roads
• Developed by conducting a survey and study of State, local, and Tribal agencies’ current practices
21
http://safety.fhwa.dot.gov/hsip/hrrr/manual
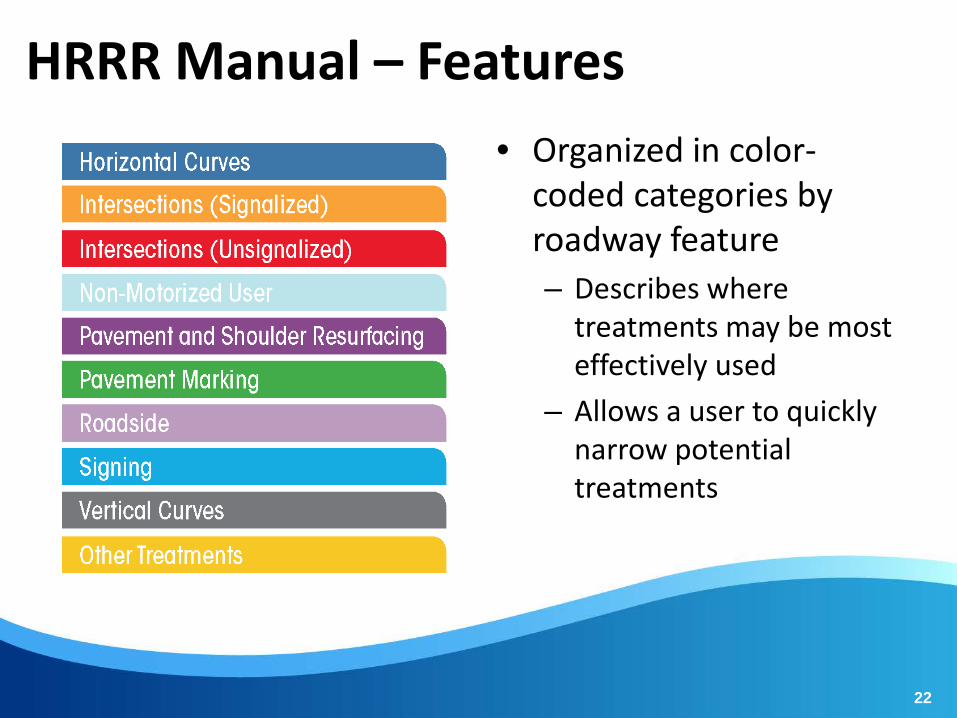
HRRR Manual – Features
22
• Organized in color-coded categories by roadway feature – Describes where
treatments may be most effectively used
– Allows a user to quickly narrow potential treatments

HRRR Manual – Features (continued) • A matrix in each category section helps users narrow the
possibilities based on criteria specific to an agency’s needs and available resources, such as: – Initial cost – Ongoing maintenance
costs – Safety benefit – Benefit-cost ratio
• The manual also contains: – Safety program
management – Potential funding
sources – Decision-making tools
23

Proven Countermeasures Safety.FHWA.DOT.GOV

% of Total Fatal Crashes
Fatal Crash Types
Lane Departure
Intersections
Pedestrians
53% 20%
12%

Roadway Departure Engineering Countermeasures
• Keep on Road
• Lessen Severity After Departure

Roadway Departure Countermeasures Safety.FHWA.DOT.GOV
Enhanced Delineation and Friction for Horizontal Curves
http://MUTCD.FHWA.DOT.GOV

Percent Curve Crashes
54
17
42
37
36
22 22
27
46
35
29
27
41
23
18 13
26
24
DC
29 20
25
29
30
34
39
35
21
16
22
35
32
18
35
40
32
17
35
43
40
24
30
26
25
39 21
44
27
21
44
DC=8
2006-2008 Average
36
3-31

2009 MUTCD on Curves
∗ Install Advanced Warning – 30% crash reduction
∗ Install Chevrons –4% to 25% crash reduction
∗ Install post mounted delineators – 15% crash reduction

2009 MUTCD on Curves
∗ MUTCD.FHWA.DOT.GOV ∗ 2009 MUTCD Table 2C-5 ∗ Not required for roads with <400 ADT ∗ Adding Chevrons CRF: 20 – 50 ∗ December 2019 Compliance Date

Fluorescent Sign Colors
Option for fluorescent colors ∗ Florescent Yellow Chevrons on high risk curves ∗ 34% crash reduction
Fluorescent yellow
Standard yellow


Roadway Departure Friction Treatments
25-60% Crash Reduction

Roadway Departure Rumble Strips
∗ Injury crash reduction ∗ 18% on rural two-lane highways. ∗ 17% on rural multi-lane divided
highways.
∗ Reduction in run-off-road crashes of 38% on freeways.

Edge Rumble Stripes
Night + Rain Conditions
Roadway Departure Rumble Strips

Roadway Departure Safety Edge


Edge
Dro
p-O
ff


∗ Improves Compaction ∗ Reduces Maintenance Expense ∗ Saves Lives (8 – 15% crash reduction) ∗ Adds Less than 1% to Pavement Resurfacing
Roadway Departure Safety Edge

“Safety Edge”
FHWA Loaner Shoe
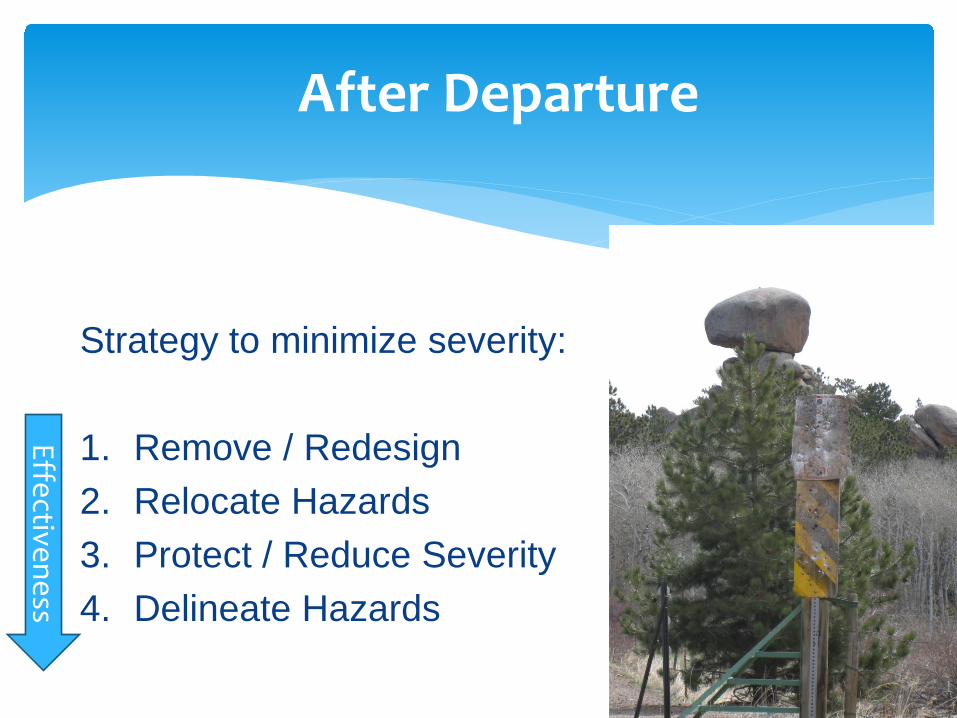
After Departure
Strategy to minimize severity:
1. Remove / Redesign 2. Relocate Hazards 3. Protect / Reduce Severity 4. Delineate Hazards
Effectiveness

Clear Zone
BEFORE AFTER
10 to 35 feet minimum depending on speed and slope.
(See AASHTO Roadside Design Guide)

Remove Hazards
• Fixed Objects o Trees / Vegetation
o (>4” diam.) oNon-breakaway posts o Fences, especially with top rail oNon-crashworthy barrier oDrainage structures o Boulders oMonument Mailboxes
40% reduction in Fatal/Inj crashes

Protect / Shield
• Protect objects
• Grading to lessen severity
• Crashworthy

Dangerous Guardrail Ends Blunt Ends Turn Down Terminals

Delineate – Last Resort
• Objects • Adverse / unexpected alignment • Non-traversable slopes

Intersection Countermeasures Safety.FHWA.DOT.GOV
Keys to Intersection Safety
∗Manage conflict points ∗Adequate sight distance ∗Provide advance warning & navigation ∗ Increase intersection conspicuity ∗Minimize road user delay
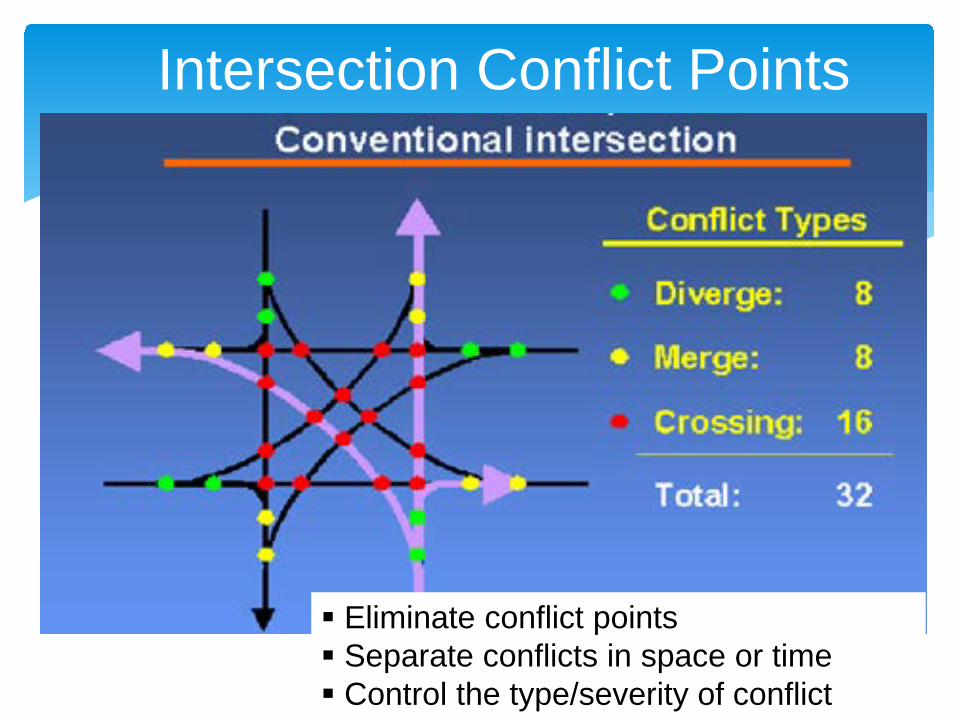
Intersection Conflict Points
Eliminate conflict points Separate conflicts in space or time Control the type/severity of conflict

Install Traffic Signal
Magic Bullet? Increase Rear end crashes by 50% Decrease Angle crashes by 65%

Lummi Nation

Roundabouts & Peds

Intersection Conspicuity

• Benefits color blind individuals at night • Improved safety during power outages
4D.12
Enhance Traffic Signal Visibility – Retroreflectorized Border: CRF 24% (All Crashes) CRF 16% (Injury/Fatal Crashes)

Compliance Dates Changes
June 2014 Implement a sign maintenance program
Jan 2015 “regulatory” signs
“warning” signs ground-mounted “guide” signs
(except street name signs)
Jan 2018 overhead guide signs
street name signs

Access Control
• Consolidate Conflict Points with Access Control. • Improve safety, operations of road.

Road Diets
• 5-29% crash reduction • Improved traffic flow • Traffic Volume: 15k-20k or less

Reclaim street space for other uses
On-street parking Median
Center Turn-Lane
Bike Lanes
Road diets

3 crash types can be reduced by going from 4 to 3 lanes: which ones?
Designing for Pedestrian Safety – Road Diets

X
3 crash types can be reduced by going from 4 to 3 lanes: 1 – rear enders

X
3 crash types can be reduced by going from 4 to 3 lanes: 2 – side swipes

X
3 crash types can be reduced by going from 4 to 3 lanes: 3 – left turn/broadside

Reality: Before Designing for Pedestrian Safety – Road Diets

Reality: After Designing for Pedestrian Safety – Road Diets

Pedestrian Countermeasures Safety.FHWA.DOT.GOV

73
Where do pedestrians get hit most
often?

74 9-74
Before
Reclaiming road space creates room for ped islands

9-75
Concept
Reclaiming road space creates room for ped islands

9-76
Before
After

Pedestrian Conflict Zones
Consolidate, Eliminate, and Separate

Where will pedestrians cross?
Provide Positive Guidance

Ped Activated Beacons
HAWK

Ped Activated Beacons
RRFB
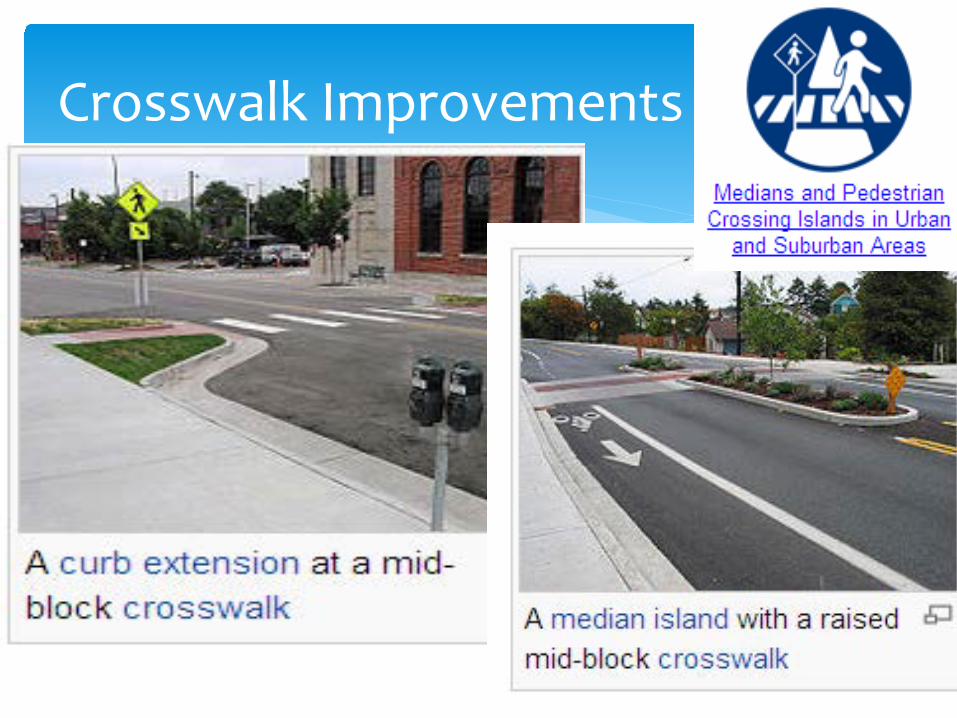
Crosswalk Improvements

Avoid Pedestrian Obstacles
2-82 Las Vegas NV

Eliminate Choke points or gaps

Eliminate Choke points or gaps

Crash Reduction Factor (CRF): 6 ft Paved shoulders reduce pedestrian crashes 70% Sidewalks reduce pedestrian crashes 88%
Pedestrian Facilities

∗ Name
∗ Employer
∗ Safety Plan Status
∗ Applied to TTP Safety Fund? Plan to apply this year?
∗ Other Safety Initiatives by your Government?
Your Safety Efforts