What Drives Investments into Mutual Funds? Applying the ... · Applying the Theory of Planned...
39
1 What Drives Investments into Mutual Funds? Applying the Theory of Planned Behaviour to Individuals’ Willingness and Intention to Purchase Mutual Funds Nicolas Schmidt 1 First Draft: July 2010 Current Draft: November 2010 ______________________ 1 WHU - Otto Beisheim School of Management, Burgplatz 2, D-56179 Vallendar, Germany, [email protected], +49 177 705 705 1
Transcript of What Drives Investments into Mutual Funds? Applying the ... · Applying the Theory of Planned...

1
What Drives Investments into Mutual Funds? Applying the Theory of Planned Behaviour to Individuals’
Willingness and Intention to Purchase Mutual Funds
Nicolas Schmidt 1
First Draft: July 2010 Current Draft: November 2010
______________________ 1 WHU - Otto Beisheim School of Management, Burgplatz 2, D-56179 Vallendar, Germany, [email protected], +49 177 705 705 1
2
What Drives Investments into Mutual Funds? Applying the Theory of Planned Behaviour to Individuals’
Willingness and Intention to Purchase Mutual Funds
NICOLAS SCHMIDT
ABSTRACT
With decreasing generosity of public pension schemes, private retirement savings and participation in capital markets becomes more important. However, only parts of the population engage in financial markets. This effect is known as “participation puzzle” and widely researched. This paper adds to literature on household finance and portfolio choice. It improves the understanding of factors influencing the decision to participate in capital markets through mutual funds. To examine the predictors, we employ the Theory of Planned Behaviour (TPB), a largely elaborated and widely used framework to measure behavioural intentions. For analysis we use unique survey data with 1.673 participants from Germany. The results indicate that TPB components account for 67% of variance of willingness and 71% of variance of the intention to invest in mutual funds. We find that social pressure, attitude and perceived behavioural control show significant and positive influence on both dependent variables. Results support our model and associated hypotheses based on TPB, making it useful to assist in further research. Our findings are also in line with existing results within household finance. We conclude with implications for mutual fund companies and industry associations and give suggestions for future avenues of research.
JEL Classification: D03, D14, G11, G15, G23 Key Words: household finance, portfolio choice, mutual funds selection, private investor behaviour, stock market participation, smart decision making, fund selection criterion, mutual funds purchase intention

3
What Drives Investments into Mutual Funds? Applying the Theory of Planned Behaviour to Individuals’
Willingness and Intention to Purchase Mutual Funds
NICOLAS SCHMIDT
ABSTRACT
With decreasing generosity of public pension schemes, private retirement savings and participation in capital markets becomes more important. However, only parts of the population engage in financial markets. This effect is known as “participation puzzle” and widely researched. This paper adds to literature on household finance and portfolio choice. It improves the understanding of factors influencing the decision to participate in capital markets through mutual funds. To examine the predictors, we employ the Theory of Planned Behaviour (TPB), a largely elaborated and widely used framework to measure behavioural intentions. For analysis we use unique survey data with 1.673 participants from Germany. The results indicate that TPB components account for 67% of variance of willingness and 71% of variance of the intention to invest in mutual funds. We find that social pressure, attitude and perceived behavioural control show significant and positive influence on both dependent variables. Results support our model and associated hypotheses based on TPB, making it useful to assist in further research. Our findings are also in line with existing results within household finance. We conclude with implications for mutual fund companies and industry associations and give suggestions for future avenues of research.
With regard to decreasing generosity of public pension systems, private retirement investment of individuals becomes increasingly important in many industrialized countries and especially in Western Europe. Also with regard to inflation, it evolves as crucial for individuals to somehow participate in capital markets for retirement investments as those provide returns above savings accounts and inflation. As direct holdings in stocks and bonds oblige to have distinct expert financial market knowledge, individuals also have the opportunity to participate indirectly via mutual funds. With mutual funds, individuals can reach diversification across regions, industries and different companies even with low investment and savings volumes and without the need for superior financial literacy. There are several articles existent dealing with reasons for holding mutual funds. Customer services, low transaction costs, diversification and professional management are commonly stated reasons, why one should have mutual funds (e.g. Gruber 1996 citing Sirri and Tufano 1992). Despite these arguments and the necessity to participate in capital markets, not everybody holds mutual funds. It is puzzling, why especially in some developed regions percentage of mutual funds shareholders within population is low. As a result of rising importance but also due to significant growth in some countries, mutual funds have increasingly become a core area in academic research. Research categorizes along

4
its focus on mutual funds industry itself, performance and persistence, mutual funds holder characteristics and on mutual fund decision making. Literature on mutual funds industry includes research on conflicts of interest and competition (Khorana and Servaes 2004, Feirreira and Ramos 2009), mutual fund fees around the world (Khorana, Servaes and Tufano 2009) and comparing developments of the industry in different regions (e.g. Otten and Schweitzer 2002, Klapper, Sulla and Vittas 2004). Khorana, Servaes and Tufano (2005) search for explanations of the size of the industry globally and find that rules and norms of the country affect the financial development. With mutual funds being “advanced” financial products, they prosper in more developed economies. Furthermore, fund industry is larger where per capita GDP is higher and is also impacted by investor wealth and education. Ramos (2009) finds that competition through fewer barriers to entry is positively associated with larger industry and more efficiency in terms of returns and fees. One of the largest areas of research however, questions, whether mutual funds outperform their benchmarks and whether this performance is persistent over time. Initiated by Grinblatt and Titman (1992), who find that performance differences between funds persist, and confirmed by Elton et al. (1996) applying risk-adjusted measures, a large number of research with differing results on persistence followed (e.g. Carhart 1997, Hendricks et al. 1993, Chen et al. 2000, Wermers 2000). For further reading, Anderson and Schnusenberg (2005) provide a comprehensive overview on performance persistence literature. Another field of literature researches mutual funds investor characteristics and their trading behaviour, using questionnaires or portfolio transaction data. Capon, Fitzsimons and Prince (1996) build clusters among mutual funds investors along their information sources used and selection criteria. Alexander, Jones and Nigro (1998) find that typical mutual funds holder are older, wealthier and better educated than average. Regarding trading behaviour, Goetzmann and Peles (1997) identify that cognitive dissonance also exists in mutual funds trading and switching. Lenard et al. (2003) develop a model that can assist in predicting investors’ switching behaviour of mutual funds and find that investors consider investment risk, fund performance, investment mix and capital base of the fund before switching. Bailey, Kumar and Ng (2009) apply behavioural finance originated anomalies to mutual funds trading and find that better-informed and experienced investors make better use of mutual funds. Very closely related to characteristics and trading behaviour is the decision making and selection behaviour of mutual funds investors, which has also been widely researched. One key question analyzes whether investors have selection ability and are able to identify superior mutual funds. The hypothesis known as “smart money effect” states that money flows to funds that will outperform in the future. Thus, flows inherit predictive power over future returns. While Gruber (1996) and Zheng (1999) find selection ability and evidence that funds with high inflows show better performance, a controversial debate followed. Sapp and Tiwari (2004) find that smart money does not hold when controlling for stock momentum. Frazzini and Lamont (2008) even find that fund inflows are associated with low future returns, while outflows are associated with high returns. In contrast, Keswani and Stolin (2008) examine, in a recent paper, U.K. data and provide robust evidence again for smart money in US and UK. Hackethal et al. (2009) conclude that smart investment decisions are made by investors that are holder, more experienced and wealthier.

5
Another question within decision making focuses on criteria by which mutual funds are selected. To identify determinants, academic research uses flow data, questionnaires or portfolio transaction data. Thereby, most researchers find evidence that mutual funds’ past performance influences mutual fund flows (e.g. Ippolito 1992, Bogle 1992, Gruber 1996, Sirri and Tufano 1998, Chevalier and Ellison 1997, Bergstresser and Poterba 2002, Sapp and Tiwari 2004 or Ber, Kempf and Ruenzi 2007). Gruber (1996) finds two different mutual clienteles: sophisticated investors using past performance and disadvantaged clienteles using advice and advertising for selection. Wilcox (2003) employs conjoint analysis to analyze preferences for stock mutual funds and also identifies performance as most important purchase determinant. Recently, Ivkovich and Weisbenner (2009) find evidence that inflows are influenced by relative performance measures while outflows are related to absolute performance. Also linked to performance, Del Guercio and Tkac (2002) find that Morningstar ratings also have power to influence asset flows. Another criterion widely researched involves mutual funds fees. Sirri and Tufano (1998) document a negative relation between fund fees and inflows. Barber, Odean, Zheng, (2005) find that investors are sensitive to the form of charging fund expenses and find negative relations between flows and front-end-load fees. Gruber (1996) as well as Elton, Gruber and Busse (2004) find that individual investors buy funds with high fees. In particular, this holds for investors residing in less affluent and less educated neighbourhoods (Malloy and Zhu 2004) and for overconfident investors (Bailey, Kumar and Ng 2009). Müller and Weber (2009) find a positive relationship between financial literacy and the likelihood of investing passively. However, neither a high IQ (Grinblatt et al. 2007) nor high education levels and experience (Engström 2007) holds investors off purchasing high-fee funds. Zhao (2004) concludes that brokers and financial advisors ultimately minister as decision makers to investments into load funds. Schmidt (2005) conducts a preference-based segmentation of mutual fund purchasers within in private banking clientel via conjoint-analysis and also finds that recommendation of advisors is most important. In contrast, brand seems to be highly unimportant within mutual funds selection. However, prior to researching selection criterion and ability, it is important to gain an understanding of participation decisions even before, i.e. why individuals decide for or against purchasing mutual funds. A similar question is addressed within a broad debate on private household finance and portfolio choice initiated by Campbell (2006) dealing amongst others with nonparticipation in risky asset markets and investment mistakes. One aspect that has caused a wide array of studies is described as stock market participation puzzle, which Haliassos (2002) summarizes as the analysis what keeps the majority of households out of the stock market, even though if one can expect to earn more by holding stocks than by holding riskless financial assets. Results are manifold. Most intuitive factors result from the risks associated with capital market participation. Barsky et al. (1997) show that risk tolerance measures significantly relate to holding stocks. Barberis, Huang and Thaler (2006) analyse and find risk aversion in combination with narrow-framing as potential reason for lack of participation. Dimmock and Kouwenberg (2008) confirm a decreasing probability of equity participation for higher loss aversion. This holds to a greater extent for direct stock holdings than for mutual funds. Cognitive abilities (Christelis et al. 2006), individual’s IQ (Grinblatt et al. 2010) as well as educational

6
background (e.g. Bertraut 1998 or Guiso, Haliassos and Jappelli 2003) are also found associated with the decision to invest in stocks directly or indirectly. Cole and Shastry (2009) provide causal estimates and find large effects of education on participation. Rooij, Lusardi and Alessie (2007) conclude that a lacking understanding of economics and finance is a significant deterrent to stock ownership. Results from Guiso and Jappelli (2005) indicate that a lack of awareness of existing investment vehicles does also limit stock market participation. Trust is another explanation found by Guiso, Sapienza and Zingales (2008). Puri and Robinson (2007) relate participation to general optimism. Other results deal with social interaction and peer effects. Hong, Kubik and Stein (2004) find that social households – defined as those who interact with their neighbours or who attend church – are indeed substantially more likely to invest in the stock market than non-social households. Brown and Taylor (2010) confirm with evidence from UK. Brown et al. (2005) quantify that a 10% increase of equity market participation of the members of one’s community causes 4% increase of probability to invest in stocks. Other findings include relations to health (Rosen and Wu 2004), cultural background (Grinblatt and Keloharju 2001) and internet use (Bogan 2008). Regarding the choice of investing directly or indirectly, Zhu (2005) finds an influence of households’ costs of time: busy individuals rather invest in mutual funds than in single stocks. To sum up, research approaches within stock market participation puzzle primarily focus stock holdings, either direct or indirect. Distinct research on mutual fund purchasing in general and viewed as vehicle independently from asset class is rather scarce. Thus, the main question remains, namely why some households and individuals are generally willing and intending to invest in mutual funds, while others categorically deny. Reasons behind this decision are still unclear. As Keswani and Stolin (2008) stated, “gaining insight into mutual fund investor behaviour continues to be an exciting area for future research”. Especially from professional industry perspective, it becomes crucial to find out more, on what drives individuals to purchase or to not purchase mutual funds. The purpose of this paper is to improve understanding of willingness and intention to invest in mutual funds and thus to identify key factors that determine this willingness and intention. Furthermore, we want to find a model that can assist as basis for further research questions in this field. To examine the predictors of willingness and intention to invest in mutual funds, we established a research model using the Theory of Planned Behaviour (TPB), a largely elaborated and widely used framework to measure intentions. Theory of Planned Behaviour (TPB) is an attitude-behaviour framework that has been developed from earlier Theory of Reasoned Action (TRA) by Ajzen and Fishbein (1980, Fishbein and Ajzen 1975). TRA proposes that an individuals’ behaviour or action is most proximally determined by his intention to engage in that behaviour. Consequently, intention is regarded as the immediate antecedent of behaviour. Intention on the other hand is expected to be a function of three components: attitude, subjective norm and perceived behavioural control. While attitude describes the cognitive or affective evaluation of a behaviour, subjective norm can be interpreted as perceived social pressure towards this behaviour (Ajzen 2002, Armitage and

7
Connor 2001). The perceived control represents the confidence about the ability of performing that certain behaviour. Several meta-analytic reviews of the Theory of Planned Behaviour have proven its validity in predicting behaviours within different contexts and research fields (e.g. Sutton 1998, Armitage and Connor 2001, Downs and Hausenblas 2005). Armitage and Conner (2001) oversaw more than 150 independent studies and reported that the “TPB accounted for 27% and 39% of the variance in behaviour and intention”. Examples of using Theory of Planned Behaviour (TPB) in an investment decision context are scarce. Firstly to be mentioned is East (1993), who applied TPB to decision making for investing in certain shares, specifically in newly issued shares. His results indicate that application for shares was predicted by intention and intention by the attitude, subjective norm, perceived control and past behaviour. The findings showed strong influence of friends and relatives and the importance of easy access to funds within investment decision making. Secondly, Hofmann et al. (2008) applied different behavioural models, including TPB, to explain effects for variations in bidding behaviour within social responsibility investment investing. Results indicate that moral considerations influence investment decisions. To best of our knowledge, so far no other studies tested TPB regarding general willingness and intention to invest in mutual funds. For our research, we constructed a questionnaire based on TPB and collected data through a primary online survey, conducted in Germany in December 2009. Germany is appropriate for analyzing mutual funds willingness and purchase intention since it should provide great potential for mutual funds industry. Its economy belongs to the largest in the world in PPP terms and it accommodates one of the largest stock markets worldwide. Furthermore, German households are historically savers and own substantial wealth in terms of real estate and financial assets. Here, mutual funds industry has experienced significant growth – especially after 1990s – and has become one of the largest mutual funds markets in the world, managing 651.6bn EUR. However, in relation to population and potential, German market is substantially behind other G7 countries, supporting the research question what drives willingness and intention to purchase mutual funds. Final dataset used for analysis consisted of 1.673 participants – being representative for German population and suitable for our research approach. With the full dataset, we calculated structural equation models in order to estimate measurement and structural causal paths simultaneously, to explicitly account for measurement error and receive indices to describe the fit of the models. As covariance-based approach is most appropriate in research, in which well-established causal theories, such as TPB, are available and have to be validated, we employed most widely used Maximum Likelihood (ML) for estimation of parameters. We find that the three key components of TPB, being subjective norm, attitude and perceived behavioural control, are correlated and all show positive and significant influence on both dependent variables, the general willingness and the intention to purchase mutual funds. The results support our model and the associated hypotheses based on TPB, making it useful to assist in further research questions. Our results are consistent with findings from TPB research in other fields, as the model fits are good and coefficients of the three determinants are positive and significant and attitude is strongest predictor for both – willingness and intention. Also correlations between TPB variables are consistent with similar approaches.

8
We can also confirm findings of East (1993) with subjective norm showing significant impact on intention. This is also in line with comparable research within stock market participation by Hong, Kubik and Stein (2004), Brown and Taylor (2010), Brown et al. (2005). The remainder of this paper is organized as follows. In Section I, we provide background on mutual fund industry in Germany, an explanation of the Theory of Planned Behaviour as research framework and derive our hypothesises and research models. In Section II, we present the method including approach, data and key measures. Section III shows results and robustness checks and in section IV, we conclude.
I. Theoretical background and hypotheses A. The German Mutual Fund Industry
With a population just over 80 million, Germany is Europe’s most populous country after France and the UK and is a key member of the European Union and its economic, political and defense organizations. There are several reasons, why Germany provides great conditions and thus potential for mutual funds industry. Firstly, its economic situation: German economy is the fifth largest economy in the world in PPP (purchasing power parity) terms and with a GDP of USD 2.811 trillion in 2009E, European Union’s largest economy accounting for approx. 20% of its 2009E GDP.1 With 34.121 USD also Germany’s GDP in PPP per capita is above European Union average and higher than in France, Japan or Italy, but below levels in US, UK and Canada.2 Secondly, Germany accommodates the seventh largest stock market worldwide and the third largest in Europe after UK and France in terms of market value of publicly traded shares.3 Market value amounts to USD 1.107 trillion after significant decrease of share prices following 2008 financial crisis. Thirdly, German individuals and households are historically significant savers and have accumulated large amounts of financial assets. In 2008, Germany had the second highest net saving rate in terms of percentage of disposable income within the European Union: private households saved about 11.2% of their disposable income – compared to about 4% in Japan and 3% in the United States.4 With regard to financial assets, Germany continuously ranks high within international wealth tables with private households owning more than EUR 4.400 billion. According to World Wealth Report 2009, Germany domiciled the third largest number of HNWIs globally and together with US and Japan accounts for about 54% of 2008 world’s HNWI population. Despite the solid economic foundation and the mentioned prerequisites of its private households, it is a key feature of Germany to lack an equity culture and to have low stock market participation. After decades of lag, German capital market awaked during the period of New Economy. Especially with some major initial public offering, such as Deutsche Telekom in November 1996, more Germans became stockholders resulting in approx. 9.7%
1 CIA World Factbook (2010), https://www.cia.gov/library/publications/the-world-factbook/geos/gm.html, accessed on May, 29th, 2010. Also see International Monetary Fund (2010): World Economic Outlook Database, April 2010. 2 CIA World Factbook (2010), https://www.cia.gov/library/publications/the-world-factbook/geos/gm.html, accessed on May, 29th, 2010. 3 Worldbank (2010): http://data.worldbank.org/indicator/CM.MKT.LCAP.CD 4 Source: Savings rate 2008 according to Eurostat Data and central banks
9
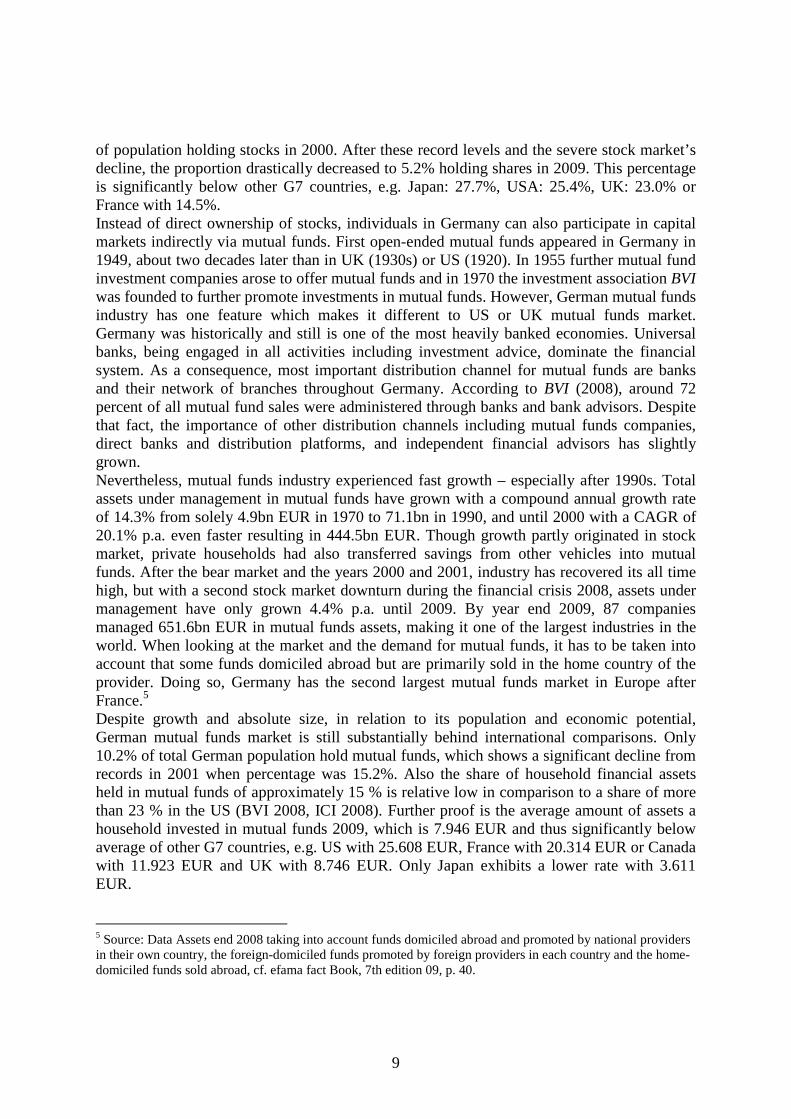
of population holding stocks in 2000. After these record levels and the severe stock market’s decline, the proportion drastically decreased to 5.2% holding shares in 2009. This percentage is significantly below other G7 countries, e.g. Japan: 27.7%, USA: 25.4%, UK: 23.0% or France with 14.5%. Instead of direct ownership of stocks, individuals in Germany can also participate in capital markets indirectly via mutual funds. First open-ended mutual funds appeared in Germany in 1949, about two decades later than in UK (1930s) or US (1920). In 1955 further mutual fund investment companies arose to offer mutual funds and in 1970 the investment association BVI was founded to further promote investments in mutual funds. However, German mutual funds industry has one feature which makes it different to US or UK mutual funds market. Germany was historically and still is one of the most heavily banked economies. Universal banks, being engaged in all activities including investment advice, dominate the financial system. As a consequence, most important distribution channel for mutual funds are banks and their network of branches throughout Germany. According to BVI (2008), around 72 percent of all mutual fund sales were administered through banks and bank advisors. Despite that fact, the importance of other distribution channels including mutual funds companies, direct banks and distribution platforms, and independent financial advisors has slightly grown. Nevertheless, mutual funds industry experienced fast growth – especially after 1990s. Total assets under management in mutual funds have grown with a compound annual growth rate of 14.3% from solely 4.9bn EUR in 1970 to 71.1bn in 1990, and until 2000 with a CAGR of 20.1% p.a. even faster resulting in 444.5bn EUR. Though growth partly originated in stock market, private households had also transferred savings from other vehicles into mutual funds. After the bear market and the years 2000 and 2001, industry has recovered its all time high, but with a second stock market downturn during the financial crisis 2008, assets under management have only grown 4.4% p.a. until 2009. By year end 2009, 87 companies managed 651.6bn EUR in mutual funds assets, making it one of the largest industries in the world. When looking at the market and the demand for mutual funds, it has to be taken into account that some funds domiciled abroad but are primarily sold in the home country of the provider. Doing so, Germany has the second largest mutual funds market in Europe after France.5 Despite growth and absolute size, in relation to its population and economic potential, German mutual funds market is still substantially behind international comparisons. Only 10.2% of total German population hold mutual funds, which shows a significant decline from records in 2001 when percentage was 15.2%. Also the share of household financial assets held in mutual funds of approximately 15 % is relative low in comparison to a share of more than 23 % in the US (BVI 2008, ICI 2008). Further proof is the average amount of assets a household invested in mutual funds 2009, which is 7.946 EUR and thus significantly below average of other G7 countries, e.g. US with 25.608 EUR, France with 20.314 EUR or Canada with 11.923 EUR and UK with 8.746 EUR. Only Japan exhibits a lower rate with 3.611 EUR.
5 Source: Data Assets end 2008 taking into account funds domiciled abroad and promoted by national providers in their own country, the foreign-domiciled funds promoted by foreign providers in each country and the home-domiciled funds sold abroad, cf. efama fact Book, 7th edition 09, p. 40.

10
To conclude, Gremillion (2005) attests Germany one of the largest gaps between wealth and actual mutual fund penetration of all countries. He attributes this to strong conservatism of German investors, who have traditionally favored savings instruments such as CDs and passbook accounts and the lack and delayed introduction of a government provided tax benefit for long term savings with mutual funds like US 401k or UK PEPs and ISAs. A further reason could be the historically given relative generosity of German public pensions system, which in the past rendered own investments unnecessary. Also low financial knowledge of German investors could have caused widespread non-participation. Moreover, recent developments in financial markets have not promoted mutual funds. Many German private investors have experienced significant losses during financial crisis resulting in increased risk and loss aversion. Additionally, general trust in banks and financial institutions has diminished. As a consequence, German mutual funds market experienced major outflows in 2008 being even larger than in US or UK for 2008. At the same time, private individual retirement investments will become more important within the next years, since public pension schemes become increasingly less generous. It remains unclear, how German individuals will behave and mutual funds market will develop. Further insight into behaviour and behavioural intentions would be helpful. In this context, the Theory of Planned Behaviour (TPB) as attitude-behaviour model provides a conceptual framework to analyse mutual funds purchase willingness and intention.
B. Theory of Planned Behaviour and mutual fund purchasing In general, attitude-behaviour models can serve as frameworks to explain intentions and behaviours. One widely used approach in consumer research and in predicting intentions and behaviour is the Theory of Planned Behaviour (TPB) by Ajzen/Fishbein. According to Ajzen (1988), TPB forms a “[…] conceptual framework for the prediction of specific action tendencies, a framework that deals with a limited set of dispositional antecedents assumed to guide specific action tendencies”. The main idea is, that a person’s intention to engage in a certain behaviour constitutes the closest determinant of that behaviour. Intention is thus assumed to be the immediate antecedent of behaviour (Ajzen 1991). This means that an action will be performed, if the individual holds a strong intention to perform this action. Intention in turn is a function of three determinants: the attitude towards behaviour, the subjective norm reflecting a person’s perception of social pressure regarding the behaviour and the perceived behavioural control. Figure 1 visualizes the major relations within the Theory of Planned Behaviour.
Figure 1 Theory of Planned Behaviour (Ajzen 1991, Ajzen and Driver 1992, Ajzen 2006)
Subjective Norm (SN)
Attitude towards a behaviour (ATT)
Perceivedbehavioral control
(PBC)
Intention(INT)
Behaviour

11
The Theory of Planned Behaviour was proposed in 1988 by Ajzen. It emerged from previous Theory of Reasoned Action (TRA), that was developed and introduced by Ajzen and Fishbein (1980, Fishbein and Ajzen 1975) and has roots in various theories of attitude, such as Learning Theories, Expectancy-Value Theories, Consistency Theories and Attribution Theory. The key concept reflected in TRA is that attitude and subjective norm are direct antecedents of intention and thus influence behaviour additively. According to TRA, if an individual evaluates a certain behaviour as positive (meaning a positive attitude) and if he thinks that his relevant peers would approve of such a behaviour (meaning subjective norm), it will result in higher motivation and thus intention to actually perform that meant behaviour. The link between attitude and subjective norm and intention and thereafter between intention and behaviour has been proven in many studies.6 However, critics stated, that TRA can not deal with behaviours that require resources, cooperation or certain skills, meaning behaviours that individuals do not have fully under control. Ajzen (1988) confirmed that “The TRA was developed explicitly to deal with purely volitional behaviours” describing behaviours that only require the formation of an intention. As a consequence, Ajzen (1985, 1988, 1991, 2002) proposed the Theory of Planned Behaviour as an adjusted model reflecting the idea that intentions are also impacted by a person’s resources and opportunities available. To cope with these, he added – as stated above – the perceived behavioural control. TPB has been applied to studies of the relations among beliefs, attitudes, behavioural intentions and behaviours in several fields such as leisure activities, healthcare, marketing, advertising, public relations and economics.7 Numerous meta-analytic reviews of the TPB have been conducted to prove its validity in predicting intentions and behaviours (for reviews see Sutton 1998, Armitage and Connor 2001, Downs and Hausenblas 2005). Sutton (1998) find that TRA and TPB explain on average between 19% and 38% of variance in behaviour and 40% to 50% of variance in intention. Armitage and Conner (2001) reviewed 185 independent studies and summarized that 39% of the variance in behavioural intention and 27% of the variance in the respective behaviour can be attributed to TPB. This confirms the effectiveness of the framework’s approach in a wide variety of contexts. As Armitage and Christian (2003) call TPB “the most dominant model of attitude-behaviour relations” at present, it should also be suitable for researching investment decision making. However, in financial markets and investment behavioural research we could only find two studies – already mentioned in the beginning – that employed TPB as research framework. First is East (1993), researching decision-making for investing in certain shares and second is Hofmann et al. (2008) who applied different behavioural models, including TPB, to explain effects for variations in bidding behaviour within social responsibility investing. Therefore, in our context of investing in mutual funds the validity of the TPB has yet to be demonstrated. According to Ajzen (1991), attitudes, subjective norms and perceived behavioural control as main components of the TPB can predict intentions to perform certain behaviours with high accuracy. For deriving our hypotheses and research models, a more detailed view on these three antecedents of intention is necessary.
6 Sheeran (2002) reviewed several studies and found a mean correlation of .53 between intention and behaviour. 7 For an overview of applications see Ajzen (2001) or Ajzen (2010).

12
Subjective norm (SN) There are some situations where behaviour is not only depending on an attitude of the individual, but also on the expectation that others – like family and friends – have. Subjective norm refers to the perceived influence that these significant others have on a persons intentions and behaviour (Ajzen and Driver 1992b). It reflects the person’s perception whether most people who are important to him think that he should or should not perform the behaviour in question (Fishbein and Ajzen 1975). Thus, subjective norm is a function of beliefs about the expectations of important referent others (Ajzen and Fishbein 1974) and a persons motivation of complying with these. It is thus intended to measure the social influences of family and friends on a person’s behaviour. Subjective norm can be interpreted as a perceived social pressure to perform or not to perform the behaviour (Ajzen 1991, Beck and Ajzen 1991, Armitage and Connor 2001). Subjective norm is measured by self-assessment of statements, e.g. “most people who are important to me approve/disapprove of my engaging in this activity” and “most people who are important in my life think I should engage on this activity”. Results on significance of the relationship between subjective norm and intention differ among studies that have employed TPB as research framework. As also stated by Ramayah et al. (2008), some studies can not find a significant relationship between subjective norm and intention (e.g. Lewis et al. 2003), while the majority finds significant positive relationships (e.g. East 1993, Gumussoy and Calisir 2009, Jimmieson et al. (2008), Lin (2010), Schreurs et al. 2009, Jen-Ruei et al. 2006, Ramayah et al. 2009, Xiao and Wu 2006).8 Also see Manning (2009) for a meta-analysis on the effects of subjective norm. Intuitively, subjective norm should also be influential with regard to investment decision making. The more popular investing in financial products is within an individual’s peer group, the higher the likelihood of the individual to also invest in financial products. This relation has also been confirmed empirically in research on portfolio choice and stock market participation. Hong, Kubik and Stein (2004) find that social households – defined as those who interact with their neighbors or who attend church – are substantially more likely to invest in the stock market than non-social households. Brown et al. (2005) even quantify and find that a 10%- increase in equity market participation of the members of one’s community increases likelihood of an individual to buy stocks by 4%. Transferred to the context of mutual fund purchase willingness und intention, individuals are more likely to be willing and intending to buy mutual funds, if their peer group or family is also favouring and engaging in buying mutual funds. Thus, we formulate the following theses to be tested:
H1a: Subjective norms (SN) will influence private investor general willingness to purchase of mutual funds (WNG).
H1b: Subjective norms (SN) will influence private investor intention to purchase of mutual funds (INT).
8 For an overview of relations, also see Ajzen (2010) or Ramayah et al. (2009).

13
Attitude (ATT) Attitude in general is a disposition to act favourably ore unfavourably to an object, person, institution or event (Ajzen 1988, 1991). According to Ajzen (1985, 2006) it is the overall positive or negative evaluation of performing a certain behaviour. Overall evaluation consists of assessing two components. First is of an instrumental nature describing whether an action is valuable, harmful and important. The second has experiential quality reviewing whether behaviour is pleasant or enjoyable (Ajzen 2006). Intuitively and as described by Armitage and Connor (2001), generally the more positive the attitude towards a certain behaviour is, the stronger should be the individual’s intention to perform the behaviour. For measuring attitude toward the behaviour, the respondents are usually asked to evaluate the behaviour in question along several attributes on bipolar scales. The great majority of studies have confirmed that attitude does have a significant and positive impact on intention. For examples see East (1993), Schreurs et al. (2009), Cronan and Al-Rafee (2008), Gopi & Ramayah (2007), Jimmieson et al. (2008), Ramayah et al. (2008, 2009), Rhodes & Courneya (2003), Lin (2010), Van Dam and Heijden (2009), Fang, Shao and Lan (2009), Teo & Pok (2003), Xiao and Wu (2006).9 Just like for the subjective norm, also the attitude should be positively related to intentions with regard to investment decision making. The better the attitude on a certain financial product, the higher should be the likelihood of buying such product. This can be caused by numerous factors, such as positive experiences made and communicated by others – which could also indicate a link to subjective norms – positive own experiences or even through media coverage. Transferred to our research context, individuals are more likely to be willing and intending to invest in mutual funds, if they have a positive attitude towards buying those. We therefore formulate the following theses to be tested:
H2a: Attitude towards investing in mutual funds (ATT) will influence private investor general willingness to purchase of mutual funds (WNG).
H2b: Attitude towards investing in mutual funds (ATT) will influence private investor intention to purchase of mutual funds (INT).
Perceived behavioural control (PBC) Some behaviours do not only require a positive attitude and the perceived backing of social peer-group, but also skills and abilities (Ajzen 1991). Thus, perceived behavioural control was added to TRA as third determinant of intention to resolve critics and to cover incomplete volitional control. Ajzen (1988) defines the perceived behavioural control as “the perceived ease or difficulty of performing the behaviour and it is assumed to reflect past experience as well as anticipated impediments and obstacles” (Ajzen 1991, see also Ajzen and Driver 1992b). The construct of perceived behavioural control reflects beliefs regarding access to resources and fulfilment of requirements needed to perform a certain behaviour covering two components: firstly, controllability needed to engage in the behaviour, e.g. external constraints; secondly, the focal persons self-confidence or self-efficacy in the skills and
9 For an overview of relations, also see Ajzen (2010) or Ramayah et al. (2009).

14
ability to perform the behaviour in question, representing internal resources. Usually respondents are asked to questions such as “For me to engage in this activity, it is easy…”. Several studies in different contexts have empirically confirmed that perceived behavioural control relates to intention. For examples of TPB studies with positive influences see East (1993), Gummussoy and Calisir (2009), Jimmieson et al. (2008), Blanchard et al. (2008), Gopi & Ramayah (2007), Cronan and Al-Rafee (2008), Jen-Ruei et al. (2006), Ramayah et al. (2008, 2009), Fang, Shao and Lan (2009), Lin (2010), Van Dam and Heijden (2009), Teo & Pok (2003), Xiao and Wu (2006).10 According to Armitage and Connor (2001), introducing perceived behavioural control has in many studies improved prediction of intention. Intuitively, PBC will also have a positive influence on willingness and intentions in an investment decision making context. For engaging in financial markets and selecting financial products, a basic financial education and literacy is necessary. Low financial literacy however, as found in many studies, will deteriorate self-efficacy, resulting in lower likelihood of participation. This thought is in-line with research on financial literacy, portfolio choice and stock market participation. Christelis et al. (2006) find that cognitive abilities are strongly associated with decision to invest in stocks. Additionally, Bertraut (1998) and Cole and Shastry (2009) find that likelihood of stockholding increases amongst other factors with education and Rooij, Lusardi and Alessie (2007) confirm an independent effect of financial literacy on likelihood of participation in stock market. Thus, regarding the investment in mutual funds, perceived behavioural control should be positively related to willingness and intentions. With higher financial literacy, better understanding of mutual funds and higher self-confidence to be able to select mutual funds, willingness and intention of individuals will become more likely. We therefore formulate the following theses to be tested:
H3a: Perceptions of their ability to control investment in mutual funds (PBC) will influence private investor general willingness to purchase mutual funds (WNG)
H3b: Perceptions of their ability to control investment in mutual funds (PBC) will influence private investor intention to purchase mutual funds (INT)
To summarize, the application of the TPB in the context of mutual fund investing assumes the following behavioural basis: general willingness and intention to invest in mutual funds drive the actual purchase of mutual funds. Furthermore, individuals are more likely to be willing and intending to purchase mutual funds if their attitudes, social norm and perceived behavioural control are positive. Extending the TPB induced research hypotheses, we also include a test on the relationship between general willingness and intention. Intuitively, individuals with higher general willingness to purchase mutual funds will also more likely intend to purchase those, resulting in the following hypothesis to be tested:
H4: General willingness to purchase mutual funds (WNG) will influence concrete intention to invest in mutual funds (INT)
10 For an overview of relations, also see Ajzen (2010) or Ramayah et al. (2009).

15
Taken together, our hypotheses directly result from the postulated structure of the TPB and are summed up in Table I.
Table I: Overview of hypothesis H1a: Subjective norms (SN) will influence private investor general willingness (WNG) to purchase of mutual funds. H1b: Subjective norms (SN) will influence private investor intention (INT) to purchase of mutual funds. H2a: Attitude towards investing in mutual funds (ATT) will influence private investor general willingness (WNG) to purchase of mutual
funds. H2b: Attitude towards investing in mutual funds (ATT) will influence private investor intention (INT) to purchase of mutual funds. H3a: Perceptions of their ability to control investment in mutual funds (PBC) will influence private investor general willingness (WNG) to
purchase mutual funds H3b: Perceptions of their ability to control investment in mutual funds (PBC) will influence private investor intention (INT) to purchase
mutual funds H4: General willingness to purchase mutual funds will influence concrete intention to invest in mutual funds
Based on the explanatory notes on TPB above and stated hypotheses, three research models are developed for this study and visualized in Figure 2.
Figure 2: Research models Model 1:Structural model with willingness
Model 2:Structural model with intention
Model 3:Structural model with willingness and intention
SN
PBC
ATT WNG
H1a
H2a
H3a
SN
PBC
ATT INT
H1b
H2b
H3b
SN
PBC
ATT INTWNGH4
II. Methodology and data A. Procedure
Main objective is to analyze the determinants of general purchase willingness and intention and thus to gain further insight into mutual fund investor purchase decision making. We apply Theory of Planned Behaviour, a conceptual framework for relations between attitude and behavioural intentions, which has been used widely in various contexts of social science research. Though there is a broad body of literature on TPB, its application in mutual funds purchasing context forms a novel approach and thus required the combination of theoretical literature review with exploratory methods and qualitative pre-tests. In a first stage, we formulated research hypotheses and constructed the study questionnaire. Therefore, we firstly reviewed relevant literature, especially on household finance, behavioural finance and related puzzles, such as the stock market participation or active management. To gain better understanding of relations in order to formulate research model and hypotheses, we additionally used focus group discussion, as well as numerous individual

16
and expert interviews. We then constructed a questionnaire based on recommendations of Ajzen (2006) and previous TPB studies. We made several adjustments and modifications to fit our research context and to comply with findings from our preliminary works. Where possible we used existing measures – slightly modified to our research questions. For subjective norm (SN), attitude (ATT) and perceived behavioural control (PBC) we composed a pool of items and conducted a quantitative pre-test on the measures only. Through exploratory factor analysis (EFA) we identified the factors, which we then validated with confirmatory factor analysis (CFA). Thereafter, we asked 14 individuals to evaluate the questionnaire regarding processing time and especially on ease of understanding and clearness of the questions asked. Several minor adjustments were made to finalize the study questionnaire. In a second stage we collected the data. In order to avoid self-presentational biases and socially desirable responding, we used a self-administered online questionnaire. Additionally, several precautions were taken. Questionnaire instructions highlighted that participation was voluntary and that survey participants could stop at any time and finish the questionnaire later. Since the questionnaire also contained personal socioeconomic questions, it was made clear that data is collected for research purposes only and that results would not be passed on to a third party. In the third stage of analysis, we calculated and evaluated the research models. First, we conducted exploratory factor analysis (EFA) and confirmatory factor analysis (CFA) to again validate the measures with the complete final dataset and setup a well fitting measurement model. Secondly, we analyzed the data with commonly used covariance-based structural equation modelling software MPLUS for several reasons. As stated by Diamantopoulos and Siguaw (2000), Mueller (1996), Weiber and Mühlhaus (2009) and Nachtigall et al. (2003), it is appropriate to select structural equation modelling when components of the theoretical model, such as an attitude, are latent and have to be measured through a set of observed variables. Furthermore, using a set of observed variables to measure a construct increases the validity of the research model. To do so, structural equation models are able to estimate measurement and structural causal paths simultaneously, rather than one at a time sequentially. Another advantage of structural equation modelling is the ability to explicitly account for measurement error (Steenkamp and Baumgartner 1998, Homburg and Klarmann 2006). Measurement errors for observed variables are isolated and do not influence relations of structural model between independent and dependent constructs.11 At last, structural equation models deliver indices to describe the fit of the model to empirical data. As Bollen (1989) concludes, research models can thus be tested and also be rejected. The disadvantages of needed large samples and underlying distribution assumptions can be opted, since we have a large sample and also control for distribution within robustness check.12 For estimation, we elected covariance-based instead of variance-based approach for multiple reasons. First, it is an integrated approach, estimating parameters simultaneously based on 11 Regression analyses, for example, is based on the assumption, that the predictors are free of measurement error. If that is not the case in the data, regression weights typically underestimate the true effects. 12 Nachtigall et al. (2003) provide a brief overview on advantages and disadvantages of using SEM.

17
empirical variance-covariance-matrix rather than in multiple stages. Within covariance-based approach, estimation of relations in structural model only contains factor variance, while measurement errors of observed variables are not integrated. Secondly, the approach is appropriate for large samples. Finally, it furnishes expressive evaluative measures. As a consequence and thus most important in our context, covariance-based approach is most appropriate in research, in which well-established causal theories, such as TPB, are available and have to be validated with data. Within covariance-based approach, we use Maximum Likelihood (ML) for estimating the parameters, as it is the most widely used fitting function for general structural equation models, whose estimators are consistent and robust, unbiased in large samples and deliver various fit indices.13 Nonetheless an ML estimation assumes multivariate normal distribution for the underlying data, and we therefore also conducted a robustness check in order to validate the ML estimate.14 Though, as stated by Hooper et al. (2008), “structural equation modelling (SEM) has become the techniques of choice for researchers across disciplines and increasingly is a ‘must’ for researchers in the social sciences”, there is no broad consensus on the evaluation of how theoretical models reflect the data. Several indices exist for describing fit of measurement and structural models. As other researchers before, we followed the recommendation of Bollen (1990) to examine multiple indices of model fit. We based our selection on recommendations of Hu and Bentler (1995, 1999), Mueller (1996), Schermelleh-Engel et al. (2003) and Hooper et al. (2008). Thus, we use Wheaton et al.’s (1977) relative/normed chi-square (χ2/df) due to large sample size (cited in Hooper et al. 2008), the comparative fit index (CFI), the goodness-to-fit index (GFI), the nonnormed fit index (NNFI), as well as the root mean square error of approximation (RMSEA) and the standardised root mean square residual (SRMR). As the last stage in our analysis, we use alternative estimation methods as robustness check to account for several potential problems, such as underlying distribution functions (in case of non-multivariate distribution) or the influence of additional covariates. For the case that the underlying dataset does not follow a multivariate normal distribution, we use Robust Maximum Likelihood (MLR) employing the sandwich estimator for estimating standard errors (Caroll, Ruppert and Stefanski 1995). Additionally, we employ non-parametric bootstrap resampling (ML with bootstrap) based on Efron (1979) to derive robust estimation of standard errors. To check path coefficients, we also calculate regular multiple regression model. Therefore the indicator variables are summed up and used as predictors in the regression analysis. To further increase complexity of the models and to check for possible confounding variables, we included age, sex and a composite indicator for income/wealth as additional covariates in each of the models.
B. Data The sample used for analysis is a unique dataset drawn from a primary survey in December 2009. Over 20.000 potential participants from a panel database being representative for the German population were selected, contacted and asked for participation. Within the time span 13 See Nevit and Hancock (2001) for further information on bootstrapping and approaches to model test statistics and parameter standard error estimation in structural equation modelling. 14 Also see Nachtigall et al. (2003) on bootstrapping solutions if distributional assumptions are violated.

18
of the study from November 17 to December 8 2009, 2.130 (10.65%) followed the invitational link, viewed and actually started to answer the online questionnaire. From these, 236 participants have quitted or broken up the questionnaire during the answering session. Thus, 1.894 persons completed the questionnaire with an average processing time of 14 minutes and 42 seconds. Missing data led to the exclusion of 78 participants. In order to ensure and further increase data quality, we first evaluated total processing times and excluded outlier values in both directions. Then, we eliminated data records with implausible processing times on certain survey pages. In total, 221 participants were excluded due to missing data or implausible processing times. The final dataset used for analysis consisted of 1.673 participants. Average time of completion was 15 minutes and 16 seconds with a standard deviation of 8 minutes and 34 seconds. Table II summarizes key attributes of the dataset. Of the respondents included in the final sample, 49.2% were male and 50.8% female. The age ranged between 17 and 71 with an average of 39.8, a median of 39.0 and a standard deviation of 12.2. 18.7% have completed German Abitur (equivalent to the A-Levels/high school graduation), 27.2% have finished a vocational training and 30.4% have university degree or even a PhD-programme. At the time of the survey, about 78% of the participants were either employed or self-employed, only 7.4% were unemployed; the rest were either students or retired. With these characteristics, the dataset is representative for Germany. Further attributes of the dataset reveal high relevance for analysing the willingness and intentions to purchase mutual funds. About 66% of the participants ranged between 26 and 55 years, representing the phase of life, in which people work and build their wealth status. Furthermore, almost all of the participants are involved in the financial decision making of their household: either solely or with partner. Even more important is that investment potential is given: over 40% stated a wealth status of above 10.000 EUR and over 60% of participants stated to have more than 100 EUR for free disposal for savings every month. About 49% of the participants have never bought or owned mutual funds before, 12% had owned mutual funds but not anymore and about 39% of the participants actually held mutual funds. Potential biases in the dataset, e.g. resulting from using an online questionnaire are discussed later.
Table II: Description of dataset Attributes Sample (1.673)
Male 49,19% Gender Female 50,81% < 25 years 12,00% 26-35 years 27,10% 36-45 years 27,60% 46-55 years 22,20% > 55 years 11,00%
Age (Mean = 39,8; Median = 39,0)
n/a 0,30% Married 46,08% Not married, but living with a partner 25,76% Single / unmarried 19,78% Separated / divorced 6,81%
Marital status
Widowed 1,55% Yes 51,70% Children No 48,30%
Living status Living alone. 21,40%

19
Living in apartment-sharing community 3,29% Living with partner 41,30% Living in household with children 28,75% Living at parents house 5,26% No degree 0,54% Hauptschulabschluss (secondary school) 4,24% Realschulabschluss (secondary school) 18,77% Abitur (equivalent to A-levels / graduation) 18,71% Vocational training 27,20%
Highest educational degree
University degree / PhD 30,54% Yes, solely. 51,29% Yes, together with partner. 47,28%
Involvement in financial decision making
Not involved 1,43% Worker (blue-collar) 7,83% Employee (white-collar) 50,39% Public Services 7,77% Self-employed / freelancer 11,60% Retired 6,22% Student 8,79%
Employment status
Unemployed / welfare recipient 7,41% < 1.000 EUR 9,6% 1.000 - 2.000 EUR 25,5% 2.000 - 3.000 EUR 30,5% 3.000 - 4.000 EUR 20,7%
Monthly Household Net Income
< 4.000 EUR 13,7% < 100 EUR 37,5% 100 - 300 EUR 30,8% 300 - 500 EUR 14,7% 500 - 700 EUR 5,8% 700 - 1.000 EUR 4,5% > 1.000 EUR 5,8%
Monthly disposable for savings
n/a 0,8% < 5.000 EUR 39,39% 5.000 - 10.000 EUR 15,06% 10.000 - 25.000 EUR 15,06% 25.000 - 50.000 EUR 12,73% 50.000 – 250.000 EUR 13,27% > 250.000 EUR 2,33%
Wealth status
n/a 2,15% No / Never had 48,7% Currently not anymore 11,6% Mutual funds ownership Yes 39,7%
C. Measures
Most of TPB variables cannot be observed fully, but latently. As a result, we used multi-item scales with manifest indicator items to measure these TPB constructs. All indicator items were constructed along the Theory of Planned Behaviour and to ensure consistency, we followed recommendations of Ajzen (2002, 2006) on wording and suggested format. The self-report items measures were additionally retrieved from studies by Ajzen and other existing studies and modified to investment and mutual fund purchasing context. As recommended by Ajzen (2006) and applied to various own empirical studies (e.g. Ajzen and Driver 1992),15 most of the variables utilized a 7-point Likert scale (e.g. 1=strongly agree to 7=strongly disagree) to allow broader range of differentiation. For each of the independent and dependent variables within research model, we used several indicator items based on
15 For further reading on scale development, see Rossiter (2002).

20
TPB and qualitative pre-tests. As described above, with the final dataset, we first conducted exploratory factor analysis (EFA) to choose most fitting items for each constructs and then conducted confirmatory factor analysis (CFA) to identify and validate good measures for each of the research models components. Indicator item reliability is commonly considered adequate when it has a factor loading of 0.7 or above. As a result, some items had to be eliminated. Construct reliability is considered sufficient when composite reliability is 0.7 or above. All constructs are reliable by those criteria. Subjective Norm (SN) The subjective norm was measured with three items adapted from recommendation of Ajzen (2006). From a larger set of statements that respondents were asked to respond to, we conducted exploratory and confirmatory factor analysis to find best fitting factor. The final measure consisted of the questions: „most people that are important to me, invest in mutual funds theirselves“, „most people that are important to me, regard mutual funds as positive“ and „most people whose opinion I highly respect, would approve and recommend me to invest in mutual funds“. The average standardized item loading was 0.93 and Cronbachs alpha for this measure was 0.95. Table III provides an overview of the scale. Attitude (ATT) For measuring attitude, as most commonly used and recommended by Ajzen (2006, Ajzen and Driver 1992b) largely due to its ease of construction, we used a set of semantic differential questions. The set consisted of bipolar adjective pairs containing a negative evaluation the behaviour in question on one end and a positive evaluation on the other. As described above, overall evaluation of a behaviour contains two separable components. For the instrumental component sample bipolar items are “important-unimportant”, “valuable-worthless”, “harmful-beneficial” and for experiential quality sample items are “pleasant-unpleasant” or “enjoyable-unjoyable”. Furthermore, we selected further adjectives pairs based on qualitative pre-test and wordings of interviewed people. Since it was a new measure in our research context, we conducted EFA and CFA to identify most relevant items. For the final measure, we used respondents rating of investing in mutual funds along the adjective pairs „good-bad“, „important-unimportant“, “beneficial-not beneficial” and “pleasant-unpleasant”. The average standardized item loading onto the factor was 0.90 and reliability of scale was 0.945. Table III provides an overview of the scale. Perceived behavioural control (PBC) Again, the measure was also constructed based on recommendations of Ajzen (2006). Measure should capture people’s confidence that they are capable of performing the behaviour and the controllability of the behaviour. Furthermore we relied on the qualitative pre-test and wordings of interviewed people and set up an item-pool. Since it is a new measure in this context we conducted exploratory and confirmatory factor analysis to derive final measure. Finally, perceived behavioural control was measured with three items. First item regards respondents overall confidence and ability to engage in mutual funds investing. Since it might be one of the key hurdles to invest in mutual funds, we also included capability of selecting the right mutual funds. Finally, an item on understanding the development of mutual funds was contained, since focus groups revealed low understanding of price

21
movements of stock markets and mutual funds as potential hurdle. The average standardized item loading on perceived behavioural control was 0.93, while the reliability of the scale was also high with a Cronbach’s alpha of 0.946. Table III provides an overview of the scale. Since subjective norm, attitude and perceived behavioural control are three new measures, we conducted confirmatory factor analysis to verify the fit of the measures. Due to sample size, one-factor models were fully identified and no fit indices were generated. In consequence, we used a three-factor model – equal to the measurement model. The analysis shows a good fit: X2/df=2.3, Root Mean Square Error of Approximation (RMSEA) = 0.028, Standardized Root-Mean-Square Residual (SRMR) = 0.011, Comparative Fit Index (CFI) = 0.998, Non-Normed Fit Index (NNFI) = 0.997. The average standardized item loading onto each of the factors were as follows: subjective norm (SN) = 0.93, attitude (ATT) = 0.90, perceived behavioural control (PBC) = 0.93.
Table III: Overview of latent measures SN, ATT and PBC ITTC (Item
to Total Correlation)
Factor loading (EFA)
Standardized factor loading (unstandardized standard error)
Unstandardized t-value (p-value)
Cronbachs Alpha
CONSTRUCT SUBJECTIVE NORM (SN) SN 3 Most people that are important to me,
also invest in mutual funds themselves. 0.880 0.924 0.909 (0.000)
SN 4 Most people that are important to me, regard mutual funds as positive.
0.921 0.926 0.963 (0.015) 71.389 (0.000)
SN 5 Most people whose opinion I highly respect, would approve and recommend me to invest in mutual funds.
0.886 0.906 0.919 (0.017) 62.844 (0.000)
0.950
CONSTRUCT ATTITUDE (ATT) ATT SM 1 Good � Bad 0.894 0.923 0.933 (0.000) ATT SM 2 Important� Unimportant 0.856 0.871 0.889 (0.016) 60.399
(0.000) ATT SM 3 Pleasant � Unpleasant 0.846 0.886 0.874 (0.015) 57.549
(0.000) ATT SM 6 Beneficial � Not beneficial 0.879 0.924 0.909 (0.014) 64.396
(0.000)
0.945
CONSTRUCT PERCEIVED BEHAVIOURAL CONTROL (PBC) PBC FO 1 I feel very confident to be able to
engage in mutual funds investing. 0.878 0.911 0.940 (0.000)
PBC FO 2 I am capable of selecting mutual funds. 0.907 0.951 0.923 (0.018) 53.188 (0.000)
PBC FO 3 I understand and can easily follow the development of mutual funds.
0.878 0.912 0.940 (0.016) 61.368 (0.000)
0.946
Intention (INT) For measuring the intention to buy mutual funds, we asked respondents to self-assess several intention-oriented statements. From a larger set of statements, we conducted exploratory and confirmatory factor analysis to find best fitting factor. The final measure consisted of three questions: the probability of investment in mutual funds within 12 months and current plans to increase existing mutual fund investments. To also account for longer term intention beyond current overview on funds free for disposal, we asked for intention to purchase mutual funds as soon as there is money free for disposal. The average standardized item loading on perceived behavioural control was 0.87, while the reliability of the scale was also high with a Cronbach’s alpha of 0.95. Table IV provides an overview of the scale.

22
Table IV: Latent factor INT
CONSTRUCT INTENTION (INT) Item ITTC (Item to
Total Correlation)
Factor loading (EFA)
Standardized factor loading (unstandardized standard error)
Unstandardized t-value (p-value)
Cronbachs Alpha
INT 4 It is very likely, that I will invest in mutual funds within the next 12 months.
0.809 0.907 0.933 (0.000)
INT 5 I plan to extend investments in mutual funds in 2010.
0.773 0.842 0.805 (0.017) 51.384 (0.000)
INT 7 I intend to invest in mutual funds, as soon as I have money free for disposal..
0.761 0.813 0.871 (0.020) 45.125 (0.000)
0.950
Willingness (WNG) In order to not only cover pure intention, we included a statement on general willingness to purchase mutual funds. Respondents were asked the following question on a 7-point Likert scale: “Generally speaking, I can imagine to invest in mutual funds.” Further variables Given importance in prior research within investment decision making context, we also included the further measures for analysis. Participants were asked to give answers on socioeconomics, e.g. age, gender, education, marital status, household income and wealth (e.g. Cole and Shastry 2009, Guiso, Haliassos and Jappelli 2003, Bertraut 1998, Vissing-Jorgensen 2002). Furthermore, we asked for the employment status and risk of a job loss (Heaton and Lucas 2000), risk or loss aversion (e.g. Barsky et al. 1997, Ang et al. 2005 or Dimmock and Kouwenberg 2008), trust (e.g. Guiso, Sapienza and Zingales 2008) and whether recent financial crisis has effected the respondent. For further analysis, we also included answers on ownership, knowledge and experience with mutual funds and market expectations.
III. Results A. Descriptive statistics
Participants show low financial literacy with only 28.1% of participants stating to have good financial knowledge and only 30.2% assessing their knowledge on investment decisions as good. Despite this fact, participants demonstrate high self-efficacy, with about half of respondents being able to plan and implement their financial affairs solely. About 49% of the participants have never bought or owned mutual funds before, 12% had owned mutual funds but not anymore and about 39% of the participants actually held mutual funds. From those, only 40% have personally made positive experience. The levels of trust in financial system and regarding financial advisors are with 17% and 14.6% very low. Means, standard deviations, and bivariate correlations among the observed variables for our research model are reported in Table V. The table shows significant correlations between the indicator variables of the TPB constructs. Due to these expected high correlations and to avoid common problem of multi-collinearity, we use structural equation models and form composite indicators (factor scores) for the regression model for robustness check.

23
Table V: Means, standard deviations and correlations
Bivariate correlations (Pearson)
Variable Mean SD Sex Age SN 3 SN 4 SN 5 ATT
SM 1 ATT SM 2
ATT SM 3
ATT SM 6
PBC Fo 1
PBC Fo 2
PBC Fo 3
WNG 1
INT 4 INT 5 INT 7
Sex 1,508 0,500 1 -0,047 ,106** ,111** ,112** ,096** ,080** ,059* ,066** ,239** ,233** ,216** ,119** ,153** ,140** ,130**
Age 39,842 12,193 1 0 0,034 ,053* 0,04 0,002 0,008 ,061* -0,04 -0,023 -0,022 ,127** ,055* ,090** ,064**
SN 3 5,087 1,723 1 ,877** ,832** ,577** ,565** ,516** ,536** ,548** ,536** ,547** ,539** ,613** ,565** ,568**
SN 4 4,747 1,767 1 ,885** ,624** ,595** ,553** ,584** ,551** ,541** ,565** ,615** ,637** ,573** ,628**
SN 5 4,762 1,815 1 ,617** ,594** ,558** ,584** ,535** ,526** ,541** ,603** ,626** ,564** ,609**
ATT SM 1 3,619 1,645 1 ,829** ,815** ,847** ,548** ,531** ,527** ,768** ,677** ,547** ,678**
ATT SM 2 3,922 1,629 1 ,771** ,810** ,529** ,515** ,503** ,688** ,657** ,547** ,622**
ATT SM 3 3,712 1,530 1 ,802** ,511** ,500** ,492** ,683** ,593** ,489** ,612**
ATT SM 6 3,641 1,565 1 ,512** ,506** ,504** ,736** ,635** ,513** ,628**
PBC Fo 1 4,231 1,917 1 ,867** ,830** ,576** ,623** ,553** ,534**
PBC Fo 2 4,297 1,879 1 ,868** ,562** ,607** ,553** ,525**
PBC Fo 3 4,310 1,906 1 ,565** ,606** ,542** ,534**
WNG 1 3,399 1,962 1 ,735** ,565** ,719**
INT 4 4,582 2,110 1 ,753** ,735**
INT 5 5,330 1,752 1 ,686**
INT 7 4,448 2,025 1
**. Correlation on 0,01 (2-seitig) significant.
*. Correltaion on 0,05 (2-seitig) significant..
B. Model fits
As described in Section II, we use Wheaton et al.’s (1977) relative/normed chi-square (χ2/df) due to large sample size (as stated in Hooper et al. 2008), the comparative fit index (CFI), the goodness-to-fit index (GFI), the nonnormed fit index (NNFI), as well as the root mean square error of approximation (RMSEA) and the standardised root mean square residual (SRMR) for evaluation of model fit. Table VI summarizes selected fit indices on the measurement model and the three structural models.
Table VI: Model fit indices MODEL χ2 p-Value df χ2 / df CFI NNFI RMSEA SRMR
Measurement model CFA (3 TPB components) 72.389 < .001 31 2.335 0.998 0.997 0.028 0.011
Model 1: Structural model with willingness (WNG) 131.914 < .001 36 3.664 0.995 0.993 0.040 0.011 Model 2: Structural model with intention (INT) 196.258 < .001 55 3.568 0.994 0.991 0.039 0.016 Model 3: Structural model with willingness (WNG) and intention (INT)
312.795 < .001 64 4.887 0.990 0.986 0.048 0.019
For relative/normed chi-square (χ2/df) recommended values for describing a good fit range from 5.0 to as low as 2.0.16 Especially for large samples, higher relative indices are acceptable. The measurement model as well as the first two structural models show values up to 3.6 and thus good fits. With a value of 4.8, model 3 – combining intention and willingness – is still acceptable, but not as well fitting as model 1 and 2. For root mean square error of 16 Hooper et al. (2008) provide an overview of cut-off values including Wheaton et al. (1977) and Tabachnick and Fidell (2007).

24
approximation (RMSEA), Steiger and Lind (cited in Steiger 1990 and Hooper et al. 2008) recommend cut-off values close to 0.06, or 0.08. For SRMR, Hu and Bentler (1999) suggest values below 0.09 and for GFI and incremental fit indices CFI and NNFI values should be above 0.95. All tested models show values within recommended ranges and thus have very good fits. Table VII provides an overview of the measurement model including unstandardized and standardized factor loadings for each TPB measure. Average standardized factor loadings were 0.92. Average standardized item loading onto subjective norm (SN), attitude (ATT) and perceived behavioural control (PBC) were 0.93, 0.90 and 0.93. Composite reliabilities (Cronbachs Alpha) were 0.950, 0.945 and 0.946.
Table VII: Measurement model PREDICTOR Item Factor loading
(standard error) t-valuea Standardized factor
loading SN 3 1.000 0.909 SN 4 1.087 (0.015) 71.389 0.963
SN
SN 5 1.065 (0.017) 62.844 0.919 ATT SM 1 1.000 0.933 ATT SM 2 0.943 (0.016) 60.399 0.889 ATT SM 3 0.870 (0.015) 57.549 0.874
ATT
ATT SM 6 0.927 (0.014) 64.396 0.909 PBC FO 1 1.000 0.940 PBC FO 2 0.962 (0.018) 53.188 0.923
PBC
PBC FO 3 0.994 (0.016) 61.368 0.940 a all values significant on p < 0.001
C. Research hypothesis testing Results, including path coefficients (standardized), standard errors and t-value (unstandardized) obtained from the structural equation models are presented in Table VIII.
Table VIII: Structural models Willingness (WNG) Intention (INT) MODEL PREDICTOR
Standardized Estimate
S.E. 1 t-value2 Standardized Estimate
S.E. 1 t-value2
SN 0.096 0.029 4.192
ATT 0.640 0.030 26.942
Model 1: Structural model with willingness (WNG)
PBC 0.158 0.022 7.667
SN 0.275 0.029 11.909
ATT 0.433 0.030 18.290
Model 2: Structural model with intention (INT)
PBC 0.255 0.023 11.949
SN 0.105 0.030 4.530 0.235 0.028 10.921
ATT 0.633 0.029 27.382 0.198 0.034 7.555
PBC 0.158 0.022 7.755 0.181 0.022 9.224
Model 3: Structural model with willingness (WNG) and intention (INT)
WNG 0.364 0.025 15.005
1 Unstandardized Standard Error 2 Unstandardized t-value, all values significant on p < 0.001
The full structural models produced a strong data fit. All standardized estimates are positive and significant on p<0.001 and thus have an influence on the dependent variables willingness (WNG) or intention (INT). The results support our model and the associated hypotheses based on TPB. To gain a better overview of relations between TPB variables, willingness and

25
intentions, results on the three research models as well as on the measurement model are visualized in Figure 3.
Figure 3: Path models for the structural model (standardized coefficients) for the four tested models: a) CFA model for the three predictors; b) Structural model with willingness;
c) Structural model with intention; d) complete model with both dependent variables. a) Measurement model CFA (3 TPB components) b) Model 1: Structural model with willingness (WNG)
SN
PBC
ATT
0.686 (0.077)
0.610 (0.084)
0.622 (0.087)
SN
PBC
ATT WNG
0.096(0.029)
0.640(0.030)
0.158(0.022)
0.687(0.077)
0.609(0.085)
0.621(0.087)
R2 = 0.669
Standardized coefficients (unstandardized standard error) all values significant on p < 0.001
Standardized coefficients (unstandardized standard error) all values significant on p < 0.001
c) Model 2: Structural model with intention (INT) d) Model 3: Structural model with willingness (WNG) and intention (INT)
SN
PBC
ATT INT
0.275(0.029)
0.433(0.030)
0.255(0.023)
0.685 (0.078)
0.606 (0.085)
0.622 (0.087)
R2 = 0.712
SN
PBC
ATT INTWNG
0.105 (0.030)
0.633 (0.029)
0.158(0.022)
0.689(0.077)
0.606(0.084)
0.625(0.087)
0.364 (0.025)
0.181(0.022)
0.235 (0.028)
0.198(0.034)
R2 = 0.670R2 = 0.726
Standardized coefficients (unstandardized standard error) all values significant on p < 0.001
Standardized coefficients (unstandardized standard error) all values significant on p < 0.001
Both, measurement model as well as the structural models indicate high correlations between the three TPB constructs. This is in line with findings of applications of TPB in other fields and simple to be explained. Individuals might have a more positive attitude towards investing in mutual funds once his personal environment shows a positive attitude and approves this kind of investment. Family and friends apparently have an influence on shaping the individuals’ attitude, as well as the other way around. Also once an individual perceives to have good understanding and control over investing in mutual funds, he might as well have a more positive attitude on mutual funds investing. Determinants of Willingness Based upon results in structural model 1 in Table VIII and visualized in Figure 3, support was found for hypotheses H1a, H2a and H3a, which relate the TPB constructs to willingness. These hypotheses predict a positive relationship between the predictors subjective norm, attitude and perceived behavioural control onto the willingness to purchase mutual funds. Results indicate that 67% of variance in the general willingness to invest in mutual funds can be explained by all three TPB determinants. All standardized path coefficients are positive and significant. However, not all of the TPB constructs are equally important. By far the most significant and strongest predictor of general willingness to purchase mutual funds in the

26
structural equation model was the attitude, which shows a path coefficient of 0.64. This is consistent with a simple story: the better and more positive an individuals evaluates investing in mutual funds, the more likely will he be willing to actually invest in mutual funds. Second strongest predictor for general willingness, being still significant, was the perceived behavioural control with a path coefficient of 0.158. Feeling in control and being able to make the right decisions also has an influence on individuals’ willingness to investing in mutual funds. The influence of subjective norm on the general willingness is still positive, but with 0.096 rather small compared to the attitude and perceived behaviour control. Determinants of Intention Hypotheses H1b, H2b and H3b predict a positive relationship between the predictors subjective norm, attitude and perceived behavioural control onto the concrete intention to purchase mutual funds. Results for structural model 2 regarding the purchase intention as in Table VIII and visualized in Figure 3, indicate support for these hypotheses. For the intention, the variance explained by all three TPB determinants is 71% and thus even higher than for general willingness. In terms of impact, attitude again was most influential followed by subjective norm and perceived behavioural control. Again, this is in line with many TPB studies, in which the attitude variable has shown strongest relationships with measured intention. However, path coefficients of the three TPB determinants for the intention – ranging from 0.25 (PBC) to 0.43 (attitude) – are much closer to each other than for general willingness. In consequence, for the concrete intention to invest in mutual funds, attitudes and opinions communicated by friends or family members are more important than just for the willingness to purchase mutual funds. Same applies for the behavioural control. Determinants of Willingness and Intention Structural model 3 combines models 1 and 2 within one model and includes hypothesis H4, which predicts a mediating relationship between general willingness and intention. Path coefficients in model 3 as in Table VIII and visualized in Figure 3 are all positive and significant and indicate support for hypotheses H1a/b, H2a/b and H3a/b and H4. TPB variables explained 67.0% of the variance in willingness and if all taken together, results indicate that 72.6% of mutual fund purchase intention can be explained. Similar to model 1, quantitative results indicate that attitude is associated closest with purchase willingness. For intention general willingness to purchase mutual funds is strongest predictor, followed by subjective norm and perceived behavioural control. Summarizing comparisons All three structural models produced a strong data fit with significant and positive path coefficients. Variance in dependent variables can be explained to a large extent. Thus, TPB can be confirmed in this context and can serve as a basis model for research in this field. Furthermore, based upon results, support was found for all hypotheses analyzed. The three TPB variables attitude, subjective norm and perceived behavioural control have positive coefficients and are quantitatively associated with general willingness and concrete intention to purchase mutual funds. However, absolute influential weights differ between willingness and intention. Regarding impact, attitude has produced strongest relationships especially on general willingness. This finding is in line with many studies TPB, where attitude variable

27
has shown strongest relationships with intention. Subjective norm has a visibly smaller impact on general willingness than for intention. So when it comes to actually intending to purchase mutual funds, family and friends play a larger role. Perceived behavioural control influences both – willingness and intention, but for intention to a lower extent than subjective norm. To sum up, we provide an overview of the results on tested hypotheses in Table IX.
Table IX: Summary of the Tests of Hypotheses
Hp Path Specification Standardized path coefficient
S.E. (un-standardized)
Hp Support
H1a: Subjective norms (SN) will influence private investor general willingness (WNG) to purchase of mutual funds.
0.096 0.029 Support / not reject
H1b: Subjective norms (SN) will influence private investor intention (INT) to purchase of mutual funds.
0.275 0.030 Support / not reject
H2a: Attitude towards investing in mutual funds (ATT) will influence private investor general willingness (WNG) to purchase of mutual funds.
0.640 0.030 Support / not reject
H2b: Attitude towards investing in mutual funds (ATT) will influence private investor intention (INT) to purchase of mutual funds.
0.433 0.030 Support / not reject
H3a: Perceptions of their ability to control investment in mutual funds (PBC) will influence private investor general willingness (WNG) to purchase mutual funds
0.158 0.022 Support / not reject
H3b: Perceptions of their ability to control investment in mutual funds (PBC) will influence private investor intention (INT) to purchase mutual funds
0.255 0.023 Support / not reject
H4: General willingness to purchase mutual funds will influence concrete intention to invest in mutual funds
0.364 0.025 Support / not reject
D. Robustness checks
As described before, we employed alternative estimation methods to check for robustness of research structural models. To account for potentially non-multivariate normal distributed variables, we use robust maximum likelihood (MLR) and maximum likelihood with non-parametric bootstrap (ML with bootstrap). To check path coefficients we alternatively use regression model. Furthermore, we included income, age and sex as additional covariates in the models. Results from robustness checks, including estimates, standardized estimates and standard error are listed in Table X.
Table X: Overview structural models for willingness (WNG) and intention (INT) including covariates
Willingness (WNG)
ML / MLR / ML with Bootstrap1 ML MLR ML with Bootstrap Regression
PREDICTOR Estimate Standard. Estimate S.E: Estimate Standard. Estimate S.E:
SN 0.101 0.081 0.028* 0.028* 0.029* 0.043 0.110 0.008*
ATT 0.812 0.643 0.030* 0.030* 0.029* 0.197 0.592 0.007*
PBC 0.153 0.140 0.024* 0.026* 0.025* 0.061 0.167 0.007*
INCOME -0.081 -0.065 0.023* 0.023* 0.023* -0.015 -0.050 0.005*
AGE 0.019 0.117 0.002* 0.002* 0.003* 0.019 0.119 0.002*
SEX 0.034 0.009 0.059 0.059 0.056 0.052 0.013 0.059
R2 68.4% 65.5%
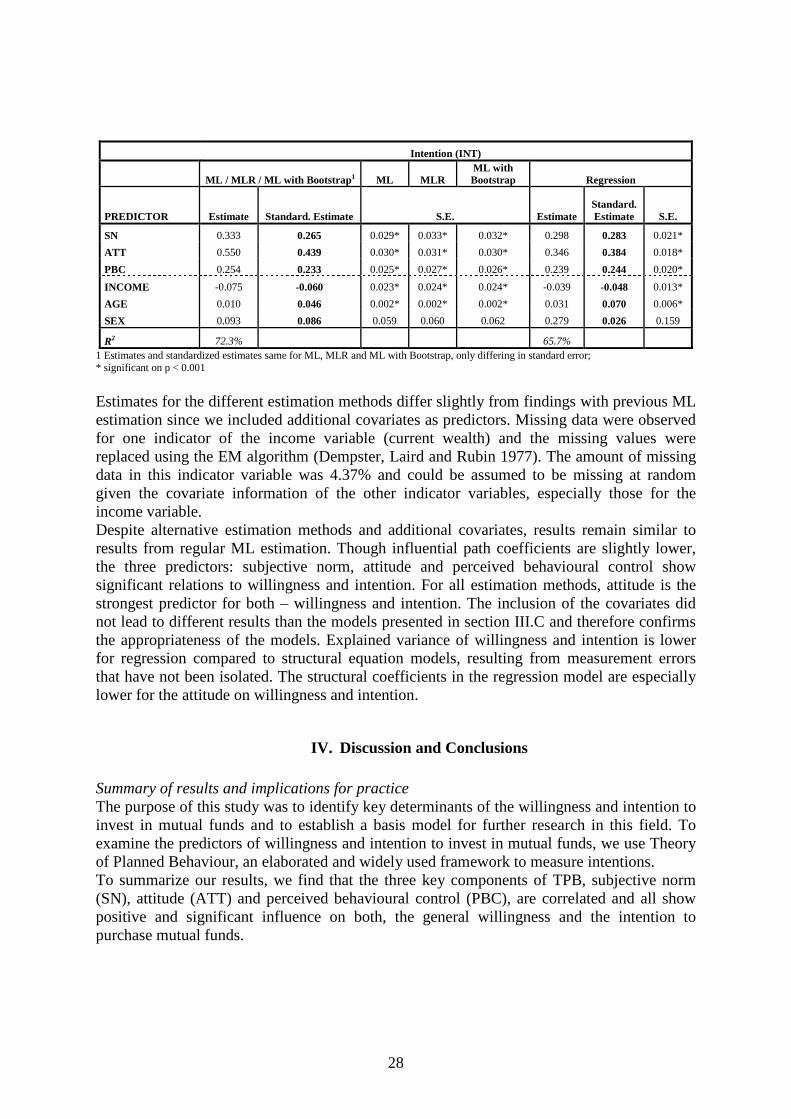
28
Intention (INT)
ML / MLR / ML with Bootstrap1 ML MLR ML with Bootstrap Regression
PREDICTOR Estimate Standard. Estimate S.E. Estimate Standard. Estimate S.E.
SN 0.333 0.265 0.029* 0.033* 0.032* 0.298 0.283 0.021*
ATT 0.550 0.439 0.030* 0.031* 0.030* 0.346 0.384 0.018*
PBC 0.254 0.233 0.025* 0.027* 0.026* 0.239 0.244 0.020*
INCOME -0.075 -0.060 0.023* 0.024* 0.024* -0.039 -0.048 0.013*
AGE 0.010 0.046 0.002* 0.002* 0.002* 0.031 0.070 0.006*
SEX 0.093 0.086 0.059 0.060 0.062 0.279 0.026 0.159
R2 72.3% 65.7% 1 Estimates and standardized estimates same for ML, MLR and ML with Bootstrap, only differing in standard error; * significant on p < 0.001
Estimates for the different estimation methods differ slightly from findings with previous ML estimation since we included additional covariates as predictors. Missing data were observed for one indicator of the income variable (current wealth) and the missing values were replaced using the EM algorithm (Dempster, Laird and Rubin 1977). The amount of missing data in this indicator variable was 4.37% and could be assumed to be missing at random given the covariate information of the other indicator variables, especially those for the income variable. Despite alternative estimation methods and additional covariates, results remain similar to results from regular ML estimation. Though influential path coefficients are slightly lower, the three predictors: subjective norm, attitude and perceived behavioural control show significant relations to willingness and intention. For all estimation methods, attitude is the strongest predictor for both – willingness and intention. The inclusion of the covariates did not lead to different results than the models presented in section III.C and therefore confirms the appropriateness of the models. Explained variance of willingness and intention is lower for regression compared to structural equation models, resulting from measurement errors that have not been isolated. The structural coefficients in the regression model are especially lower for the attitude on willingness and intention.
IV. Discussion and Conclusions Summary of results and implications for practice The purpose of this study was to identify key determinants of the willingness and intention to invest in mutual funds and to establish a basis model for further research in this field. To examine the predictors of willingness and intention to invest in mutual funds, we use Theory of Planned Behaviour, an elaborated and widely used framework to measure intentions. To summarize our results, we find that the three key components of TPB, subjective norm (SN), attitude (ATT) and perceived behavioural control (PBC), are correlated and all show positive and significant influence on both, the general willingness and the intention to purchase mutual funds.

29
These three results are each simple to understand. Once an individual has a positive attitude towards investing in mutual funds, he will also be more willing to purchase mutual funds in general. Thus, probability to actually intending or planning to purchase mutual funds will be higher. Same effect applies for his social environment, since especially family and friends have an impact on his thoughts and behaviour. Once family and friends inherit and communicate a rather negative or sceptical view towards mutual funds, the individual will probably also be more critical and might adjust his willingness or intention to purchase mutual funds. This link also explains high correlations found between subjective norm and attitude, as individuals will adjust their attitude based on communicated attitudes of their social environment. The third result addresses a common opinion, that investing in mutual funds belongs to the complex financial matters, that most people do not feel comfortable or literate enough with. General willingness and especially plans to invest in mutual funds will be lower for individuals that have low conviction and self-efficacy to make the appropriate financial decisions and to select the right mutual funds compared to individuals that fully trust in their abilities. Again, the link to attitude is obvious: once an individual perceives himself in control of the financial decisions and able to select the right mutual funds, he will likely feel more comfortable with investing and have a more positive attitude on this activity. These results reveal insight into the complex decision making framework of potential mutual funds buyers and thus propose some implications for practice, as mutual funds purchasing is crucial for growth and success of asset managers worldwide. In general, it becomes necessary to establish a positive attitude and perception towards mutual funds within the target group. This need weighs even stronger in combination with social interaction of potential target group, since positive attitudes are shared with peers, friends or family and those also have influential effects on purchasing behaviours. Campaigns targeting an improvement of attitude and generation of positive associations can set the basis. Furthermore, financial literacy and thus the abilities to handle investments in mutual funds have to be developed to further increase behavioural control and thus a positive gut feeling associated with it. Both, the creation of a broader positive awareness as well as an improved knowledge on mutual funds investing, would positively influence the willingness and intention to buy mutual funds. This is a crucial requirement, that industry associations in the different countries and regions, as well as mutual funds companies should target directly. Strengths of approach and contribution to literature This study’s approach shows some major strengths and contributes in several ways to academic literature. With the Theory of Planned Behaviour (TPB), we have employed a very strong theoretical model to predict behavioural intentions. It has been applied and validated in various fields of researching intentions over the past decades. Furthermore, we used a unique and highly appropriate dataset for analysis. The sample is sufficiently large and representative, serving well as basis for the research design. The combination of theoretical research framework and dataset produced a very strong data fit with high explanatory power. Results supported our model based on TPB and proved its validity as explanatory frame in this research context.

30
Altogether, as proposed by Keswani and Stolin (2008), this paper adds insights into mutual fund investor behaviour in context of portfolio choice and adds to a better understanding of what factors drive participation in capital markets via mutual funds. Within this field of researching private households’ financial participation, we have used a novel approach by applying the well established Theory of Planned Behaviour to mutual funds purchasing decision. Since we could confirm the TPB model and found good results, we also have given support to it to assist as basis model for further research in this field. Additionally, as Theory of Planned Behaviour is a theoretical framework originating in psychology, this paper further continues the trend of the linkage of finance and psychological research, known as behavioural finance literature. Furthermore, with our approach we also extended and specified literature around portfolio choice, household finance and stock market participation puzzle to focus mutual funds in general. This is of great importance as mutual funds are even more relevant for private investors with low sophistication than actually participating directly via stocks. Next to the contribution to literature through the application of TPB as model and extending portfolio choice to mutual funds, we can also confirm empirical findings in TPB as well as related researches that use other methodological approaches – especially on stock market participation. Our findings of social environment, especially family and friends, influencing purchase willingness and intention is in line with East (1993), Brown and Taylor (2010), Brown et al. (2005) and Hong, Kubik and Stein (2004), who find that subjective norm, “neighbourhood” or “social interaction” have an effect on buying shares. Same applies to our findings that the perceived behavioural control resulting from knowledge and ability to invest relates to intention. This is in line with Bertraut (1998) or Cole and Shastry (2009) who find that likelihood of stockholding increases with education, Rooij, Lusardi and Alessie (2007) who confirm an independent effect of financial literacy on likelihood of participation in stock market and Christelis et al. (2006) who find that cognitive abilities are strongly associated with the decision to invest in stocks. Limitations and outlook for further research Just like for other studies, this one is not without limitations either. First of all, we cannot draw any conclusions on actual mutual funds purchasing and thus have no measurement of the direct link between the intention to invest in mutual funds and the actual behaviour. It remains open, how this link is and whether additional influential or mediating factors are relevant. Furthermore, it is obvious that Theory of Planned Behaviour is a model with low complexity by focussing on three main predictors. There might well be other covariates or factors influencing the willingness and intention, such as trust, personal experience or risk awareness. Additionally, there are three potential biases within the analysis that should be mentioned, but cannot be accounted for or corrected explicitly. One potential bias results from recent financial crisis, that occurred prior to survey period and might have caused changes in attitudes, control beliefs and especially willingness and intention to invest in mutual funds. Participants could have a positive attitude towards mutual funds or even feel able to make the right financial decisions, but still have low willingness and intention to invest in mutual funds because media coverage has influenced them negatively.
31
Another bias results from collecting data via online questionnaire. Thereby, population parts that do not use the internet are underrepresented in the dataset. Based on common market research, this especially applies to the group of elderly or at least of advanced age. Since this group typically has greater wealth on average and thus forms a major target group for mutual funds, it might have an effect on results. However, this effect may be offset by the third potential bias resulting from nature of mutual funds business. As described in Section I, most important distribution channel for mutual funds in Germany are banks and their advisors. Thus, it is not unusual, that bank advisors give the recommendation to purchase mutual funds, even if the private investor does not have the relevant background. Thus, individuals, that majorly rely on their bank advisors and follow their advice, might be willing or intending to purchase mutual funds even if their social environment would disapprove, they do not have a positive attitude or do not feel in control of selecting the right mutual funds. However, this bias might not be too severe for two reasons: First, the advice of advisors will probably more affect the actual purchase behaviour than the intention to do so. Furthermore, commonly it is the group of elderly that strongly relies and trusts in their bank advisors, for which the bias would be stronger. Those however, might be underrepresented in our dataset due to using online questionnaire as described before. Therefore, the previous two mentioned biases may offset each other. This study opened a few different avenues for future research and provides a foundation for expanding literature on three aspects. First, to gain more insight into the framework for decision making and building of the purchase intention, relations and explanations within the TPB model should be further analyzed. Interesting in this context remains the identification of determinants of the attitude and perceived behavioural control as key influencing factor to willingness and intention. Several determinants, such as past experience, trust, education or socio demographics, can be thought of being related. Furthermore, it might be worth – as done in other TPB studies – to analyze interaction effects or moderating roles of additional variables onto the linear relation of TPB components and intention. Especially the availability of income and wealth, as well as other factors such as reliance on financial advisors, trust, evaluation of market development or risk awareness might influence or mediate the identified relations. At last, it remains open, whether found paths are of linear nature or whether there exists non-linearity. It might be worth to better understand, whether the impact of the attitude on willingness and intention is greater for very positive attitudes than for very negative attitudes. Secondly, to further validate and understand mutual funds purchases, cohesion between intention and actual mutual funds purchase should be analyzed. There might as well be interaction effects within this relation. This analysis, however, requires a complex dataset consisting of both individuals’ questionnaire and portfolio data. Thirdly, findings on attitude, subjective norm and intentions to purchase mutual funds raise the questions, whether population can be separated into certain segments or clusters and whether there are different types of mutual funds buyers. Especially from a practical perspective, it is worth knowing, who it is, that has a positive attitude and thus willingness and intention to invest in mutual funds and how those potential buyers cluster along socio demographics, such as sex, age, income or investment related preferences, such as risk awareness and return expectations.

32
REFERENCES
Ajzen, I.: From intentions to actions: A theory of planned behavior. In J. Kuhl & J. Beckman (Eds.), Action-control: From cognition to behavior (pp. 11-39). Heidelberg: Springer (1985).
Ajzen, I.: Attitudes, personality and behavior. Chicago: Dorsey Press (1988).
Ajzen, I.: The theory of planned behavior. Organizational Behavior and Human Decision Processes, 50, 179-211 (1991).
Ajzen, I.: Nature and operation of attitudes. Annual Review of Psychology, 52, 27-58 (2001).
Ajzen, I.: Perceived behavioral control, self-efficacy, locus of control, and the theory of planned behavior. Journal of Applied Social Psychology, 32, 665-683 (2002).
Ajzen, I.: Constructing a TpB Questionnaire. Conceptual and Methodological Considerations, www.people.umass.edu/aizen/pdf/ tpb.measurement.pdf [24.09.2007] (2006).
Ajzen, I.: http://www.people.umass.edu/aizen/tpbrefs.html; accessed: July 2010 (2010).
Ajzen, I., Driver, B. L.: Application of the theory of planned behavior to leisure choice. Journal of Leisure Research, 24, 207- 224 (1992).
Ajzen, I., Driver, B. L.: Contingent Value Measurement: On the Nature and Meaning of Willingness to Pay, Journal of consumer psychology 1(4), 297-316 (1992).
Ajzen, I., Fishbein, M.: Factors influencing intentinos and the intention-behavior relation, Human Relations 27(1), 1 (1974).
Ajzen, I., Fishbein, M.: Attitude-behaior relations: A theoretical analysis and review of empirical research. Psychological Bulletin, 84, 888-918 (1977).
Ajzen, I., Fishbein, M.: Understanding Attitudes and Predicting Social Behavior, Englewood Cliffs (1980).
Alexander, G. Jones, J., Nigro, P.: Mutual fund shareholders: characteristics, investor knowledge, and sources of information, Financial Services Review, 7, issue 4, p. 301-316 (1998).
Anderson, S. C., Schnusenberg, O.: A review of studies in mutual fund performance, timing, and persistence, Working Paper (2005).
Ang, A., Geert, B., Liu, J.: Why stocks may disappoint, Journal of Financial Economics 76, 471-508 (2005).
Armitage, C.J., Christian, J.: From Attitudes to Behaviour: Basic and Applied Research on the Theory of Planned Behaviour, Current Psychology: Development, Learning, Personality, Social. Vol. 22, No. 3, pp. 187-195 (2003)
Armitage, C. J., Conner, M.: Efficacy of the theory of planned behaviour: A meta-analytic review. British Journal of Social Psychology, 40, 471 - 499 (2001).
33
Bailey, W., Kumar, A., Ng, D.: Behavioral Biases and Mutual Fund Clienteles, Working Paper, Cornell University (2009).
Barber, B., Odean, T., Zheng, L.: Out of sight, out of mind: the effects of expenses on mutual fund flows, Journal of Business, Vol. 78, pp. 2095–2120 (2005).
Barberis, N., Huang, M., Thaler, R.H.: Individual Preferences, Monetary Gambles, and Stock Market Participation: A Case for Narrow Framing, American Economic Review, American Economic Association, vol. 96(4), pages 1069-1090 (2006).
Barsky, R.B., Juster, F.T., Kimball, M.S., Shapiro, M.D.: Preference Parameters and Behavioral Heterogeneity: An Experimental Approach in the Health and Retirement Study, Quarterly Journal of Economics, 537–579 (1997).
Beck, L., Ajzen, I.: Predicting dishonest actions using the theory of planned behavior. Journal of Research in Personality, 25, 285-301 (1991).
Ber, S., Kempf, A., Ruenzi, S.: Determinanten Der Mittelzuflüsse Bei Deutschen Aktienfonds, Schmalenbachs Zeitschrift für betriebswirtschaftliche Forschung, Vol. 59, No. 2, pp. 35-60 (2007).
Bergstresser, D., Poterba, J.: Do after-tax returns affect mutual fund inflows? Journal of Financial Economics 63, 381-414 (2002).
Bertaut, C.C.: Stockholding Behavior Of U.S. Households: Evidence From The 1983-1989 Survey Of Consumer Finances, The Review of Economics and Statistics, MIT Press, vol. 80(2), pages 263-275, May (1998).
Blanchard, C., Fisher, J., Sparling, P., Nehl, E.: Understanding physical activity behavior in African American and Caucasian college students: An application of the Theory of Planned Behavior. Journal of American College Health, 56(4), 341-347 (2008).
Bogan, V.: Stock Market Participation and the Internet. Journal of Financial and Quantitative Analysis, 43, pp 191-211 (2008).
Bogle, J.C.: Selecting equity mutual funds, The Journal of Portfolio Management, Vol. 18, No. 2: pp. 94-100 (1992)
Bollen, K.A.: Structural Equation Models with Latent Variables, New York (1989).
Bollen, K.A.: Overall fit in covariance structure models: Two types of sample size effects. Psychological Bulletin, 107, 256−259 (1990).
Brown, S., Taylor, T.: Social Interaction and Stock Market Participation: Evidence from British Panel Data, Discussion Paper No. 4886 (2010).
Brown, J.R., Ivković, Z., Smith, P.A., Weisbenner, S.: Neighbors matter: Causal community effects and stock market participation, Journal of Finance 63, 1509-1531 (2005).
Campbell, J.: Household finance, Journal of Finance 61, 1553-1604 (2006).
Capon, N., Fitzsimmons, G., Prince, R.: An individual level analysis of the mutual fund investment decision, Journal of Financial Services Research 10, 59–82 (1996).
34
Carhart, M.: On Persistence in Mutual Fund Performance, Journal of Finance 52, 57-82 (1997).
Caroll, R.J., Ruppert, D., Stefanski, L.A.: Measurement error in nonlinear models (1. Aufl.). London: Chapman and Hall (1995).
Chen, H.L., Jegadeesh, N., Wermers, N.: The Value of Active Mutual Fund Management: An Examination of the Stockholdings and Trades of Fund Managers, Journal of Financial & Quantitative Analysis, Vol. 35, No. 3, pp. 343-368 (2000).
Chevalier, J. A., Ellison, G.D.: Risk taking by mutual funds as a response to incentives, Journal of Political Economy 105, 1167–1200 (1997).
Christelis, D., Jappelli, T., Padula, M.: Cognitive Abilities and Portfolio Choice, Manuscript, University of Salerno (2006).
Cole, S., Shastry, G. K.: Smart Money: The Effect of Education, Cognitive Ability, and Financial Literacy on Financial Market Participation, Working Paper, Harvard Business School (2009).
Cronan, T. P., Al-Rafee, S.: Factors that influence the intention to pirate software and media. Journal of Business Ethics, 78, 527-545 (2008).
Del Guercio, D., Tkac, P.: The determinants of the flow of funds on managed portfolios: Mutual funds vs. pension funds, Journal of Financial and Quantitative Analysis 37, 523–557 (2002).
Dempster, A. P., Laird, N. M., Rubin, D. B.: Maximum Likelihood from Incomplete Data via the EM Algorithm, Journal of the Royal Statistical Society. Series B, Vol. 39, No. 1, pp. 1-38 (1977).
Diamantopoulos, A., Siguaw, J.A.: Introducing LISREL. London: Sage Publications (2000).
Dimmock, S.G., Kouwenberg, R.R.P.: Loss-Aversion and Household Portfolio Choice: http://ssrn.com/abstract=680783 (2009).
Downs, D.S., Hausenblas, H.A.: The theories of reasoned action and planned behavior applied to exercise: A meta-analytic update. Journal of Physical Activity and Health, 2, 76-97 (2005)
East, J.R.: Investment decisions and the theory of planned behaviour, Journal of Economic Psychology 14 (1993), 337-375, (1993).
Efron, B.: Bootstrap methods: Another look at the jackknife, Annals of Statistics, 7, 1-26 (1979).
Elton, E.J., Gruber, M., Blake, C.: The persistence of risk-adjusted mutual fund performance. J. Bus. 69 (2), 133–157 (1996).
Elton, E.J., Gruber, M.J., Busse, J.A.: Are investors rational? Choices among index funds, Journal of Finance 59, 261–288 (2004).

35
Engström, S.: Preferences and Characteristics of Mutual Fund Investors, Working Paper, Stockholm School of Economics and Agenta (2007).
Fang, J., Shao, P., & Lan, G. (2009). Effects of innovativeness and trust on web survey participation. Computers in Human Behavior, 25, 144-152. [Abstract]
Ferreira, M.A., Ramos, S.B.: Mutual Fund Industry Competition and Concentration: International Evidence (January 01, 2009). http://ssrn.com/abstract=1343096
Fishbein, M., Ajzen, I.: Belief, Attitude, Intention and Behavior. An Introduction to Theory and Research, Reading (1975).
Frazzini, A., Lamont, O.A.: Dumb money: Mutual fund flows and the cross-section of stock returns, Journal of Financial Economics, Elsevier, vol. 88(2), pages 299-322, May (2008).
Goetzmann, W. N., Peles, N.: Cognitive Dissonance and Mutual Fund Investors, Journal of Financial Research 20, 145-158 (1997).
Gopi, M., Ramayah, T.: Applicability of theory of planned behavior in predicting intention to trade online: Some evidence from a developing country. International Journal of Emerging Markets, 2(4), 348-360 (2007).
Gremillion, L.: Mutual Fund Industry Handbook: A Comprehensive Guide for Investment Professionals, Boston Institute of Finance Series, Boston, Wiley, (2005).
Grinblatt, M.: How Distance, Language, and Culture Influence Stockholdings and Trades, Journal of Finance, American Finance Association, vol. 56(3), pages 1053-1073, 06 (2001).
Grinblatt, M., Sheridan T. : The Persistence of Mutual Fund Performance, Journal of Finance 47, 1977-1984 (1992).
Grinblatt, M., Ikaheimo, I., Keloharju, M.: Are Mutual Fund Fees Competitive? What IQ-Related Behavior Tells Us, Working Paper, University of California, Los Angeles (2007).
Grinblatt, M., Keloharju, M., Linnainmaa, J.T.: IQ and Stock Market Participation. CRSP Working Paper; AEA 2010 Atlanta Meetings Paper; Western Finance Association 2010 Meetings Paper; Chicago Booth Research Paper No. 09-27. http://ssrn.com/abstract=14415
Gruber, M. J.: Another Puzzle: The Growth in Actively Managed Mutual Funds, Journal of Finance 51, 783-810 (1996).
Guiso, L., Jappelli, T.: Awareness and stock market participation, Review of Finance 9, 537-567 (2005).
Guiso, L., Haliassos, M., Jappelli, T.: Household Stockholding in Europe: Where Do We Stand and Where Do We Go? Economic Policy, Vol. 18, No. 36, pp. 125-170 (2003).
36
Guiso, L., Sapienza, P., Zingales, L.: Trusting the stock market, Journal of Finance 63, 2557-2600 (2008).
Gumussoy, C.A., Calisir, F.: Understanding factors affecting e- reverse auction use: An integrative approach. Computers in Human Behavior, 25, 975-988 (2009).
Hackethal, A., Niebling, F., Meyer, S.: Whose money is smart? Mutual fund purchases of private investors; Working Paper (2009).
Haliassos, M.: Stockholding: Recent Lessons from Theory and Computations (2002). doi:10.2139/ssrn.312899
Heaton, J., Lucas, D.: Portfolio Choice in the Presence of Background Risk, The Economic Journal, 110, 1–26 (2000).
Hendricks, D., Patel, J. Zeckhauser, R.: Hot hands in mutual funds: Short-run persistence of relative performance 1974–1988, Journal of Finance 48, 93–130 (1993).
Hofmann, E., Hoelzl, E., Kirchler, E.: A comparison of models describing the impact of moral decision making on investment decisions. Journal of Business Ethics, 82, 171-187 (2008).
Homburg, C., Klarmann, M.: Die Kausalanalyse in der empirischen betriebswirtschaftlichen Forschung. Problemfelder und Anwendungs-empfehlungen, Die Betriebswirtschaft, 66, 6, S. 727-748 (2006).
Hong, H.G., Kubik, J.D., Stein, J.C.: Social interaction and stock market participation, Journal of Finance 59, 137-163 (2004).
Hooper, D., Coughlan, J., Mullen, M.: Structural Equation Modelling: Guidelines for Determining Model Fit. Electronic Journal of Business Research Methods, 6(1), 53-60 (2008).
Hu, L., Bentler, P.M.: Evaluating model fit. In R. H. Hoyle (Ed.), Structural equation modeling. Concepts, issues, and applications (pp. 76−99). London: Sage (1995).
Hu, L., Bentler, P.M.: Cutoff Criteria for Fit Indices in Covariance Structure Analysis. Conventional Criteria versus New Alternatives, in: Structural Equitation Modelling, 6, 1, S. 1-55 (1999).
Investment Company Institute (2008), Investment Company Fact Book.
Ippolito, R. A.: Consumer reaction to measures of poor quality: Evidence from the mutual fund industry, Journal of Law and Economics 35, 45–70 (1992).
Ivkovića, Z., Weisbenner, S.: Individual investor mutual fund flows; Journal of Financial Economics, Volume 92, Issue 2, Pages 223-237, May (2009).
Jen-Ruei, F., Cheng-Kiang, F., Wen-Pin, C.: Acceptance of electronic tax filing: A study of taxpayer intentions. Information & Management, 43, 109-26 (2006).

37
Jimmieson, N.L., Peach, M., White, K.M.: Utilizing the theory of planned behavior to inform change management: An investigation of employee intentions to support organizational change. Journal of Applied Behavioral Science, 44, 237-262 (2008).
Keswani, A., Stolin, D.: Which Money is Smart? Mutual Fund Buys and Sells of Individual and Institutional Investors, Journal of Finance 63, 85-118 (2008).
Khorana, A., Servaes, H.: Conflicts of Interest and Competition in the Mutual Fund Industry (July 2004). doi:10.2139/ssrn.240596
Khorana, A., Servaes, H. Tufano, P.: Explaining the size of the mutual fund industry around the world, Journal of Financial Economics 78, 145–185 (2005).
Khorana, A., Servaes, H. Tufano, P.: Mutual Funds Fees Around the World, Review of Financial Studies 22, 1279-1310 (2009).
Klapper, L., Sullas, V. Vittas, D.: The development of the mutual funds around the world, Emerging Markets Review, Vol. 5, pp. 1–38 (2004).
Lenard, M.J., Akhter, S. H., Alam, P.: Mapping Mutual Fund Investor Characteristics and Modeling Switching Behavior, Financial Services Review Volume 12, Volume 12 Number 1, pp. 39-59 (2003).
Lewis, W., Agarwal, R., Sambamurthy, V.: Sources of influence on beliefs about information technology use: An empirical study of knowledge workers. MIS Quarterly, 27(4), 657-678 (2003).
Lin, H.-F.: Applicability of the extended theory of planned behavior in predicting job seeker intentions to use job-search websites. International Journal of Selection and Assessment, 18, 64-74 (2010).
Malloy, C.J., Zhu, N.: Mutual Fund Choices and Investor Demographics, Working Paper (2004).
Manning, M.: The effects of subjective norms on behaviour in the theory of planned behaviour: A meta-analysis. British Journal of Social Psychology, 48, 649-705 (2009).
Mueller, R.O.: Basic principles of structural equation modeling: An introduction to LISREL and EQS. New York: Springer (1996).
Müller, S., Weber, M.: Financial Literacy and Mutual Fund Investments: Who Buys Actively Managed Funds?, Schmalenbach Business Review, 62, 126-153 (2010).
Nachtigall, C., Kroehne, U., Funke, F., Steyer, R.: (Why) Should We Use SEM? Pros and Cons of Structural Equation Modeling, Methods of Psychological Research Online, 8, 2, S. 1-22 (2003).
Nevit, Hancock: Performance of bootstrapping Approaches to Model Test Statistics and Parameter Standard Error Estimation in Structural Equation modelling, in: Structural Equation Modeling, 8 (3), 133-145 (2001).

38
Otten, R., Schweitzer, M.: A comparison between the European and the US mutual fund industry, Managerial Finance, Vol. 28, pp. 14–35 (2002).
Puri, M., Robinson, D.T.: Optimism and Economic Choice, Journal of Financial Economics 86, 71-99 (2007).
Ramayah, T., May, O. S., Omar, A.: Behavioral determinants of online banking adoption: Some evidence from a multicultural society. I-manager’s Journal of Management, 2(3), 29-37 (2008).
Ramayah, T., Y.M., Jamaludin, N., Ibrahim, A.: Applying the Theory of Planned Behavior (TPB) to Predict Internet Tax Filing Intentions, International Journal of Management Vol. 26 No. 2 (2009).
Ramos, S. B.: The Size and Structure of the World Mutual Fund Industry. European Financial Management, 15: 145–180 (2009).
Rhodes, R.E., Courneya, K.S.: Investigating multiple components of attitude, subjective norm, and perceived control: An examination of the theory of planned behaviour in the exercise domain. The British Journal of Social Psychology, 42, 129-146 (2003).
Rooij, M., Lusardi, A., Alessie, R.:Financial Literacy and Stock Market Participation, Working Paper, National Bureau of Economic Research, Cambridge (2007).
Rosen, H. S., Wu, S.: Portfolio Choice and Health Status, Journal of Financial Economics, 72, 457–484 (2004).
Rossiter, J.R.: The C-OAR-SE Procedure for Scale Development in Marketing, International Journal of Research in Marketing, Vol. 19, pp. 305-335 (2002).
Sapp, T. Tiwari, A.: Does Stock Return Momentum Explain the Smart Money Effect?, Journal of Finance 59, 2605-2622 (2004).
Schermelleh-Engel, K., Moosbrugger, H., Müller, H.: Evaluating the Fit of Structural Equation Models. Tests of Significance and Descriptive Goodness-of-Fit Measures, Methods of Psychological Research Online, 8, 2, S. 28-74 (2003).
Schmidt, R.: Präferenzbasierte Segmentierung von Fondskäufern: Verbesserung der Kundenorrientierung im Fondsvertrieb. Deutscher Universitäts-Verlag | GWV Fachverlage GmbH, Wiesbaden (2006).
Schreurs, B., Derous, E., Hooft, E.A.J., Proost, K., Witte, K.: Predicting applicant's job pursuit behavior from their selection expectations: the mediating role of the theory of planned behavior, Journal of Organizational Behavior, 30, 761-783 (2009).
Sheeran, P.: Intention-behavior relations: A conceptual and empirical review. European review of social psychology, Vol. 12, pp 1-36 (2002)
Sirri, E. R., Tufano, P.: The demand for mutual fund services by individual investors, Working Paper, Harvard Business School (1992).

39
Sirri, E. R., Tufano, P.: Costly Search and Mutual Fund Flows, Journal of Finance 53, 1589-1622 (1998).
Steenkamp, J.-P. / Baumgartner, H.: Assessing Measurement Invariance in Cross-National Consumer Research, Journal of Consumer Research, 25, 1, S. 78-90 (1998).
Steiger, J.H.: Structural Model Evaluation and Modification. An Interval Estimation Approach, Multivariate Behavioural Research, 25, 2, S. 173-180 (1990).
Sutton, S.: Predicting and explaining intentions and behavior: How well are we doing? Journal of Applied Social Psychology, 28, 1317-1338 (1998).
Teo, T.S.H., Pok, S. H.: Adoption of WAP-enabled mobile phones among internet users. The International Journal of Management Science, 31, 483-498 (2003).
Van Dam, K., Van der Vorst, J.D.M., Van der Heijden, B.I.J.M.: Employees' intentions to retire early: A case of planned behavior and anticipated work conditions. Journal of Career Development, 35, 265- 289 (2009).
Vissing-Jørgensen, A.: Towards an Explanation of Household Portfolio Choice Heterogeneity: Nonfinancial Income and Participation Cost Structures. Chicago: Univ. Chicago, Dept. Econ., (2002).
Weiber, R., Mühlhaus, D.: Strukturgleichungsmodellierung: Eine anwendungsorientierte Einführung in die Kausalanalyse. Springer, Berlin; (2009).
Wermers, R.: Mutual Fund Performance: An Empirical Decomposition into Stock-Picking Talent, Style, Journal of Finance, Vol. 55, No. 4, pp. 1655-1695 (2000).
Wheaton, B., Muthen, B., Alwin, D.F., Summers, G.: Assessing Reliability and Stability in Panel Models, Sociological Methodology, 8 (1), 84-136 (1977).
Wilcox, R.T.: Bargain Hunting or Star Gazing? Investors' Preferences for Stock Mutual Funds, Journal of Business, University of Chicago Press, vol. 76(4), pages 645-664, October (2003).
Xiao, J., Wu, J.: Applying the Theory of Planned Behaviour to Retain Credit Counseling Clients. TCAI Working Paper. (2006)
Zhao, X.: The Role of Brokers and Financial Advisors Behind Investments into Load Funds, Working Paper (2004).
Zheng, L.: Is Money Smart? A Study of Mutual Fund Investors’ Fund Selection Ability, Journal of Finance, 54, 901-933 (1999).
Zhu, N.: Cost of Time and Household Choice between Direct and Delegated Investment. http://ssrn.com/abstract=686569 (2005).