

Texas; Water Conservation Best Management Practices Guide - Texas Water Development Board
What does it mean?
Jon S. Albright Freese and Nichols, Inc. WATER FOR TEXAS 2017 Texas Water Development Board January 23-25, 2017

Topics
• What is a drought of record (DOR)?
• How is the DOR used quantify water supplies?
• How to identify new DOR conditions?
• What regions potentially have a new DOR?

What is a DOR?
• The historic period of record for a watershed in
which the lowest flows were known to have
occurred based on naturalized streamflow (30
TAC §297.1).
• The period of time when historical records
indicate that natural hydrological conditions
would have provided the least amount of water
supply (31 TAC §357.10).

0.0
0.5
1.0
1.5
2.0
2.5
3.0
3.5
19
40
19
44
19
48
19
52
19
56
19
60
19
64
19
68
19
72
19
76
19
80
19
84
19
88
19
92
19
96
20
00
20
04
20
08
20
12
An
nu
al F
low
Mill
ion
s

How is the DOR used quantify water supplies?
Firm Yield--Maximum water volume a reservoir can
provide each year under a repeat of the Drought of
Record using anticipated sedimentation rates and
assuming that all senior water rights will be totally
utilized and all applicable permit conditions met (31
TAC §357.10).

0%
20%
40%
60%
80%
100%
120%Ja
n-4
0Ja
n-4
2Ja
n-4
4Ja
n-4
6Ja
n-4
8Ja
n-5
0Ja
n-5
2Ja
n-5
4Ja
n-5
6Ja
n-5
8Ja
n-6
0Ja
n-6
2Ja
n-6
4Ja
n-6
6Ja
n-6
8Ja
n-7
0Ja
n-7
2Ja
n-7
4Ja
n-7
6Ja
n-7
8Ja
n-8
0Ja
n-8
2Ja
n-8
4Ja
n-8
6Ja
n-8
8Ja
n-9
0Ja
n-9
2Ja
n-9
4Ja
n-9
6
Pe
rce
nt
Full
Firm Yield Analysis

0%
20%
40%
60%
80%
100%
120%
Jan-50 Jan-52 Jan-54 Jan-56 Jan-58 Jan-60
Pe
rce
nt
Full
Drawdown over Entire 50s Drought
June 1950 to May 1957

0%
20%
40%
60%
80%
100%
120%
Jan-50 Jan-52 Jan-54 Jan-56 Jan-58 Jan-60
Pe
rce
nt
Full
Drawdown Later in 50s Drought
May 1953 to June 1957

0%
20%
40%
60%
80%
100%
120%Ja
n-9
7
Jan
-99
Jan
-01
Jan
-03
Jan
-05
Jan
-07
Jan
-09
Jan
-11
Jan
-13
Jan
-15
Pe
rce
nt
Full
Long Response
March 1998 to June 2016

How to identify new DOR conditions?• Comparison of drawdowns
• Gage flows
• Forecasting and modeling

0%
20%
40%
60%
80%
100%
120%
0 100 200 300 400 500 600 700
Pe
rce
nt
Full
Days into Drought
Comparison of Historical Drawdown Periods
Drought 1 Drought 2
0
100
200
300
400
500
600
700
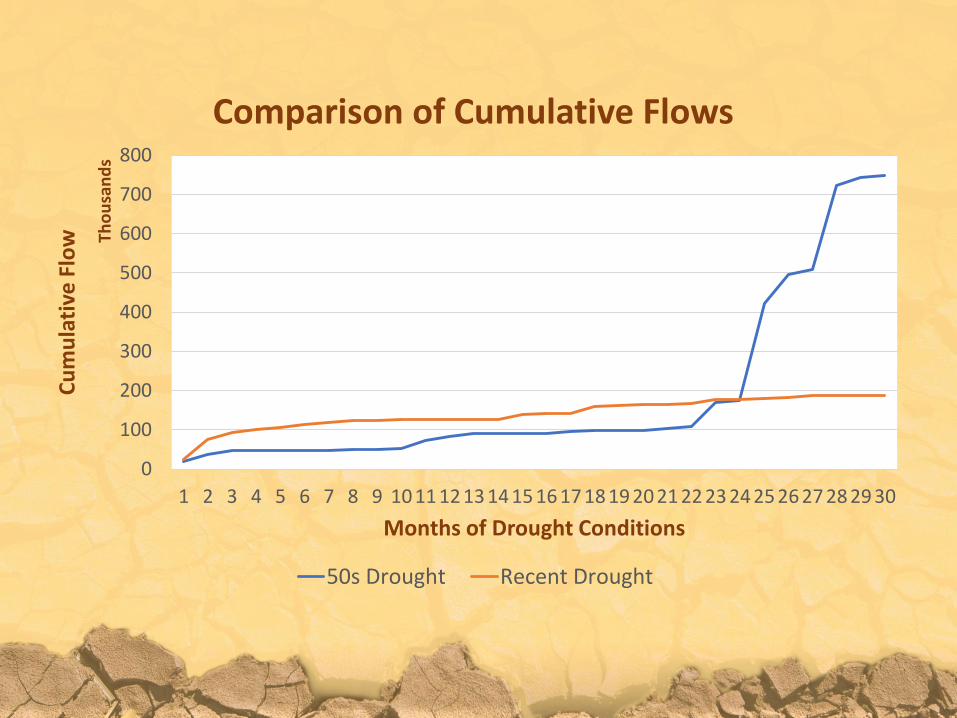
800
1 2 3 4 5 6 7 8 9 10 11 12 13 14 15 16 17 18 19 20 21 22 23 24 25 26 27 28 29 30
Cu
mu
lati
ve F
low Th
ou
san
ds
Months of Drought Conditions
Comparison of Cumulative Flows
50s Drought Recent Drought
0
20
40
60
80
100
120
140
160
180
200Ja
n-1
1
Jun
-11
No
v-1
1
Ap
r-1
2
Sep
-12
Feb
-13
Jul-
13
Dec
-13
May
-14
Oct
-14
Mar
-15
Au
g-1
5
Jan
-16
Jun
-16
No
v-1
6
Ap
r-1
7
Sep
-17
Feb
-18
Jul-
18
Dec
-18
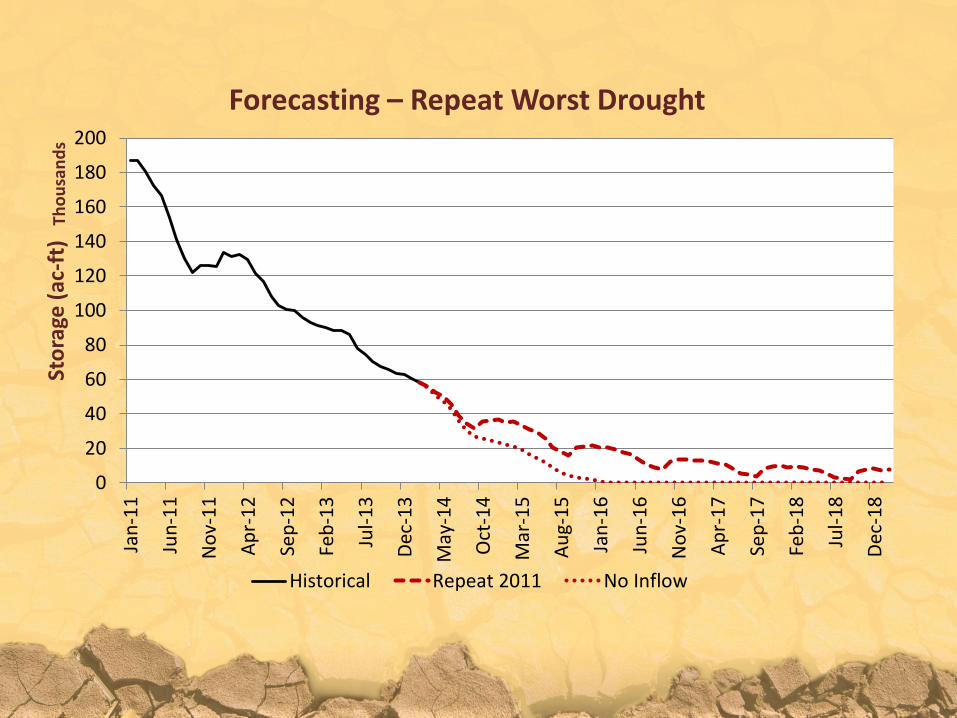
Sto
rage
(ac
-ft)
Tho
usa
nd
s
Forecasting – Repeat Worst Drought
Historical Repeat 2011 No Inflow
0
20
40
60
80
100
120
140
160
180
200
Jan
-11
Jun
-11
No
v-1
1
Ap
r-1
2
Sep
-12
Feb
-13
Jul-
13
Dec
-13
May
-14
Oct
-14
Mar
-15
Au
g-1
5
Jan
-16
Jun
-16
No
v-1
6
Ap
r-1
7
Sep
-17
Feb
-18
Jul-
18
Dec
-18
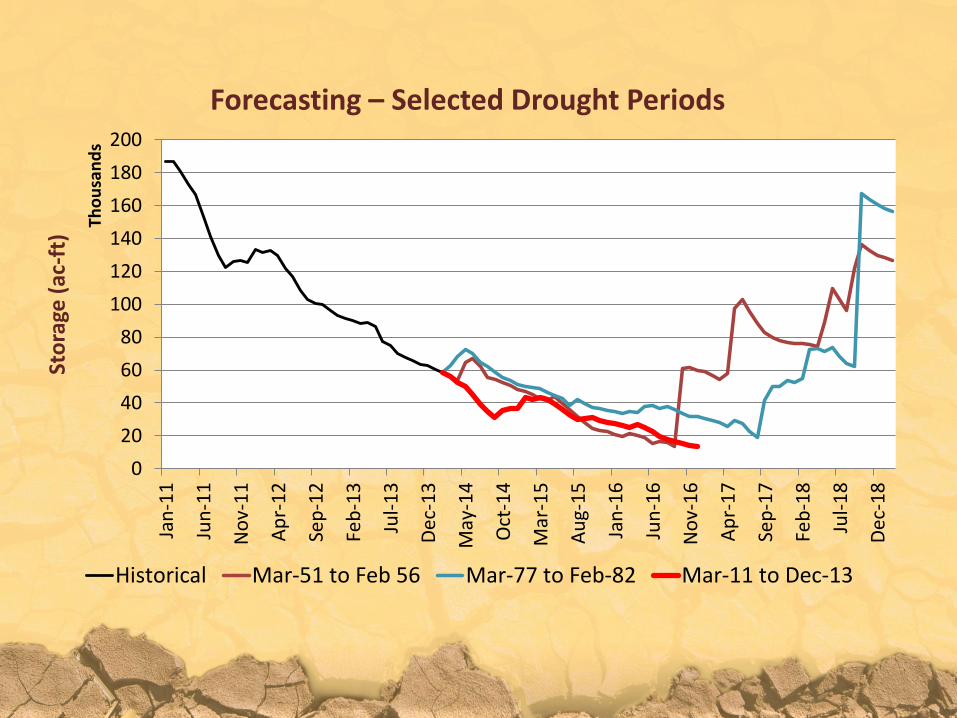
Sto
rage
(ac
-ft)
Tho
usa
nd
sForecasting – Selected Drought Periods
Historical Mar-51 to Feb 56 Mar-77 to Feb-82 Mar-11 to Dec-13

0
50
100
150
200
250Ja
n-1
1
Jun
-11
No
v-1
1
Ap
r-1
2
Sep
-12
Feb
-13
Jul-
13
Dec
-13
May
-14
Oct
-14
Mar
-15
Au
g-1
5
Jan
-16
Jun
-16
No
v-1
6
Ap
r-1
7
Sep
-17
Feb
-18
Jul-
18
Dec
-18
Sto
rage
(ac
-ft)
Tho
usa
nd
s
Forecasting – Risk Analysis (CRA)
Stage 2 Trigger
Stage 3 Trigger
Stage 4 Trigger
Normal - Dry
Dry
Very Dry
Stage 1 Trigger
Wet
Top of Conservation
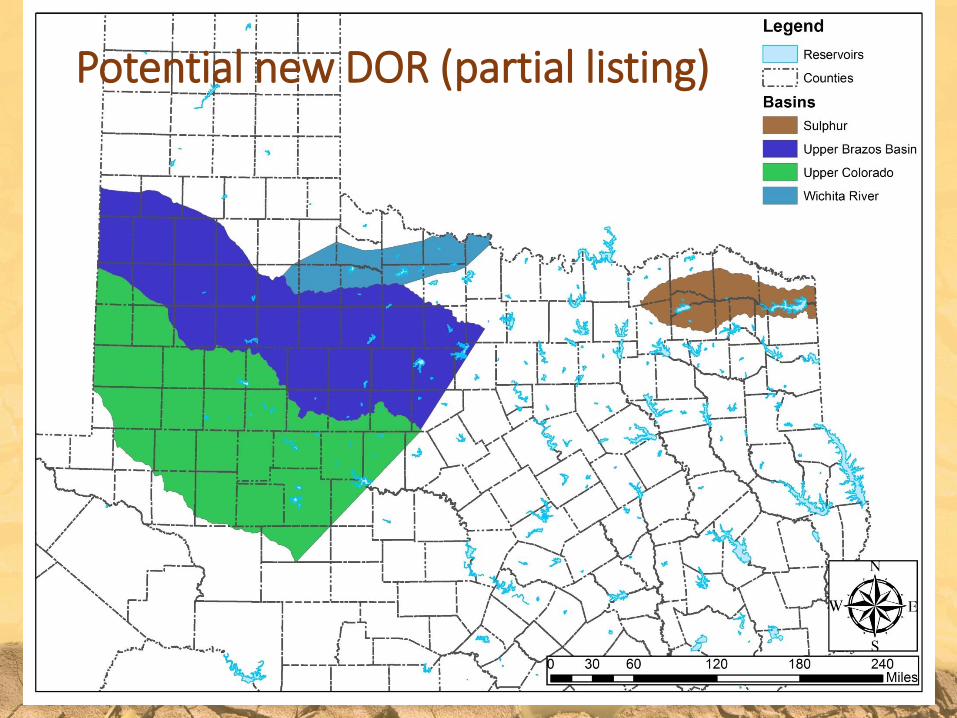
Potential new DOR (partial listing)