What does an IT Decision Maker need to make a decision? Dashboard and on-demand reporting: usage and...
21
SLA Insights and analysis
-
Upload
avice-reynolds -
Category
Documents
-
view
215 -
download
0
Transcript of What does an IT Decision Maker need to make a decision? Dashboard and on-demand reporting: usage and...
SLA Insights and analysis
Intelligent Reporting for Better Decisions
2
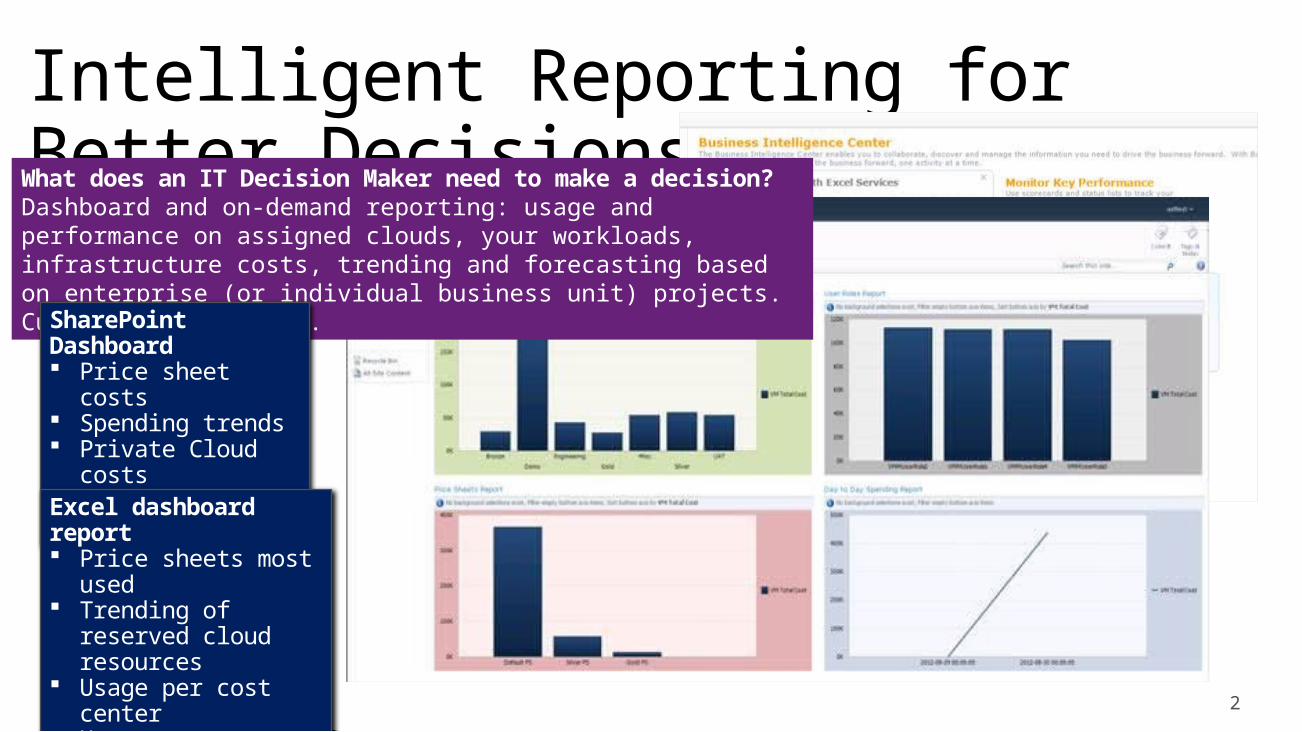
What does an IT Decision Maker need to make a decision? Dashboard and on-demand reporting: usage and performance on assigned clouds, your workloads, infrastructure costs, trending and forecasting based on enterprise (or individual business unit) projects. Customizable reports.
SharePoint Dashboard Price sheet costs Spending trends Private Cloud costs Costs based on
user rolesExcel dashboard report Price sheets most
used Trending of reserved
cloud resources Usage per cost
center Usage per types of
cloud resources

Chargeback
Service Manager data
warehouse
Virtual Machine Manager
Operations Manager
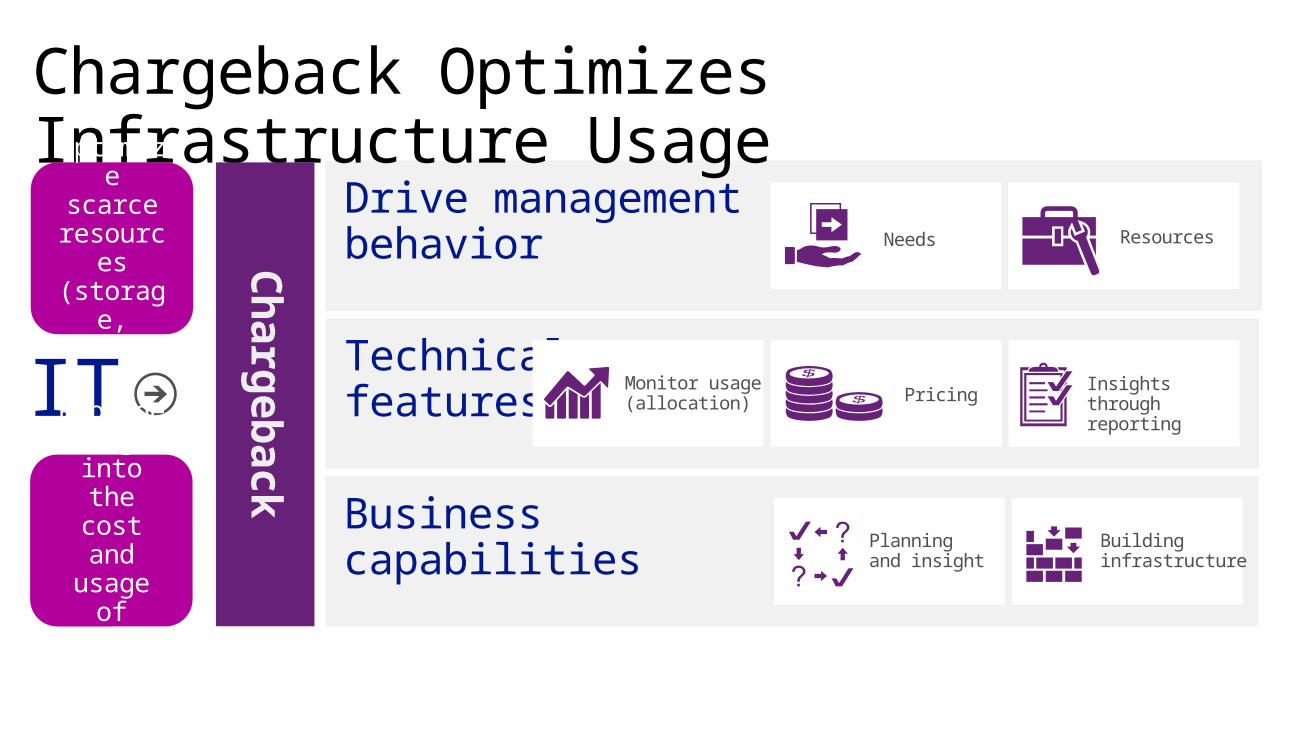
Technical features
Monitor usage(allocation)
Pricing Insights through reporting
Business capabilities
Drive management behavior
Chargeback Optimizes Infrastructure Usage
IT
Ch
arg
eb
ack
Needs Resources
Planning and insight
Buildinginfrastructure
Optimize scarce resourc
es (storage, VMs…)
Provide insight into the
cost and
usage of
services

System Center Service Manager SP1Private Cloud Chargeback En Suite – defined by cloud tenants & based
on allocation
Resource usage
VM usage metering and reporting
No pricing
“Showback”Tenant resource usage
Cloud based tenant usage metering and reporting
No pricing
“Chargeback”Tenant monetized usage
Basic pricing
Usage-based cost transfer
IT financial management
Pricing and billing (with SLA)
Cost recovery with financial integration and service reports
Align Chargeback Capabilities to any Organization
InformalTechnical
BusinessFormal
System Center Service Manager R2+ third-party connector
Partners: Apptio, Cloud Cruiser and others

Automating Chargeback ServicesData
warehouseService Manager
CSPP Portal
Virtual Machine Manager• Usage• Resources • Roles
Resources(allocation)
VM• Storage• Compute• Memory
• Applies quotas• Leases from resource
pool• Approvals
Developer (business user)
Datacenter Admin
Financial management systems
Third-party connectors
Partners: Apptio, Cloud Crusier
Chargeback
Excel & Sharepoint
Service Manager Portal3rd party web
portal
Formal
InformalTechnicalBusiness
Apply price sheet
$
Analyze data
Generate reports

• SCVMM Server and Console installed• SCOM Console and Agent installed• SCSM Server and Data Warehouse installed and connected • Create one or more Clouds • Provision or assign VMs to the Clouds • Configure integration between SCVMM and SCOM• Verify that the right information is exchanged between SCOM
and SCVMM
Set Up Chargeback

• Check that Data Warehouse has been configured and registered
• Make sure that Excel 2010 or Excel 2013 is installed • Import the Chargeback Management Pack • Configure the SCOM connector in Service Manager • Create a view to see Clouds objects under Configuration Items • Configure Price sheet for Chargeback • Verify data has moved to data warehouse • Use Microsoft tools to analyze data for chargeback
Set Up Chargeback
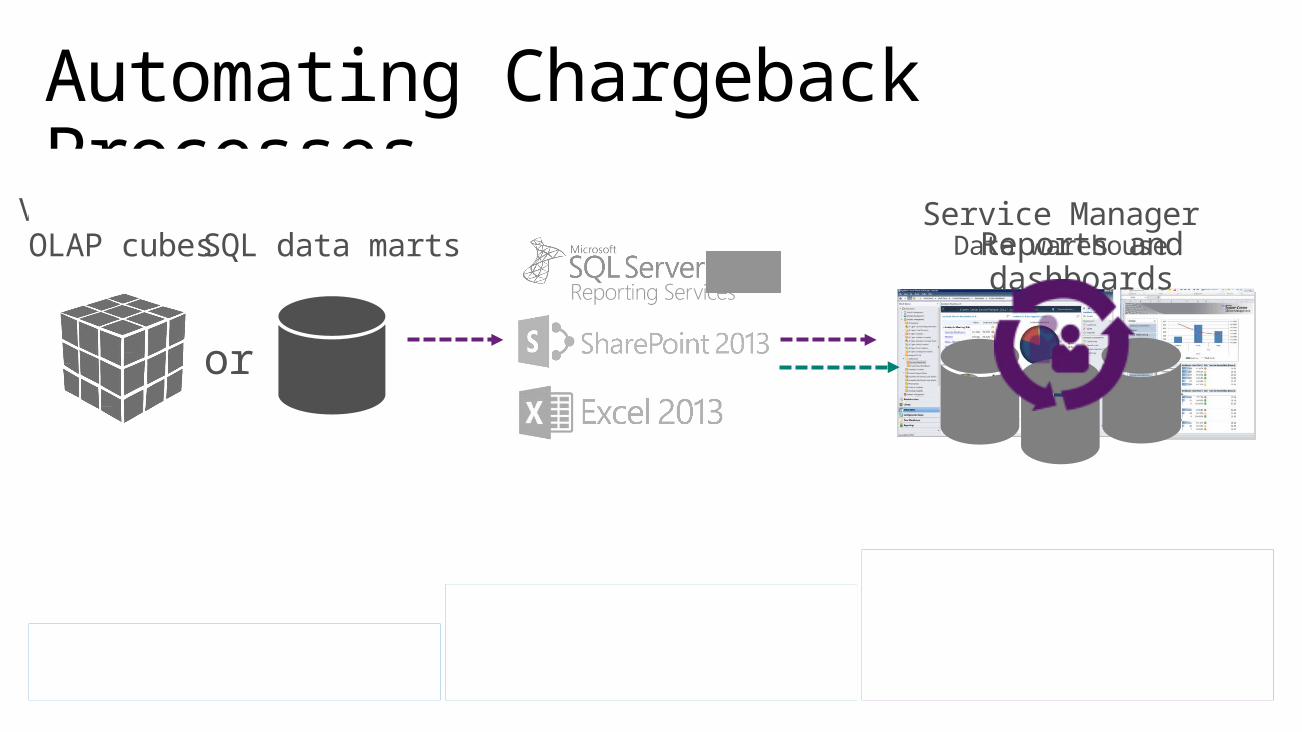
Process data Load data Data mart
Automating Chargeback Processes
Get data Store data Access data
Operations ManagerVirtual Machine ManagerReports and dashboards
OLAP cubesSQL data marts
or
Service ManagerData warehouse
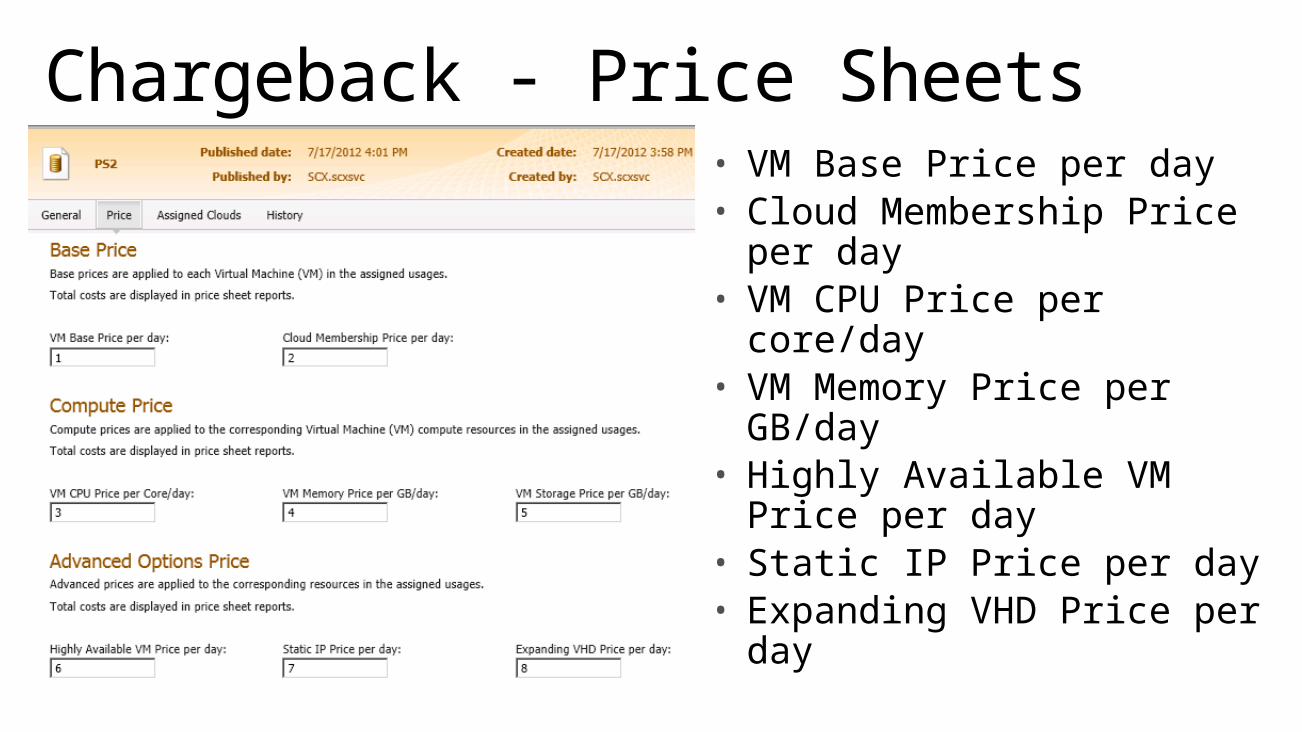
• VM Base Price per day • Cloud Membership Price per
day • VM CPU Price per core/day • VM Memory Price per
GB/day • Highly Available VM Price
per day • Static IP Price per day • Expanding VHD Price per
day
Chargeback - Price Sheets
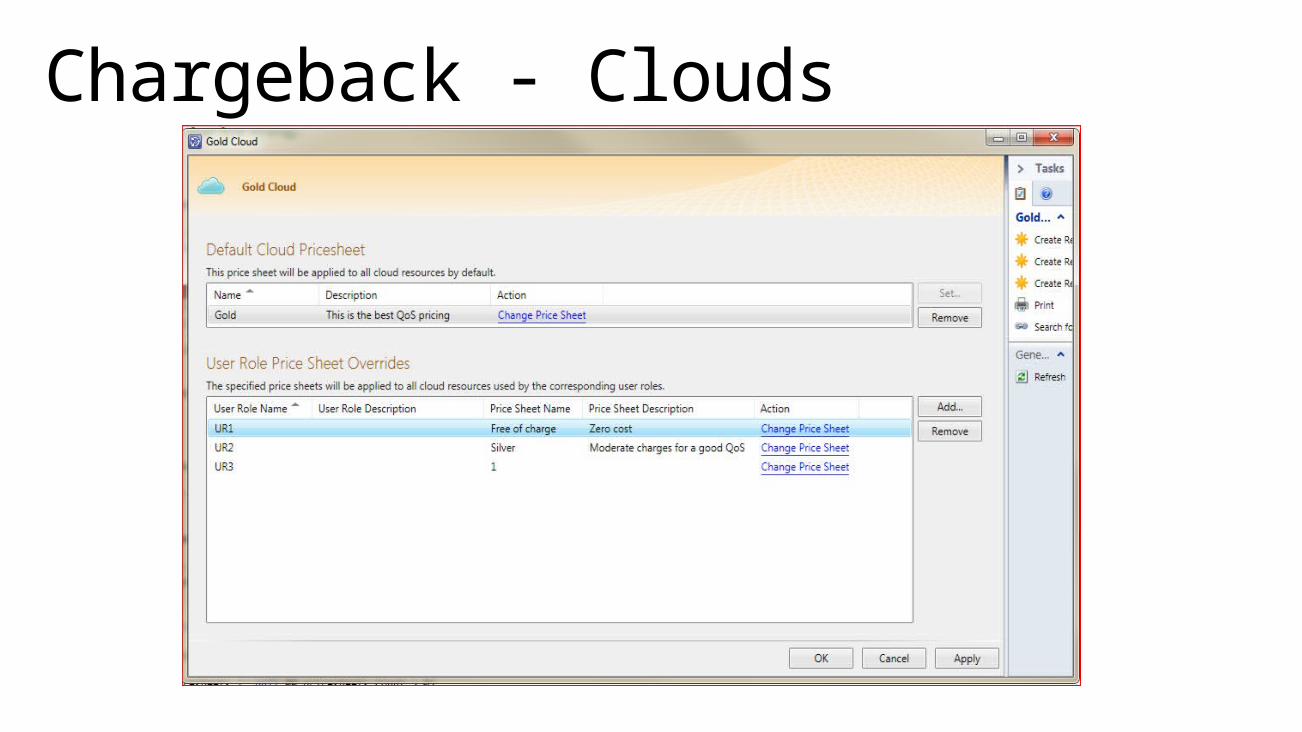
Chargeback - Clouds

Building a Chargeback Report
Access data
After accessing the Data Warehouse to create OLAP Chargeback Cubes, chargeback data (infrastructure costs and pricing) is available for reportingCloud Cost, VM Cost and Total Cost are based on predefined price sheets that IT will set
You have several choices for reporting:
• Creating Chargeback reports
• Deploying dashboards through SharePoint
Creating Chargeback reports Deploying dashboards
Creating Chargeback reports -- Excel Usage per cost center Usage per types of cloud
resources Price sheets most used Trending of reserved cloud
resources
Deploying dashboards
-- SharePoint Activate PerformancePoint
Services
Activate SharePoint Server Publishing
Use the Business Intelligence center to enable customized analysis
SharePoint dashboards Private Cloud costs
Costs based on user roles
Price sheet costs
Spending trends
• IT Behavior• Physical Infrastructure• SLA in Weeks & Months• Capacity managed by the consumer
• Consumer Behavior• Over-subscribe• Under utilize
Traditional Service Management
• Pooled resources using Virtual Infrastructure
• SLA in hours/days• Capacity managed by the service provider
Cloud Optimized Service Management

• Capacity planning Shifts to the Service Provider
• Flexible Cost Models Enabled1. Identify Opex: What are my ongoing costs2. Identify Capex: What are my capital assets 3. Direct costs 4. Indirect costs
• Fair: One party or individual should not pay for others • Transparent: It should be clear to why the cost is applied to a cost
model. The bill should be easy to read and understandable by the person who receives the bill. Like in the old days we charged by MIPS, can you quantify the value per MIP? No that is way too difficult to understand what you are being charged for.
Planning

• Quota• Lease• Approvals• Showback instead of Chargeback• Showing who is using what
Governance&Proactive Controls

Deeper insights, more clouds
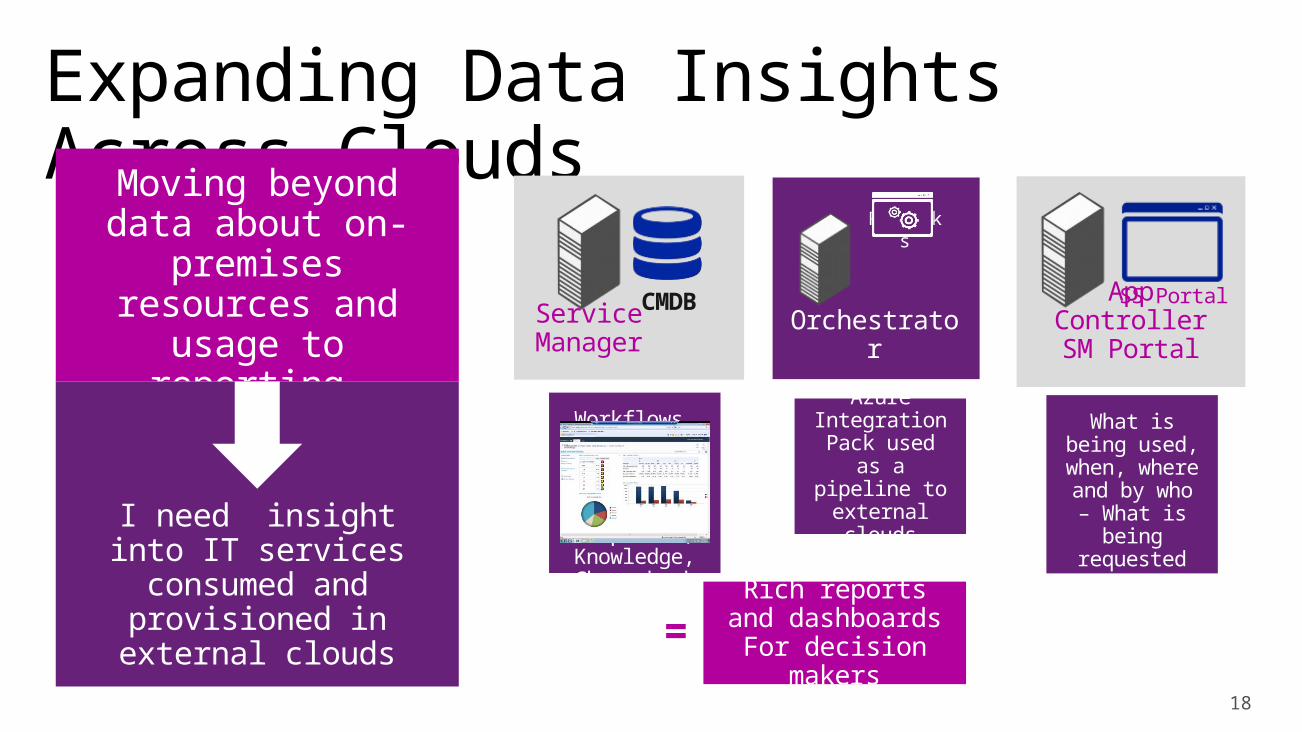
Expanding Data Insights Across Clouds
18
Moving beyond data about on-
premises resources and usage to
reporting across clouds
I need insight into IT services consumed and provisioned in external
clouds
Workflows,Service Offers,
Work Items,Templates,Knowledge,Chargeback Information
CMDBService Manager
SS PortalApp Controller
SM Portal
Runbooks
Orchestrator
Azure Integration
Pack used as a pipeline to
external clouds
What is being used, when, where and by who –
What is being
requested
Rich reports and dashboardsFor decision
makers
=
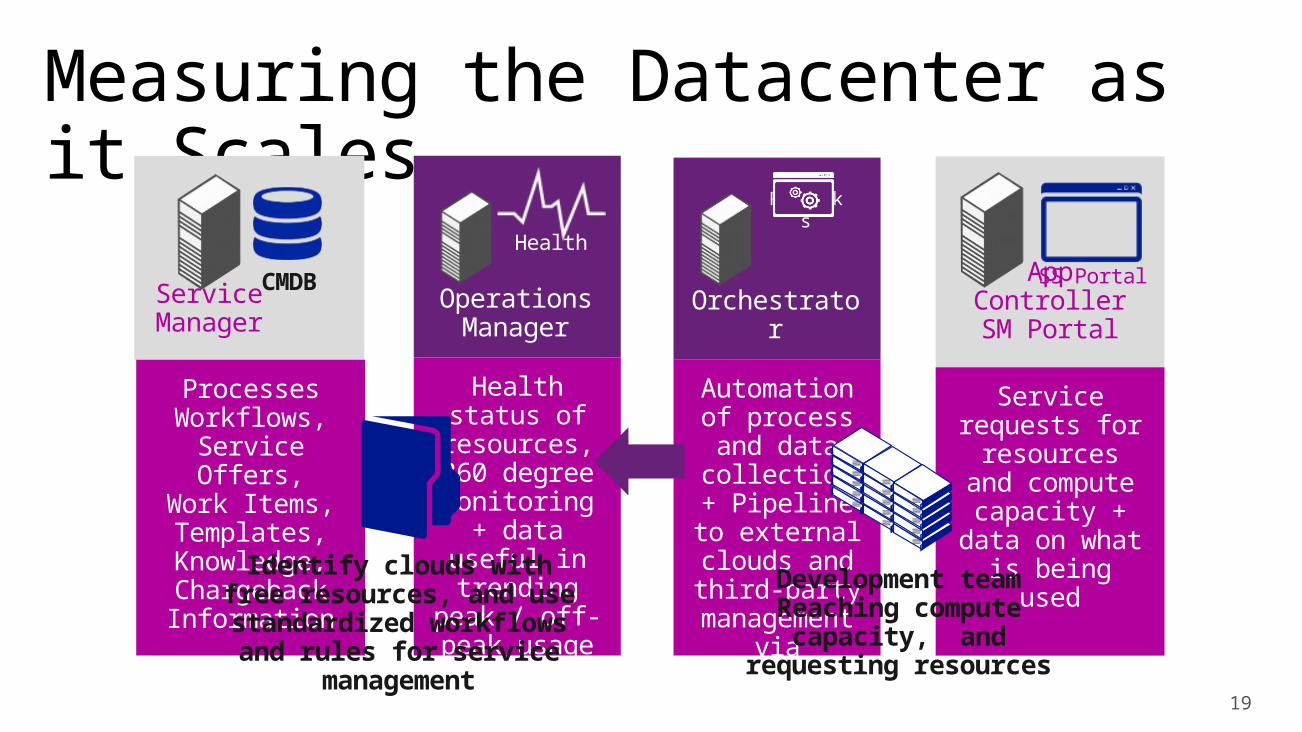
Measuring the Datacenter as it Scales
19
CMDBService Manager
SS PortalApp Controller
SM Portal
Runbooks
Orchestrator
Health
Operations Manager
Service requests for
resources and compute
capacity + data on what is being used
Automation of process and data
collection + Pipeline to external
clouds and third-party
management via
integration packs
Health status of
resources, 360 degree
monitoring + data useful in trending peak / off-
peak usage
Processes Workflows,
Service Offers,Work Items,Templates,Knowledge,Chargeback Information Development team
Reaching compute capacity, and
requesting resources
Identify clouds with free resources, and use
standardized workflows and rules for service
management

Service Provider
Microsoft CloudPrivate Cloud
Building Deep Insights and Reporting
20
Partner enabled Integration Packs
Out-of-the-box
All Systems Center ComponentsActive DirectoryExchange (User and Admin)IBM Tivoli Netcool/OmnibusHP (OM, SM, iLO)
Windows Azure SharePointFTPVMware vSphere
Orchestrator integration enables Microsoft and third-party platforms to coordinate and use operational data in the infrastructure across varying cloud scenarios (on-premises, Microsoft cloud and service provider clouds)
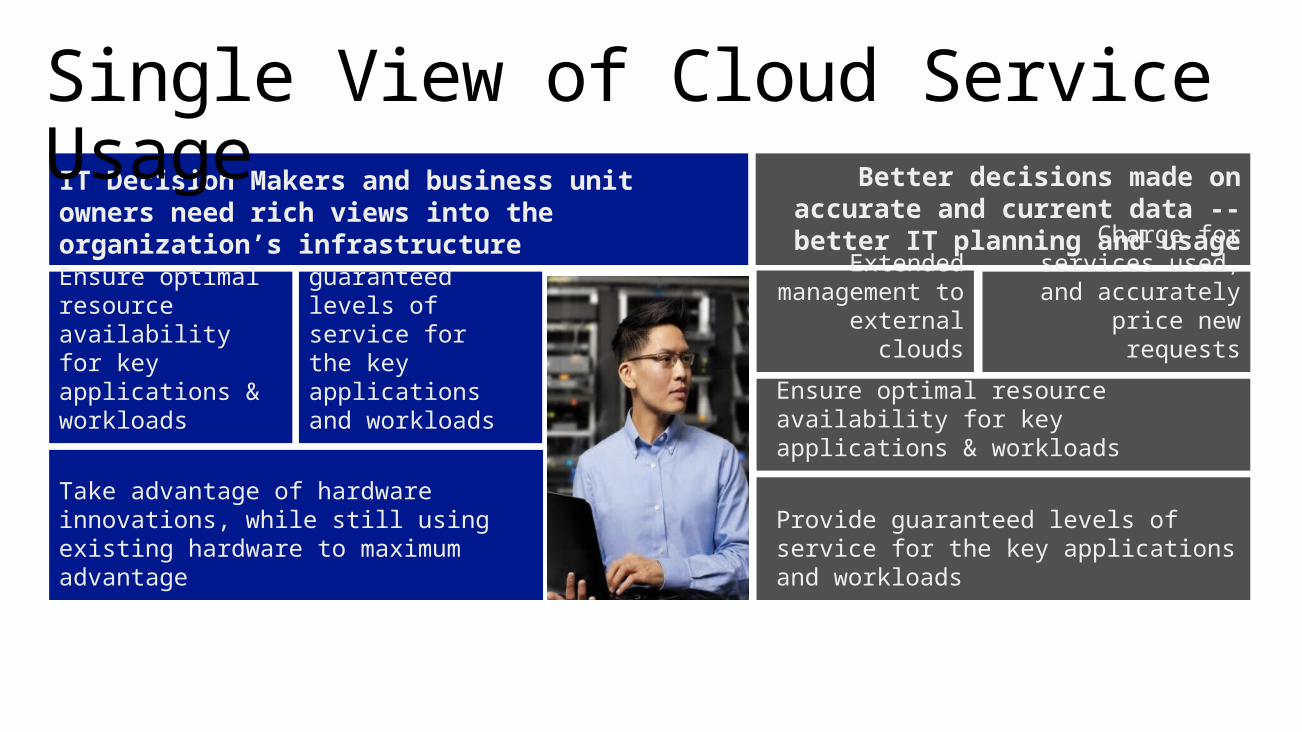
Provide guaranteed levels of service for the key applications and workloads
IT Decision Makers and business unit owners need rich views into the organization’s infrastructure
Take advantage of hardware innovations, while still using existing hardware to maximum advantage
Ensure optimal resource availability for key applications & workloads
Better decisions made on accurate and current data --
better IT planning and usage
Ensure optimal resource availability for key applications & workloads
Extended management
to external clouds
Single View of Cloud Service Usage
Provide guaranteed levels of service for the key applications and workloads
Charge for services used, and
accurately price new requests