What do people ‘learn by looking’ at direct feedback on their...
31
1 What do people ‘learn by looking’ at direct feedback on their energy consumption? Results of a field study in Southern France Adnane Kendel 1 , Nathalie Lazaric 1 and Kevin Maréchal 2,3 1. University of Nice Sophia Antipolis, CNRS GREDEG 2. Centre for Economic and Social Studies on the Environment Université libre de Bruxelles – Université d’Europe Tel: + 32 2 650 33 32 Fax: + 32 2 650 46 91 3. Postdoctoral Research Fellow of the Fonds de la Recherche Scientifique-FNRS and Assistant Professor at Gembloux Agro-Bio-Tech – Université de Liège Corresponding author: Nathalie Lazaric Email: [email protected] Université de Nice Sophia-Antipolis, CNRS UMR 7321 GREDEG - 250 rue A. Einstein Sophia Antipolis 06560 Valbonne, FRANCE Tel : + 33/(0) 4 93 95 43 88 ; Fax : + 33/( 0)4 93 65 37 98 Abstract: The abundant literature on consumer feedback shows that it is an efficient instrument for reducing household energy consumption. However, the reported reductions are strongly dependent on contextual factors and on the type of feedback provided. Given the importance of Learning to this respect, this dimension constitutes the core focus of the present study which reports the findings of the TICELEC (i.e. french acronym for information technologies for responsible electricity consumption) project in France. The experiment included a control group included a control group (G1: the self-monitoring group) and two equipped groups (feedback groups: G2 and G3). All participants reduced their consumption and learnt either directly from feedback or indirectly through self-monitoring. The amount of energy savings, which is large comparing to similar experiments, can be explained by two factors. First, the specificity of our sample (i.e. high income, high consumption) which allows for potentially large energy savings. Second, high involvement of participants and the building of trust. The quantitative and qualitative dimensions of learning are then discussed. Additionally, we focus on peak-load shifting. The higher proportion of shifters in G3 and the higher ‘quality’ of their shifting suggest a higher level of learning enabled by the more sophisticated feedback. Although this translated into only a moderately higher rate of energy savings, the higher degree of absorbed knowledge (i.e. through ‘learning by looking through connecting’) might lead to a qualitatively distinctive type of energy saving. Keywords: Household energy saving ; learning ; feedback ; residential consumption
-
Upload
nguyencong -
Category
Documents
-
view
215 -
download
0
Transcript of What do people ‘learn by looking’ at direct feedback on their...
1
What do people ‘learn by looking’ at direct feedback on their
energy consumption? Results of a field study in Southern
France
Adnane Kendel1, Nathalie Lazaric1 and Kevin Maréchal2,3
1. University of Nice Sophia Antipolis, CNRS GREDEG
2. Centre for Economic and Social Studies on the Environment Université libre de Bruxelles – Université d’Europe Tel: + 32 2 650 33 32 Fax: + 32 2 650 46 91 3. Postdoctoral Research Fellow of the Fonds de la Recherche Scientifique-FNRS and Assistant Professor at Gembloux Agro-Bio-Tech – Université de Liège Corresponding author: Nathalie Lazaric Email: [email protected] Université de Nice Sophia-Antipolis, CNRS UMR 7321 GREDEG - 250 rue A. Einstein Sophia Antipolis 06560 Valbonne, FRANCE
Tel : + 33/(0) 4 93 95 43 88 ; Fax : + 33/( 0)4 93 65 37 98
Abstract:
The abundant literature on consumer feedback shows that it is an efficient instrument for reducing household
energy consumption. However, the reported reductions are strongly dependent on contextual factors and on
the type of feedback provided. Given the importance of Learning to this respect, this dimension constitutes the
core focus of the present study which reports the findings of the TICELEC (i.e. french acronym for information
technologies for responsible electricity consumption) project in France. The experiment included a control group
included a control group (G1: the self-monitoring group) and two equipped groups (feedback groups: G2 and
G3). All participants reduced their consumption and learnt either directly from feedback or indirectly through
self-monitoring. The amount of energy savings, which is large comparing to similar experiments, can be explained
by two factors. First, the specificity of our sample (i.e. high income, high consumption) which allows for
potentially large energy savings. Second, high involvement of participants and the building of trust. The
quantitative and qualitative dimensions of learning are then discussed. Additionally, we focus on peak-load
shifting. The higher proportion of shifters in G3 and the higher ‘quality’ of their shifting suggest a higher level of
learning enabled by the more sophisticated feedback. Although this translated into only a moderately higher rate
of energy savings, the higher degree of absorbed knowledge (i.e. through ‘learning by looking through
connecting’) might lead to a qualitatively distinctive type of energy saving.
Keywords:
Household energy saving ; learning ; feedback ; residential consumption
2
1. Introduction
At times, everyone needs feedback on their actions and especially in the context of requests for a change in
behaviour. Feedback is especially important if what needs to be changed is invisible or as Burgess and Nye (2008)
put it ‘doubly invisible’. This is the issue confronting policy-makers faced by the need to reduce households'
consumption of energy (see Maréchal, 2010). Energy (and especially electricity) is produced in remote locations
and enters the home through hidden wiring systems. Its 'invisibility' is reinforced by the often inconvenient
positioning of energy meters and the time lag between consumption and payment governing traditional billing
systems. Household energy is not a type of commodity that is bought and then stored for later use; it is invisible to
most of its consumers, which is why smart metering technologies are being promoted in order to ‘make energy
visible’ (Hargreaves et al., 2013) to consumers and encourage them to reflect on (and hopefully reduce) the amount
consumed. These efforts have given rise to a large literature on consumer feedback to reduce household energy
consumption (see the many references contained in the review analysis Darby, 2006; Martiskainen, 2007; Steg,
2008; Fischer, 2008; Caroll et al., 2009; EPRI, 2009; Erhardt-Martinez et al., 2010 and for more recent analysis
studies Buchanan et al., 2015; Frederik et al., 2015; Vassileva et al., 2012 among others).
In a context of bounded rationality - where humans make decisions based on cognitive heuristics, such as mental
shortcuts, rather than decision calculus (Pasche, 2014) - the challenge is not which information should be displayed,
but rather 'how it should be displayed and where the display device should be situated to encourage the greatest
change in behavior' (Martiskainen and Coburn, 2011: 216). As Darby (2010) notes, the effectiveness of feedback as
a source of learning is very dependent on the context and the nature of this feedback.
Authoritative reviews on feedback (Darby, 2006; Fischer, 2008; Ehrhardt-Martinez et al., 2010) show that different
types of feedback tend to produce different results, and the effect of feedback on performance is highly variable.
More specifically, based on the definition in Darby (2006: 8), it seems that real-time ‘learning by looking’ is more
efficient than ex-post ‘learning by reading and reflection’.
For instance, Erhardt-Martinez et al. (2010) suggest that the immediacy of direct feedback can induce annual
savings of between 9.2% and 12%, whereas indirect feedback leads only to savings ranging from 3.8% to 8.4%.
3
Frequency seems to be important for efficient feedback. However, this dimension is tied closely to the medium
used to provide the feedback. If indirect feedback is implemented through bills (regular or enhanced, daily or
annual, general or user-specific, etc.), direct (i.e. real-time) feedback requires the use of some sort of smart device
such as a meter, a display, a computer, a television, a phone, etc. ‘Direct feedback through device’ is more effective
for making energy visible than ‘indirect feedback through bills’ (see also Darby, 2010; Ofgem, 2011). The more
disaggregated the data (i.e. down to the appliance level), the more efficient the direct feedback for generating
energy savings (Ehrhardt-Martinez et al., 2010).
Thus, the key seems to be provision of useful information in an appropriate manner in order to induce some form
of learning. Given that ‘in an appropriate manner’ would seem to indicate ‘in real time’, designers are proposing
displays that provide effective feedback on use. These smart displays, which can be defined 'a collection of objects
arranged for public viewing', could trigger learning since they activate peripheral perception capabilities and,
notably, situational awareness of humans in a context of scare and rare attention (Börner et al., 2013: 426).
Since learning is claimed to be the rationale behind the promotion of feedback mechanisms, the learning dimension
is the analytical focus of our study. We focus on peak-load shifting, not to compare it with energy savings, but taking
it as the key to generating effective energy savings. We agree with Erhardt-Martinez et al. (2010) that programmes
focused on peak load shifting tend to generate lower energy savings. However, our results suggest that the ability
to shift is crucial for understanding the variability in the savings induced in an experiment focused on energy
reduction.
The rest of the paper is organized as follows. In Section 2 we provide some background to our approach of feedback.
Section 3 describes the survey and the methodological approach. Section 4 presents the results obtained from the
regression analysis, which is aimed at capturing the effect of feedback on electricity consumption. These results are
discussed in detail in Section 5, which focuses on what consumers learnt directly via feedback and indirectly by
engagement in the experiment. Section 6 concludes the paper.

4
2. Background
A quick reading of the main insights from the literature on feedback during the first decade of this century would
seem to point to the greater efficiency of real-time and detailed information and related use of a device. However,
a more detailed analysis of the important studies in the field shows that the findings regarding the question of
efficient feedback are not conclusive. This is due mostly to the diversity of the methodologies employed, which
makes comparison difficult: sample sizes vary, not all analyses include a control group, the time periods covered
are different, etc. For instance, Erhardt-Martinez et al. (2010) show that shorter studies show higher mean savings
than longer ones.
Somewhat more fundamental is the fact that the type of feedback implemented is not always clearly defined and,
quite often, is coupled with other interventions (e.g. rewards, personal advice, commitment strategies, etc.)
rendering post-hoc assessment regarding the specific contribution of feedback rather difficult. Our study shows
that the alleged ‘neutrality’ of a control group experience is not always a reality.
Obviously, the study recruitment process has an impact on results. This might seem a secondary issue given that,
in the case of most studies, the individuals targeted are motivated, leading to generalized sample bias. However,
recruitment is an important factor given that we can see a correlation between the type of study programme and
the type of feedback. ‘Opt-out’ programmes somewhat surprisingly show higher participation rates, lead to lower
savings and are typical of indirect feedback such as enhanced billing or web-based audits. ‘Opt-in’ programmes
tend to attract fewer participants and are typical of display-type feedback trials.
All these elements add to the variability due to contextual factors (climate, energy infrastructure, geography,
culture, etc.) and socioeconomic characteristics (age, income, electricity consumption levels) which have been
documented in review studies (Fischer, 2008; Caroll et al., 2009; EPRI, 2009; Erhardt-Martinez et al., 2010). In
addition, the effectiveness of a given media-frequency pairing will vary with the content and format (i.e. how the
information is presented) as illustrated in Caroll et al. (2009: 10) who refer to the ’appeal’ of feedback.

5
Overall, it is difficult to draw any general conclusions beyond the robust and well documented fact that the amount
of savings tends to increase with the frequency and precision of the information that is fed back to consumers.
Nevertheless, it seems obvious that 'efficient feedback' can mean different things depending on the households
targeted. Consumer preferences do matter (see Vassileva et al., 2012).
Although there is a consensus that there is no ‘one size fits all’ feedback solution (Hargreaves et al., 2010; He et al.,
2010 ), and that feedback should be tailored (Ek and Söderholm 2010, Vassileva et al., 2012), there is no conclusive
information on consumer preferences with respect to the design of the interface through which the feedback is
provided.1 Even less clear is how feedback is appropriated and integrated into consumers' lives.2 Interestingly,
Krishnamurti et al. (2013) show that satisfying the preferences of consumers regarding the type of information they
want to receive (i.e. expressed in dollar units) is not equivalent to providing them with information (i.e. expressed
in kWh units) which seems the most effective to encourage learning and generate energy savings. Thus, providing
feedback in its preferred form is not equivalent to providing efficient feedback.
3. Approach, method and design of the survey
The above arguments tend to support the choice of an analytical focus on how feedback is appropriated and used
by people, and what type of learning this induces. This is the rationale of the surveys discussed in this paper. Bearing
in mind the various potential limits and restrictions discussed above, we conducted an experiment called TICELEC
to test the power of diverse sources of feedback for enabling citizens to learn, and to make sense of their
consumption. The experiment was conducted in Biot, a wealthy municipality close to Nice/Sophia Antipolis in
Southern France. For several decades, Biot has run projects aimed at raising ecological awareness among
households, and encouraging sustainable practices such as waste reduction, and consumption of locally-produced
1 There are some interesting studies on users’preferences such as Karjaleinen (2010) and Bonino et al. (2012). The latter shows, for instance, that colour-based feedback is appreciated. However, the results are general (not segmented) and taken from a prospective questionnaire. The surveyed individuals did not possess the in-house display they were asked about; thus, the efficiency of the preferred options is not dealt with. 2 Notable exceptions are the papers by Tom Hargreaves and colleagues (see Hargreaves et al., 2010, 2013).

6
food. Thus, the municipality could be perceived as credible and trusted by its citizens. As discussed in Gangale et al.
(2013), this clearly is important since the installation of an enabling infrastructure is not always sufficient to trigger
behavioural change.
3.1 The TICELEC team
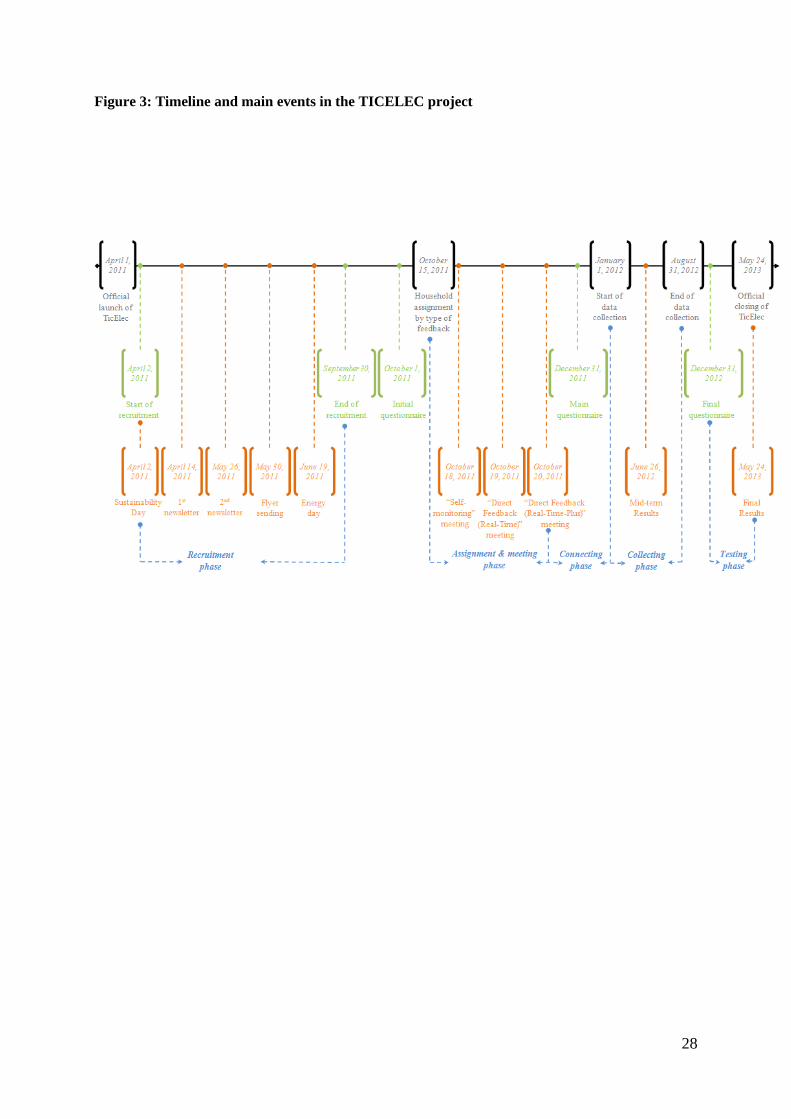
The project was launched on 1 April 2011 and ended officially on 24 May 2013. It included several phases:
-recruitment of households, meetings with households, and their assignment to different groups;
-installation of the energy-monitoring devices;
-collection of consumption data;
- testing and treatment of results.
The project was overseen by academics from the University of Nice Sophia Antipolis and involved three other main
actors: a start-up called Ubinode, the municipality of Biot, and the OFCE (the French Economic Observatory). The
division of labour was as follows. The academics and the OFCE were responsible for designing the experiment and
informing households about potential energy savings. The municipality of Biot was responsible for communication
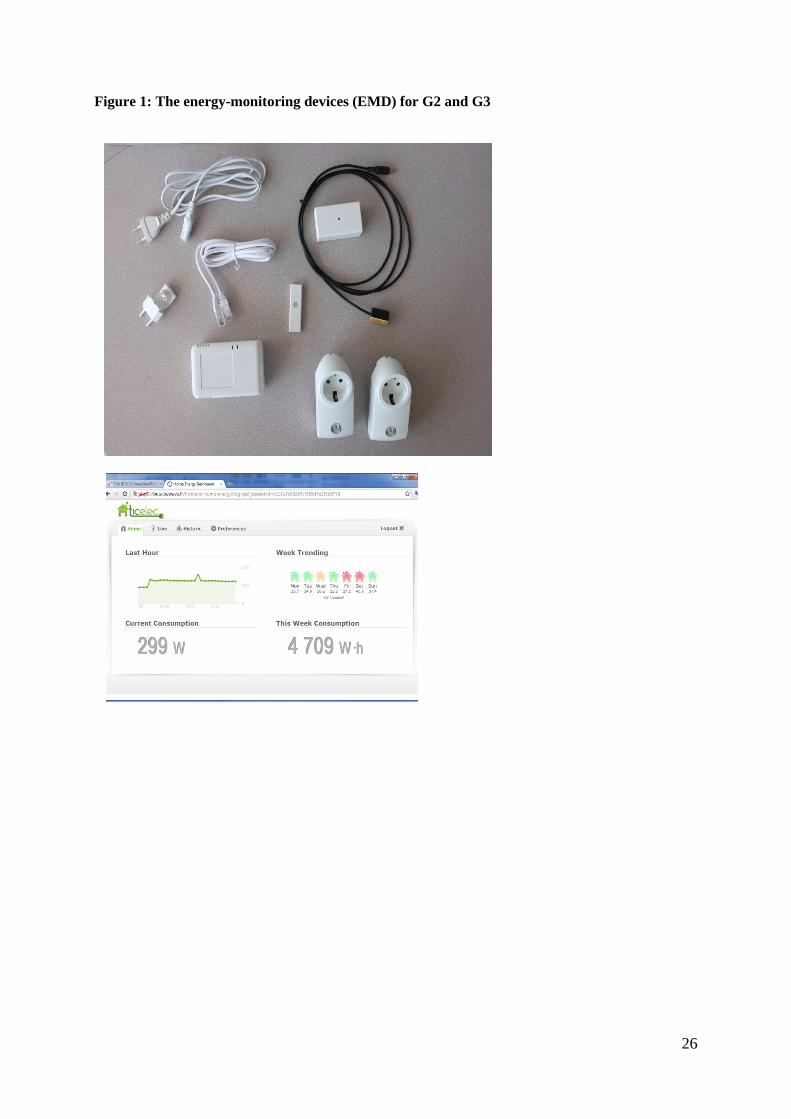
with and recruitment of participants. Ubinode provided the energy-monitoring devices (hereafter EMD) to measure
electricity consumption (i.e. smart equipment with ergonomic interfaces for home computers; the different devices
implemented during the project are presented in Figure 1).
Figure 1: The energy-monitoring devices (EMD) for G2 and G3
3.2. Recruitment phase
Biot is a small municipality with a population of about 7,000, all of whom potentially could be involved in the
experiment. A large number of its inhabitants are employed in the high-tech Sophipolitan cluster, which is
specialized in the health and Information and Communication Technology (ICT) sectors. Socio-economic variables
(e.g. education and income) show high levels of income and education per capita compared to the regional mean.
For instance, 69% of the participants in our sample are professionals such as engineers, administrators, and
managers (see Figure 2 for a comparison between TICELEC participants and the regional level).

7
Figure 2 : Households level of income : our survey and regional level
Per capita income is also higher (year average is 55,392.69 euros in 2011 compared to the significantly lower
regional average of 23,627 euros during the same period. Mean electricity consumption of inhabitants of Biot
compared to the region average shows a similar trend (respectively 21,000 and 9,253 kWh in 2011). This specificity
is important because of the potential effects on income elasticity of households‘ electricity consumption (see Espey
and Espey, 2004 for a discussion of these aspects). However, it does not detract from the study since, as discussed
in Gangale et al. (2013), targeting certain segments of the population might prove essential for enriching our
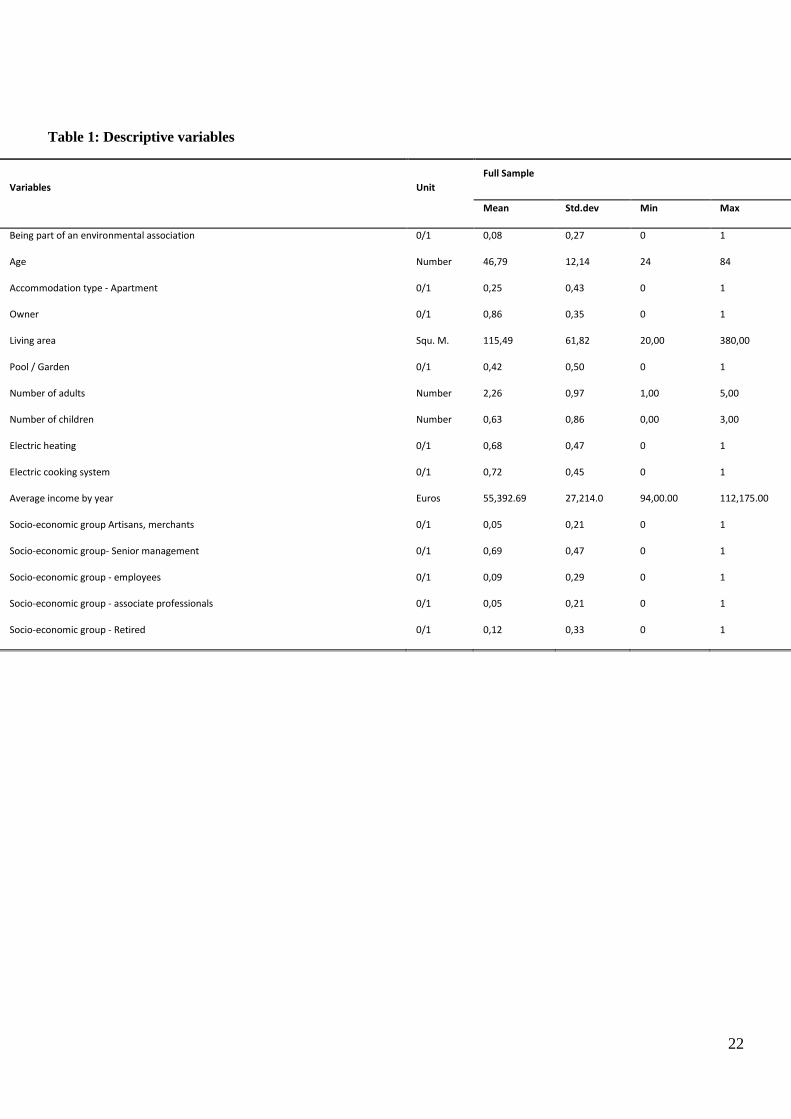
knowledge about the impacts of feedback-based intervention. Table 1 presents the main descriptive data for our
sample.
Table 1: Descriptive variables
The recruitment phase ran from 2 April to 30 September 2011. The municipality provided various communication
resources including displays, website, magazines, social networks, and educational leaflets. The municipality's
commitment was important, and the information disseminated through press releases and flyers distributed to
households exemplify its involvement and partnership in the project. In order to avoid inducing self-selection bias
the flyers did not specify whether participating households would be able to save energy or not. Following this
information phase, 172 households volunteered their participation and were enrolled in the TICELEC project.
In line with the procedure in Krishnamurti et al. (2013), we administered a short survey to participating households
in order to identify the type of electricity meter in their accommodation, and to check the distance between the
Internet connection and the meter. Collection of the questionnaires was completed by 1 October 2011. This led to

8
validation of a sample of 141 households, which were assigned to one of three groups: self-monitoring
(group 1), real time feedback (group 2), and real time plus feedback (group 3).
3.3 Installation of the energy-monitoring devices
Separate meetings were held with each group on 18, 19 and 20 October 2011. The EMD were provided
to groups 2 and 3 on 19 and 20 October and were installed and connections provided between end
October 2011 and end December 2011. At this stage, only 124 households were participating in the
experiment; some promises to join the project were not followed by action and, in some cases, personal
situations or external contingencies (e.g. moving house) caused some participants to drop out of the
experiment. On 1 January 2012, a second short questionnaire was administered. This included more
specific questions on the type of housing, consumption habits, household composition, and attitudes to
environmental issues and sustainable development. At the same time, the eight-month data collection
period started. During this period, some households left the project for family reasons (moving, divorce,
other), technical reasons (sensors that did not transmit the information due to the thickness of the
concrete walls despite compliance with the recommended maximum distance of 20 meters between the
broadband router and the meter), or lack of motivation. This reduced the number of households to 80.
During this stage, households were invited to attend a meeting held on 26 June 2012. Most of the
audience were from group 1. The questions posed and interventions made during this meeting reflected
some frustration over the lack of information on consumption despite the self-monitoring procedure
implemented for households in group 1 (see below).
3.4 Final questionnaire and observation of potential changes
After the data collection period, the 80 remaining households received the end-of-study questionnaire,
which asked about their use of equipment, the changes that had been made to their homes or the
composition of their household, their level of satisfaction with the feedback received, and potential
changes to habits. Only 65 questionnaires were sufficiently complete and consistent to be used. Thus, the
sample was reduced to 65 households.
The project closed officially on 24 May 2013 with a meeting between participating households and the
project funders, at which the results of the test phase from 1 January 2013 to 24 May 2013 were
presented.

9
The timeline is summarized in Figure 3:
Figure 3: Timeline and main events in the TICELEC project
3.5 Assignment to groups G1, G2 and G3
Our final and (retained) sample comprises 65 households; 30 were provided with feedback equipment
and 35 were not. Specifically, participating households were split into three subgroups:
-Group 1, the control group, includes the 35 households involved in self-monitoring with no real time
feedback, who were asked to read their meters every two months and to report their consumption;
-Group 2 comprising 14 households with energy-monitoring devices incorporated into the general meter,
allowing for 'real time' feedback. These 14 households were equipped with interactive ICT which
measured their consumption every two minutes. This allowed them to track their electricity consumption
on a 'real time' basis or on a less frequent (but no less relevant) basis (i.e. hourly, weekly, monthly);
- Group 3 included 16 households provided with the same equipment as Group 2. Additionally, they
received two nomad captors which could be used to provide more specific feedback on up to two
appliances of the household's choice. This 'real time plus' group received the most detailed information
on its electricity consumption.
Our experiment included a control group (G1: the self-monitoring group) and two equipped groups
(feedback groups: G2 and G3). Participating household were mostly randomly assigned to the subgroups
with the exception of three cases where households were not able to participate in G2 or G3 because of
the type of electricity meter. These participants (without digital meters) were assigned to the control
group G1.
4. Presentation of the results
To see the potential impact of the EMD, we test the difference in energy consumption within groups at
the beginning and end of the experiment. We use a multiple linear regression to analyse the changes in
the endogenous variable (electricity consumption) associated with variations in several explanatory
variables plus the feedback variable. So electricity consumption, as partially dependent on feedback to
households, can be represented as follows:
𝑪 = 𝜷𝒊𝑿 + 𝜹𝑭𝑩 + 𝜺 (1)

10
The dependent variable 𝑪 represents the household's electricity consumption expressed in (kWh), 𝑿
represents the row vector of variables characterizing the households (quantitative or qualitative), 𝜷 and
𝜹 are vectors of the parameters to be estimated, and 𝜺 is an error term. 𝑭𝑩 is the role of direct feedback
during the TICELEC experiment. We conducted a quasi-randomized assignment among households which
resulted in a new function:
𝑪𝒕 = 𝜷𝒊𝑿 + 𝜹𝑭𝑩𝒘 + 𝜺 (2)
where the variable 𝑭𝑩𝑾 describes the allocation of households to different groups: self-monitoring or
direct feedback. This choice is modelled as a standard treatment equation as follows:
𝑭𝑩𝑾 = 𝜸𝒁 + 𝝁 (3)
𝒘𝒊𝒕𝒉: {𝑭𝑩𝑾 = 𝟎 𝒊𝒇 𝑺𝒆𝒍𝒇 𝑴𝒐𝒏𝒊𝒕𝒐𝒓𝒊𝒏𝒈 𝒑𝒓𝒐𝒄𝒆𝒅𝒖𝒓𝒆
𝑭𝑩𝑾 = 𝟏 𝒊𝒇 𝑫𝒊𝒓𝒆𝒄𝒕 𝑭𝒆𝒆𝒅𝒃𝒂𝒄𝒌
where 𝒁 is a variable line vector influencing the household's allocation choice , such as Internet access
(required to check the EMD), the distance between the Internet connection and the electricity meter (if
more than 20 meters, the connection between the sensor and the plug might be more difficult), and the
type of meter (only electronic meters have this technical option - counter wheel meters cannot be fitted
with a smart device) and transmitting frequency of consumption; 𝜸 is a vector of the parameters to be
estimated and 𝝁 is the error term. We build a regression across our sample in order understand the
impact of the TICELEC project on the whole sample, and then deal with the regression type across our
different groups: G1 and G2+G3
(𝑭𝑩𝑾 = 𝟎 𝑒𝑡 𝑭𝑩𝑾 = 𝟏).
Below, we present the different groups of explanatory variables included in our model:
- Environmental concern: Environmental values and preferences have been discussed extensively as a
potential drivers of energy consumption and of potential behavioural change (Brandon and Lewis, 1999;
Poortinga et al., 2004). Environmental preference and belonging to a green non-governmental association
(NGA) is captured by the variable (GREEN).
11
-Dwelling: Type of dwelling (house, flat, mobile home, etc.) is an important variable with respect to energy
practices. For instance, Sweeney et al. (2013) discuss the existence of numerous barriers to energy-
efficient behaviour including high installation costs associated with energy appliances, length of time in
current home not sufficient to benefit from energy-efficient investment, split incentives when a
household is renting, amount of discretionary income, etc. Here, we include living in a house (HOUSE) and
being a house owner (Owner) as critical variables explaining both qualitative and quantitative changes in
energy-consumption practices.
- Housing characteristics: Some characteristics influence energy practices and might explain electricity
consumption (Gram-Hanssen and Bech-Danielsson, 2004; Gram-Hanssen, 2014). Following Gram-
Hanssen (2014), house size is included as an explanatory variable rather than electricity consumption per
square meter. We use house size (Surf) and the presence of a garden and pool (Pool/Garden) as potential
variables affecting electricity consumption.
- Habits: The existence of habitual practices (i.e. deeply entrenched behaviours) can explain energy
consumption in the home (Maréchal and Holzemer, 2015). These embedded practices may be related to
lifestyles and may be shared by certain groups (Laitner et al., 2009). Here we include simple practices
such as switching off lights in empty rooms (light off), using standby mode on appliances after use
(standby), and better use of the peak-load shifting (Peakloadshift) as potential markers of qualitative
changes in energy habits, and of learning.
- Occupant characteristics: The number of people in the household (adults and children) is a non-neutral
variable and is related to the family's everyday habits (Gram-Hanssen, 2014). Also, the generational
impact of age has been shown to be important (Chancel, 2014). We include as explanatory variables in
our econometric test, person type (Adult) or (Child).
- Equipment: Households' energy consumption is a socio-technical phenomenon, resulting from
interactions between the consumer and the technology (Lutzenhiser, 1993; Wilhite et al., 1996).
Identifying the nature of the equipment (e.g. electric space heating, water heating, space cooling,
appliances, lighting, ICT, etc.) is critical for understanding energy habits. We include adoption of eco-
efficient lights (efflights), presence of electric heating (ELECHEATING), and cooking by electricity
(ELECOOKING).

12
- Socio-economic status and income: The desire to demonstrate income can promote unsustainable
consumption (à la Veblen) or new ways of consuming which are ‘greener’ (Buensdorf and Cordes, 2008;
Viscusi et al., 2011). It has been shown that the variable income is positively related to energy
consumption. First, Martinsson et al. (2011: 23) discuss the fact that the cost of energy is less of a driving
force for higher income households due to a smaller effect of economic incentives). For instance classical
incentive systems, such as tariffs, may be less relevant for this group. Second, Vassileva et al. (2013) show
that high income may promote a more intense reaction to feedback. Higher income households may have
more opportunities to reduce their electricity consumption and may be less subject to rebound effects.
For these reasons, we select income as a potential driver of energy consumption (INCOME) along with
socio-economic status (sociogroup).
We replace the variable X with the selected explanatory variables:
𝑪𝟏 = 𝜷𝟎 + 𝜷𝟏𝑮𝑹𝑬𝑬𝑵 + 𝜷𝟐𝑯𝑶𝑼𝑺𝑬 + 𝜷𝟑𝑶𝑾𝑵𝑬𝑹
+ 𝜷𝟒𝑺𝑼𝑹𝑭+𝜷𝟓𝑷𝒐𝒐𝒍/𝑮𝑨𝑹𝑫 + 𝜷𝟔𝑨𝑫𝑼𝑳𝑻 + 𝜷𝟕𝑪𝑯𝑰𝑳𝑫 + 𝜷𝟖𝑰𝑵𝑪𝑶𝑴𝑬
+ 𝜷𝟗 𝒔𝒕𝒂𝒏𝒅𝒃𝒚 + 𝜷𝟏𝟎𝑳𝒊𝒈𝒉𝒕𝑶𝑭𝑭 + 𝜷𝟏𝟏𝑷𝒆𝒂𝒌𝒍𝒐𝒂𝒅𝒔𝒉𝒊𝒇𝒕 + 𝜷𝟏𝟐𝒆𝒇𝒇𝒍𝒊𝒈𝒉𝒕𝒔
+ 𝜷𝟏𝟑𝑬𝑳𝑬𝑪𝑯𝑬𝑨𝑻𝑰𝑵𝑮 + 𝜷𝟏𝟒𝑬𝑳𝑬𝑪𝑶𝑶𝑲𝑰𝑵𝑮 + 𝜷𝟏𝟓𝑰𝑵𝑪𝑶𝑴𝑬 + 𝜷𝟏𝟔𝒔𝒐𝒄𝒊𝒐𝒈𝒓𝒐𝒖𝒑
+ 𝜸𝑭𝑩𝑾 + 𝜺
𝑪𝟎 is year 2011, the period immediately prior to the experiment, and 𝑪𝟏 is the consumption recorded
over the period of the experiment (i.e. during year 2012). The difference between the two periods is
denoted ∆𝑪 .Thus we obtain:
∆𝑪 = 𝑪𝟎 − 𝑪𝟏 = 𝜷𝟎 + 𝜷𝟏𝑮𝑹𝑬𝑬𝑵 + 𝜷𝟐𝑯𝑶𝑼𝑺𝑬 + 𝜷𝟑𝑶𝑾𝑵𝑬𝑹
+ 𝜷𝟒𝑺𝑼𝑹𝑭+𝜷𝟓𝑷𝑶𝑶𝑳/𝑮𝑨𝑹𝑫𝑬𝑵 + 𝜷𝟔𝑨𝑫𝑼𝑳𝑻 + 𝜷𝟕𝑪𝑯𝑰𝑳𝑫 + 𝜷𝟖𝑰𝑵𝑪𝑶𝑴𝑬
+ 𝜷𝟗 ∆ 𝒔𝒕𝒂𝒏𝒅𝒃𝒚 + 𝜷𝟏𝟎 ∆ 𝒍𝒊𝒈𝒉𝒕𝑶𝑭𝑭 + 𝜷𝟏𝟏 ∆ 𝑷𝒆𝒂𝒌𝒍𝒐𝒂𝒅𝒔𝒉𝒊𝒇𝒕 + 𝜷𝟏𝟐 ∆ 𝒆𝒇𝒇𝒍𝒊𝒈𝒉𝒕𝒔
+ 𝜷𝟏𝟑𝑬𝑳𝑬𝑪𝑯𝑬𝑨𝑻𝑰𝑵𝑮 + 𝜷𝟏𝟒𝑬𝑳𝑬𝑪𝑶𝑶𝑲𝑰𝑵𝑮 + 𝜷𝟏𝟓𝑰𝑵𝑪𝑶𝑴𝑬 + 𝜷𝟏𝟔𝒔𝒐𝒄𝒊𝒐𝒈𝒓𝒐𝒖𝒑
+ 𝜸𝑭𝑩𝑾 + 𝜺
Our results show that all the groups studied reduced their electricity consumption very significantly
between 2011 and 2012. The G1 group reduced its consumption by 13% (1,078 kWh), G2 by 22.2% (1,783

13
kWh), and G3 by 23.3% (1,867 kWh) compared to consumption in the PACA region and Alpes Maritimes
which decreased by 1% over the same period. Our results for the three groups are significantly higher
than those found in other studies - and especially the G1 group where we did not expect such a large
reduction in consumption. This is an important result which we discuss further in Section 5.
The decrease in consumption for G1 and (G2+G3) is depicted in Figure 4.
Figure 4 : The decrease of electric consumption in G1 and feedback groups ( G2+G3)
The results in Table 2 tend to suggest that feedback plays a moderate role in decreasing electricity
consumption (see below).
Table 2: The main triggers of electricity consumption changes
More precisely, feedback is not the only variable affecting consumption; housing characteristics such as
surface area and presence of electric heating, as expected, are also critical and very significant.
Socioeconomic status also matters; being an employee is a significant explanatory variable. However,
belonging to a green association does not seem to be significant for triggering a change in electricity
consumption via a policy intervention.
An important, but somewhat puzzling result from our econometric analysis is the apparent importance
of peak-load shifting practices for explaining variability in saving between 2011 and 2012. In order to
understand this effect better, we examined the links between peak-load shifting and type of feedback
provided, in more depth. Figures 5 and 6 show a strong difference between G2 and G3 for the practice of
peak-load shifting. As we discuss below, this variable is best understood as a ‘marker’ of (induced) learning
(i.e. practising peak-load shifting requires some knowledge acquisition).
Figure 5: Peak-load shift in G 2
Figure 6 : Peak-load shift in G 3
14
5. Discussion of the results
Learning by looking
Overall, our results are fairly positive. Participants reported a positive experience from their participation
in the TICELEC project and seemed to be really engaged. The project seems to have succeeded in building
trust among participants, which overcome potential resistance to a new technical device and empowered
consumers to become active energy customers (for a similar view see Gangale et al., 2013; Verbong et
al., 2013). This positive outcome might be due also to feedback mechanisms; almost 90% of the
households in the two feedback groups referred to a willingness to look at and understand the ‘structure’
of their consumption. In other words, it seems that detailed feedback helped the individuals in the G2
and G3 groups to ‘make sense’ of their consumption (Berker, 2013), and to understand their practices
and their potential actions in more depth. Previous work has emphasized that 'carefully designed
feedback could enable users to readily understand the habits and routines that generate their household
patterns and thus make more concrete the viable energy saving actions available to them' (Buchanan et
al., 2015: 94 ). Thus, learning appears to be crucial, as suggested by the importance of peak-load shifting
for explaining the results in Table 2. In addition, this learning does not show a rapid decline, which
contrasts with other experimental studies which show that behavioural changes in peak periods does not
persist over the longer term (Houde et al., 2013).
In the present paper we argue that the type of feedback provided to G3 was more effective for inducing
learning3. A G3 participant explained in a meeting that 'with your device I suddenly realized what was the
problem with my consumption: my immersion heater that has both a thermostat problem and a
permanent scaling state impeding the consumption to be at a normal level…without your captor I could
have discovered by myself - but for sure after a long period of time'.
3 In line with the features discussed in Hargreaves et al. (2013), it should be noted that this was possible only because the feedback fitted with and was adjusted to the everyday life practices of the surveyed households. Only a few individuals from the G3 group perceived the setting as intrusive and only 3 were dissatisfied with the equipment.
15
Although our results confirm the greater efficiency of more sophisticated feedback (and thus the positive
impact of learning on energy savings), they do not stand out and the magnitude of the impact is small
when energy savings in G3 are compared to those achieved in G2 (22.2 % versus 23.3 %). The learning
must be related to something other than only the ability to move nomad captors. In order to examine
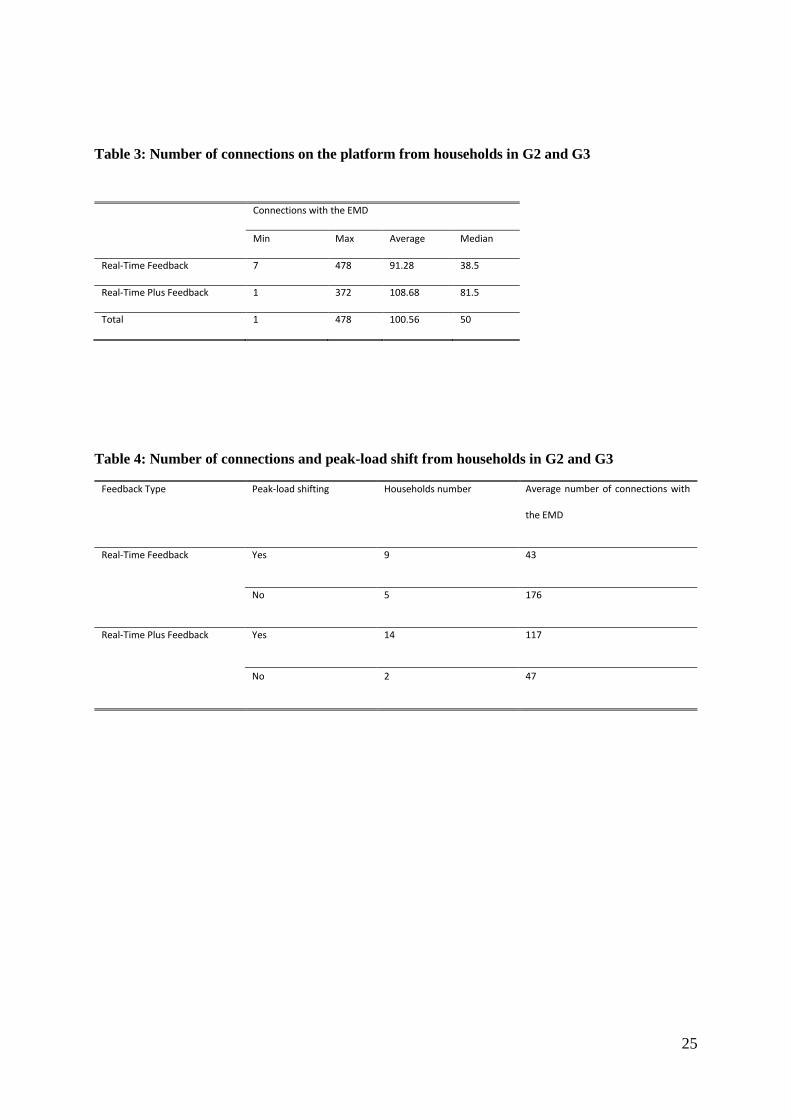
learning from another angle, we looked at the number of connections on the web-based platform (which
was available for both types of feedback). In line with our expectations, Table 3 shows that the average
number of connections is almost 20% higher in G3 than in G2 (108.68 vs 91.28).
Table 3: Number of connections on the platform from households in G2 and G3
In line with our argument, assessing learning based on the number of connections is more relevant when
analysed in relation to our key variable of peak-load shifting. However, our analysis should be considered
qualitative since it is based on comparing very small size sub-samples. Thus, caution is needed when
interpreting the results. Nevertheless, we consider that they provide some insights and are worth
reporting. Table 4 shows that pick-load shifting in the G3 group is more widespread than in the G2 group.
Table 4: Number of connections and peak-load shift from households in G2 and G3
Also, a larger proportion of the G3 group practices shifting (14 out of the 16 of G3 households and 9 out
of 14 of G2 households). Combining information on peak-load shifting with activity on the web-based
platform, we observe that the G3 shifters show many more connections (117) than either the G2 shifters
(43) or the G3 non-shifters (47). However, the highest average number of connections (176) is recorded
for the G2 non-shifters. A possible interpretation of these results is that the possibility of being able to
check the energy consumed by individual appliances (i.e. the G3 group) resulted in more of these
households learning to shift to off-peak consumption. This successful shifting seems to be accompanied
by a high number of connections, which suggests an active search for rationalisation, appliance by
appliance. This possibility was not available to the G2 group which would have required more information
in order to learn successfully about the benefits of shifting.
In sum, the higher proportion of shifters in G3 and the higher ‘quality’ of their shifting (depicted in the
March-July curves) suggest a higher level of learning enabled by the more sophisticated feedback.

16
Although this translated into only a moderately higher rate of energy savings (22.2% vs 23.3%), the higher
degree of actively acquired knowledge (i.e. through ‘learning by looking through connecting’) might lead
to a qualitatively distinctive type of energy saving.
Indirect learning without direct feedback
The results of our experiment show that all participants reduced their consumption, and learnt directly
from feedback or indirectly through self-monitoring. As discussed elsewhere, loss of interest among
consumers is one of the main issues related to the efficiency of in-home displays (IHDs). Attention tends
to diminish over time 'given that the success of feedback depends on user engagement, this loss of
interest is detrimental and may severely hamper the likelihood that IHDs will result in energy reductions
that persist in the long term' (Buchanan et al., 2015: 91). Thus, it could be expected that the design of the
TICELEC experiment would make G1 consumers frustrated and disinterested in the experiment since the
monitoring equipment did not directly promote learning. However, the large reductions in electricity
consumption within our sample (included in G1), suggests that all three groups were fully engaged, and
their attention was maintained throughout the project. One of the reasons for this was perhaps that the
team was perceived as trustworthy. As discussed elsewhere, trust and, specifically, 'integrity-based trust'
is a necessary condition for (and a probable a consequence of) the experiment generating energy savings
because 'If the source of a message seems untrustworthy, unfair or incompetent, people can be wary or
sceptical and either disengage, or react defensively to the information' (Frederik et al., 2015: 1388).
In addition to the general positive perception of the TICELEC experiment among the participants in all
three groups (as reported in our concluding survey), we observed active and real engagement of users to
make sense of and achieve a better understanding of their energy consumption practices. Our results
suggest that learning can occur without feedback, through empowerment and involvement in a learning
process. TICELEC was perceived as a big project which attracted and retained the attention of citizens. All
participants - with or without technologies - made their best efforts during the experiment to overcome
potential frustrations (as noted in relation to G1) and to sustain their initial motivation. This result chimes
with Fischer (2008) who concludes that the most efficient feedback interventions are those that are
coupled with other policies. Here, the involvement of the municipality seems to have played the role of
informing and motivating participation. Participants were actively engaged during meetings - and

17
especially those in the G1 group who tried to obtain information on energy practices, and discussed it
with participants from the other groups. This triggered a kind of indirect learning and allowed participants
to make sense of their daily energy consumption. G1 included highly intrinsically motivated participants,
who managed to reduce their consumption by 13% with no feedback. The G2 and G3 groups
demonstrated both intrinsic and extrinsic motivation, and an ability to understand the detailed feedback
which induced both a change of their practices and a substantial reduction in their energy consumption.
Thus, all groups learnt, and groups 2 and 3 made significant and visible changes to their energy practices.
Learning to reduce conspicuous consumption
Learning is highly contextual and depends on the household’s characteristics. For instance, Vassileva et
al. (2013) show that it is critical to identify households with larger savings potential because the impact
of a given experiment can vary greatly according to the socio economic profile of the group involved. Our
results echo this finding since our sample is characterized by high income and high levels of electricity
consumption. High income participants consume more energy, but are able to reduce their consumption
due a more flexible electricity reduction elasticity curve (Espey and Espey, 2014). In other words, their
overconsumption is easily regulated if there is an intention to act in this direction. Our econometric test
suggests that the house size has a significant impact on the amount of energy savings induced by the
experiment but, but that income on its own (compared to house size) does not seem to be a determinant.
This is in line with Gram-Hanssen (2014) who highlights that housing characteristics matter because house
size may be correlated with other characteristics such as age and income. Our experiment served to reveal
some sources of overconsumption. Participants were made more aware of their potential wasting of
energy, and were enabled to make more sense of their practices while being free to learn by themselves
and to act independently. However, as Veblen points out, conspicuous consumption is a part of society
and is entwined with various values and social norms which are difficult to change. Social norms appear
to be very important, and Veblen used the term ‘conspicuous consumption’ to explain how consumption
is used to gain and signal social status. An important point here is that consumption integrates a potential
element of waste (waste of time, effort, and of goods) (Veblen, 1899: 85). This means that individuals and
groups are unaware of some conspicuous consumption behaviours because they are built into their daily
18
lives, and are based on historical consumption and social behaviours. Understanding this is critical for a
better understanding of the tenets of household energy consumption and for an effective
implementation of energy saving policies (see Maréchal and Holzemer, 2015). The results of our
experiment support this argument and show the importance of taking account of the personal
characteristics of participants when providing feedback. Choosing among segments of the population may
prove to be an efficient strategy since it is likely that individuals will exhibit different levels of involvement
according to their personal profiles (see Fischer, 2008; Gangale et al., 2013, Vassileva et al., 2013, for a
similar view).
6. Conclusion and policy implications
The results of our experiment show that all participants reduced their consumption and learnt either
directly from feedback or indirectly through self-monitoring. We argue that the amount of energy savings,
which is large compared to similar experiments, can be explained first, by the specificity of our sample
(i.e. high income, high level of consumption) which allows for potentially large energy savings, and second
high levels of trust and involvement of participants.
Thus, the context of the TICELEC experiment is very specific and produced different patterns of learning.
In line with the abundant literature on feedback, 'learning by looking' with direct feedback was shown in
our study to be very efficient. However, the unexpected reduction in energy use by the G1 group shows
that 'learning by looking' was reinforced by indirect learning through a form of social emulation and
increased motivation based on the active engagement of households in that group. We would highlight
the role of indirect learning (i.e. without the aid of direct feedback and technology) as a facilitating
condition for future experiments. This type of learning, which is highly dependent on initial conditions
and the building of trust, and is difficult to replicate needs more detailed investigation in order to obtain
a better understanding the effect of the social dynamics in relation to energy-reduction interventions that
involve some degree of collectivity.
Finally, it must be remembered that learning involves an inherent qualitative dimension. Although, at first
glance, the quantitative effects on electricity consumption (i.e. the difference in the reductions achieved
by the G2 and G3 groups) may seem insignificant, the added-value of providing feedback at the appliance

19
level should not be overlooked. Our study shows is that the types of learning induced are qualitatively
distinct, as illustrated by the curves related to peak-load shift. Further research could assess whether this
qualitatively distinct learning process leads to savings that are more persistent over time.
References
Berker, T., 2013. “In the morning I just need a long, hot shower”: a sociological exploration of energy sensibilities in Norwegian bathrooms. Sustainability: Science, Practice, & Policy 9 (1), 57-63. Bonino, D., Corno, F., De Russis, L. 2012. Home energy consumption feedback: a user survey. Energy and Buildings 47, 383-393. Börner, D., Kalz, M., Specht, M. 2013. Beyond the channel: A literature review on ambient displays for learning. Computers & Education 60, 426-435. Brandon, G., Lewis, A., 1999. Reducing household energy consumption: A qualitative and quantitative field study. Journal of Environmental Psychology 19 (1), 75–85. Buensdorf, G., Cordes, C., 2008. Can sustainable consumption be learned? A model of cultural evolution. Ecological Economics 67 (4), 646-657. Buchanan, K., Russo, R., Anderson, B., 2015. The question of energy reduction: The problem(s) with feedback. Energy Policy 77, 89–96 Burgess, J., Nye, M., 2008. Rematerialising energy use through transparent monitoring systems. Energy Policy 36, 4454–4459. Carroll, E., Hatton, E., Brown, M., 2009. Residential energy use behavior change pilot, Research study No. CMFS project code B21383, USA: Franklin Energy. Chancel, L., 2014. Are younger generations higher carbon emitters than their elders? Inequalities, generations and CO2 emissions in France and in the USA. Ecological Economics 100, 195-207. Darby, S., 2006. The effectiveness of feedback on energy consumption, A review for DEFRA of the literature on metering, billing and direct displays. UK: Environmental Change Institute, University of Oxford. http://www.eci.ox.ac.uk/research/energy/downloads/smart-metering-report.pdf Darby, S., 2010. Literature review for the Energy Demand Research Project. UK: Environmental Change Institute, University of Oxford. https://www.ofgem.gov.uk/ofgem-publications/59113/sd-ofgem-literature-review-final-081210.pdf (accessed September 14, 2015). Ehrhardt-Martinez, K., Donnelly, K. A., Laitner, J. A., 2010. Advanced metering initiatives and residential feedback programs: a meta-review for household electricity-saving opportunities (No. E105). USA: American Council for an Energy-Efficient Economy (ACEEE). Espey, J., Espey, M., 2004.Turning on the lights: a meta-analysis of residential electricity demand elasticities. Journal of Agricultural and Applied Economics 36 (1). 65-81. Ek, K., Söderholm, P., 2010. The devil is in the details: Household electricity saving behavior and the role of information. Energy Policy 38/3, 1578-1587.

20
EPRI, 2009. Residential electricity use feedback: a research synthesis and economic framework, Electric Power Research Institute, Final report No. 1016844. Frederiks, E.R., Stenner, K ., Hobman E.V., 2015. Household energy use: Applying behavioural economics to understand consumer decision-making and behaviour. Renewable and Sustainable Energy Reviews 41, 01, 1385-1394. Fischer, C., 2008. Feedback on household electricity consumption: a tool for saving energy?. Energy Efficiency 1(1), 79-104. Gangale, F., Mengolini, A., Oneyyi I., 2013. Consumer engagement: an insight from smart grid projects in Europe. Energy Policy, 60, 621-628. Gram-Hanssen, K. , Bech-Danielsen, C., 2004. House, home and identity from a consumption perspective. Housing, Theory and Society, 21, 17-26. Gram-Hanssen, K., 2014.Existing buildings - Users, renovations and energy policy. Renewable Energy, 61, January, 136-140. Hargreaves, T., Nye, M., Burgess, J., 2010. Making energy visible: A qualitative field study of how householders interact with feedback from smart energy monitors. Energy Policy 38 (10), 6111- 6119. Hargreaves, T., Nye, M., Burgess, J., 2013. Keeping energy visible? Exploring how householders interact with feedback from smart energy monitors in the longer term. Energy Policy 52, 126-134. He, H. A., Greenberg, S., Huang, E. M., 2010. One size does not fit all: applying the transtheoretical model to energy feedback technology design. Proceedings of the 28th international conference on Human factors in computing systems - (927-936). Presented at the Human factors in computing systems, Atlanta, Georgia, USA. Houde, S., Todd, A., Sudarshan, A., Flora, J. A., Armel, K.C., 2013. Real Time Feedback and electricity consumption: a field experiment assessing the potential for savings and persistence. The Energy Journal, 34, (1) , 87-102. Karjalainen, S., 2010. Consumer preferences for feedback on household electricity consumption. Energy and Buildings, 43(2-3), 458-467. Krishnamurti, T., Davis, A., Wong-Parodi, G., Wang, J., Casey Canfield C., 2013. Creating an in-home display: Experimental evidence and guidelines for design. Applied Energy 108, 448-458. Laitner, J. A., Ehrhardt-Martinez, K., McKinney, V., 2009. Examining the Scale of the Behaviour Energy Efficiency Continuumin. ECEEE 2009 Summer Study: Act! Innovate! Deliver! Reducing Energy Demand Sustainably. La Colle sur Loup, France: European Council for an Energy-Efficient Economy. Lutzenhiser, L., 1993. Social and Behavioural Aspects of Energy Use, Annual Review: Energy and Environment 18, 247 -289. Maréchal, K., 2010. Not irrational but habitual: The importance of “behavioural lock-in” in energy consumption. Ecological Economics, 69, (5), 1104–1114. Maréchal, K., Holzemer, L., 2015. Getting a (sustainable) grip on energy consumption: the importance of household dynamics and ‘habitual practices’. Energy Research and Social Science, 10, 228-239. Martiskainen, M., 2007. Affecting consumer behaviour on energy demand, Final report to EdF Energy, UK: Sussex Energy Group - SPRU - Science and Technology Policy Research.
21
Martiskainen, M., Coburn, J., 2011. The role of information and communication technologies (ICTs) in household energy consumption-prospects for the UK. Energy Efficiency, 4, (2), 209-221. Martinsson, J., Lundqvist, L.J, Sundström, A., 2011. Energy saving in Swedish households. The (relative) importance of environmental attitudes. Energy Policy 39, 5182-5191. Ofgem, DECC 2011. Energy Demand Research Project- Final Analysis, June 23rd. https://www.ofgem.gov.uk/ofgem-publications/59105/energy-demand-research-project-final analysis.pdf Pasche, M., 2014. Soft Paternalism and Nudging - Critique of the Behavioral Foundations., MRPA Working papers Jena, Germany. Poortingaa, W., Steg, L., Vlek, C., Wiersma, G., 2003. Household preferences for energy -saving measures: a conjoint analysis. Journal of Economic Psychology 24, 49-64. Steg, L., 2008. Promoting household energy conservation. Energy Policy, 36(12), 4449-4453. Sweeney, J., Kresling, J., Webb, D., Soutar, G., Mazzarol, T., 2013. Energy saving behaviours: Development of a practice-based model. Australia. Energy Policy, 61, 371-81. Vassileva, I., Odlare, M., Wallin, F., Dahlquist, E., 2012. The impact of consumers' feedback preferences on domestic electricity consumption. Applied Energy 93, 575-582. Vassileva, I., Dahlquist, E., Wallin, F., Campillo, J., 2013. Energy consumption feedback devices’ impact evaluation on domestic energy use. Applied Energy, 106, 314-320. Veblen, T., 1994 [1899]. The Theory of Leisure Class. In The Collected Works of Thorstein Veblen (Vol. 1). Routledge, London. Verbong, G., Sengers, F., Beemsterboer, S., 2013. Smart Grids or Smart Users? Involving users in developing a low carbon electricity economy. Energy Policy, 117-125. Viscusi, W.K., Huber, J., Bell, J., 2011. Promoting recycling: Private values, social norms, and economic incentives. The American Economic Review 103 (1), 65-70. Wilhite, H, Nakagami, H., Masuda, T., Yamaga Y., Haneda H., 1996. A cross-cultural analysis of household energy use behaviour in Japan and Norway. Energy Policy 24(9), 795-803.
22
Table 1: Descriptive variables
Variables Unit
Full Sample
Self-Monitoring Direct Feedback
Mean Std.dev Min Max Mean Mean
Being part of an environmental association 0/1 0,08 0,27 0 1 0,09 0,07
Age Number 46,79 12,14 24 84 48,64 41,4
Accommodation type - Apartment 0/1 0,25 0,43 0 1 0,14 0,37
Owner 0/1 0,86 0,35 0 1 0,91 0,80
Living area Squ. M. 115,49 61,82 20,00 380,00 134,03 93,87
Pool / Garden 0/1 0,42 0,50 0 1 0,43 0,40
Number of adults Number 2,26 0,97 1,00 5,00 2,40 2,10
Number of children Number 0,63 0,86 0,00 3,00 0,51 0,77
Electric heating 0/1 0,68 0,47 0 1 0,66 0,70
Electric cooking system 0/1 0,72 0,45 0 1 0,71 0,73
Average income by year Euros 55,392.69 27,214.0 94,00.00 112,175.00 58,740.00 51,487.50
Socio-economic group Artisans, merchants 0/1 0,05 0,21 0 1 0,06 0,03
Socio-economic group- Senior management 0/1 0,69 0,47 0 1 0,63 0,77
Socio-economic group - employees 0/1 0,09 0,29 0 1 0,09 0,10
Socio-economic group - associate professionals 0/1 0,05 0,21 0 1 0,06 0,03
Socio-economic group - Retired 0/1 0,12 0,33 0 1 0,17 0,07

23
Table 2: The main triggers of electricity consumption changes:
the explanatory variables in TICELEC
Variables Parameter estimation
Feedback 1606,543
(1,71)*
Being part of an environmental organization 1646,250
(1,03)
Accommodation type - Apartment -783,025
(0,57)
Owner -860,812
(0,60)
Surface 35,699
(3,94)***
Pool / Garden -148,433
(0,15)
Number of adults -829,801
(1,61)
Number of children -360,913
(0,73)
Using standby mode after use 714,841
(0,73)
Switching off the lights in empty rooms (+) 1875,336
(1,19)
Switching off the lights in empty rooms (++) 4109,159
(1,84)*
Peak-load shift (-) -5923,266
(2,80)***
Peak-load shift (+) 5881,282
(3,03)***
Peak-load shift (++) 5264,475
(2,47)**
Adoption of eco-efficient lights 51,680
(0,82)
Electric heating -2404,070
(2,58)**

24
Electric cooking system -1320,449
(1,22)
Income -0,031
(1,50)
Socio-economic status : senior management 2975,717
(1,51)
Socio-economic status : employees 6345,004
(2,64)**
Socio-economic status : associate professionals 4023,343
(1,38)
Socio-economic status : Retired 2914,915
(1,35)
Constant -8330,960
(2,13)**
R2 0,52
N 65
Note: * p<0,1; ** p<0,05; *** p<0,01
Legend: (-) No change of habits (habits inefficiencies): households never had sustainable habits, in either 2011 or 2012.
(+) No change of habits (habits efficient): households practiced sustainable habits in either 2011 or 2012 and these did not change.
(++) Improvement of habits: households had no sustainable habits in 2011 but adopted them in 2012
25
Table 3: Number of connections on the platform from households in G2 and G3
Connections with the EMD
Min Max Average Median
Real-Time Feedback 7 478 91.28 38.5
Real-Time Plus Feedback 1 372 108.68 81.5
Total 1 478 100.56 50
Table 4: Number of connections and peak-load shift from households in G2 and G3
Feedback Type Peak-load shifting Households number Average number of connections with
the EMD
Real-Time Feedback Yes 9 43
No 5 176
Real-Time Plus Feedback Yes 14 117
No 2 47
26
Figure 1: The energy-monitoring devices (EMD) for G2 and G3

27
Figure 2 : Households level of income : our survey and regional level
* Our survey (n=65)
** Households in the region PACA (Provence Alpes Côte d’azur) from the Ministry of Economy and Finance
0,0%
10,0%
20,0%
30,0%
40,0%
50,0%
60,0%
Less than 1250
€/month
2240 €/month 5677 €/month More than 8126
€/month
No answer
5,6%
20,8%
60,0%
8,0%5,6%
45,1%
40,7%
12,7%
1,5% 0,0%
TicElec Households * PACA Households **
28
Figure 3: Timeline and main events in the TICELEC project

29
Figure 4 : The decrease of electric consumption in G1 and feedback groups ( G2+G3)

30
Figure 5: Peak-load shift in G 2
Figure 6 : Peak-load shift in G 3

31

![Learning Reliable Policies in the Bandit Setting with ...ceur-ws.org/Vol-2429/paper7.pdfNote that unlike in [Sani, Lazaric, and Munos, 2012b], the empirical estimation of the variance](https://static.fdocuments.in/doc/165x107/60cbfb3b7e28973efb661b03/learning-reliable-policies-in-the-bandit-setting-with-ceur-wsorgvol-2429-note.jpg)


![[XLS]Permit Statistical Report - New York City · Web viewLUBO HADJIPETKOV METROBUILD LLC 142 DUANE ST. OWNERS CORP C/O MA NED KENDEL 115 EAST 60TH STREET 1080443 CENTRAL PARK SOUTH](https://static.fdocuments.in/doc/165x107/5ae4bdbe7f8b9a87048ba888/xlspermit-statistical-report-new-york-viewlubo-hadjipetkov-metrobuild-llc-142.jpg)