What Do Employees Really Want? Preference-Performance ...
47
What Do Employees Really Want? Preference-Performance Inconsistencies Regarding Work Incentives * Sofia M. Lourenço ISEG/ULisboa and CSG/Advance Research Center [email protected] Cláudia F. Niza * We thank James Werbel, reviewers and participants at AOM 2015 for helpful comments. We gratefully acknowledge financial support from FCT – Fundação para a Ciência e Tecnologia (Portugal), research grant PTDC/EGE-GES/119607/2010 (national funding). All errors remain our own.
Transcript of What Do Employees Really Want? Preference-Performance ...

What Do Employees Really Want?
Preference-Performance Inconsistencies Regarding Work Incentives*
Sofia M. Lourenço
ISEG/ULisboa and CSG/Advance Research Center
Cláudia F. Niza
* We thank James Werbel, reviewers and participants at AOM 2015 for helpful comments. We gratefully
acknowledge financial support from FCT – Fundação para a Ciência e Tecnologia (Portugal), research grant
PTDC/EGE-GES/119607/2010 (national funding). All errors remain our own.
What Do Employees Really Want?
Preference-Performance Inconsistencies Regarding Work Incentives
ABSTRACT
Employee preferences for work incentives have been extensively examined under the assumption
that these preferences provide valuable information for the design of compensation systems.
However, the extent to which providing incentives to match these preferences influences actual
performance has been overlooked. We use a longitudinal field experiment to examine whether
preferences for different incentives influence behavior once the incentive is (or is not) provided.
Specifically, we examine ex-post objective performance data according to the ex-ante incentive
preferences, collected via a questionnaire in the pre-experimental period. The between-subjects
experimental manipulations include one of three incentive motivators: (a) money, (b) feedback
and (c) recognition. Our results show several inconsistencies between stated preferences and
revealed performance behavior. We find that (1) employees report a significantly higher
preference for money and feedback compared to recognition but only money and recognition
improve performance with an equivalent effect size; (2) performance is not higher when
employees are matched with their preferred incentive, except for feedback; and (3) there is no
evidence of a learning effect as the consistency between ex-ante preferences and ex-post
performance is not improved with experience.
Keywords: Incentives; Preferences; Performance; Motivation; Field Experiment

1
What Do Employees Really Want? Preference-Performance Inconsistencies Regarding
Work Incentives
Seminal work by Kovach (1980, 1987) and Heath (1999) suggests that managers
misapprehend what motivates employees. These studies expose that managers exhibit an extrinsic
[monetary] incentives bias, defined by a tendency to overestimate the importance employees
place in monetary rewards and underestimate the valuation that employees give to nonmonetary
incentives such as opportunities for increasing competency or social esteem. These results
spurred the idea that managers tend ‘to push the wrong levers and to develop incentive programs
that don't reflect employee needs’ (Morse 2003) by misunderstanding what motivates employees
- or what employees report to motivate them.
However, are employees better judges of what drives their performance in the workplace?
Over the years, employee surveys have depicted employees’ incentive preferences (Wiley, 1997;
Chiang & Birtch, 2005, 2006, 2012; Bonsdorff, 2011) under the assumption that this would be a
crucial piece of information for organizations.
This standpoint is aligned with the most prominent views in different social sciences
assuming individuals have a stable and well-defined preference structure and that their behavior
is the product of those preferences (Jensen & Meckling, 1979; Ajzen 1991; Lazear, 2000; Shapiro
2005). This premise dominates most conceptual approaches regarding the human behavior in the
workplace. However, there is a lack of evidence regarding the extent to which ex-ante incentive
preferences actually influence ex-post performance under different incentive schemes.
Nevertheless, in several other contexts, research from behavioral decision theory
(Lichtenstein & Slovic, 1995) has demonstrated that preferences can be unstable, volatile and
prone to inconsistencies such as elicitation procedures, temporal framing or the presence of
tangible consequences (Simonson, 2008; Ariely et al 2006; Ariely & Norton, 2007).

2
Overall, the available research in management has been silent on how baseline
preferences for different incentives influence performance when incentive programs are
implemented. Can performance be predicted by incentive preferences? Does the delivery of the
preferred incentive lead to a better performance? Or are incentive preferences good predictors of
performance only after individuals had some experience with incentive schemes? To the best of
our knowledge, these critical questions remain unanswered several decades after Kovach (1980,
1987) and Heath (2003).
Using a longitudinal field experiment, we compare stated preferences for incentives,
collected via a questionnaire in the pre-experimental period, with revealed behavior (objective
performance data) in the experimental period once a new incentive is introduced. Performance is
taken as the proxy for revealed (not stated or self-reported) preferences about incentives (List &
Gallet 2001; List et al 2004; Ajzen et al 2004; Braga & Stramer 2005). Although revealed
preferences are typically analyzed as the behavioral choices people make (Murphy et al 2005;
Miller et al 2011), in an employment setting we take performance levels under some incentive
scheme as the observable behavioral preference for that incentive ceteris paribus. To date there is
no study that examines stated versus revealed preferences (in the form of behavioral
performance) within subjects. Survey data about preferences and experimental evidence about
performance under incentive schemes are typically presented in different studies using distinct
employee samples.
This study analyzes whether ex-ante stated preferences influence the effect of different
incentives on ex-post behavior (performance), both when individuals receive the incentive they
prefer and when they do not. The experimental manipulation entails three incentive motivators
commonly used by organizations (Bandura, 1986; Kluger & DeNisi, 1996; Stajovic & Luthans

3
1997, 2001, 2003; Rynes et al 2005). These conditions (between-subjects) refer to (a) money, (b)
feedback or (c) recognition. Additionally, we investigate the potential moderating role of
experience as a condition that may increase the consistency between ex-ante stated preferences
and ex-post performance using the proxies of tenure and past experience with incentives.
We find several inconsistencies between stated incentive preferences and revealed
performance behavior. We find that individuals’ preferred incentives may not be the ones that
actually improve their performance. We also show that performance is not higher when
employees are matched with their most preferred incentive regardless of how the preferred
incentive is elicited. Moreover, neither tenure nor past experience with the incentive improves the
consistency between ex-ante preferences and ex-post performance. We confront these results with
the various competing explanations for why inconsistencies may occur between stated versus
revealed preferences and propose that the mechanism underlying these inconsistencies is likely to
be some form of lay [workplace] rationalism (Hsee et al 2003) characterized by overweighting
incentives that appear more rational or objective.
This paper makes critical contributions to a variety of management disciplines (Gupta &
Shaw, 2014; Bonner & Sprinkle, 2002; Franceschelli et al 2010; Stajovick & Luthans 2001).
First, we add to the literature by analyzing preference inconsistencies in a workplace context, a
setting in which preference-behavior gaps are under researched (e.g., Kanheman & Thaler 1991).
To the best of our knowledge, no prior study as analyzed how preferences for work incentives
actually translate into performance behavior when that incentive, or a different incentive, is
provided. Second, we show limitations to the predictive validity of reported incentive preferences
and caution against taking stated preferences as the basis for the design of compensation and
incentive schemes. If management and human resources policies aim to improve work
performance they should not take the preferences of the employees at face value. Third, our

4
results show no evidence of learning effects regarding preferences for work incentives. This
insight suggests that some form of intervention may be required to make employees more aware
of their preference inconsistencies. Fourth, this study provides experimental field evidence
examining objective performance data and incentive preferences. A better understanding of those
preferences on the effectiveness of work incentives is a critical element for effective human
resources management (Gerhart & Fang, 2014; Gupta & Shaw, 2014), strategic alignment
(Chiang et al, 2012; Baumman & Stieglitz, 2014) and organizational performance (Brown et al
2003). Nevertheless, experimental evidence has been severely lacking in this research agenda
(Franceschelli et al 2010), particularly in natural organizational settings.
This paper proceeds as follows. We start by reviewing the key literature from
management, economics and psychology about compensation and work motivation that predict to
a large extent a consistency between ex-ante stated preferences and ex-post performance. We
then turn to the literature from behavioral decision theory about preference construction and
stability to expose the limitations of taking reported preferences at face value as predictive of
behavior. The methods and result sections are presented next. We finish by discussing our results
and implications for future research and practice.
LITERATURE REVIEW
The prevalent hypothesis for preference-behavior consistency
Under rational choice theories (Scott, 2000), individuals are conceptualized as being fully
aware of their endogenous preferences. These individuals have both the motivation and the

5
ability to choose between competing alternative scenarios the option that maximizes their utility
(Coleman & Fararo, 1992). Individuals are seen as motivated by the wants or goals that express
their preferences. They act within specific, given constraints and on the basis of the information
that they have about the conditions under which they are acting. Rational choice theories hold
that individuals anticipate the outcomes of alternative courses of action and choose the alternative
that is likely to provide them the greatest utility. Rational choice is the basis of agency theory
(Jensen & Meckling, 1979; Einsenhardt, 1989; Shapiro 2005), which is the main theoretical
framework guiding research in economics about compensation and incentive effects (Lazear,
2000). Agency theory assumes that both parties to the employment relationship are utility
maximizers. Incentive preferences matter for organizations under the assumption that agents are
rational: employees know what best motivates them at work and act upon this information.
Although, most research from organizational behavior and psychology does not share the
strict assumptions of rational choice theories it makes ultimately similar predictions. Theory of
reasoned action (Fishbein 1979), theory of planned behavior (Ajzen 1991) and in general all
expectancy value theories (Vroom, 1954) consider behavior as a deliberative process and choices
result from a calculation of expected benefits. Hence, these theories are ‘rational’ theories in the
sense that behavior is conscientious, deliberative and under peoples’ control. People can self-
report accurately what they prefer, that is, what they like (attitudes) and want (intentions), and
these are considered good proximal determinants of behavior. Content theories of motivation,
represented by Maslow (1970), Alderfer (1972), Herzberg (1966) and McClelland (1976),
generally assert that people have different needs that should be addressed at work. Incentives and
other forms of organizational design should be used to motivate employees and promote work
satisfaction. Thus, these theories implicitly consider that fulfilled needs (i.e. preferences) should
improve performance.
6
In contrast to these broad theories, contingency theory in management (Luthans & Stewart
1977; Kristof‐Brown et al 2005) states that the structure and process of an organization as well as
its members must fit the context (characteristics of the organization's culture, environment,
technology, size, or task). The key concept in a contingent proposition is fit (Drazin & Van de
Ven 1985) whether this is person-job fit, person-environment fit or person-task fit. The
implication that can be drawn from contingency theory to the analysis of the consistency between
ex-ante preferences and ex-post performance is that employees with different characteristics are
expected to respond differently to different incentives. Thus, incentives should match people’s
preferences (Delery & Doty 1996), that is, there should be a fit between the incentives individuals
want and the incentives individuals receive to produce positive effects in performance.
Thus, this overview of the literature suggests consistency between stated references and
performance behavior when preferences are met – and this hypothesis is shared by conceptual
approaches that differ in many important aspects. Although distinct in their conceptualization of
the determinants of behavior in the workplace, these theories do not make different predictions
regarding the expected predictive validity of reported preferences to explain behavior.
However, empirical evidence regarding this consistency assumption is lacking. The
empirical literature shows abundant evidence regarding preference for work rewards or incentives
from panel data collected with cross-country surveys (e.g., General Social Survey GSS,
International Social Survey Program ISSP, European Social Survey ESS) (Kovach 1987; Wiley
1997; Morse, 2003; Clark 2005; Dewhurst et al 2009). Overall, this research tends to examine
incentive preference for employees with no significant variable pay component and generally
shows that the strongest preferences are for nonmonetary incentives as doing an “important
work” or “being recognized” in their job. Research more specifically targeting jobs with high
variable pay components (as salesforce) shows that incentive preferences reveal a more balanced

7
mix between monetary and nonmonetary incentives but with monetary incentives generally
taking the lead (Ingram & Bellenger 1983; Bellenger et al 1984; Chonko et al 1992; Lopez et al
2006; Analoui 2000). Nevertheless, to date, this evidence does not show whether these
preferences translate (or not) into work performance. We can only infer that the absence of any
discussion about possible inconsistencies or discrepancies in self-reported preferences in these
studies, signals the assumption that ex-ante preferences are predictive of ex-post performance.
Overall and according to the main theoretical approaches and empirical evidence in the
management literature, we present the following hypotheses:
H1a. Stated incentives preferences will be consistent with revealed preferences i.e., preferred
incentives will be associated with higher performance.
H2a. When incentives preferences are met performance will improve.
Evidence for preference inconsistencies
Although most theoretical frameworks in economics, management and psychology predict
– in more or less explicit terms – a significant consistency between stated preferences and
behavior, differences between what people say and do have been identified. In reasoned action
theories, attitude-intention-behavior gaps have been recognized (Sheeran et al 1999; Sheeran
2002; Gollwitzer et al 2009). In economics, the difference between stated (reported) and revealed
(behavior) preferences is often referred to as hypothetical bias (Ajzen et al 2004; List & Gallet
2001; List et al 2004). Nonetheless, these gaps are not interpreted as ‘inconsistencies’ but as sign
that there are boundary conditions in the theories, that is, the models work better for behaviors
that are e.g., more immediate, more habitual or less controversial.

8
Yet one of the main conclusions from behavioral decision research is that people’s
preferences are often constructed in the process of elicitation and may depend on several external
influences rather than from an internal preference structure (Lichtenstein & Slovic, 1995). Unlike
most well-established theoretical phenomena in management research, the literature on
behavioral decision theory tends to acknowledge that preferences can be volatile and prone to
several inconsistencies (Simonson, 2008) – instead of stable and given for each individual (Ariely
et al 2006; Ariely & Norton, 2007).
Although the evidence for preference inconsistencies is not grounded on strong
conceptualization efforts by contrast to the more theoretically robust hypothesis for preference-
behavior consistency, many empirical irregularities have been reported. Overall, this evidence,
collected in settings different from the workplace, suggests that preferences exhibit inconsistent
patterns. For our work, these findings suggest that performance under a particular incentive may
not be a function of initially stated preferences.
Preference inconsistencies can be originated from several different sources (Harrison &
Rutström 2008) and can be organized in three main categories of explanations: forecasting bias,
different decision modes and lay rationalism. The first category includes the majority of
explanations proposed for preference inconsistencies and it is related to forecasting
mispredictions. In this first category there are three main arguments. First, ex-ante evaluations are
typically expressed in relation to hypothetical future events, which may be mentally constructed
at a too high abstract level to correspond to actual preferences (Robson & Samuelson, 2011).
Construal level theory (Trope & Liberman, 2003) proposes that in construing a distant scenario,
people would be more likely to use stereotypes rather than internal information, generalized
scripts rather than more concrete, non-schematic details and vague rather than situation-specific
goals. Because when thinking about the future irrelevant or inconsistent details are omitted from

9
the abstract representation (Liberman et al 2002), incentive preferences expressed about possible
future incentive programs may be expected to be simpler, less ambiguous, and more prototypical
than concrete representations. Second, it could also be the case that people are not fully aware of
what motivates them and reported preferences may have a negative or no association with
performance (Nisbett & Wilson 1977). Some studies have shown that expressing a preference
may rebound because the act of choosing might actually induce a preference change (Brehm,
1956; Egan et al 2007; Lieberman et al 2001). The underlying motive for this is that introspecting
about one’s preferences may lead people to divert attention to criteria they initially did not
consider (Wilson & Schooler 1991; Wilson et al 1993). Exposing employees to a situation in
which they have to introspect about their preferences for work incentives – as in a questionnaire–
may facilitate the consideration of different utility gains from distinct incentives which in turn
may prompt an internal preference shift with deferred effects. Thirdly, what is wanted at the onset
may not be what is later liked (Dai et al 2010). Studies on affective forecasting (Wilson and
Gilbert 2003) and projection bias (Loewenstein et al 2003) show that people are often
disappointed by the very things they thought they wanted. People routinely mispredict how much
pleasure or displeasure future events will bring and, as a result, sometimes work to bring about
events that do not maximize their happiness (Gilbert et al. 1999). People have been shown to be
wrong about how their positive or negative reactions to future events, particularly if what unfolds
is different from what they had imagined (Chen & Risen 2010). The implication of this research
is that people may believe they would not perform better under a certain incentive , but in fact the
motivational force of that incentive may be stronger than initially predicted.
A second group of explanations is related to the decision mode in which preferences are
reported versus how preferences are experienced. On one hand, inconsistencies can come from
the introduction of real stakes. Incentive schemes in natural organizational settings reflect ‘real
10
stakes’ and have been shown to be truth-revealing, i.e., exposing real behavioral preferences
(Berg et al 2010). These ‘real stakes’ are typically not present when employees self-report their
incentive preferences. Without real incentives, subjects’ preferences may be more liable to
elicitation methods but under tangible consequences, individuals’ behavior is more consistent
with their ‘true’ stable underlying preferences (Berg et al 2010). Therefore, introducing incentive
programs with tangible benefits or costs after eliciting employees’ self-reported preferences may
induce a preference shift because individuals face real consequences. On the other hand, Hsee
and Zhang (2004) propose that choices and predictions are often made in the joint evaluation (JE)
mode where individuals compare multiple options or alternatives. On the other hand, the actual
experience typically takes place in the single evaluation or separate evaluation (SE) mode, in
which experiencers face only the option or scenario they or others have chosen for them. When
presented with different options people can easily compare alternative utilities but in isolation
people do not have a precise idea of exactly how good or how bad the option they are
experiencing is. For our case, this implies that when employees self-report preferences between
different incentives they are in JE but when they are allocated to an incentive condition they are
in SE which may create inconsistencies between stated and revealed preferences (behavior). Hsee
and Zhang (2004) propose that this misprediction is more likely to occur when the alternatives
are merely quantitatively different but less likely when options are qualitatively different which
may suggest greater inconsistencies between reported preferences for monetary incentives and
performance under nonmonetary incentives (and vice-versa).
A final possible explanation for preference-performance inconsistencies may be
originated from a lay rationalism (Hsee et al 2003; Hsee et al 2014) regarding workplace
performance. Lay rationalism refers to a tendency to overweight attributes that appear more
rational and objective and downplay attributes that appear more subjective (Hsee et al 2004). This

11
lay rationalism can be manifested in the form of lay economism or lay ‘scientism (Hsee et al
2003). The former is related to the tendency to base decisions on financial aspects of the options
and neglect experiential aspects. Lay economism represents a tendency in people to focus on
economic calculus, to compare options in terms of economic gains and losses, and to downplay
other experience inducing factors, such as temporal trends and social comparisons. The latter
reflects the tendency in decision-makers to trust hard facts and discount soft preferences. Lay
rationalism thus seem to be based on the desire to base one’s decision on things that are ‘real’,
that is, substantive, material, and more concrete. This lay rationalism is likely to be particularly
marked in the workplace where making a decision on the basis of a hard attribute seems more
objective and rational, and hence more justifiable to colleagues and supervisors. There is also
greater certainty in the relative desirability of the choice options on the hard attribute than on the
soft attribute; therefore it is safer to base professional decisions on hard attributes. However, this
tendency to consider substantive features as more important than psychological experiences, to
prefer options with ‘hard’ attributes rather than subjective ones may hinder experiential
(performance) effects later on when employees are faced with the real consequences of what they
reported to prefer.
Based on the theoretical arguments presented for preference inconsistencies, and
competing with the hypotheses presented in the previous section, we propose the following
hypotheses according to behavioral decision theory:
H1b. Stated incentives preferences will not be consistent with revealed preferences i.e., preferred
incentives will not be associated with higher performance.
H2b. When incentives preferences are met performance will not improve

12
Learning facilitators or debiasing effects: Tenure and past experience
Most of the explanations provided above (forecasting bias, high abstract level of cognitive
representations, lack of motivational awareness, different decision modes between reported
versus experienced preferences) seem to be better applied to situations where people did not have
a sufficient amount of time or experience to fully developed well-established preferences.
Inconsistencies between ex-ante incentives preferences and ex-post performance under different
incentive schemes may be less likely to occur when more learning opportunities have existed to
help estimate the relationship between stated incentive preferences and performance behavior.
We examine tenure and past experience with the different incentives as proxies for learning
opportunities and for the time needed to form well-informed preferences.
Tenure within the organization or experience performing a specific job is expected to
affect an employee’s perception of instrumentality and effectiveness of a certain incentive
(Nyberg et al 2014). Employees will likely believe that prior experience will be representative of
a future experience. Thus, it is reasonable to conclude that the longer an employee’s tenure, better
well-formed her or his attitudes and beliefs about work, motivation and compensation practices
will be. Hence, the consistency between preferences and action should increase with tenure. In
contrast, low-tenured employees have less historical employment outcome evidence to draw upon
when developing their own views about preferences for incentives in the workplace. Thus, the
consistency between their preferences and their actions is likely to be weaker than for high-
tenured employees.
In the case of an existing previous experience with an incentive, incentive preferences
should reflect experienced utility (Kanheman et al 1997). Prior experience with an incentive

13
creates expectations about the degree to which future performance will be linked to it
(Schaubroeck et al., 2008). Key to this premise is that having experience working under an
incentive program has allowed individuals to become aware of their own perceptions, judgments
and behavior in such a situation. Employees without past experience with an incentive are likely
to base their preferences on anticipated utility (Caplin & Leahy, 2001). Thus, in this case,
employees report a preference for the incentive they expect to bring them the highest benefit.
Research performed in non-employment settings shows that anticipated and experienced utility
are not always concordant (Rajagopal & Montgomery, 2011; Ariely & Norton, 2007; Ariely et al
2006). This discrepancy is crucial for compensation practices (Kanheman & Thaler, 1991, 2006).
The reasoning described above for tenure and past experience mostly holds yet again
assuming some consistency and rationality in reported preferences. For instance, although it may
be expected that high tenure employees have superior knowledge and experience about what
drives performance, some studies (e.g., Hinds 1999) show that a greater expertise may actually
interfere with the ability to predict performance determinants. Hinds (199) showed that not only
were higher tenure employees unable to take advantage of their knowledge and experience in
predicting performance drivers, but they were also unable to correct their estimates when they
were prompted with information about their misprediction. There are several other pieces of work
showing that exposing people to learning facilitators and ‘debiasing’ strategies has not always
proven effective in reducing preferences-behavior inconsistencies (Hirt & Markamn 1995;
Weistein & Klein 1995; Elwin 2013). The most widely recommended debiasing strategy is
encouraging people to ‘‘consider the opposite,’’ or to counter-argue their initial response, by
asking themselves, ‘‘what are some reasons that my initial judgment might be wrong?’’ (Schwarz
et al 2007). Evidence shows that the more people try to consider the opposite, the more they often
convince themselves that their initial judgment was right on target (Schwarz et al 2007). Another
14
debiasing strategy, also less effective than expected, is confronting erroneous beliefs with
contradictory evidence. Yet attempts to do so often increase later acceptance of the erroneous
beliefs (Arkes 1991; Sanna et al 2002).
Given this evidence suggesting the possibility for preferences-behavior inconsistencies
resist to, or even be exacerbated with, experiential learning opportunities, we also present
competing hypotheses for the moderating impact of tenure and past experience, namely:
H3a. According to most standard economic and management theories, the consistency
between incentive preferences and revealed performance will improve under learning
facilitators.
H3b. According to behavioral decision theories, the consistency between incentive
preferences and revealed performance will not improve under learning facilitators.
METHODS
Sample and research site
This paper uses data from a previous field experiment (Lourenco 2015). Lourenco (2015)
is study with part-time sales representatives (reps) who conduct product demonstrations in
assigned stores of a major retail chain in the U.S. That study is a field experiment with eight
experimental groups, each one with a different combination of incentives (from the control group
to the group that received monetary incentives, feedback and recognition). This design was used
by Lourenco (2015) to analyze whether different incentives are complements or substitutes. In

15
this paper, and to avoid the potential effects of the interactions among different incentives, we use
only data from the participants that were either in the control group or in the groups that received
only one incentive. Additionally, we use new data questionnaires responded by the participants
before the start and after the end of the experiment. These questionnaires collect information
about participants, including their incentive preferences. Conditioning on being on the selected
experimental groups and having responded to the pre-experimental questionnaire, we obtain a
sample of 119 participants for this study. These participants are mostly male (60%), with a mean
age of 44 years (SD=13.4) and with a mean tenure in the company of 12 months (SD=15).
Income was not measured in absolute terms but in relative ones, as the percentage of income
provided by this work. The average participants’ personal income coming from the work in this
company was 42% (30% of their household income). At baseline, the organization had no
structured incentive program and no performance goals were established. Employees were
compensated via a fixed hourly rate (17 dollars per hour). The manipulations introducing the
different incentives – monetary incentives (hereafter money), feedback and recognition – are
fully described in Lourenco (2015). We describe here the questions used in the questionnaires to
measure incentives preferences.
Pre experimental questionnaire
Before the incentive programs were implemented, employees filled a pre-experimental
questionnaire. The questionnaire included several socio-demographic questions (age, gender,
tenure, income), as well as questions about the rank preference for different incentives,
importance attributed to different incentives and past experience with these incentives.
Preference rankings for the different incentives were elicited using bundles of incentives
in a masked way. Participants were presented with five different bundles of job characteristics

16
(three per bundle), which included the three incentives under analysis and some decoys. These
bundles were: 1. Fair pay, no lay off, monetary incentives; 2. Manager-feedback, relative
feedback and task-feedback; 3. Relative feedback, private recognition, public recognition; 4.
Feedback, monetary incentives, recognition; 5. Autonomy, information, monetary incentives.
Participants were asked to rank each job characteristic within each bundle from 1=most preferred
to 3=least preferred.
Participants were also asked to rate the importance of different job characteristics.
Besides the three incentives under analysis (money, feedback and recognition), the questions also
included some decoys (autonomy and information). The questions posed were: 1. “How
important or unimportant is each characteristic for you to do a good job? (1=not important at all
to 7=extremely important); 2. “How important or unimportant is each characteristic to motivate
you to excel in your job?” (1=not important at all to 7=extremely important); and 3. “Please
indicate the degree to which you would like to have each characteristic present in your job
compared to what you have now” (1=Much less to 7=Much more). The answers to these
questions were aggregated in a single importance index for each incentive (Money =.77;
Feedback =.68; Recognition =.79).
RESULTS
We start our data analysis by examining the consistency between stated preferences (ex-
ante evaluation of different incentives) with revealed preferences (ex-post performance under
each incentive scheme). Reps attribute a higher importance to money (M=5.73 SD=.88) and

17
feedback (M=5.60 SD=.73) (marginally higher for money: paired t-test meanmoney-
meanfeedback=1.67 p<.10) than to recognition (M=5.50 SD=.84). Recognition is rated as
significantly less important than money (paired t-test meanmoney-meanrecognition=2.82 p<.01) and
feedback (paired t-test meanfeedback-meanrecognition=2.23 p<.05). These importance ratings are
consistent with incentive preference rankings (Table 1): most reps state monetary incentives as
their first preference (54.2%), feedback appears in second place (by 45.4% of participants) and
recognition is the least preferred (56.3%). Overall, stated preferences are consistent between
different elicitation methods.
Correlations presented in Table 2 show that importance ratings for different incentives are
unrelated to socio-demographics (age, gender, tenure, and education) but particularly relevant,
and in contrast to the literature, our results show independence between income and the
importance attributed to different incentives. The degree to which participants are dependent of
the income provided by their work at the company is unrelated to the importance they attribute to
monetary and non-monetary incentives. The table also shows positive and statistically significant
correlations among importance ratings of the different incentive. Noticeably, there is a higher
correlation between the importance attributed to the two nonmonetary incentives (feedback and
recognition r=0.81 p<0.001) than between monetary incentives and feedback (r=0.49 p<0.001) or
monetary incentives and recognition (r=0.48 p<0.001). These correlations suggest some
aggregated evaluation of nonmonetary incentives by contrast to money. Finally, the table also
shows positive and statistically significant correlations among past experiences with the different
Insert Table 1 about here
18
incentives. Also in this case, there is a higher correlation between the experience with feedback
and recognition, than with money and feedback, or money and recognition.
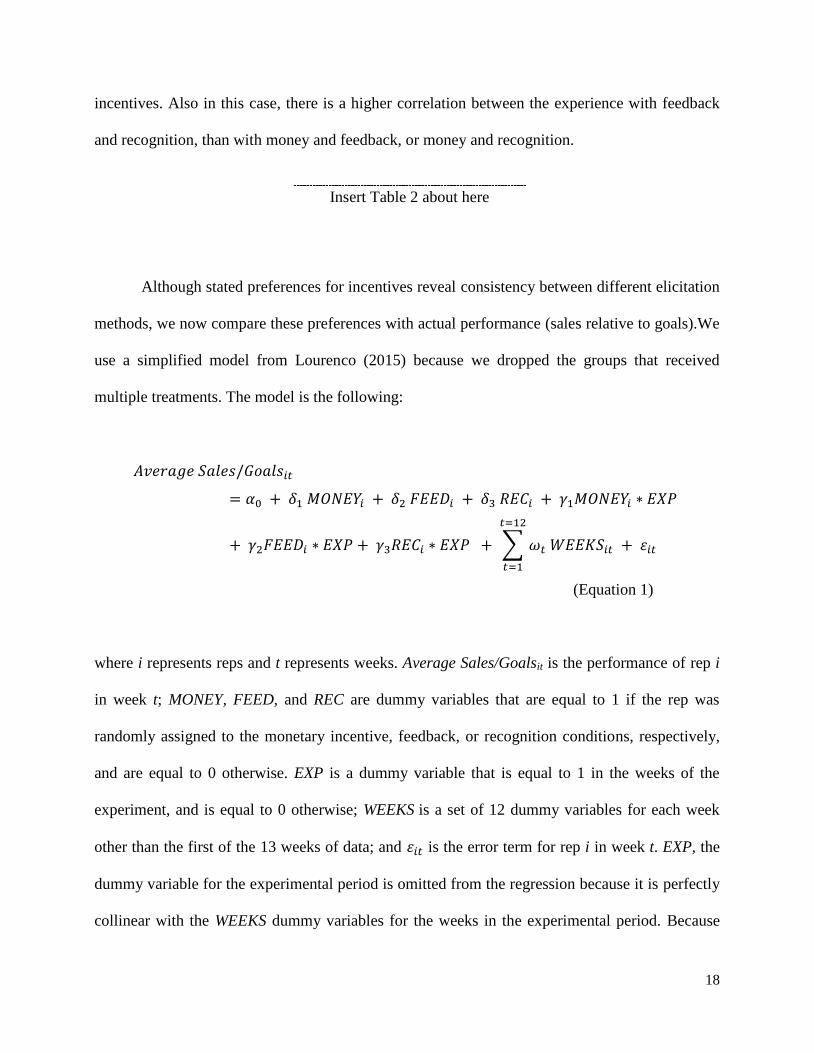
Although stated preferences for incentives reveal consistency between different elicitation
methods, we now compare these preferences with actual performance (sales relative to goals).We
use a simplified model from Lourenco (2015) because we dropped the groups that received
multiple treatments. The model is the following:
𝐴𝑣𝑒𝑟𝑎𝑔𝑒 𝑆𝑎𝑙𝑒𝑠/𝐺𝑜𝑎𝑙𝑠𝑖𝑡
= 𝛼0 + 𝛿1 𝑀𝑂𝑁𝐸𝑌𝑖 + 𝛿2 𝐹𝐸𝐸𝐷𝑖 + 𝛿3 𝑅𝐸𝐶𝑖 + 𝛾1𝑀𝑂𝑁𝐸𝑌𝑖 ∗ 𝐸𝑋𝑃
+ 𝛾2𝐹𝐸𝐸𝐷𝑖 ∗ 𝐸𝑋𝑃 + 𝛾3𝑅𝐸𝐶𝑖 ∗ 𝐸𝑋𝑃 + ∑ 𝜔𝑡 𝑊𝐸𝐸𝐾𝑆𝑖𝑡
𝑡=12
𝑡=1
+ 휀𝑖𝑡
(Equation 1)
where i represents reps and t represents weeks. Average Sales/Goalsit is the performance of rep i
in week t; MONEY, FEED, and REC are dummy variables that are equal to 1 if the rep was
randomly assigned to the monetary incentive, feedback, or recognition conditions, respectively,
and are equal to 0 otherwise. EXP is a dummy variable that is equal to 1 in the weeks of the
experiment, and is equal to 0 otherwise; WEEKS is a set of 12 dummy variables for each week
other than the first of the 13 weeks of data; and 휀𝑖𝑡 is the error term for rep i in week t. EXP, the
dummy variable for the experimental period is omitted from the regression because it is perfectly
collinear with the WEEKS dummy variables for the weeks in the experimental period. Because
Insert Table 2 about here

19
our setting is the retailing industry, it is important to control for seasonality effects which are
captured in the WEEKS dummy variables. The results are qualitatively unchanged if the EXP
dummy variable is included and the WEEKS dummy variables are dropped.
Column 1 of table 3 reports the results of this model estimated with a pooled OLS
regression and clustered standard errors by rep. Notice that the results from this column are
qualitatively unchanged from the ones reported in Lourenco (2015) but the point estimates are
slightly different because we restrict our sample to reps who answered the pre-experimental
questionnaire and for whom we were able to collect incentive preferences. We find that the group
receiving a monetary incentive increases performance by about 12 percentage points (pp)
(𝛾1=12.33, p-value<.05) while the group receiving recognition improves performance by about
13 pp (𝛾3=13.10 p-value<.01). These two effects are not statistically different. Participants in the
feedback group do not improve performance in comparison the control group (𝛾2=4.66, p-
value>.10).1 Therefore, on average (and between subjects) revealed preferences (performance
behavior) for money seem to be consistent with stated preferences (self-reported in the
questionnaire). However, this is not the case with non-monetary incentives. There is a significant
discrepancy between stated preferences and performance behavior for feedback and recognition.
The former seems to be overestimated by reps as their stated choice (second in the rankings) does
not translate into higher performance. The latter is strongly underestimated as it is the least
preferred incentive but has an effect similar to the most preferred (money).
1 For a more comprehensive discussion of main effects – out of the scope of this paper - we address the reader to
Lourenco (2015).
Insert Table 3 about here
20
Overall, we find support for H1a regarding money but for H1b regarding non-monetary
incentives. Nonetheless, these are average (and between subjects) effects and we will further
examine whether within subjects (per individual) preferences and behavior are consistent.
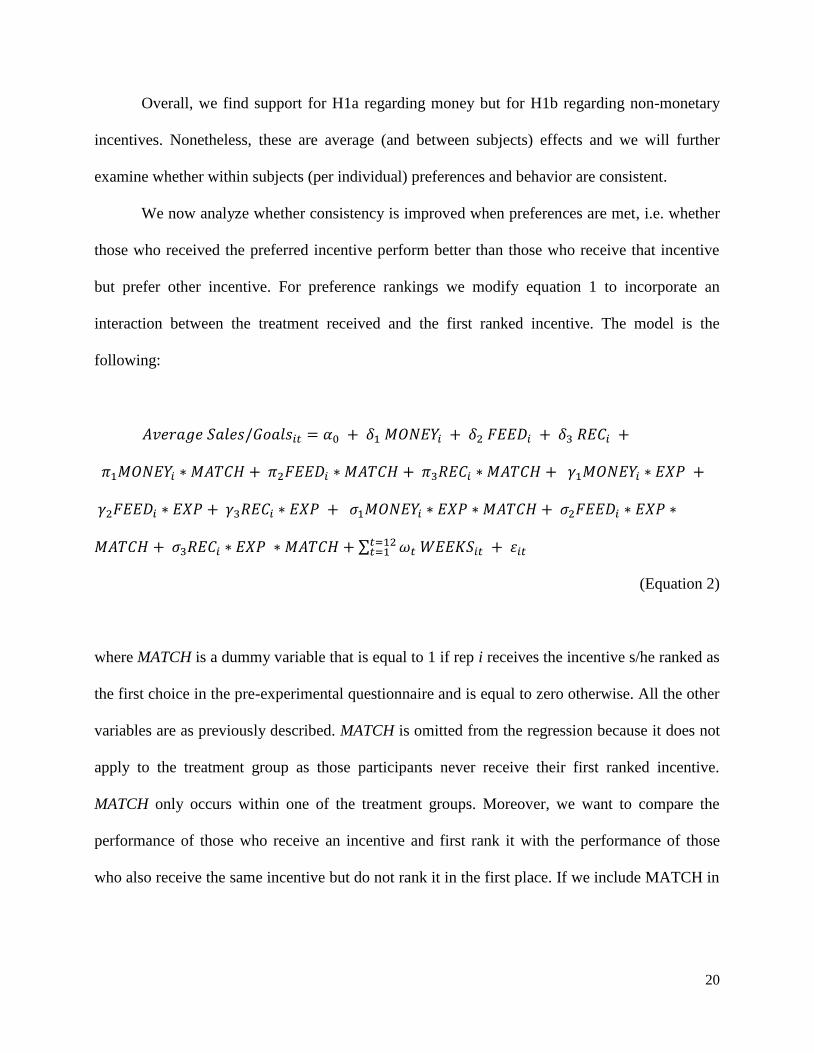
We now analyze whether consistency is improved when preferences are met, i.e. whether
those who received the preferred incentive perform better than those who receive that incentive
but prefer other incentive. For preference rankings we modify equation 1 to incorporate an
interaction between the treatment received and the first ranked incentive. The model is the
following:
𝐴𝑣𝑒𝑟𝑎𝑔𝑒 𝑆𝑎𝑙𝑒𝑠/𝐺𝑜𝑎𝑙𝑠𝑖𝑡 = 𝛼0 + 𝛿1 𝑀𝑂𝑁𝐸𝑌𝑖 + 𝛿2 𝐹𝐸𝐸𝐷𝑖 + 𝛿3 𝑅𝐸𝐶𝑖 +
𝜋1𝑀𝑂𝑁𝐸𝑌𝑖 ∗ 𝑀𝐴𝑇𝐶𝐻 + 𝜋2𝐹𝐸𝐸𝐷𝑖 ∗ 𝑀𝐴𝑇𝐶𝐻 + 𝜋3𝑅𝐸𝐶𝑖 ∗ 𝑀𝐴𝑇𝐶𝐻 + 𝛾1𝑀𝑂𝑁𝐸𝑌𝑖 ∗ 𝐸𝑋𝑃 +
𝛾2𝐹𝐸𝐸𝐷𝑖 ∗ 𝐸𝑋𝑃 + 𝛾3𝑅𝐸𝐶𝑖 ∗ 𝐸𝑋𝑃 + 𝜎1𝑀𝑂𝑁𝐸𝑌𝑖 ∗ 𝐸𝑋𝑃 ∗ 𝑀𝐴𝑇𝐶𝐻 + 𝜎2𝐹𝐸𝐸𝐷𝑖 ∗ 𝐸𝑋𝑃 ∗
𝑀𝐴𝑇𝐶𝐻 + 𝜎3𝑅𝐸𝐶𝑖 ∗ 𝐸𝑋𝑃 ∗ 𝑀𝐴𝑇𝐶𝐻 + ∑ 𝜔𝑡 𝑊𝐸𝐸𝐾𝑆𝑖𝑡𝑡=12𝑡=1 + 휀𝑖𝑡
(Equation 2)
where MATCH is a dummy variable that is equal to 1 if rep i receives the incentive s/he ranked as
the first choice in the pre-experimental questionnaire and is equal to zero otherwise. All the other
variables are as previously described. MATCH is omitted from the regression because it does not
apply to the treatment group as those participants never receive their first ranked incentive.
MATCH only occurs within one of the treatment groups. Moreover, we want to compare the
performance of those who receive an incentive and first rank it with the performance of those
who also receive the same incentive but do not rank it in the first place. If we include MATCH in

21
the regression it will refer to one of the treatment groups and the interactions will show the
differential effect of MATCH for the other incentives.
Column 2 of table 3 shows the results of the previous model estimated with a pooled OLS
regression with clustered standard errors by rep. This column corroborates the prior results from
column 1, with a statistically significant main effect for money and recognition, but not for
feedback. More importantly, we find that the interaction between the manipulations and MATCH
is not statistically significant for money (𝜎1= -8.57, p-value >0.10) and recognition (𝜎3= -1.23, p-
value >0.10), but is positive and statistically significant for feedback (𝜎2= 20.07, p-value <0.05).
This evidences that money (recognition) is not more effective for those who ex-ante rank money
(recognition) as their preferred incentive in comparison to others who also receive that incentive
but do not rank it as their preferred incentive. This is not the case for feedback. Those who rank
feedback as their preferred incentive perform better than others who also receive feedback but
prefer other incentive. Moreover, F tests at the bottom of table 3 show that the sum of the main
treatment effect and the interaction effect is not statistically significant for money, while it is
significant for feedback and recognition. These results show that reps who prefer and receive
money do not perform differently from the control group, while those who receive money but do
not prefer it do. Conversely, reps who prefer and receive feedback perform better than the control
group while those who receive feedback but do not prefer it do not. Finally, reps who prefer and
receive recognition perform better than the control group, which is also the case for reps who
receive recognition but do not prefer it. This suggests that money works for those who actually do
not say that they prefer it, feedback works only for those who prefer it, and recognition seems to
work for everyone regardless of their preferences. Overall column 2 of table 3, shows that those
who receive their first rank incentive do not perform better than others who also receive that

22
incentive but do not rank it first, except for feedback. Thus, H2a is only corroborated for
feedback, while H2b is supported for money and recognition.
Because preference rankings (ordinal scale) may be a crude measure of preferences, we
will now analyze if preference ratings (continuous scale) are related with performance. These
ratings are more powerful in the sense that they reflect the strength of preference (Crump et al
2012; Butler et al 2013), or the magnitude of the importance attributed to a specific incentive
(Blumenschein et al 1998; DeLeon et al 2009). Strength of preference and not only which
incentive is preferred in ordinal terms is a finer analysis to understand the preference-
performance relationship (Crump et al 2012; List et al 2004). Preference ratings are based on the
responses to the Likert-scale questions about the importance of each incentive. Equation 3
presents the model used to estimate the impact of the importance ratings on the treatment effects.
𝐴𝑣𝑒𝑟𝑎𝑔𝑒 𝑆𝑎𝑙𝑒𝑠/𝐺𝑜𝑎𝑙𝑠𝑖𝑡
= 𝛼0 + 𝜃 1 𝐼𝑀𝑃𝑀𝑂𝑁𝐸𝑌 + 𝜃 2 𝐼𝑀𝑃𝐹𝐸𝐸𝐷 + 𝜃 3 𝐼𝑀𝑃𝑅𝐸𝐶 + 𝛿1 𝑀𝑂𝑁𝐸𝑌𝑖
+ 𝛿2 𝐹𝐸𝐸𝐷𝑖 + 𝛿3 𝑅𝐸𝐶𝑖 + 𝜋1𝑀𝑂𝑁𝐸𝑌𝑖 ∗ 𝐼𝑀𝑃𝑀𝑂𝑁𝐸𝑌 + 𝜋2𝐹𝐸𝐸𝐷𝑖
∗ 𝐼𝑀𝑃𝐹𝐸𝐸𝐷 + 𝜋3𝑅𝐸𝐶𝑖 ∗ 𝐼𝑀𝑃𝑅𝐸𝐶 + 𝜇 1 𝐼𝑀𝑃𝑀𝑂𝑁𝐸𝑌 ∗ 𝐸𝑋𝑃 + 𝜇 2 𝐼𝑀𝑃𝐹𝐸𝐸𝐷
∗ 𝐸𝑋𝑃 + 𝜇 3 𝐼𝑀𝑃𝑅𝐸𝐶 ∗ 𝐸𝑋𝑃 + 𝛾1𝑀𝑂𝑁𝐸𝑌𝑖 ∗ 𝐸𝑋𝑃 + 𝛾2𝐹𝐸𝐸𝐷𝑖 ∗ 𝐸𝑋𝑃
+ 𝛾3𝑅𝐸𝐶𝑖 ∗ 𝐸𝑋𝑃 + 𝜎1𝑀𝑂𝑁𝐸𝑌𝑖 ∗ 𝐸𝑋𝑃 ∗ 𝐼𝑀𝑃𝑀𝑂𝑁𝐸𝑌 + 𝜎2𝐹𝐸𝐸𝐷𝑖 ∗ 𝐸𝑋𝑃
∗ 𝐼𝑀𝑃𝐹𝐸𝐸𝐷 + 𝜎3𝑅𝐸𝐶𝑖 ∗ 𝐸𝑋𝑃 ∗ 𝐼𝑀𝑃𝑅𝐸𝐶 + ∑ 𝜔𝑡 𝑊𝐸𝐸𝐾𝑆𝑖𝑡
𝑡=12
𝑡=1
+ 휀𝑖𝑡
(Equation 3)

23
where IMPMONEY (IMPFEED/IMPREC) is the standardized average of the three
questions in 7 point Likert-scales about the importance of monetary incentives
(feedback/recognition) previously described. Equation 3 is estimated with a pooled OLS
regression with standard errors clustered by rep.
Table 4 shows a positive and statistically significant main effect for money and
recognition, and no effect for feedback. These effects are consistent with those reported in table
3. More importantly, the table shows the interactions between the different incentives and the
importance attributed to those incentives which are also consistent with the results of table 3 that
used the incentive rankings. Table 4 shows a negative and statistically significant interaction
between MONEY and IMPMONEY during the experiment (𝜎1=-13.24, p-value<.01). This
suggests that the higher the importance attributed to monetary incentives, the smaller the impact
of monetary incentives on performance. We investigate further this relationship and find, in
untabulated results of equation 1, that monetary incentives have a positive effect on performance
for the group who rates the importance of monetary incentives below median and no effect for
those who rate it above median. The F test for the sum of main effect and interaction with
IMPMONEY is not statistically significant (γ1 + σ1=12.13-8.94= 3.19, F test for 𝛾1 + 𝜎1 = 0 is
0.24, p-value>.10). This evidence confirms that those who rate the importance of monetary
incentives high do not perform differently from the control group, while those who rate the
importance of monetary incentives low actually improve their performance, relatively to the
control group, when they receive this incentive.
Insert Table 4 about here

24
Table 4 also shows a positive and significant interaction between feedback and the
importance attributed to feedback (𝜎2=12.30, p-value=<.05). Because the feedback main effect is
not statistically significant per se (𝛾2=3.11, p-value>.10), this positive interaction suggests that
feedback is only effective for those who rate the importance of feedback high. The F-test for the
sum of the main effect of feedback and interaction with IMPFEED confirms our expectation. The
sum is positive and statistically significant (γ2 + σ2=3.11+12.30= 15.41, F-test for 𝛾2 + 𝜎2=0 is
4.27, p-value<.05). We also investigate further this relationship and find, in untabulated results of
equation 1, that feedback has a positive effect on performance for the group who rates the
importance of feedback above median and no effect for those who rate it below median. Thus,
this evidence confirms that those who rate the importance of feedback high improve their
performance relatively to the control group once they start receiving feedback, while those who
rate the importance of feedback low actually do not improve relatively to the control group, when
they receive this incentive.
Lastly, we find that the interaction between recognition and the importance attributed to
recognition is not statistically significant (𝜎3=.10, p-value>.10). Because the recognition main
effect is statistically significant per se (𝛾3=11.41, p-value<.05), the non-significant interaction
suggests that recognition is effective regardless of the importance attributed to recognition. Even
though the F-test for the sum of the main effect of recognition with the interaction with IMPREC
is (weakly) not statistically significant (γ3 +σ3=11.41+.10= 11.51, F-test for 𝛾3 + 𝜎3=0 is
2.38, p-value=.13), our analysis by partitions confirms our speculation. In untabulated results of
equation 1, we find that recognition has a positive effect on performance for both the group who
rates the importance of recognition above median and for the group who rates the importance of
recognition below median. Thus, this evidence confirms that regardless of the ex ante importance

25
attributed to recognition, this incentive works for all performers regardless how they rate its
importance as they all improve relatively to the control group once they start receiving
recognition.
Overall, the results presented in table 4 are overwhelmingly consistent with those present
in table 3, and we conclude that H2a is only corroborated for feedback, while H2b is supported
for money and recognition.
To analyze the moderating effects of tenure and past experience with the different
incentives, we run full interacted models of equations 2 and 3 as well as partitions of those
models.
Table 5 and 6 show the results for the moderating effect of tenure. The results show that a
higher tenure is not associated with a better consistency between ex-ante preferences (first ranked
incentive or higher importance ratings) and performance suggesting that these preference
inconsistencies do not seem to result from an insufficient work experience. Untabulated results
show that this is also the case of past experience with the different incentives, similarly
suggesting no learning effects. Therefore, H3a is rejected and H3b is supported.
Robustness tests
To evaluate the robustness of our results, we performed several additional tests. We start
by estimating our models with a Tobit regression to account for the fact that our data is censored
Insert Table 5 about here
Insert Table 6 about here

26
at the bottom. Performance is the ratio of sales relative to goals and hence cannot be below 0. The
results reported hold in this specification. We also estimated our models with fixed and random
effects per rep and the results are also qualitatively unchanged. Finally, we explore whether the
importance attributed to a given incentive impacts the effect of the other incentives. We run
equation 3 three times again using as the importance variable i) IMPMONEY, ii) IMPFEED, and
iii) IMPREC. Untabulated results show that there are no statistically significant interactions
between the importance attributed to one incentive and the manipulation of other incentives.
Additionally, the results are consistent with the ones present in table 4, both for the main effects
and the interactions.
DISCUSSION AND CONCLUSION
We use a longitudinal field experiment to examine how preferences for different
incentives (money, recognition and feedback) influence the effectiveness of those incentives on
performance behavior. We analyze ex-post objective performance data from different incentive
manipulations in light of ex-ante incentive preferences collected in the pre-experimental period
via a questionnaire. Results from our study expose several inconsistencies in employee
preferences for performance incentives drawn from a natural organizational setting.
First, we show that average preference rankings do not translate into corresponding
performance levels. Employees attribute a significantly higher importance to monetary incentives
and feedback in terms of their motivational role for job performance and significantly less to
recognition. This rank order in stated preferences for different incentives is robust to the
elicitation method (ordinal or continuous scales). The importance attributed to different
incentives does not significantly vary per age, tenure or income. We find that these stated

27
preferences tend to be on average discrepant with actual performance (revealed preferences). Our
results show that on average (and between subjects) employees prefer money and this incentive
yields a significant performance improvement. However, employees overestimate the impact of
feedback because this is the second preferred incentive but yields on average no significant
improvement in performance. This overestimated effect may be due to the frequent use of
feedback in organizations as one of the most common reinforcers to influence employees’
behavior (Balcazar et al. 1985; Kluger & DeNisi, 1996; Alvero et al., 2001). Familiarity may
inflate the perception of effectiveness. Finally, employees underestimate the impact of
recognition as this is the least preferred incentive but yields a performance improvement similar
to money. This is likely due to the discounted impact of peer effects and social comparison
processes in the workplace. Second, by analyzing within subjects preferences and behavior we
find further inconsistencies. Employees who receive their first ranked incentive performed no
better than those who received that incentive but did not rank it first, except for the feedback
condition. Specifically, we find that money only works for those who do not rank it first (or rate
its importance below median), feedback works only for those who rank it first (or rate it above
median), and recognition works for everyone regardless of their preferences. Finally, there is no
evidence of learning effects, which suggests that these biases may be grounded in lay rationalism,
and hence more likely to be resistant to experimental learning because it is not grounded on
cognitive misperceptions (as most forecasting bias are) but in more engrained shared belief
systems that may not be easily confronted.
Our results pose two key questions to be discussed. On one hand why performance is not
improved when employees receive their preferred incentive. On the other hand, why there seems
to be no evidence of learning effects. Regarding the former, it may have been the case that
employees reported their preferences regarding their perception of how different incentives

28
impact their motivation, satisfaction or attention in the workplace – and may not know exactly
what improves their objective performance. For instance, employees may react negatively to the
implementation of recognition programs in the organization, expecting to benefit more from
monetary incentives or feedback in terms of their performance and satisfaction. But we call
special attention to the fact the different incentives were not evaluated and ranked in abstract
terms or regarding expected preferences for the general population. The questions were posed
specifically about their impact in employees performance, both their preferred ranking between
incentives and their importance to strive at work (“How important or unimportant is each
characteristic for you to do a good job?; “How important or unimportant is each characteristic to
motivate you to excel in your job?”). Therefore, an overall positive significant relationship
between stated preferences and performance would have been a natural result if employees truly
knew their preferences. It could also be that in most organizations employees do not have voice
regarding which incentives are implemented. People repeatedly accept the default options that
have been chosen by others (Carroll et al 2009). In workplace settings, regulated by contractual
arrangements and hierarchical work relationships, employees may not expect to have any
influence regarding organizational compensation decisions and thus no expectation violation
occurs (Morrison & Robinson 1997) – and this acceptance may prevent employees to perform
poorly when companies implement incentives that were not desired. People may also accept
defaults because they believe that the person who set the default was making a carefully
considered decision (Madrian & Shea, 2001; Beshears et al., 2008) and this effect is a plausible
scenario in employer-employee relationships.
Preference strength moderates performance effects in very distinct ways according to
different incentives and this effect is likely to be explained by the specificity of (expected versus
experienced) utility gains from each incentive. The negative impact of the importance attributed
29
to money may be due to the unmet expectations of utility gains from monetary incentives.
Research has shown that people who place too much importance on monetary rewards may
actually be working against their experienced utility because the utility gains from money do not
match the high expectations (Frey & Jengen 2001: Kanhneman et al 1997). On the other hand,
the strong and positive effect of a preference for feedback may be explained by the fact that –
from all three incentives under analysis -feedback is the one that provides the more intangible or
‘intrinsic’ benefits. Thus only employees that report very high importance ratings on such an
incentive are likely to experience the utility gains from receiving it. Finally, the null effect of
preference strength for recognition suggests that public acknowledgment of competence is a
shared preference by all employees (with or without clear awareness on their part). There is
abundant evidence that people underestimate the power of social influence and that individuals
do not fully realize how much their behavior is influenced by the expectation of positive
reinforcement from others (e.g., Carr & Walton, 2014; Exline et al 2004).
Regarding the latter, this question raises more intricate challenges. The absence of
positive results from tenure and experience with incentives (both previous experience and pre-
post experimental changes in reported preferences) do not seem to support most of the proposed
explanations about the sources of preference inconsistencies being grounded in forecasting errors
that should be reduced with experiential learning. In this regard, Meyvis et al 2010 explored why
people might fail to learn from experience, even when the experience itself has not been
forgotten. They propose that, aside from a failure to accurately recall their experience, people
also persist in their forecasting errors because they misremember their initial forecast. A bias to
recall their forecast as consistent with their actual experience obscures people’s forecasting error.
As a result, people are unlikely to realize the need to update their forecasting strategies and
continue to rely on those same strategies for subsequent forecasts. Thus, either people are not

30
using experience to update their preferences or (as we propose the most suitable justification) the
reasons lie outside forecasting errors. The results seem to offer support for the lay rationalism
hypothesis which is the mechanism more likely to be resistant to experimental learning because it
is not grounded on cognitive misperceptions (as most forecasting bias are) but in more engrained
shared belief systems that may not be easily confronted.
Nevertheless, overall results show that giving employees what they claim to prefer does
not result in significantly better work performance which is contrary to the assumptions of most
standard theories in economics and management. Taken together these results highlight the
limited predictive power of stated preferences for work incentives with respect to their translation
into objective performance measures. Hence, caution should be used in taking preferences at face
value and actually designing incentive systems based on stated preferences. These inconsistencies
call attention to the need for rethinking how employee reward preferences should be taken into
consideration when developing incentive programs. These results highlight the need for
employee education regarding work motivation because lay conceptions are likely to have a
strong impact in job choices and employee responses to organizational incentive programs
including job satisfaction, organizational commitment and turnover intentions (e.g., Misra et al
2013). There may be the need to consider both tailored incentive programs according to
individual preferences – as it could be the case of feedback – but also the power of fundamental
motivational processes as illustrated by the recognition condition – that appear to strike core
human needs to which employees respond to regardless of their stated preferences. Money seems
to fulfil (on average) preferences for work incentives but the key insight to be conveyed to
employees should be that an overemphasis placed on the importance on monetary incentives may
be counterproductive by reducing the experienced utility from money.

31
This study is not without caveats. Although field experiments score high on internal
validity, the generalization of the results may be a concern as the field experiment was done in a
single research site. As such, the characteristics of this firm and of its employees may play a role.
For example, the fact that participants are paid an hourly wage poses the question that our results
may not apply to more fixed-pay contractual arrangements. Theory also cautions about the
measurement of incentive preferences. Different elicitation methods may lead to different
answers about those preferences. We tried to overcome this issue, by using two different methods
and the results our overwhelmingly consistent.
These limitations represent several avenues for future research. On one hand, it would be
interesting to analyze whether our results hold in settings where employees are paid a fixed salary
at the end of the month and not an hourly wage. This type of contracts may lead to different
preferences as monetary incentives may be more or less relevant in total pay. On the other hand,
and to avoid the criticism associated with a stated preference, future studies can give employees
the actual choice of their incentive (and not just a stated preference) and analyze performance
after the implementation of the desired incentive.
32
References
Ajzen, I., Brown, T. C., and Carvajal, F. 2004. Explaining the discrepancy between intentions
and actions: The case of hypothetical bias in contingent valuation. Personality and social
psychology bulletin, 30(9), 1108-1121.
Alderfer, C. P. 1972. Existence, Relatedness, and Growth; Human Needs in Organizational
Settings. New York: Free Press.
Analoui, F. 2000. What motivates senior managers? The case of Romania. Journal of Managerial
Psychology, 15(4), 324-340.
Alvero, A. M., Bucklin, B. R., and Austin, J. 2001. An objective review of the effectiveness and
essential characteristics of performance feedback in organizational settings (1985-1998).
Journal of Organizational Behavior Management, 21(1), 3-29.
Ariely, D., Loewenstein, G., and Prelec, D. 2006. Tom Sawyer and the construction of value.
Journal of Economic Behavior and Organization, 60(1), 1-10.
Ashraf, N., Bandiera, O., and Jack, K. 2013. No margin, no mission? A Field Experiment on
Incentives for public service delivery. Working paper, Harvard Business School.
Baker, G. P., Jensen, M. C., and Murphy, K. J. 1988. Compensation and incentives: Practice vs.
theory. The journal of Finance, 43(3), 593-616.
Balcazar, F., Hopkins, B. L., and Suarez, Y. 1985. A critical, objective review of performance
feedback. Journal of Organizational Behavior Management, 7(3-4), 65-89.
Bandura, A. 1986. Social foundations of Thought and Action. Englewood Cliffs, NJ: Prentice
Hall.
Baumann, O., and Stieglitz, N. 2014. Rewarding value‐creating ideas in organizations: The
power of low‐powered incentives. Strategic Management Journal, 35(3), 358-375.
Bareket-Bojmel, L., Hochman, G., and Ariely, D. 2014. It’s (Not) All About the Jacksons Testing
Different Types of Short-Term Bonuses in the Field. Journal of Management,
0149206314535441.
Bellé, N. 2013. Experimental evidence on the relationship between public service motivation and
job performance. Public Administration Review, 73(1), 143-153.
Bellenger, D. N., Wilcox, J. B., and Ingram, T. N. 1984. An examination of reward preferences
for sales managers. Journal of Personal Selling and Sales Management, 4(2), 1-6.
Berg, J. E., Dickhaut, J. W., and Rietz, T. A. 2010. Preference reversals: The impact of truth-
revealing monetary incentives. Games and Economic Behavior, 68(2), 443-468.
Beshears, J., Choi, J. J., Laibson, D., and Madrian, B. C. 2008. How are preferences revealed?
Journal of Public Economics, 92(8), 1787-1794.
Blumenschein, K., Johannesson, M., Blomquist, G. C., Liljas, B., and O'Conor, R. M. 1998.
Experimental results on expressed certainty and hypothetical bias in contingent valuation.
Southern Economic Journal, 169-177.
Bonner, S. E., Hastie, R., Sprinkle, G. B., and Young, S. M. 2000. A review of the effects of
financial incentives on performance in laboratory tasks: Implications for management
accounting. Journal of Management Accounting Research, 12(1), 19-64.
Bonner, S. E., and Sprinkle, G. B. 2002. The effects of monetary incentives on effort and task
performance: theories, evidence, and a framework for research. Accounting, Organizations
and Society, 27(4), 303-345.
Bonsdorff, M. E. 2011. Age-related differences in reward preferences. The International Journal
of Human Resource Management, 22(06), 1262-1276.

33
Brown, M. P., Sturman, M. C., and Simmering, M. J. 2003. Compensation policy and
organizational performance: The efficiency, operational, and financial implications of pay
levels and pay structure. Academy of Management Journal, 46(6), 752-762.
Butler, D., Isoni, A., Loomes, G., and Tsutsui, K. 2013. Beyond choice: investigating the
sensitivity and validity of measures of strength of preference. Experimental Economics, 1-
27.
Caplin, A., and Leahy, J. 2001. Psychological expected utility theory and anticipatory feelings.
Quarterly Journal of economics, 55-79.
Carr, P. B., and Walton, G. M. (2014). Cues of working together fuel intrinsic motivation.
Journal of Experimental Social Psychology, 53, 169-184.
Carroll, G. D., Choi, J. J., Laibson, D., Madrian, B. C., and Metrick, A. 2009. Optimal Defaults
and Active Decisions. The Quarterly journal of economics, 124(4), 1639-1674.
Chen, M. K., and Risen, J. L. 2010. How choice affects and reflects preferences: revisiting the
free-choice paradigm. Journal of Personality and Social Psychology, 99(4), 573.
Chiang, F. F., and Birtch, T. A. 2005. A taxonomy of reward preference: Examining country
differences. Journal of International Management, 11(3), 357-375.
Chiang, F. F., and Birtch, T. A. 2006. An empirical examination of reward preferences within and
across national settings. Management International Review, 46(5), 573-596.
Chiang, F. F., and Birtch, T. A. 2012. The Performance Implications of Financial and Non‐Financial Rewards: An Asian Nordic Comparison. Journal of Management Studies, 49(3),
538-570.
Chonko, L. B., Tanner Jr, J. F., and Weeks, W. A. 1992. Selling and sales management in action:
reward preferences of salespeople. Journal of Personal Selling and Sales Management,
12(3), 67-75.
Clark, A. E. 2005. Your money or your life: Changing job quality in OECD countries. British
Journal of Industrial Relations, 43(3), 377-400.
Crump, R. T., and Llewellyn-Thomas, H. A. 2012. The importance of measuring strength-of-
preference scores for health care options in preference-sensitive care. Journal of clinical
epidemiology, 65(8), 887-896.
Dai, X., Brendl, C. M., and Ariely, D. 2010. Wanting, liking, and preference construction.
Emotion, 10(3), 324.
Dane, E., and George, J. 2014. Unpacking Affective Forecasting and Its Ties to Project Work In
Organizations. Academy of Management Review, 39(2):181-201.
DeLeon, I. G., Frank, M. A., Gregory, M. K., and Allman, M. J. 2009. On the correspondence
between preference assessment outcomes and progressive‐ratio schedule assessments of
stimulus value. Journal of applied behavior analysis, 42(3), 729-733.
Dewhurst, M., Guthridge, M., and Mohr, E. 2009. Motivating people: Getting beyond money.
McKinsey Quarterly, 1(4), 12-15.
Dohmen, T., and Falk, A. 2011. Performance pay and multidimensional sorting: Productivity,
preferences, and gender. The American Economic Review, 556-590.
Dysvik, A., and Kuvaas, B. 2011. Intrinsic motivation as a moderator on the relationship between
perceived job autonomy and work performance. European Journal of Work and
Organizational Psychology, 20(3), 367-387.
Durham, C. C., and K. Bartol. 2000. Pay for performance. In Handbook of Principles of
Organizational Behavior edited by E. A. Locke. Oxford, England: Blackwell, 150-165.

34
Egan, L. C., Bloom, P., and Santos, L. R. 2010. Choice-induced preferences in the absence of
choice: Evidence from a blind two choice paradigm with young children and capuchin
monkeys. Journal of Experimental Social Psychology, 46(1), 204-207.
Ellingsen, T., and M. Johannesson. 2007. Paying respect. The Journal of Economic Perspectives
21 (4) 135-150.
Eisenhardt, K. M. 1988. Agency-and institutional-theory explanations: The case of retail sales
compensation. Academy of Management journal, 31(3), 488-511.
Eisenhardt, K. M. 1989. Agency theory: An assessment and review. Academy of management
review, 14(1), 57-74.
Exline, J. J., Single, P. B., Lobel, M., and Geyer, A. L. (2004). Glowing praise and the envious
gaze: Social dilemmas surrounding the public recognition of achievement. Basic and
Applied Social Psychology, 26(2-3), 119-130.
Franceschelli, I., Galiani, S., and Gulmez, E. 2010. Performance pay and productivity of low-and
high-ability workers. Labour Economics, 17(2), 317-322.
Frey, B. S., and Jegen, R. 2001. Motivation crowding theory. Journal of economic surveys,
15(5), 589-611.
Gerhart, B., and Fang, M. 2014. Pay for (individual) performance: Issues, claims, evidence and
the role of sorting effects. Human Resource Management Review, 24(1), 41-52.
Gilbert, D. T., Gill, M. J., and Wilson, T. D. 2002. The future is now: Temporal correction in
affective forecasting. Organizational Behavior and Human Decision Processes, 88(1), 430-
444.
Gupta, N., and Shaw, J. D. 2014. Employee compensation: The neglected area of HRM research.
Human Resource Management Review, 24(1), 1-4.
Hackman, J. R., and Oldham, G. R. (1980). Job Diagnostic Survey (JDS). Hackman, JR/Oldham,
GR (1980): Work redesign. Reading, Company. S, 275-294.
Harrison, G. W., and Rutström, E. E. 2008. Experimental evidence on the existence of
hypothetical bias in value elicitation methods. Handbook of experimental economics
results, 1(5), 752-767.
Heath, C. 1999. On the social psychology of agency relationships: Lay theories of motivation
overemphasize extrinsic incentives. Organizational behavior and human decision
processes, 78(1), 25-62.
Herzberg, F. 1966. Work and the nature of man. Oxford: OUP.
Heyman, J., and D. Ariely. 2004. Effort for payment a tale of two markets. Psychological Science
15 (11): 787-793.
Hölmstrom, B. 1999. Moral hazard and observability. The Bell Journal of Economics, 74-91.
Ingram, T. N., and Bellenger, D. N. 1983. Personal and organizational variables: Their relative
effect on reward valences of industrial salespeople. Journal of Marketing Research, 198-
205.
Jensen, M. C. and W. H. Meckling. 1976. Theory of the Firm: Managerial Behavior, Agency
Costs and Ownership Structure. Journal of Financial Economics 3 (4): 305-360.
Kahneman, D., and Thaler, R. 1991. Economic analysis and the psychology of utility:
applications to compensation policy. The American Economic Review, 341-346.
Kahneman, D., and Thaler, R. H. 2006. Anomalies: Utility maximization and experienced utility.
The Journal of Economic Perspectives, 20(1), 221-234.
Kahneman, D., Wakker, P. P., and Sarin, R. 1997. Back to Bentham? Explorations of
experienced utility. The Quarterly Journal of Economics, 375-405.
35
Kovach, K. A. 1980. Why motivational theories don’t work. SAM Advanced Management
Journal, 45(2), 54-59.
Kovach, K. A. 1987. What motivates employees? Workers and supervisors give different
answers. Business Horizons, 30(5), 58-65.
Kosfeld, M., and S. Neckermann. 2011. Getting more work for nothing? Symbolic awards and
worker performance. American Economic Journal: Microeconomics 3 (3): 86-99.
Kluger, A. N., and DeNisi, A. 1996. The effects of feedback interventions on performance: a
historical review, a meta-analysis, and a preliminary feedback intervention theory.
Psychological bulletin, 119(2), 254–284.
Latham, G. P., and Locke, E. A. 1991. Self-regulation through goal setting. Organizational
behavior and human decision processes, 50(2), 212-247.
Larkin, I., Pierce, L., and Gino, F. 2012. The psychological costs of pay‐for‐performance:
Implications for the strategic compensation of employees. Strategic Management Journal,
33(10), 1194-1214.
Lazear, E. P. 2000. The power of incentives. American Economic Review, 410-414.
Lee, H. J., Iijima, Y., and Reade, C. 2011. Employee preference for performance-related pay:
predictors and consequences for organizational citizenship behavior in a Japanese firm. The
international journal of human resource management, 22(10), 2086-2109.
Lee, M. S., Yu, C. T., Martin, T. L., and Martin, G. L. 2010. On the relation between reinforcer
efficacy and preference. Journal of applied behavior analysis, 43(1), 95-100.
Leuven, E., Oosterbeek, H., Sonnemans, J., and Van Der Klaauw, B. 2011. Incentives versus
sorting in tournaments: Evidence from a field experiment. Journal of Labor Economics,
29(3), 637-658.
Lichtenstein, S., and Slovic, P. (Eds.). 2006. The construction of preference. Cambridge
University Press.
List, J. A. 2001. Do explicit warnings eliminate the hypothetical bias in elicitation procedures?
Evidence from field auctions for sportscards. American economic review, 1498-1507.
Lopez, T. B., Hopkins, C. D., and Raymond, M. A. 2006. Reward preferences of salespeople:
how do commissions rate? Journal of Personal Selling and Sales Management, 26(4), 381-
390.
Lourenco, S. M. 2015. Monetary Incentives, Feedback and Recognition – Complements or
Substitutes? Evidence from a Field Experiment in a Retail Services Company. The
Accounting Review (in press)
Loewenstein, G., O'Donoghue, T., and Rabin, M. 2003. Projection bias in predicting future
utility. The Quarterly Journal of Economics, 1209-1248.
Markham, S. E., D. Scott, and G. McKee. 2002. Recognizing good attendance: A longitudinal
quasi-experimental field study. Personnel Psychology 55: 639-660.
Maslow, A. H. 1943. A Theory of Human Motivation. Psychological Review 50 (4): 370-396.
Mcclelland, D. C. 1961. The Achieving Society. Princeton, N. J.: Van Nostrand.
Metcalfe, J., and Mischel, W. 1999. A hot/cool-system analysis of delay of gratification:
dynamics of willpower. Psychological review, 106(1), 3.
Miller, K. M., Hofstetter, R., Krohmer, H., and Zhang, Z. J. 2011. How should consumers'
willingness to pay be measured? An empirical comparison of state-of-the-art approaches.
Journal of Marketing Research, 48(1), 172-184.
Misra, P., Jain, S., and Sood, A. 2013. Compensation: impact of rewards and organisational
justice on turnover intentions and the role of motivation and job satisfaction: a study of

36
retail store operations in NCR. International Journal of Human Resources Development
and Management, 13(2-3), 136-152.
Morrell, D. L. 2011. Employee perceptions and the motivation of nonmonetary incentives.
Compensation and Benefits Review, 43(5), 318-323.
Morrison, E. W., and Robinson, S. L. 1997. When employees feel betrayed: A model of how
psychological contract violation develops. Academy of management Review, 22(1), 226-
256.
Morse, G. 2003. Why we misread motives. Harvard Business Review, 81(1), 18.
Murphy, J. J., Allen, P. G., Stevens, T. H., and Weatherhead, D. 2005. A meta-analysis of
hypothetical bias in stated preference valuation. Environmental and Resource Economics,
30(3), 313-325.
Pepper, A., and Gore, J. 2012. Behavioral Agency Theory New Foundations for Theorizing
About Executive Compensation. Journal of Management, 0149206312461054.
Pitkänen, H., and Lukka, K. 2011. Three dimensions of formal and informal feedback in
management accounting. Management Accounting Research, 22(2), 125-137.
Prendergast, C. 1999. The provision of incentives in firms. Journal of economic literature, 7-63.
Porter, L. W., and Lawler, E. E. 1968. Managerial attitudes and performance. NY: Richard Irwin
Company.
Rajagopal, P., and Montgomery, N. V. 2011. I imagine, I experience, I like: The false experience
effect. Journal of Consumer Research, 38(3), 578-594.
Robson, A., and Samuelson, L. 2011. The evolution of decision and experienced utilities.
Theoretical Economics, 6(3), 311-339.
Rynes, S. L., Gerhart, B., and Minette, K. A. 2004. The importance of pay in employee
motivation: Discrepancies between what people say and what they do. Human Resource
Management, 43(4), 381-394.
Rynes, S. L., Gerhart, B., and Parks, L. 2005. Personnel psychology: Performance evaluation
and pay for performance. Annual Review of Psychology, 56, 571-600.
Shapiro, S. P. 2005. Agency theory. Annual review of sociology, 263-284.
Slovic, P. 1995. The construction of preference. American psychologist, 50(5), 364.
Sprinkle, G. B. 2000. The effect of incentive contracts on learning and performance. The
Accounting Review, 75(3), 299-326.
Stajkovic, A. D., and Luthans, F. 1997. A meta-analysis of the effects of organizational behavior
modification on task performance, 1975–95. Academy of Management journal, 40(5),
1122-1149.
Stajkovic, A. D., and Luthans, F. 2001. Differential effects of incentive motivators on work
performance. Academy of management journal, 44(3), 580-590.
Stajkovic, A. D., and Luthans, F. 2003. Behavioral management and task performance in
organizations: conceptual background, meta‐analysis, and test of alternative models.
Personnel Psychology, 56(1), 155-194.
Stroh, L. K., Brett, J. M., Baumann, J. P., and Reilly, A. H. 1996. Agency theory and variable
pay compensation strategies. Academy of Management Journal, 39(3), 751-767.
Thaler, R. H. 1990. Anomalies: Saving, fungibility, and mental accounts. The Journal of
Economic Perspectives, 193-205.
Tversky, A., and Thaler, R. H. 1990. Anomalies: preference reversals. The Journal of Economic
Perspectives, 201-211.
Tversky, A., and Kahneman, D. 1991. Loss aversion in riskless choice: A reference-dependent
model. The Quarterly Journal of Economics, 106(4), 1039-1061.

37
Vroom, V. 1964. Expectancy theory.NY: John Wiley and Sons.
Wiley, C. 1997. What motivates employees according to over 40 years of motivation surveys.
International Journal of Manpower, 18(3), 263-280.
Wilson, T. D., and Gilbert, D. T. 2003. Affective forecasting. Advances in experimental social
psychology, 35, 345-411.
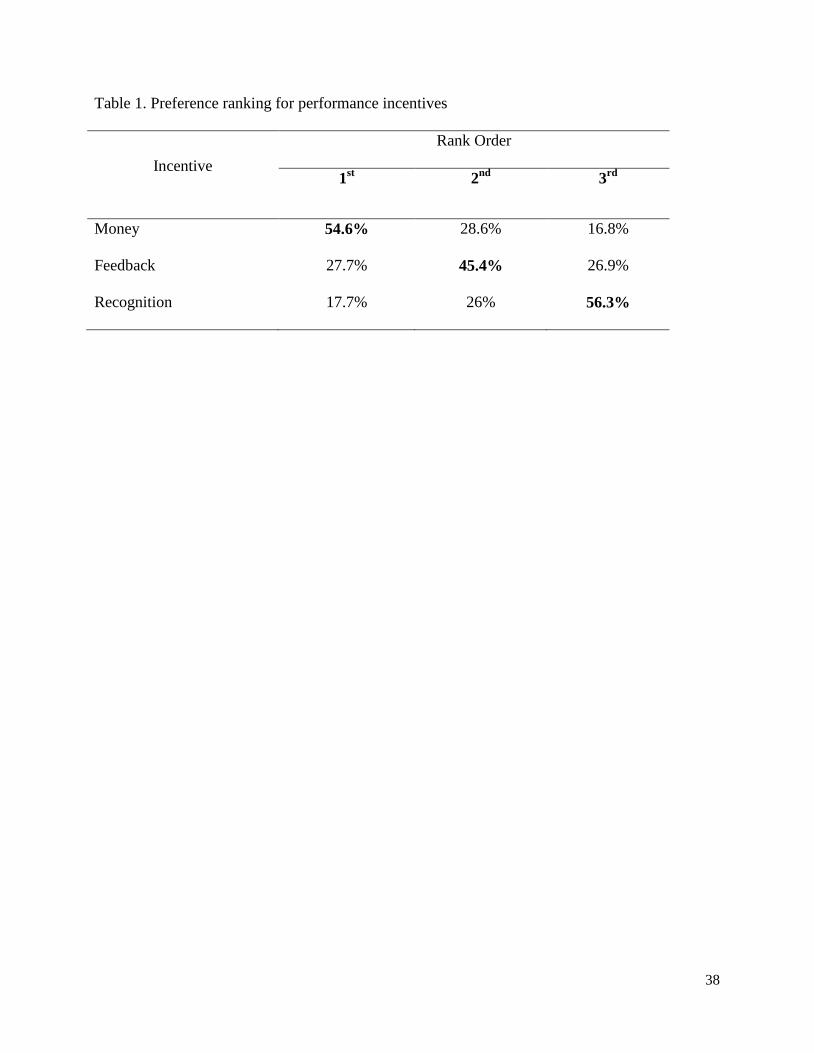
38
Table 1. Preference ranking for performance incentives
Incentive
Rank Order
1st 2
nd 3
rd
Money 54.6% 28.6% 16.8%
Feedback 27.7% 45.4% 26.9%
Recognition 17.7% 26% 56.3%
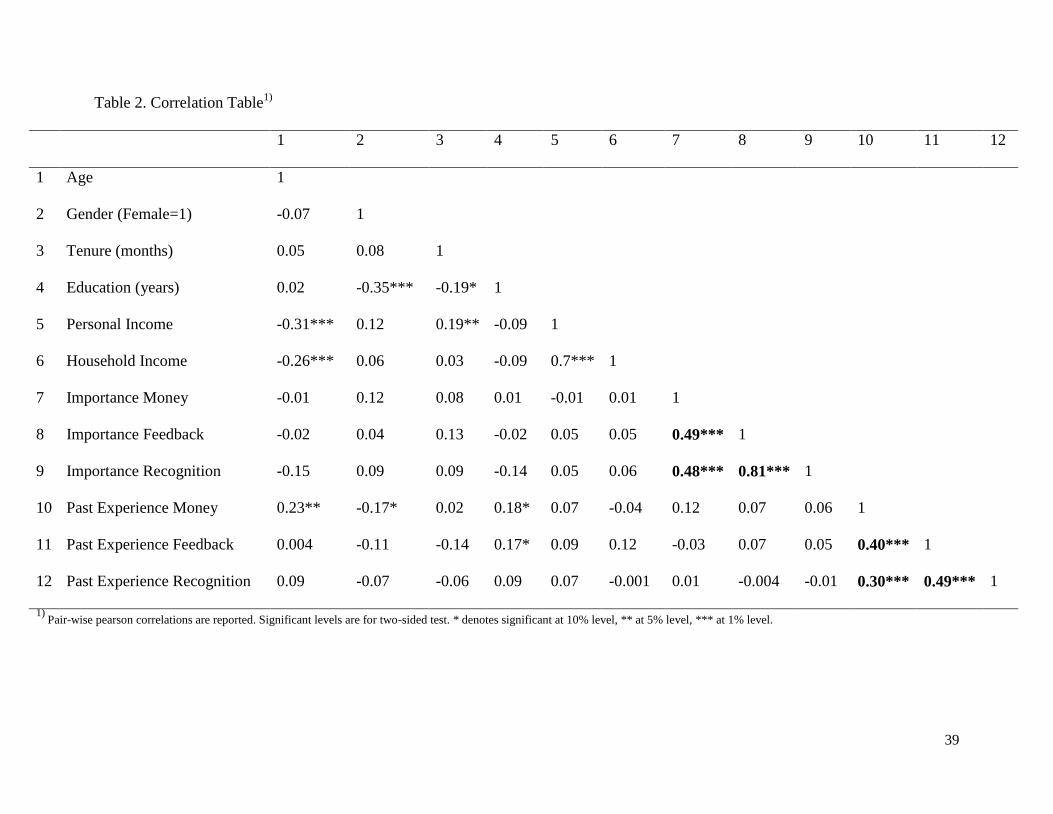
39
Table 2. Correlation Table1)
1 2 3 4 5 6 7 8 9 10 11 12
1 Age 1
2 Gender (Female=1) -0.07 1
3 Tenure (months) 0.05 0.08 1
4 Education (years) 0.02 -0.35*** -0.19* 1
5 Personal Income -0.31*** 0.12 0.19** -0.09 1
6 Household Income -0.26*** 0.06 0.03 -0.09 0.7*** 1
7 Importance Money -0.01 0.12 0.08 0.01 -0.01 0.01 1
8 Importance Feedback -0.02 0.04 0.13 -0.02 0.05 0.05 0.49*** 1
9 Importance Recognition -0.15 0.09 0.09 -0.14 0.05 0.06 0.48*** 0.81*** 1
10 Past Experience Money 0.23** -0.17* 0.02 0.18* 0.07 -0.04 0.12 0.07 0.06 1
11 Past Experience Feedback 0.004 -0.11 -0.14 0.17* 0.09 0.12 -0.03 0.07 0.05 0.40*** 1
12 Past Experience Recognition 0.09 -0.07 -0.06 0.09 0.07 -0.001 0.01 -0.004 -0.01 0.30*** 0.49*** 1
1) Pair-wise pearson correlations are reported. Significant levels are for two-sided test. * denotes significant at 10% level, ** at 5% level, *** at 1% level.
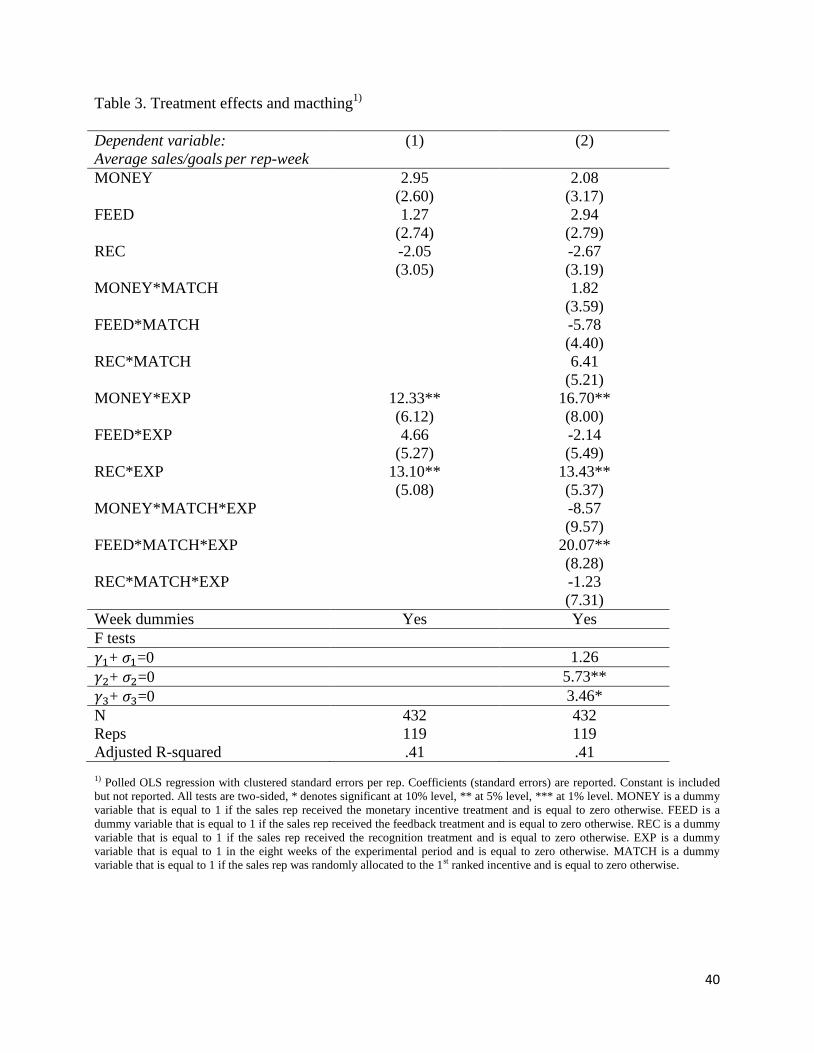
40
Table 3. Treatment effects and macthing1)
Dependent variable:
Average sales/goals per rep-week
(1) (2)
MONEY 2.95
(2.60)
2.08
(3.17)
FEED 1.27
(2.74)
2.94
(2.79)
REC -2.05
(3.05)
-2.67
(3.19)
MONEY*MATCH 1.82
(3.59)
FEED*MATCH -5.78
(4.40)
REC*MATCH 6.41
(5.21)
MONEY*EXP 12.33**
(6.12)
16.70**
(8.00)
FEED*EXP 4.66
(5.27)
-2.14
(5.49)
REC*EXP 13.10**
(5.08)
13.43**
(5.37)
MONEY*MATCH*EXP -8.57
(9.57)
FEED*MATCH*EXP 20.07**
(8.28)
REC*MATCH*EXP -1.23
(7.31)
Week dummies Yes Yes
F tests
𝛾1+ 𝜎1=0 1.26
𝛾2+ 𝜎2=0 5.73**
𝛾3+ 𝜎3=0 3.46*
N 432 432
Reps 119 119
Adjusted R-squared .41 .41
1) Polled OLS regression with clustered standard errors per rep. Coefficients (standard errors) are reported. Constant is included
but not reported. All tests are two-sided, * denotes significant at 10% level, ** at 5% level, *** at 1% level. MONEY is a dummy
variable that is equal to 1 if the sales rep received the monetary incentive treatment and is equal to zero otherwise. FEED is a
dummy variable that is equal to 1 if the sales rep received the feedback treatment and is equal to zero otherwise. REC is a dummy
variable that is equal to 1 if the sales rep received the recognition treatment and is equal to zero otherwise. EXP is a dummy
variable that is equal to 1 in the eight weeks of the experimental period and is equal to zero otherwise. MATCH is a dummy
variable that is equal to 1 if the sales rep was randomly allocated to the 1st ranked incentive and is equal to zero otherwise.
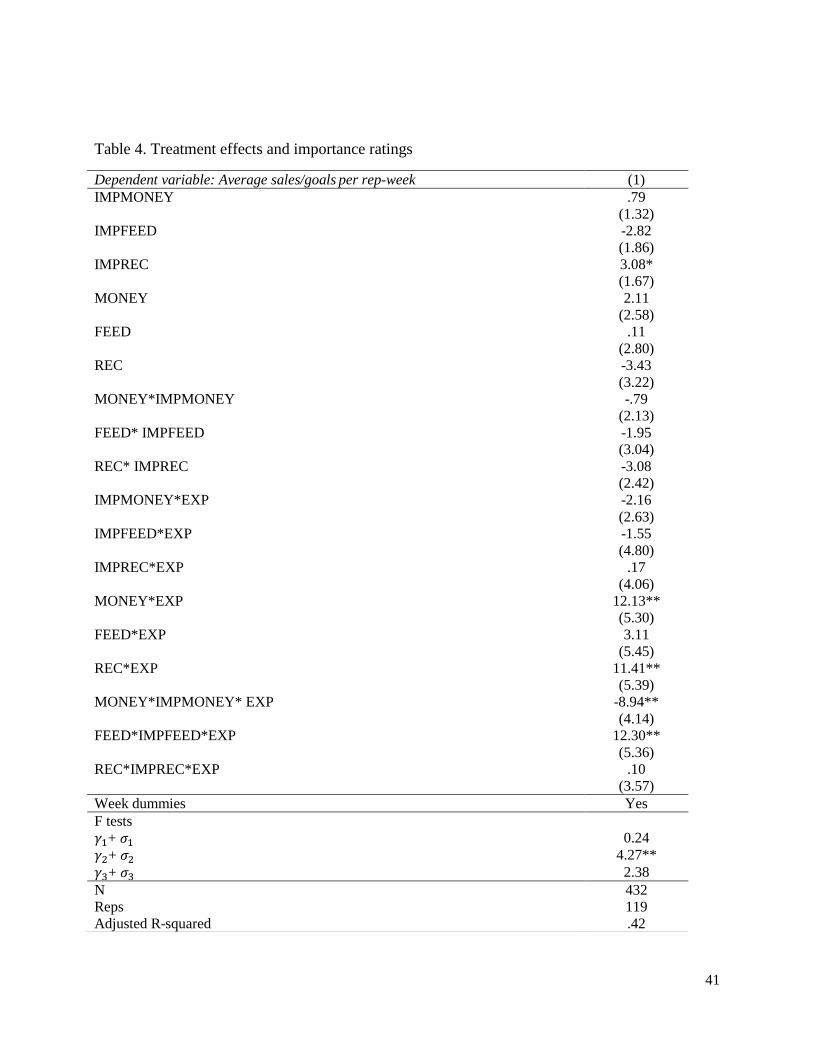
41
Table 4. Treatment effects and importance ratings
Dependent variable: Average sales/goals per rep-week (1)
IMPMONEY .79
(1.32)
IMPFEED -2.82
(1.86)
IMPREC 3.08*
(1.67)
MONEY 2.11
(2.58)
FEED .11
(2.80)
REC -3.43
(3.22)
MONEY*IMPMONEY -.79
(2.13)
FEED* IMPFEED -1.95
(3.04)
REC* IMPREC -3.08
(2.42)
IMPMONEY*EXP -2.16
(2.63)
IMPFEED*EXP -1.55
(4.80)
IMPREC*EXP .17
(4.06)
MONEY*EXP 12.13**
(5.30)
FEED*EXP 3.11
(5.45)
REC*EXP 11.41**
(5.39)
MONEY*IMPMONEY* EXP -8.94**
(4.14)
FEED*IMPFEED*EXP 12.30**
(5.36)
REC*IMPREC*EXP .10
(3.57)
Week dummies Yes
F tests
𝛾1+ 𝜎1 0.24
𝛾2+ 𝜎2 4.27**
𝛾3+ 𝜎3 2.38
N 432
Reps 119
Adjusted R-squared .42

42
1) Polled OLS regression with clustered standard errors per rep. Coefficients (standard errors) are reported. Constant is included
but not reported. All tests are two-sided, * denotes significant at 10% level, ** at 5% level, *** at 1% level. MONEY is a dummy
variable that is equal to 1 if the sales rep received the monetary incentive treatment and is equal to zero otherwise. FEED is a
dummy variable that is equal to 1 if the sales rep received the feedback treatment and is equal to zero otherwise. REC is a dummy
variable that is equal to 1 if the sales rep received the recognition treatment and is equal to zero otherwise. EXP is a dummy
variable that is equal to 1 in the eight weeks of the experimental period and is equal to zero otherwise. IMPMONEY is the
standardized average importance attributed to monetary incentives. IMPFEED is the standardized average importance attributed
to feedback. IMPREC is the standardized average importance attributed to recognition.
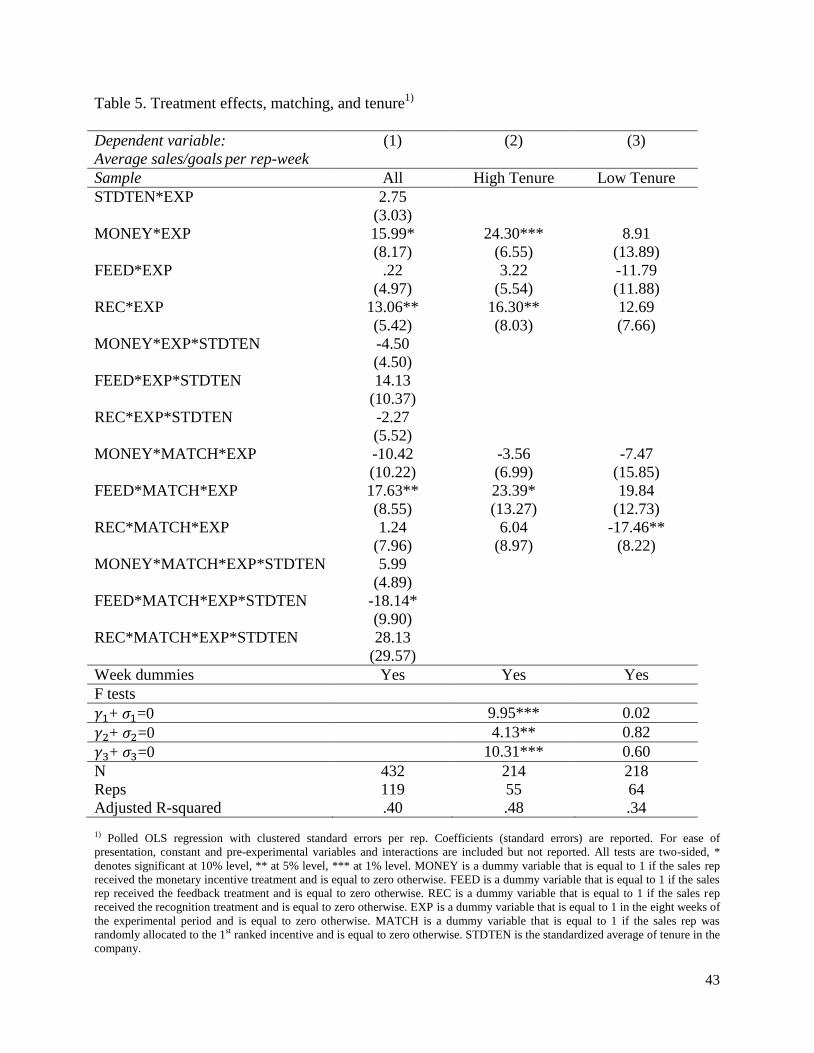
43
Table 5. Treatment effects, matching, and tenure1)
Dependent variable:
Average sales/goals per rep-week
(1) (2) (3)
Sample All High Tenure Low Tenure
STDTEN*EXP 2.75
(3.03)
MONEY*EXP 15.99*
(8.17)
24.30***
(6.55)
8.91
(13.89)
FEED*EXP .22
(4.97)
3.22
(5.54)
-11.79
(11.88)
REC*EXP 13.06**
(5.42)
16.30**
(8.03)
12.69
(7.66)
MONEY*EXP*STDTEN -4.50
(4.50)
FEED*EXP*STDTEN 14.13
(10.37)
REC*EXP*STDTEN -2.27
(5.52)
MONEY*MATCH*EXP -10.42
(10.22)
-3.56
(6.99)
-7.47
(15.85)
FEED*MATCH*EXP 17.63**
(8.55)
23.39*
(13.27)
19.84
(12.73)
REC*MATCH*EXP 1.24
(7.96)
6.04
(8.97)
-17.46**
(8.22)
MONEY*MATCH*EXP*STDTEN 5.99
(4.89)
FEED*MATCH*EXP*STDTEN -18.14*
(9.90)
REC*MATCH*EXP*STDTEN 28.13
(29.57)
Week dummies Yes Yes Yes
F tests
𝛾1+ 𝜎1=0 9.95*** 0.02
𝛾2+ 𝜎2=0 4.13** 0.82
𝛾3+ 𝜎3=0 10.31*** 0.60
N 432 214 218
Reps 119 55 64
Adjusted R-squared .40 .48 .34
1) Polled OLS regression with clustered standard errors per rep. Coefficients (standard errors) are reported. For ease of
presentation, constant and pre-experimental variables and interactions are included but not reported. All tests are two-sided, *
denotes significant at 10% level, ** at 5% level, *** at 1% level. MONEY is a dummy variable that is equal to 1 if the sales rep
received the monetary incentive treatment and is equal to zero otherwise. FEED is a dummy variable that is equal to 1 if the sales
rep received the feedback treatment and is equal to zero otherwise. REC is a dummy variable that is equal to 1 if the sales rep
received the recognition treatment and is equal to zero otherwise. EXP is a dummy variable that is equal to 1 in the eight weeks of
the experimental period and is equal to zero otherwise. MATCH is a dummy variable that is equal to 1 if the sales rep was
randomly allocated to the 1st ranked incentive and is equal to zero otherwise. STDTEN is the standardized average of tenure in the
company.
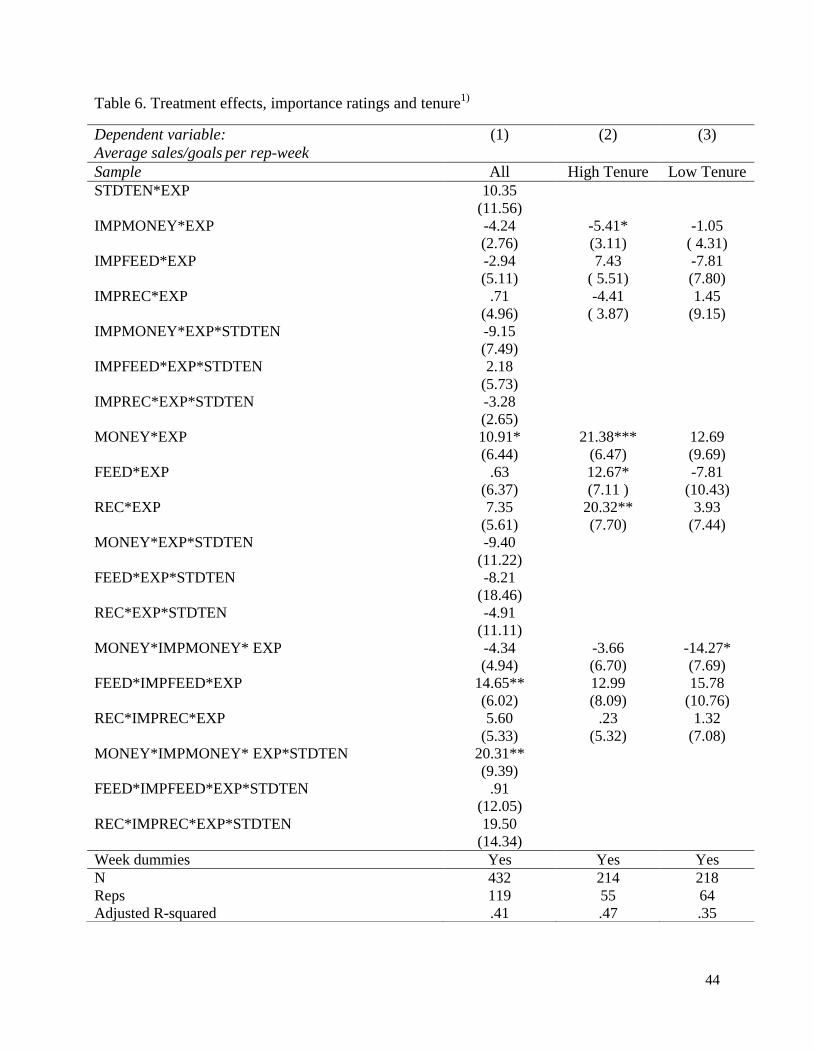
44
Table 6. Treatment effects, importance ratings and tenure1)
Dependent variable:
Average sales/goals per rep-week
(1) (2) (3)
Sample All High Tenure Low Tenure
STDTEN*EXP 10.35
(11.56)
IMPMONEY*EXP -4.24
(2.76)
-5.41*
(3.11)
-1.05
( 4.31)
IMPFEED*EXP -2.94
(5.11)
7.43
( 5.51)
-7.81
(7.80)
IMPREC*EXP .71
(4.96)
-4.41
( 3.87)
1.45
(9.15)
IMPMONEY*EXP*STDTEN -9.15
(7.49)
IMPFEED*EXP*STDTEN 2.18
(5.73)
IMPREC*EXP*STDTEN -3.28
(2.65)
MONEY*EXP 10.91*
(6.44)
21.38***
(6.47)
12.69
(9.69)
FEED*EXP .63
(6.37)
12.67*
(7.11 )
-7.81
(10.43)
REC*EXP 7.35
(5.61)
20.32**
(7.70)
3.93
(7.44)
MONEY*EXP*STDTEN -9.40
(11.22)
FEED*EXP*STDTEN -8.21
(18.46)
REC*EXP*STDTEN -4.91
(11.11)
MONEY*IMPMONEY* EXP -4.34
(4.94)
-3.66
(6.70)
-14.27*
(7.69)
FEED*IMPFEED*EXP 14.65**
(6.02)
12.99
(8.09)
15.78
(10.76)
REC*IMPREC*EXP 5.60
(5.33)
.23
(5.32)
1.32
(7.08)
MONEY*IMPMONEY* EXP*STDTEN 20.31**
(9.39)
FEED*IMPFEED*EXP*STDTEN .91
(12.05)
REC*IMPREC*EXP*STDTEN 19.50
(14.34)
Week dummies Yes Yes Yes
N 432 214 218
Reps 119 55 64
Adjusted R-squared .41 .47 .35

45
1) Polled OLS regression with clustered standard errors per rep. Coefficients (standard errors) are reported. For ease of
presentation, constant and pre-experimental variables and interactions are included but not reported. All tests are two-sided, *
denotes significant at 10% level, ** at 5% level, *** at 1% level. MONEY is a dummy variable that is equal to 1 if the sales rep
received the monetary incentive treatment and is equal to zero otherwise. FEED is a dummy variable that is equal to 1 if the sales
rep received the feedback treatment and is equal to zero otherwise. REC is a dummy variable that is equal to 1 if the sales rep
received the recognition treatment and is equal to zero otherwise. EXP is a dummy variable that is equal to 1 in the eight weeks of
the experimental period and is equal to zero otherwise. IMPMONEY is the standardized average importance attributed to
monetary incentives. IMPFEED is the standardized average importance attributed to feedback. IMPREC is the standardized
average importance attributed to recognition. STDTEN is the standardized average of tenure in the company.