Moving Beyond Odds Ratios: Estimating and Presenting Absolute Risk Differences and Risk Ratios

What do all these numbers mean? Odds ratios, relative risks,
and number needed to treat.
Steve SimonP.Mean Consultingwww.pmean.com

2. Why do I offer this webinar for free?
I offer free statistics webinars partly for fun and partly to build up goodwill for my consulting business, – www.pmean.com/consult.html.
Also see my Facebook and LinkedIn pages– www.facebook.com/pmean– www.linkedin.com/in/pmean
I provide a free newsletter about Statistics, The Monthly Mean.– www.pmean.com/news – www.facebook.com/group.php?gid=302778306676

3. Abstract
• The odds ratio and the relative risk are both measures of risk used for binary outcomes, but sometimes they can differ markedly from one another. The relative risk offers a more natural interpretation, but certain research designs preclude its computation.

4. Abstract
• Another measure of risk, the number needed to treat, provides comparisons on an absolute rather than relative scale and allow you to assess the trade-offs between effects and harms. No statistical experience is necessary.

5. Objectives
In this class you will learn how to:• compute an odds ratio and a relative risk
from a two by two table;• list the types of research designs where
the relative risk should not be computed, and
• make clinical judgments about the benefits and harms of a therapy using the number needed to treat/harm.

6. Sources
Part of the material for this webinar comes from:– Simon SD. Understanding the odds ratio and the
relative risk. J Androl. 2001 Jul-Aug;22(4):533-6.– Stats: Odds ratio versus relative risk (January 9,
2001).• http://www.childrens-mercy.org/stats/journal/oddsratio.asp
– Stats: Number needed to treat (January 27, 2000).• http://www.childrens-mercy.org/stats/ask/nnt.asp
7. Very bad jokeA doctor is advising her patient about the risks of
an upcoming surgery. She warned that the probability that the patient would die during surgery was 60%. Then she looked up an said, no wait, the risk is twice as big in your demographic group. The chances that you will die during surgery is actually 120%. The patient seemed a bit confused. I know what a 100% risk of mortality would be—I’m a goner. But what would a 120% risk of mortality be? The doctor replied, that is a fate worse than death.
8. Pop quiz #1
A relative risk should not be computed for the following design because the prevalence of the disease is artificially constrained.
1. Case-control design2. Cohort design3. Cross-sectional design4. Historical control design5. Don’t know/Not sure
9. Pop quiz #2
The odds ratio and the relative risk are close to one another when
1. The prevalence of the disease is low2. The prevalence of the disease is high3. The sample size is small4. The sample size is large5. Don’t know/Not sure
10. Pop quiz #3
If a drug cures 50% of all patients and 40% are cured on a placebo, then the number needed to treat (NNT) is:
1. NTT=22. NNT=2.53. NNT=104. NNT=505. Don’t know/Not sure

11. Odds ratio/relative risk
Consider the following data on survival of passengers on the Titanic. Clearly, a male passenger on the Titanic was more likely to die than a female passenger. But how much more likely? You can compute the odds ratio or the relative risk to answer this question.

12. Odds ratio/relative risk
The odds ratio compares the relative odds of death in each group.– For females, 2 to 1 odds against dying– For males, almost 5 to 1 in favor of death
The odds ratio is approximately 10.
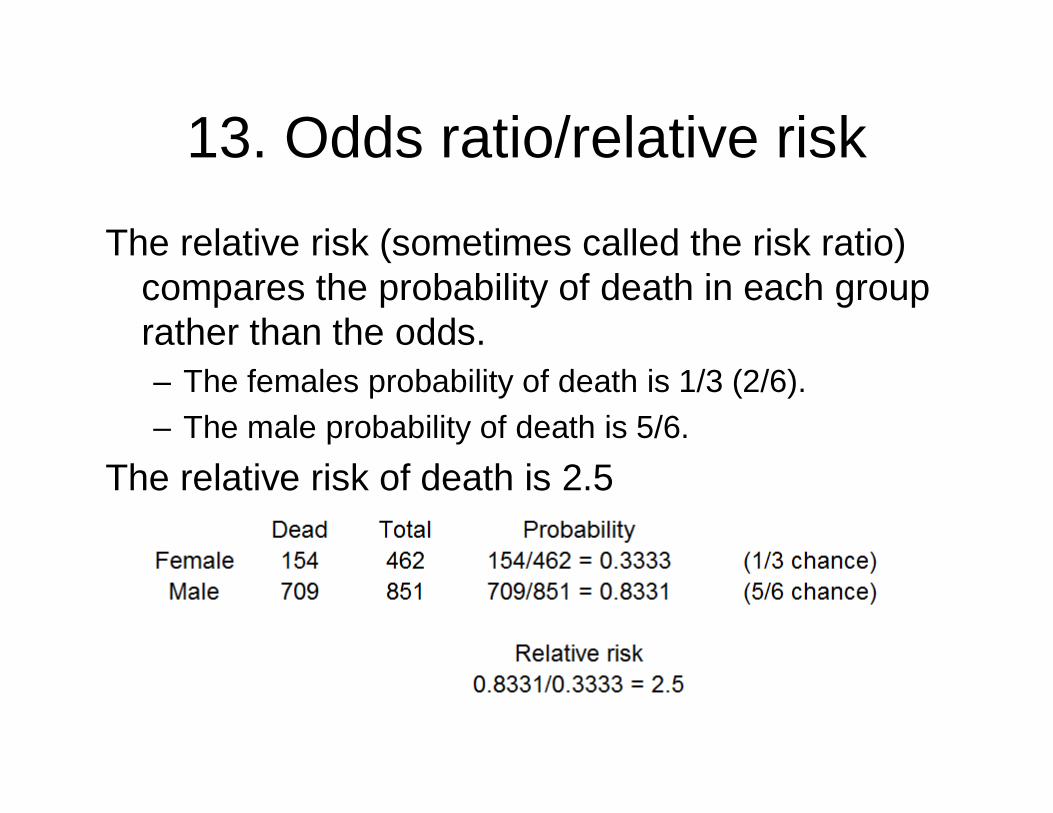
13. Odds ratio/relative risk
The relative risk (sometimes called the risk ratio) compares the probability of death in each group rather than the odds.– The females probability of death is 1/3 (2/6).– The male probability of death is 5/6.
The relative risk of death is 2.5

14. Odds ratio/relative risk
There is quite a difference. Both measurements show that men were more likely to die. But the odds ratio implies that men are much worse off than the relative risk. Which number is a fairer comparison?

15. Odds ratio/relative risk
There are three issues here:1. The relative risk measures events in a way
that is interpretable and consistent with the way people really think.
2. The relative risk, though, cannot always be computed in a research design.
3. Also, the relative risk can sometimes lead to ambiguous and confusing situations.
But first, we need to remember that fractions are funny.

16. Fractions are funny
Suppose you invested money in a stock. On the first day, the value of the stock decreased by 20%. On the second day it increased by 20%. You would think that you have broken even, but that's not true.

17. Fractions are funny
Take the value of the stock and multiply by 0.8 to get the price after the first day. Then multiply by 1.2 to get the price after the second day. The successive multiplications do not cancel out because 0.8 * 1.2 = 0.96. A 20% decrease followed by a 20% increase leaves you slightly worse off.

18. Fractions are funny
It turns out that to counteract a 20% decrease, you need a 25% increase. That is because 0.8 and 1.25 are reciprocal. This is easier to see if you express them as simple fractions: 4/5 and 5/4 are reciprocal fractions.
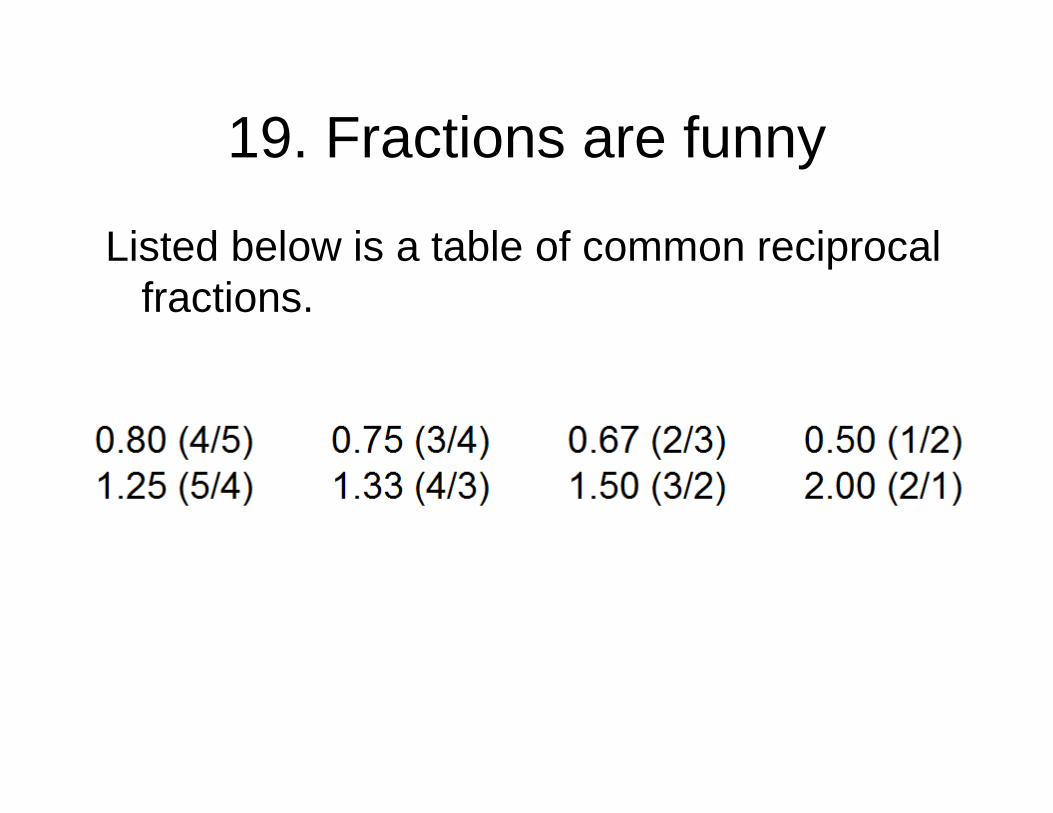
19. Fractions are funny
Listed below is a table of common reciprocal fractions.

20. Fractions are funny
For example, we computed 2.5 as the relative risk in the example above. In this calculation we divided the male probability by the female probability. If we had divided the female probability by the male probability, we would have gotten a relative risk of 0.4. This is fine because 0.4 (2/5) and 2.5 (5/2) are reciprocal fractions.

21. Fractions are funny
Sometimes when we are comparing two groups, we'll put the first group in the numerator and the second group in the denominator. Sometimes we will reverse ourselves and put the second group in the numerator. The numbers may look quite different (e.g., 0.67 and 1.5) but as long as you remember what the reciprocal fraction is, you shouldn't get too confused.

22. The relative risk has a more intuitive interpretation.
The relative risk and the odds ratio are close when the prevalence of the outcome is rare. But when the prevalence is not rare, the odds ratio tends to produce a more extreme value.
Suppose there are two groups, one with a 25% chance of mortality and the other with a 50% chance of mortality. Most people would say that the latter group has it twice as bad. But the odds in the two groups are even (1 to 1) and 3 to 1 against, making the odds ratio 3.

23. The relative risk has a more intuitive interpretation.
Even more extreme examples are possible.– A change from 25% to 75% mortality
represents a relative risk of 3, but an odds ratio of 9.
– A change from 10% to 90% mortality represents a relative risk of 9 but an odds ratio of 81.

24. Research designs that rule out the use of relative risk.
Some research designs, particularly the case-control design, prevent you from computing a relative risk. A case-control design involves the selection of research subjects on the basis of the outcome measurement rather than on the basis of the exposure.
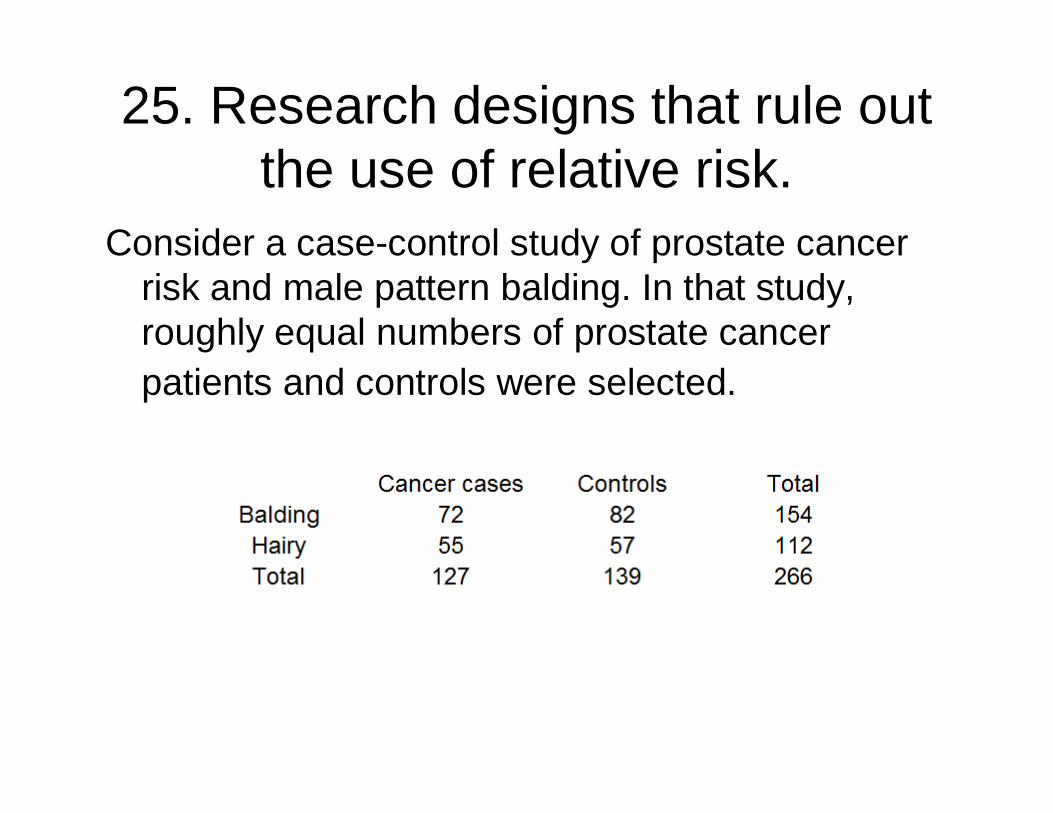
25. Research designs that rule out the use of relative risk.
Consider a case-control study of prostate cancer risk and male pattern balding. In that study, roughly equal numbers of prostate cancer patients and controls were selected.

26. Research designs that rule out the use of relative risk.
In this type of study, you can estimate the probability of baldness for cancer patients, but you can't calculate the probability of cancer for bald patients. The prevalence of prostate cancer was artificially inflated to almost 50% by the nature of the case-control design.
So you would need additional information or a different type of research design to estimate the relative risk of prostate cancer for patients with different types of male pattern balding.

27. Research designs that rule out the use of relative risk.
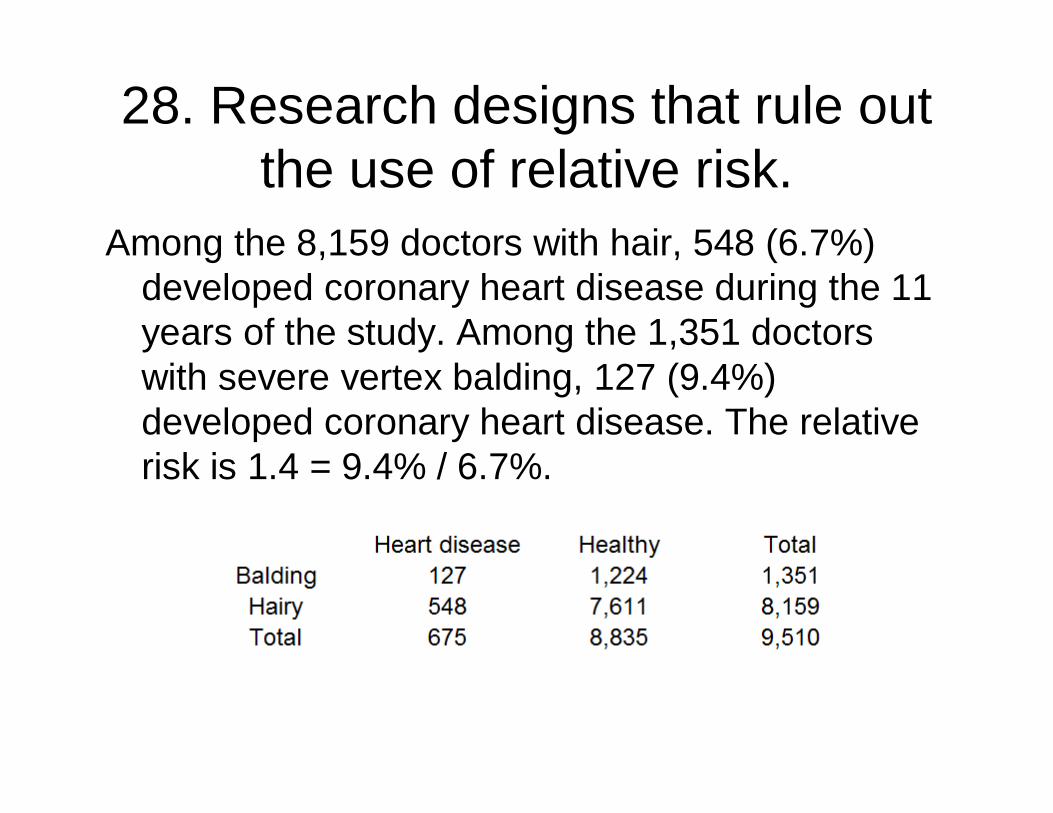
Contrast this with data from a cohort study of male physicians. In this study of the association between male pattern baldness and coronary heart disease, the researchers could estimate relative risks, since 1,446 physicians had coronary heart disease events during the 11-year follow-up period.
28. Research designs that rule out the use of relative risk.
Among the 8,159 doctors with hair, 548 (6.7%) developed coronary heart disease during the 11 years of the study. Among the 1,351 doctors with severe vertex balding, 127 (9.4%) developed coronary heart disease. The relative risk is 1.4 = 9.4% / 6.7%.

29. Research designs that rule out the use of relative risk.
You can always calculate and interpret the odds ratio in a case control study. It has a reasonable interpretation as long as the outcome event is rare.

30. Research designs that rule out the use of relative risk.
Another situation which calls for the use of odds ratio is covariate adjustment. It is easy to adjust an odds ratio for confounding variables; the adjustments for a relative risk are much trickier.

31. Research designs that rule out the use of relative risk.
In a study on the likelihood of pregnancy among people with epilepsy, 232 out of 586 males with idiopathic/cryptogenic epilepsy had fathered one or more children. In the control group, the respective counts were 79 out of 109.

32. Research designs that rule out the use of relative risk.
The simple relative risk is 0.55 and the simple odds ratio is 0.25.

33. Research designs that rule out the use of relative risk.
Clearly the probability of fathering a child is strongly dependent on a variety of demographic variables, especially age (the issue of marital status was dealt with by a separate analysis). The control group was 8.4 years older on average (43.5 years versus 35.1), showing the need to adjust for this variable.

34. Research designs that rule out the use of relative risk.
With a multivariate logistic regression model that included age, education, ethnicity and sibship size, the adjusted odds ratio for epilepsy status was 0.36. Although this ratio was closer to 1.0 than the crude odds ratio, it was still highly significant. A comparable adjusted relative risk would be more difficult to compute

35. Ambiguity in the relative risk
There is some ambiguity in the calculation of relative risk, in that you have to decide “risk of what”. The problem is best illustrated with a puzzle presented on the radio show, “Car Talk.”

36. Ambiguity in the relative risk
You have a hundred pound sack of potatoes. Let's assume that these potatoes are 99% water. That means 99 parts water and 1 part potato. These are soggier potatoes than I am used to seeing, but it makes the problem more interesting.
37. Ambiguity in the relative risk
If you dried out the potatoes completely, they would only weigh one pound. But let's suppose you only wanted to dry out the potatoes partially, until they were 98% water. How much would they weigh then?

38. Ambiguity in the relative risk
The counter-intuitive answer is 50 pounds. 98% water means 49 parts water and 1 part potato. An alternative way of thinking about the problem is that in order to double the concentration of potato (from 1% to 2%), you have to remove about half of the water.

39. Ambiguity in the relative risk
Relative risks have the same sort of counter-intuitive behavior. A small relative change in the probability of a common event's occurrence can be associated with a large relative change in the opposite probability (the probability of the event not occurring).
40. Ambiguity in the relative risk
Consider a recent study on physician recommendations for patients with chest pain (Schulman et al 1999). This study found that when doctors viewed videotape of hypothetical patients, race and sex influenced their recommendations. One of the findings was that doctors were more likely to recommend cardiac catheterization for men than for women.
41. Ambiguity in the relative risk
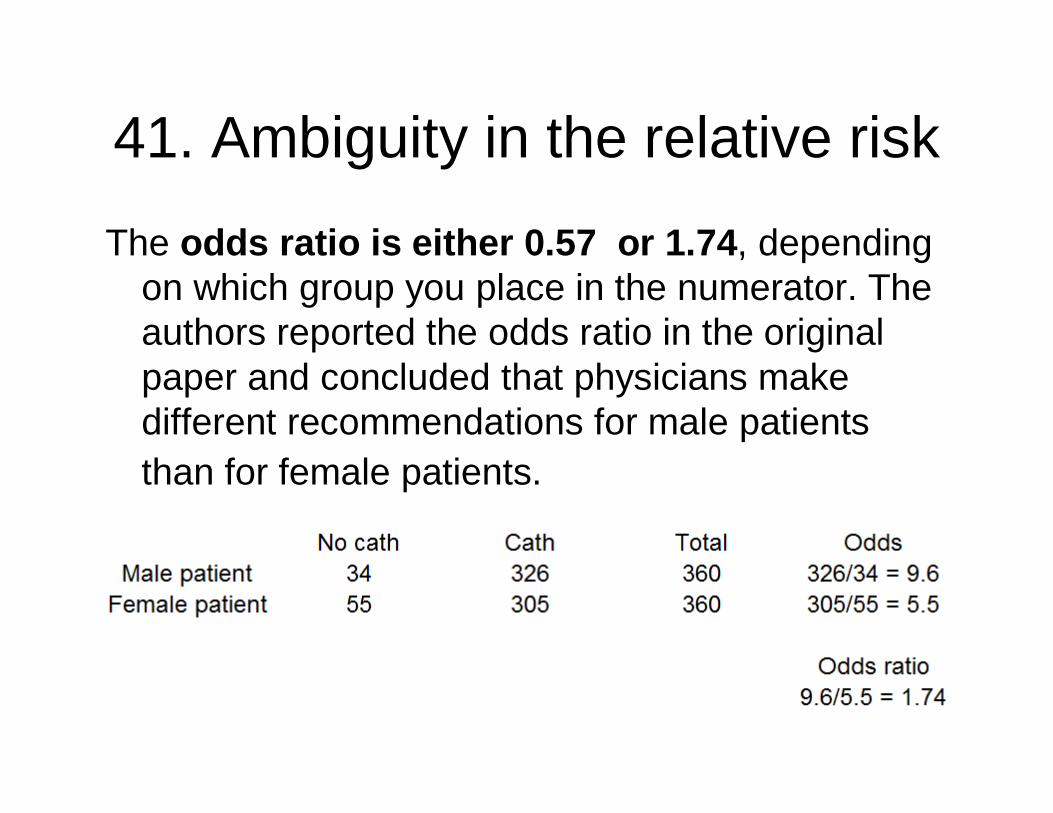
The odds ratio is either 0.57 or 1.74, depending on which group you place in the numerator. The authors reported the odds ratio in the original paper and concluded that physicians make different recommendations for male patients than for female patients.

42. Ambiguity in the relative risk
A critique of this study noted among other things that the odds ratio overstated the effect, and that the relative risk was only 0.93 (reciprocal 1.07). The critics claimed that the odds ratio overstated the tendency for physicians to make treat male and female patients differently.

43. Ambiguity in the relative risk
But consider the opposite perspective. The rates for recommending a less aggressive intervention than catheterization was 15.3% for doctors viewing the female patients and 9.4% for doctors viewing the male patients, a relative risk of 1.63 (reciprocal 0.61).
44. Ambiguity in the relative riskThis is the same thing that we just saw in the Car
Talk puzzler: a small relative change in the water content implies a large relative change in the potato content. In the physician recommendation study, a small relative change in the probability of a recommendation in favor of catheterization corresponds to a large relative change in the probability of recommending against catheterization.
Thus, for every problem, there are two possible ways to compute relative risk.

45. Ambiguity in the relative risk
Consider a breast feeding study. Are we trying to measure how much an intervention increases the probability of breast feeding success or are we trying to see how much the intervention decreases the probability of breast feeding failure? The odds ratio, which treats both events symmetrically is 6.2 (reciprocal 0.16).

46. Ambiguity in the relative risk
Again the odds ratio was criticized for overstating the degree of risk. The relative risk of 1.45 (reciprocal 0.69) for this data is much less extreme than the odds ratio.

47. Ambiguity in the relative risk
But when the relative risk is computed for the rate of breast feeding success, the value (4.2, reciprocal 0.24), it is much closer to the odds ratio.
48. Ambiguity in the relative risk
So which relative risk is correct: the 1.45 which represents the increase in bf failure rate when the intervention is not used, or the 4.2, which represents the increase in the bf success rate if the intervention is used? In some cases, the choice of which relative risk to use is obvious, but in other cases it is less clear. It’s sort of like trying to decide if a zebra is white with black stripes or black with white stripes.

49. Practice exercises1. Read the abstract from Socioeconomic
disparities in intimate partner violence against Native American women: a cross-sectional study. Malcoe LH, Duran BM, Montgomery JM. BMC Med 2004: 2(1); 20. The authors report an adjusted odds ratio of 5.0 for low socioeconomic index. Compute a crude odds ratio using the data that appears in the abstract. Does it differ much from the adjusted odds ratio? Interpret the adjusted odds ratio and its associated confidence interval.
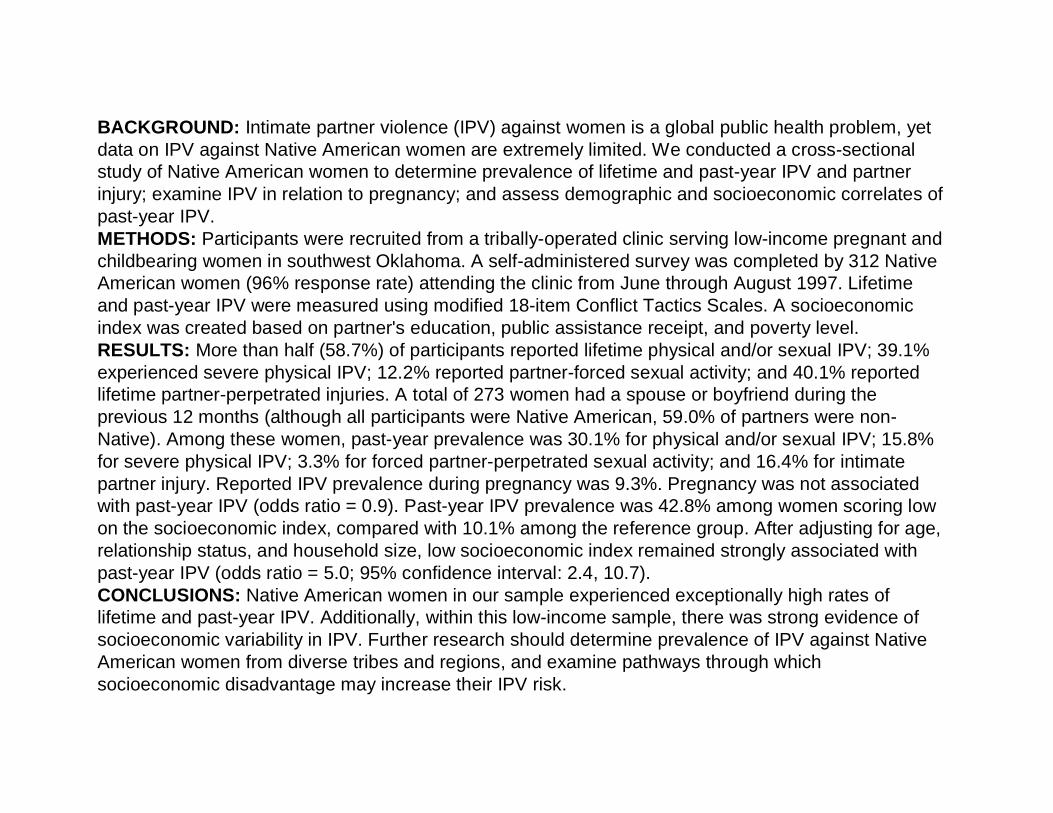
BACKGROUND: Intimate partner violence (IPV) against women is a global public health problem, yet data on IPV against Native American women are extremely limited. We conducted a cross-sectional study of Native American women to determine prevalence of lifetime and past-year IPV and partner injury; examine IPV in relation to pregnancy; and assess demographic and socioeconomic correlates of past-year IPV. METHODS: Participants were recruited from a tribally-operated clinic serving low-income pregnant and childbearing women in southwest Oklahoma. A self-administered survey was completed by 312 Native American women (96% response rate) attending the clinic from June through August 1997. Lifetime and past-year IPV were measured using modified 18-item Conflict Tactics Scales. A socioeconomic index was created based on partner's education, public assistance receipt, and poverty level.RESULTS: More than half (58.7%) of participants reported lifetime physical and/or sexual IPV; 39.1% experienced severe physical IPV; 12.2% reported partner-forced sexual activity; and 40.1% reported lifetime partner-perpetrated injuries. A total of 273 women had a spouse or boyfriend during the previous 12 months (although all participants were Native American, 59.0% of partners were non-Native). Among these women, past-year prevalence was 30.1% for physical and/or sexual IPV; 15.8% for severe physical IPV; 3.3% for forced partner-perpetrated sexual activity; and 16.4% for intimate partner injury. Reported IPV prevalence during pregnancy was 9.3%. Pregnancy was not associated with past-year IPV (odds ratio = 0.9). Past-year IPV prevalence was 42.8% among women scoring low on the socioeconomic index, compared with 10.1% among the reference group. After adjusting for age, relationship status, and household size, low socioeconomic index remained strongly associated with past-year IPV (odds ratio = 5.0; 95% confidence interval: 2.4, 10.7).CONCLUSIONS: Native American women in our sample experienced exceptionally high rates of lifetime and past-year IPV. Additionally, within this low-income sample, there was strong evidence of socioeconomic variability in IPV. Further research should determine prevalence of IPV against Native American women from diverse tribes and regions, and examine pathways through which socioeconomic disadvantage may increase their IPV risk.
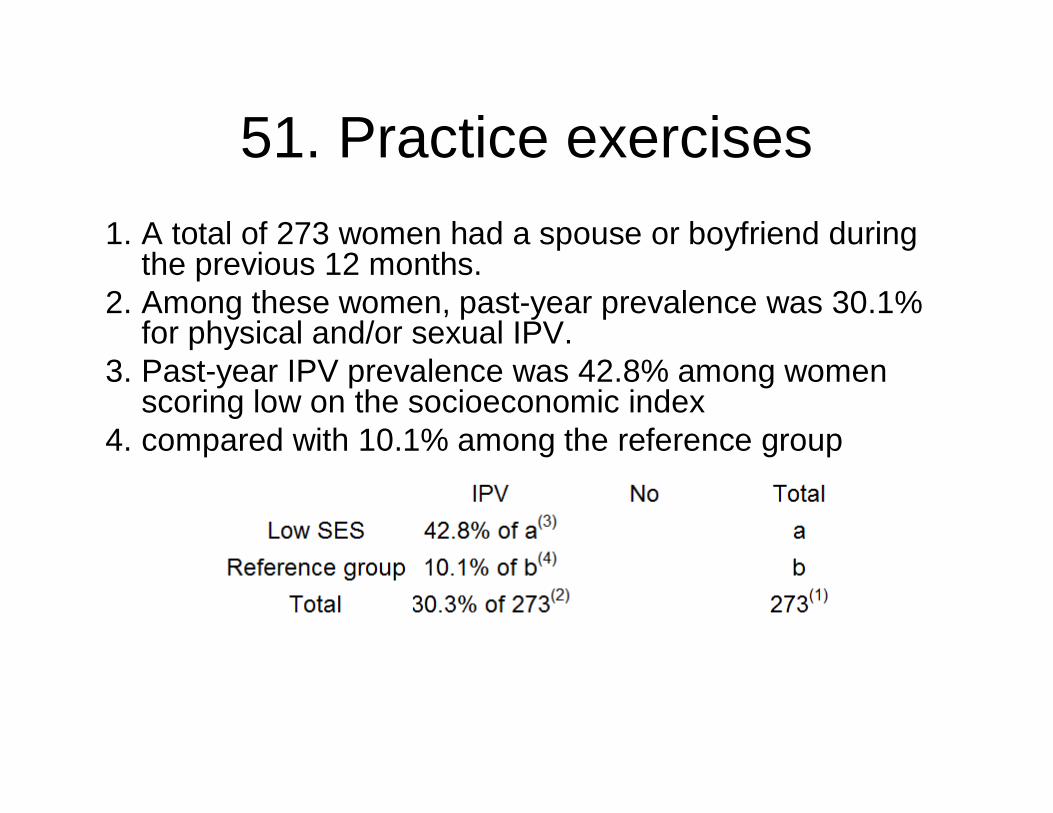
51. Practice exercises1. A total of 273 women had a spouse or boyfriend during
the previous 12 months.2. Among these women, past-year prevalence was 30.1%
for physical and/or sexual IPV.3. Past-year IPV prevalence was 42.8% among women
scoring low on the socioeconomic index4. compared with 10.1% among the reference group

52. Practice exercises
You don’t need to know the row totals (a and b) in order to calculate odds.

53. Practice exercises
• 2. Read the abstract from Tongue lesions in psoriasis: a controlled study. DaneshpazhoohM, Moslehi H, Akhyani M, Etesami M. BMC Dermatol 2004: 4(1); 16. The crude odds ratios for Fissured Tongue and for benign migratory glossitis have been removed from this abstract. Calculate these value using the information provided in the abstract. Interpret these odds ratios and the associated confidence intervals.

BACKGROUND: Our objective was to study tongue lesions and their significance in psoriatic patients. METHODS: The oral mucosa was examined in 200 psoriatic patients presenting to Razi Hospital in Tehran, Iran, and 200 matched controls. RESULTS: Fissured tongue (FT) and benign migratory glossitis (BMG) were the two most frequent findings. FT was seen more frequently in psoriatic patients (n = 66, 33%) than the control group (n = 19, 9.5%) [odds ratio (OR): [DELETED]; 95% confidence interval (CI): 2.61-8.52] (p-value < 0.0001). BMG, too, was significantly more frequent in psoriatic patients (28 cases, 14%) than the control group (12 cases, 6%) (OR: [DELETED]; 95% CI: 1.20-5.50) (p-value < 0.012). In 11 patients (5.5%), FT and BMG coexisted. FT was more frequent in pustular psoriasis (7 cases, 53.8%) than erythemato-squamous types (56 cases, 30.4%). On the other hand, the frequency of BMG increased with the severity of psoriasis in plaque-type psoriasis assessed by psoriasis area and severity index (PASI) score. CONCLUSIONS: Nonspecific tongue lesions are frequently observed in psoriasis. Further studies are recommended to substantiate the clinical significance of these seemingly nonspecific findings in suspected psoriatic cases.
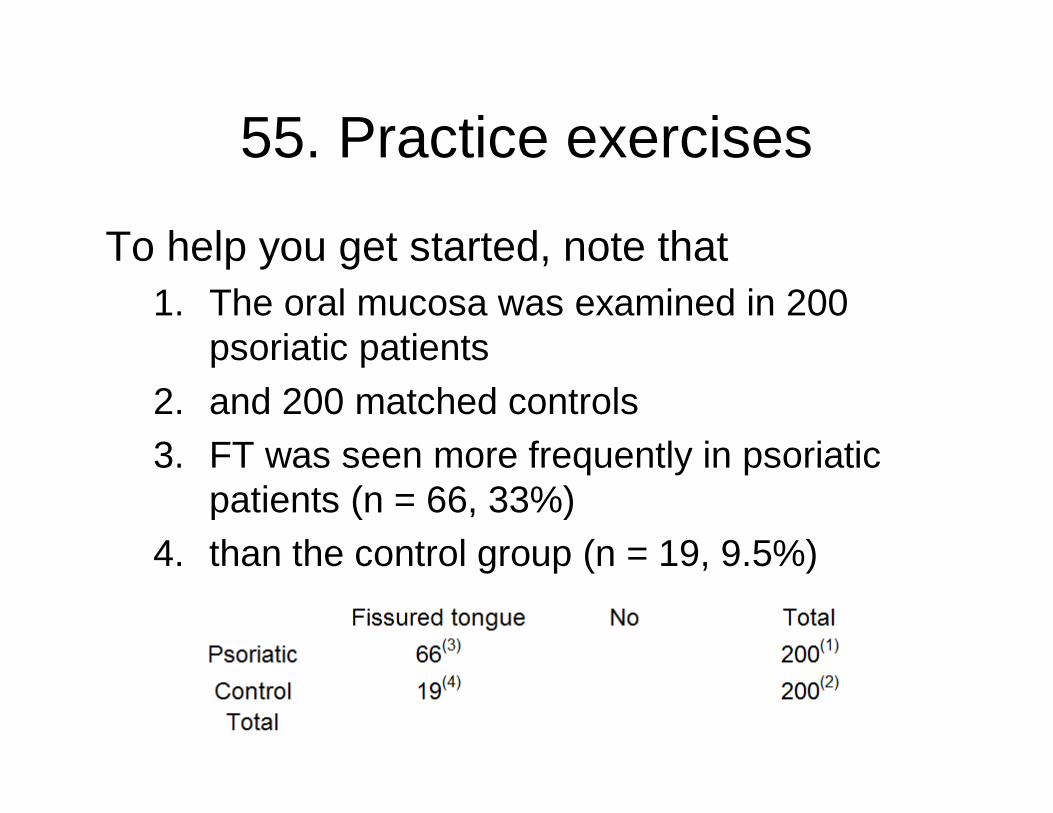
55. Practice exercises
To help you get started, note that1. The oral mucosa was examined in 200
psoriatic patients2. and 200 matched controls3. FT was seen more frequently in psoriatic
patients (n = 66, 33%)4. than the control group (n = 19, 9.5%)

56. Practice exercises3. Read the abstract from Breastfeeding
practices in a cohort of inner-city women: the role of contraindications. England L, Brenner R, Bhaskar B, Simons-Morton B, Das A, RevenisM, Mehta N, Clemens J. BMC Public Health 2003: 3(1); 28.. The authors report an adjusted odds ratio of 0.19 for presence of contraindication. Compute a crude odds ratio using the data that appears in the abstract. Does it differ much from the adjusted odds ratio? Interpret the adjusted odds ratio and its associated confidence interval.

BACKGROUND: Little is known about the role of breastfeeding contraindications in breastfeeding practices. Our objectives were to 1) identify predictors of breastfeeding initiation and duration among a cohort of predominantly low-income, inner-city women, and 2) evaluate the contribution of breastfeeding contraindications to breastfeeding practices. METHODS: Mother-infant dyads were systematically selected from 3 District of Columbia hospitals between 1995 and 1996. Breastfeeding contraindications and potential predictors of breastfeeding practices were identified through medical record reviews and interviews conducted after delivery (baseline). Interviews were conducted at 3-7 months postpartum and again at 7-12 months postpartum to determine breastfeeding initiation ratesand duration. Multivariable logistic regression analysis was used to identify baseline factors associated with initiation of breastfeeding. Cox proportional hazards models were generated to identify baseline factors associated with duration of breastfeeding. RESULTS: Of 393 study participants, 201 (51%) initiated breastfeeding. A total of 61 women (16%) had at lease one documented contraindication to breastfeeding; 94% of these had a history of HIV infection and/or cocaine use. Of the 332 women with no documented contraindications, 58% initiated breastfeeding, vs. 13% of women with a contraindication. In adjusted analysis, factors most strongly associated with breastfeeding initiation were presence of a contraindication (adjusted odds ratio [AOR], 0.19; 95% confidence interval [CI], 0.08-0.47), and mother foreign-born (AOR, 4.90; 95% CI, 2.38-10.10). Twenty-five percent of study participants who did not initiate breastfeeding cited concern about passing dangerous things to their infants through breast milk. Factors associated with discontinuation of breastfeeding (all protective) included mother foreign-born (hazard ratio [HR], 0.55; 95% CI 0.39-0.77) increasing maternal age (HR for 5-year increments, 0.80; 95% CI, 0.69-0.92), and infant birth weight > or = 2500 grams (HR, 0.45; 95% CI, 0.26-0.80). CONCLUSIONS:Breastfeeding initiation rates and duration were suboptimal in this inner-city population. Many women who did not breastfeed had contraindications and/or were concerned about passing dangerous things to their infants through breast milk. It is important to consider the prevalence of contraindications to breastfeeding when evaluating breastfeeding practices in high-risk communities.

58. Practice exercises
Here’s something to help you get started.1. Of 393 study participants,2. 201 (51%) initiated breastfeeding.3. A total of 61 women (16%) had at lease one documented
contraindication to breastfeeding;4. Of the 332 women with no documented contraindications,5. 58% initiated breastfeeding,6. vs. 13% of women with a contraindication.

59. Practice exercises
4. Read the abstract from Treatment of Retinopathy of Prematurity with topical ketorolac tromethamine: a preliminary study. Avila-Vazquez M, Maffrand R, Sosa M, Franco M, De Alvarez BV, Cafferata ML, BergelE. BMC Pediatr 2004: 4(1); 15. The relative risk for cryotherapy has been removed. Calculate this value using the information provided in the abstract. Interpret this relative risk and the associated confidence interval.

BACKGROUND: Retinopathy of Prematurity (ROP) is a common retinal neovascular disorder of premature infants. It is of variable severity, usually heals with mild or no sequelae, but may progress to blindness from retinal detachments or severe retinal scar formation. This is a preliminary report of the effectiveness and safety of a new and original use of topical ketorolac in preterm newborn to prevent the progression of ROP to the more severe forms of this disease. METHODS: From January 2001 to December 2002, all fifty nine preterm newborns with birthweight less than 1250 grams or gestational age less than 30 weeks of gestational age admitted to neonatal intensive care were eligible for treatment with topical ketorolac (0.25 milligrams every 8 hours in each eye). The historical comparison group included all 53 preterm newborns, with the same inclusion criteria, admitted between January 1999 and December 2000. RESULTS: Groups were comparable in terms of weight distribution, Apgar score at 5 minutes, incidence of sepsis, intraventricular hemorrhage and necrotizing enterocolitis. The duration of oxygen therapy was significantly longer in the control group. In the ketorolac group, among 43 children that were alive at discharge, one (2.3%) developed threshold ROP and cryotherapy was necessary. In the comparison group 35 children survived, and six child (17%) needed cryotherapy (Relative Risk [DELETED], 95%CI 0.00 to 0.80, p = 0.041). Adjusting by duration of oxygen therapy did not significantly change these results. Adverse effects attributable to ketorolac were not detected. CONCLUSIONS: This preliminary report suggests that ketorolac in the form of an ophthalmic solution can reduce the risk of developing severe ROP in very preterm newborns, without producing significant adverse side effects. These results, although promising, should be interpreted with caution because of the weakness of the study design. This is an inexpensive and simple intervention that might ameliorate the progression of a disease with devastating consequences for children and their families. We believe that next logical step would be to assess the effectiveness of this intervention in a randomized controlled trial of adequate sample size.

61. Practice exercises
Here’s something to help you get started.1. In the ketorolac group, among 43 children that were
alive at discharge,2. one (2.3%) developed threshold ROP and
cryotherapy was necessary.3. In the comparison group 35 children survived,4. and six child (17%) needed cryotherapy

62. Practice exercises5. Read the abstract from Misoprostol for treating
postpartum haemorrhage: a randomized controlled trial [ISRCTN72263357]. Hofmeyr GJ, Ferreira S, Nikodem VC, Mangesi L, Singata M, Jafta Z, MaholwanaB, Mlokoti Z, Walraven G, Gulmezoglu AM. BMC Pregnancy Childbirth 2004: 4(1); 16. The relative risks for reduced blood loss, shivering, and pyrexia have been removed. Calculate these values using the information provided in the abstract. Interpret these relative risks and their associated confidence intervals.

BACKGROUND: Postpartum haemorrhage remains an important cause of maternal death despite treatment with conventional therapy. Uncontrolled studies and one randomised comparison with conventional oxytocics have reported dramatic effects with high-dose misoprostol, usually given rectally, for treatment of postpartum haemorrhage, but this has not been evaluated in a placebo-controlled trial. METHODS: The study was conducted at East London Hospital Complex, Tembisa and Chris HaniBaragwanath Hospitals, South Africa. Routine active management of the third stage of labour was practised. Women with more than usual postpartum bleeding thought to be related to inadequate uterine contraction were invited to participate, and to sign informed consent. All routine treatment was given from a special 'Postpartum Haemorrhage Trolley'. In addition, participants who consented were enrolled by drawing the next in a series of randomised treatment packs containing either misoprostol 5 x 200 microg or similar placebo, which were given 1 orally, 2 sublingually and 2 rectally. RESULTS: With misoprostol there was a trend to reduced blood loss >/=500 ml in 1 hour after enrolment measured in a flat plastic 'fracture bedpan', the primary outcome (6/117 vs 11/120, relative risk [DELETED]; 95% confidence interval 0.21 to 1.46). There was no difference in mean blood loss or haemoglobin level on day 1 after birth < 6 g/dl or blood transfusion. Side-effects were increased, namely shivering (63/116 vs 30/118; [DELETED], 1.50 to 3.04) and pyrexia > 38.5 degrees C (11/114 vs 2/118; [DELETED], 1.29 to 25). In the misoprostol group 3 women underwent hysterectomy of whom 1 died, and there were 2 further maternal deaths. CONCLUSIONS: Because of a lower than expected incidence of the primary outcome in the placebo group, the study was underpowered. We could not confirm the dramatic effect of misoprostolreported in several unblinded studies, but the results do not exclude a clinically important effect. Larger studies are needed to assess substantive outcomes and risks before misoprostol enters routine use.

64. Practice exercises
With misoprostol there was a trend to reduced blood loss >/=500 ml in 1 hour after enrolment measured in a flat plastic 'fracture bedpan', the primary outcome (6/117 vs 11/120, relative risk [DELETED]; 95% confidence interval 0.21 to 1.46).
65. Number needed to treat
Medical professional have come to the realization that absolute changes in risk are more important than relative changes in risk. Tripling a rare outcome may be less important than a 10% change in a common outcome.

66. Number needed to treat
For example, cigarette smoking causes a ten fold increase in the risk of death from lung cancer and only a two fold increase in the risk of death from heart disease. But heart disease is far more common. Smoking kills many more people through heart disease than it does through lung cancer.

67. Number needed to treat
A nurse recently informed me that my sleep apnea can triple the risk of a stroke if left untreated. But how serious is that for someone who is only 42 years old and otherwise in good health? Three times nothing is nothing, and three times something very small is still very small. I decided to get treatment, but it was more for helping me and my wife to sleep better than a concern about stroke.

68. Number needed to treatA good measure of the absolute risk is the
number needed to treat (NNT). It is the average number of patients that a doctor would need to treat in order to have one additional event occur. A small value (e.g., NNT=2.7) means that a doctor will see a lot of events in very little time. A large value (e.g., NNT=800) means that the doctor will have to treat a large number of patients in order to see a very few events.

69. Number needed to treatWhen you are measuring an increase in bad
events like side effects that might be associated with a treatment, then the number needed to treat is sometimes described as the number needed to harm (NNH). Often you can quantify the tradeoffs between the benefits and side effects of a treatment by comparing the NNT and NNH values.
70. Number needed to treatHere are some examples of NNT, found at
the Bandolier web site– http://www.jr2.ox.ac.uk/bandolier/index.html.
Prevention of post-operative vomiting using Droperidol, NNT=4.4. For every four or five surgery patients treated with Droperidol, you will see one less vomiting incident on average.
71. Number needed to treatPrevention of infection from dog bites using
antibiotics, NNT=16. For every 16 dog bites treated with antibiotics, you would see one fewer infection on average.
Primary prevention of stroke using a daily low dose of aspirin for one year, NNT=102. For every hundred patient years of treatment with aspirin, you will see one fewer stroke on average.
72. Number needed to treatNotice that this last event is a rate.
Assuming that the rates are reasonably homogenous over time, one hundred patient years is equivalent to following ten patients for a decade. Be careful, of course, of rates that are not homogenous over time.

73. Number needed to treatHere's another example (Freemantle, BMJ
1999: 318(7200); 1730-1737).Prevention of cardiac death using beta
blockers among patients with previous myocardial infarction, NNT=42. Compare this to– Antiplatelet agents (NNT=153),– Statins (NNT=94),– Warfarin (NNT=63),– Thrombolysis and aspirin (NNT=24).

74. Number needed to treatTo compute the NNT, you need to subtract
the rate in the treatment group from the rate in the control group and then invert it (divide the difference into 1).
– NNT = 1/(PTreatment - PControl)

75. Number needed to treatA recently published article on the flu
vaccine showed that among the children who received a placebo, 17.9% later had culture confirmed influenza. In the vaccine group, the rate was only 1.3%. This is a 16.6% absolute difference. When you invert this percentage, you get NNT=6. This means that for every six kids who get the vaccine, you will see one less case of flu on average.

76. Number needed to treatThe study also looked at the rate of side
effects. In the vaccine group, 1.9% developed a fever. Only 0.8% of the controls developed a fever. This is an absolute difference of 1.1%. When you invert this percentage, you get NNH=90. This means that for every 90 kids who get the vaccine, you will see one additional fever on average.

77. Number needed to treatSometimes the ratio between NNT and NNH
can prove informative. For this study, NNH/NNT=90/6=15. This tells you that you should expect to see one additional fever for every fifteen cases of flu prevented.

78. Number needed to treatAlthough I am not a medical expert, the
vaccine looks very promising because you can prevent a lot of flu events and only have to put up with a few additional fevers. In general, it takes medical judgment to assess the trade-offs between the benefits of a treatment and its side effects. The NNT and NNH calculations allow you to assess there trade-offs.

79. Practice exercises6. Read the abstract from Sildenafil (Viagra) for
male erectile dysfunction: a meta-analysis of clinical trial reports. Moore RA, Edwards JE, McQuay HJ. BMC Urol 2002: 2(1); 6. The Number Needed to Treat for 60% of attempts at sexual intercourse being successful, and the Number Needed to Harm for treatment-related adverse events have been removed. Calculate these values using the information provided in the abstract. Interpret these values and their associated confidence intervals.

BACKGROUND: Evaluation of company clinical trial reports could provide information for meta-analysis at the commercial introduction of a new technology. METHODS: Clinical trial reports of sildenafil for erectile dysfunction from September 1997 were used for meta-analysis of randomised trials (at least four weeks duration) and using fixed or dose optimisation regimens. The main outcome sought was an erection, sufficiently rigid for penetration, followed by successful intercourse, and conducted at home. RESULTS: Ten randomised controlled trials fulfilled the inclusion criteria (2123 men given sildenafil and 1131 placebo). NNT or NNH were calculated for important efficacy, adverse event and discontinuation outcomes. Dose optimisation led to at least 60% of attempts at sexual intercourse being successful in 49% of men, compared with 11% with placebo; the NNT was [DELETED] (95% confidence interval 2.3 to 3.3). For global improvement in erections the NNT was 1.7 (1.6 to 1.9). Treatment-related adverse events occurred in 30% of men on dose optimised sildenafil compared with 11% on placebo; the NNH was [DELETED] (4.3 to 7.3). All cause discontinuations were less frequent with sildenafil (10%) than with placebo (20%). Sildenafil dose optimisation gave efficacy equivalent to the highest fixed doses, and adverse events equivalent to the lowest fixed doses. CONCLUSION: This review of clinical trial reports available at the time of licensing agreed with later reviews that had many more trials and patients. Making reports submitted for marketing approval available publicly would provide better information when it was most needed, and would improve evidence-based introduction of new technologies.

81. Review of major points
1. The relative risk has a more natural interpretation than the odds ratio.
2. You should not use the relative risk for certain research designs where the prevalence is artificially constrained.
3. The ratio of the number needed to treat to the number needed to harm gives you a way to assess the cost/benefit tradeoff.

82. Repeat of Pop quiz #1
A relative risk should not be computed for the following design because the prevalence of the disease is artificially constrained.
1. Case-control design2. Cohort design3. Cross-sectional design4. Historical control design5. Don’t know/Not sure
83. Repeat of Pop quiz #2
The odds ratio and the relative risk are close to one another when
1. The prevalence of the disease is low2. The prevalence of the disease is high3. The sample size is small4. The sample size is large5. Don’t know/Not sure

84. Repeat of Pop quiz #3
If a drug cures 50% of all patients and 40% are cured on a placebo, then the number needed to treat (NNT) is:
1. NTT=22. NNT=2.53. NNT=104. NNT=505. Don’t know/Not sure


![16: Odds Ratios [from case- control studies] Case-control studies get around several limitations of cohort studies.](https://static.fdocuments.in/doc/165x107/56649db05503460f94a9e4fb/16-odds-ratios-from-case-control-studies-case-control-studies-get-around.jpg)