What Determines the Success or Failure of Fund …...What Determines the Success or Failure of...
55
WP/ What Determines the Success or Failure of Fund-Supported Programs? Anna Ivanova, Wolfgang Mayer, Alex Mourmouras, and George Anayiotos
Transcript of What Determines the Success or Failure of Fund …...What Determines the Success or Failure of...

WP/
What Determines the Success or Failure of Fund-Supported Programs?
Anna Ivanova, Wolfgang Mayer,
Alex Mourmouras, and George Anayiotos

© 2001 International Monetary Fund WP/ IMF Working Paper Policy Development and Review Department
What Determines the Success or Failure of Fund-Supported Programs?
Prepared by Anna Ivanova, Wolfgang Mayer, Alex Mourmouras, and George Anayiotos
Authorized for distribution by Timothy D. Lane
November 2001
Abstract
This paper is a theoretical and empirical exploration into the factors influencing the outcomes of Fund-supported programs. First, new measures are constructed related to: (1) the incidence of major program interruptions; (2) overall compliance with conditionality; and (3) the Fund’s effort in designing and monitoring programs. Second, a political economy model is presented of IFI-borrower interactions in which resistance by vested interests is a key factor inhibiting reforms. Third, an econometric model is tested that relates program implementation to initial conditions, political economy influences, and Fund effort and conditionality. We find that the prospects of Fund-supported reform programs depend primarily on domestic political economy conditions. Ethnic and linguistic divisions, strong special interests, and lack of political cohesion contribute to program failures. Fund effort or the structure of conditionality do not materially influence program prospects.
The views expressed in this Working Paper are those of the author(s) and do not necessarily represent those of the IMF or IMF policy. Working Papers describe research in progress by the author(s) and are published to elicit comments and to further debate.
JEL Classification Numbers: Keywords: conditionality; vested interests; IMF-supported programs; common agency. Authors’ E-Mail Addresses: [email protected]; [email protected];

- 3 -
Table of Contents Page
I. Introduction ............................................................................................................................4
II. Special Interest Politics and Program Success......................................................................7 A. Overview...................................................................................................................7 B. The role of special interests.......................................................................................7 C. A political economy model .....................................................................................10
Unconditional Assistance.................................................................................12 Conditional Assistance.....................................................................................13 Grants vs. Loans...............................................................................................16
III. Empirics .............................................................................................................................18 A. The Data..................................................................................................................18 B. Descriptive Statistics ...............................................................................................21 C. Econometric Methodology......................................................................................21 D. Instruments..............................................................................................................23 E. Results .....................................................................................................................25
IV. Concluding remarks...........................................................................................................29
V. References...........................................................................................................................32

- 4 -
I. INTRODUCTION
Gaining a better understanding of the factors influencing the outcomes of reform programs supported by International Financial Institutions (IFIs) is both a key challenge for the international community and the task of a voluminous literature.1 Previous research has concluded that interruptions of Fund-supported programs depend primarily on domestic factors that cannot be influenced by program design (Mecagni, 1999); and that program implementation does not depend on the number of conditions (IMF, 2001a and 2001b). This message—that domestic factors are the key determinant of success—is corroborated by other studies that examine the rationale and consequences of foreign assistance. Alesina and Dollar (1998) found that foreign aid allocations are based much more on donors’ political and strategic considerations than on recipient need or policy performance. Burnside and Dollar (2000) examined the relationships among aid, economic policies, and growth in per capita GDP. They found that aid has a positive impact on growth in countries that have good fiscal, monetary, and trade policies but has little effect in the presence of poor policies. According to their results, the quality of policies has only a small impact on the allocation of aid.
Likewise, Dollar and Svensson (2000) concluded in a study of a large number of Bank-supported adjustment programs that program success can be predicted by a small number of domestic political economy variables, including ethnic and linguistic divisions, government instability and undemocratic governments. While Bank effort in designing and monitoring programs seemed to improve the chances of program success when its endogeneity was not taken into account, it ended up not materially influencing program prospects when properly instrumented for. Despite the significant differences between Fund- and Bank-supported programs and bilateral aid, it is relevant to examine whether similar results also hold for Fund-supported programs.
Exploring the validity of the Dollar and Svensson (2000) results in a broad set of Fund-supported programs is a principal objective of this paper.2 If true, this would have important implications about the way the Fund interacts with member countries, not only under Poverty Reduction and Growth Facility (PRGF) programs, but also under Extended Fund Facility (EFF) and Stand-By Arrangements (SBAs). It would imply, for instance, that the Fund should spend more resources to better understand domestic political economy conditions in countries wishing to use its resources.3 Fund efforts to identify countries with good policies could be combined with greater selectivity to focus Fund resources on countries that are
1 See Ul Haque and Khan (1998); Conway (1994; 1998).
2 Mecagni (1999) examined SAF/ESAF arrangements approved between 1986 and end-1994. This paper examines EFF, ESAF/PRGF and SBA approved in 1992-98.
3 This is a key conclusion of IMF (2001c).

- 5 -
promising reform prospects. The efficiency in the allocation of the Fund’s assistance, country ownership, and program implementation would improve, and the signaling function of Fund financial assistance would be enhanced. Such a virtuous cycle would also prove beneficial for the desired—but often illusive—catalytic effects of Fund-supported programs. Finally, a shift toward greater selectivity might also strengthen borrowers’ incentives to reform by encouraging reform races among countries competing for scarce resources.4
Several issues had to be addressed before we could apply Dollar and Svensson’s methodology to Fund-supported programs. First, there is no unambiguous definition of program success. Viewed narrowly, program performance depends, inter alia, on the extent to which conditionality has been met, on whether the program was fatally interrupted, and on the extent to which committed funds were disbursed. More broadly, programs are successful if their principal macroeconomic and structural objectives were met. Both approaches yield useful information. In their empirical work, Dollar and Svensson employed a broad definition of program success, based on the subjective judgments of the Bank’s Operations Evaluation Department (OED). Our own choice of program success was determined in part by information constraints. To begin with, we lacked an OED-type indicator for Fund-supported programs.5 And while PDR’s database (Monitoring of Fund Arrangements, or MONA) contains detailed data on conditionality, it was not designed to assemble information on the human and financial resources the Fund invests in individual programs. Our strategy was to construct multiple objective measures of program success (narrowly defined) for a sample of about 170 programs approved between 1992 and 1998. These indicators are described in more detail in what follows. Our measure of effort was compiled from the Fund’s Budget Reporting System (BRS) and information on resident representative costs provided by the office of Budget and Planning (OBP). Our indicators of success are then related, either in isolation or in a pooled sample, to various right-hand side variables. These “explanatory” variables include observable characteristics of borrowing countries, such as initial conditions, features of their domestic political economy, and variables under Fund control—including resources allocated to programs and the structure of conditionality. Some exceptions notwithstanding (e.g., the ethnic fractionalization and political instability indicators), when we tested the Dollar-Svensson conjecture using their own variables, it turned out that the estimated regression equations did not work very well. We do not, however, feel that their approach and main message are invalidated. An alternative econometric specification—one based on somewhat different political economy variables—performs reasonably well. Key to the success of this specification—and a main contribution of the paper—is the inclusion in the right-hand side of our regressions of an indicator
4 On so-called aid tournaments, see Svensson (1998).
5 The Fund’s independent Evaluation Office (EVO) was only set up earlier this year.

- 6 -
capturing the power of vested interests in member countries. Like Dollar and Svensson, we find that variables under the Fund’s control, including Fund effort and conditionality, are not related to program success when their endogeneity is accounted for. On the other hand, the relationship between program outcomes and political-economy variables, including our empirical measure of lobby strength, is robust. A caveat is in order, however. Our Fund effort variable is measured imperfectly and is aggregative in nature. In particular, we cannot distinguish between Fund effort allocated to program design, approval and supervision. It is conceivable that better estimates of Fund effort would alter our conclusions. However, as best as we can tell, these results are robust to changes in the econometric specification. A second and related objective of the paper is to provide a theoretical analysis of the role played by vested interests in resisting reforms. This role is well recognized both in the academic literature and in the institution. Also recognized are the limits that vested interests pose in borrowing countries’ efforts to achieve truly national ownership of their Fund-supported programs.6 Special interests opposing welfare-improving change arise endogenously in the reform process (Olson, 1982; 1993). Hence, an adequate understanding of domestic heterogeneity is crucial for the appropriate design and sequencing of reform programs (Drazen, 2000, especially Chapter 10). This need is particularly urgent when programs involve second-generation reforms, which inevitably have negative impacts on some sectors and generate resistance from vested interests. The key insight in modeling the role of vested interests comes from the common agency literature (Dixit, Helpman and Grossman, 1997). The authorities of member countries approaching the Fund for assistance have multiple objectives and are subject to competing influences. Incumbent politicians are concerned about their public’s welfare and their own reelection prospects, which are being influenced, in turn, by domestic lobbies, civil society and other advocacy organizations, and by the Fund, other IFIs and bilateral donors. Common agency theory allows us to analyze government decision-making in the presence of multiple influences. Our political economy model focuses on the financial relations between IFIs, their sovereign borrowers, and the domestic special interests resisting reforms. The government’s policy choices in this model are endogenous, depending on the degree of its commitment to public welfare, the strength of domestic lobbies, and the structure and level of foreign assistance, including its concessionality and conditionality. The rest of the paper is organized as follows. Section II reviews the role of domestic interest groups in sabotaging reforms and presents the political economy model. Section III presents the data, econometric methodology and results. Section IV concludes.
6 Some evidence on the role of vested interests in blocking reforms is summarized in Section II and in IMF (2001c). See also Odling-Smee (2001), Havrylyshyn and Odling-Smee (2000), and Krueger (1974). The role of country ownership is discussed by Khan and Sharma (2001), IMF (2001c), and Dixit (2000).

- 7 -
II. SPECIAL INTEREST POLITICS AND PROGRAM SUCCESS
A. Overview
In this section we first discuss informally the role of special interests in blocking beneficial reforms. A general lesson that emerges from case studies of major program interruptions is that opposition to reforms from entrenched interests or a lack of protection or compensation for vulnerable groups hurt by reforms can seriously weaken national ownership and program implementation. We also develop a new political economy model of IFI-borrowing country interactions in which organized special interests oppose welfare-improving reforms. Two main results emerge. First, while conditional IFI assistance improves world welfare, the recipient government would prefer it if assistance were provided unconditionally. Second, policy performance would improve if conditional assistance took the form of grants rather than loans.
B. The role of special interests
Trade and structural policies are critically influenced by lobbyists representing owners of specific factors who vie for trade protection (Grossman and Helpman, 1994) or for protection against new technologies. These policies depress welfare and growth and have unintended dynamic consequences even when they are well-justified (Krusell and Rios-Rull, 1996; and Bridgman, Livshits and MacGee, 2001).7 In Africa, the transition economies and elsewhere in the developing world, managers of state-owned enterprises have at times turned their enterprises into “rent-generating machines”, diverting resources from producers or consumers for the exclusive benefit of a small group of people, most of them with political responsibilities. The special interests controlling wealth—including oil and other natural resources—have sometimes turned against reform programs even if they are pro-market in general, because they fear that reforms threaten their privileged positions and associated capacity to earn rents.8 In an environment in which the incumbent politicians are self-interested, conditional aid can help improve the allocation of investment and increase welfare (Adam and O’Connell, 1997), even if unconditional aid delivered via the government is wasted in increased transfers to its favored groups. By tying their hands with IMF conditionality, governments can increase their leverage with domestic opponents of economic reform and push through policies which would not otherwise be approved (Vreeland, 2000).
7 For instance, infant industry protection designed to allow domestic industries a chance to become competitive has as an unintended consequence the emergence of lobbies aiming to maintain the status quo.
8 Dalmazzo and de Blasio (2001) focus on the political influence which rents from oil wealth exert on self-interested governments.

- 8 -
The experience with reforms in Russia and other CIS countries in the 1990s provides a good example of the power of special interests in blocking reforms. The transition pitted reformist economic teams and the public against elements in the leadership being influenced by “red directors” and other members of the nomenklatura which blocked reforms and even threatening to capture the state.9 While the key economic policy makers (the ministers of finance and revenues, as well as the central bank governor) were often young, technocratic and western-oriented, the special interests, with support from senior politicians, controlled key sectors of the economy and easily evaded taxes, obtained trade protection, tax and other privileges (e.g. cash and in-kind government transfers, including fuel), and siphoned off government money. The Fund generally pushed for the macroeconomic and structural changes acceptable to the team of reformers, disbursing its loans when there was a reasonable amount of progress but withheld financial support when performance fell below an acceptable threshold. The Fund and top policy makers understood this battle and tried to balance the need to stay in power (and deal with the vested interests) with the need for improved policies. In the end, implementation of institutional and structural reforms has been one of the most difficult tasks in the CIS countries. As stated by Odling-Smee (2001):
Some countries in the region are stuck half-way along the transition process. They have achieved macroeconomic stability, they may have liberalized most prices, and they may have privatized some state assets. But they have not yet seen much growth in the private sector. Where this has happened, I believe that a major reason is the rise of a new nomenklatura. Partial and halting reforms have allowed new (and sometimes old!) elites to gain control over productive assets, and they have then successfully used the state as a means to preserve their position by ensuring that they continue to receive privileges. This situation, which occurred to varying degrees in the countries of the region, had the most serious costs when it perpetuated an antiquated industrial structure and prevented the establishment and development of new businesses.
The influence of domestic political economy conditions on the outcomes of selected Fund-supported reform programs can be illustrated with case studies of several recent programs (see Annex to IMF, 2001c). These studies illustrate how powerful interest groups (including in many cases those within the government), pressures from election cycles (inducing the authorities to adopt myopic policies), and the presence of vulnerable groups who are or expect to be adversely affected by reforms can impair successful implementation of economic policies. Some cases also illustrate how such resistance can, in some instances, be overcome through dialogue, negotiation and decisive political leadership.
9 See, for example, Åslund (1999) and Hellman and Kaufman (2001).

- 9 -
Two of these cases illustrate the difficulties of achieving and maintaining a broad and deep enough level of domestic support. In Zimbabwe, policy advice and financial assistance from the Fund and other IFIs was helpful for a brief period in the early 1990s when the government was interested in reforming its economic policies. However, a subsequent surge in opposition to reform undermined program implementation and the effectiveness of international assistance. In the Kyrgyz Republic, the government had repeated difficulties in gaining the political support necessary for undertaking needed reforms. The parliament played a key role in sabotaging the 1993 program. Members of parliament at the time had been appointed before the breakup of the Soviet Union and their majority were managers of state enterprises or local officials. Two other two cases, in contrast, illustrate how domestic political divisions can be overcome and what the Fund can do to help bring change about. In Uganda, as the government gradually adopted more stable and market-oriented policies in the late 1980s, the Fund was able to support the process by expanding its financial assistance and providing strong signals to other creditors and donors. The impetus for reform came primarily from within, and the Fund’s role was to respond positively. In Bulgaria, hyperinflation and a major crisis were instrumental in creating the broad political consensus necessary to back structural reforms and overcome special interests. The authorities’ increased willingness to embrace structural economic reforms combined with Fund support to turn the economy around. While the influence of organized lobbies representing economic interests is easy to explain, non-economic factors may also induce governments to be less than fully representative of the welfare of their populations. Key to this is the ethnic divisions in many countries in which the IFIs are active. The borders of some African or Asian countries were drawn by arbitrary decisions of colonial powers, causing a disconnect between the state and the nation, defined as “the historical, ethnic, and socio-cultural community” (Dixit, 2001, p. 3). Rather, government is often dominated by one ethnic or religious group, which captures the state and uses its coercive powers to redistribute national resources to its favored group. Adam and O’Connell (1997) emphasize this type of self-interested government and analyze the impact of conditional and unconditional grant assistance. Unconditional aid channeled through an unrepresentative government (one caring only about a sufficiently small “favored” fraction of the population under its control) can be entirely wasted: it will be captured in its entirety by the predatory state. Conditionality can help things, although there are problems arising from limited commitment. Our model is related to Adam and O’Connell’s, although our main interest is in the financial relations between IFIs and borrowing governments, which take the form of loans of different degrees of subsidization. Our approach follows closely the political economy of trade literature pioneered by Grossman-Helpman (1994). They used the menu-auction approach developed by Bernheim-Whinston (1986) to analyze trade protection. We apply the same model to analyze conditional and unconditional loans granted by an IFI to a government that faces organized opposition to reforms. Domestic conditions and IFI assistance and

- 10 -
conditionality influence the sovereign government’s policy choices in what is known as a common agency setting.10 We find that while unconditional assistance can help improve policy choices, conditional assistance can further improve welfare. However, the two equilibria cannot be ranked: even though the IFI is better off with conditional assistance, the recipient government would prefer assistance to be provided unconditionally. A second question concerns the size of IFI financial support and its associated conditionality, taking as given the pricing of IFI resources as dictated by conditions in capital markets and creditor countries. Grants result in better policies and higher welfare when compared to loans. However grants are more expensive, leaving the IFI with less capital with which to influence future reforms. The optimal allocation of scarce IFI resources to support reforms over time cannot be addressed in our static model but is clearly an important question for future research. A third issue is the appropriate intensity of IFI conditionality. We show how the Fund’s “leverage” varies with the authorities’ circumstances. In line with the Fund’s Conditionality Guidelines, incentive-compatible conditionality will be tailored to individual country circumstances and domestic political economy, such as the power of vested interests, the responsiveness of the government to its public, the rate of interest the borrowing government faces in the private capital market, and the degree of concessionality of Fund resources.11 A fourth issue concerns the implications of IFI members’ economic and political influence on IFI conditionality. Conditionality is custom-made, not cookie cutter. The weight of individual borrowers in the IFI’s objective and the impact of borrowers’ policies on the world economy are both reflected in the IFI’s level of assistance and associated conditionality.
C. A political economy model
We consider an economy in which economic policies are shaped by the interaction of three players: an incumbent government (G), a domestic interest group (V), and an international financial institution (IFI). The incumbent government decides what policies to adopt. Its choices, however, are affected by the interest group’s financial contributions and by IFI assistance. The IFI can provide economic assistance—grants or loans of varying degrees of subsidization—conditional on the domestic government’s pursuit of ‘desirable’ economic
10 The pioneering study of lobbies as instruments of political influence is Becker (1983).
11 If a country asks the Fund for financial assistance, the Fund advises the authorities in the design of a specific adjustment program, while paying “due regard to the domestic social and political objectives, the economic priorities, and the circumstances of members, including the causes of their balance of payments difficulties.” Guidelines on conditionality, attached to Executive Board Decision No. 6056-(79/38), March 2, 1979. The quotation is from guideline number 4.
- 11 -
policies or without imposing such conditionality. The economy’s net welfare, after IFI assistance has been received and repaid, is given by:
*
1( , ) ( , )
1Y T W T T
r
βω ω
+= −
+, (1)
where 0ω ≥ is an index of policy-generated distortions selected by the government, T is the flow of IFI assistance, * 0r > is a discount rate which equals the market interest rate for private loans to the government, and * 1r β> ≥ − is the rate of interest charged by the IFI. The term ( , )W ⋅ ⋅ is the country’s welfare before any repayment of the assistance. The second
term states how much has to be repaid to the IFI. We let *(1 ) /(1 )b rβ≡ + + denote the rate of assistance repayment, so that 1-b is the subsidy rate on IFI loans. Given T, net welfare is maximized when the economy is distortion-free, 0ω = . Welfare declines at an increasing rate as the distortion index rises, implying that 0Wω < and
0Wωω < . The flow of economic assistance, in turn, benefits the recipient country at a
decreasing rate, such that 0TW > and 0TTW < . The effectiveness of assistance diminishes
with the degree of distortions, 0TWω < . The incumbent government’s political support depends on the general welfare of its people and financial support from the interest group. The interest group benefits from policies that create distortions and is willing to pay for heightening these distortions. The lobby’s contribution schedule, ( )C ω , to the government is contingent on the government’s choice of distortions. The government’s objective function is ( )( , ) ( ) ( , )G T C a W T bTω ω ω= + − , (2)
where 0a ≥ reflects the government’s concern for the general public. The government will not accept assistance unless TW b> . The interest group’s objective function is:
( ) ( ) ( )V U Cω ω ω= − , (3)
where the lobby’s welfare before contributions, ( )U ω , increases at a decreasing rate with the
degree of distortions; that is 0Uω > , 0Uωω < . We assume (0) (0,0) 0U aWω ω+ > , which guarantees that the some distortions are present in the absence of IFI assistance. The IFI is a costless public interest institution that cares about the net welfare of both the assistance-receiving country and the assistance-financing rest of the world, following the assured repayment of the concessional loan. The rest of the world provides the IFI with financial resources, in the form of grants or loans. The IFI makes these resources available at cost and is always repaid. The IFI chooses the amount of assistance, T, but treats the rate of assistance repayment b as exogenous, being determined by conditions in the capital market,

- 12 -
reflected in the value of *r , and the preferences of its creditors, as reflected in the value of β . Letting 0γ ≥ denote the weight of the borrowing country, the IFI’s objective function is given by * *( , ) ( , ) ( , ) ( , ) (1 )I Y T Y T W T W T bTγ ω ω γ ω ω γ= + = + + − . (4) We assume that * 0Wω ≤ and * 0Wωω ≤ : welfare in the rest of the world may depend on the degree of distortion in the assistance-receiving country. A more distorted economy may have systemic implications for its trading partners. When assistance is provided, the gain to the recipient country, 0TW > , must be weighed against the loss of the creditor country, * 0TW < . Unconditional Assistance
The government’s equilibrium choice of policy distortions depends on the way in which the IFI provides its economic assistance. When assistance is unconditional, IFI aid is not contingent on the government’s pursuit of distortion-reducing policies. The IFI chooses a level of assistance oT that maximizes (4) while accounting for the government’s response to the assistance. The government takes the level of IFI assistance simply as given. Given the interest group’s contribution schedule and the value of T, the government chooses a value of
( )o Tω that depends on T. When the IFI, in turn, chooses the optimal amount of
unconditional assistance, oT , it maximizes (4) with respect to T, while accounting for the relationship ( )o Tω . In other words, the IFI acts as a Stackelberg leader when choosing the level of unconditional economic assistance. Given T, the combination (Co,ωo) represents a subgame-perfect Nash equilibrium of the economic policy game if and only if (1) Co is feasible; (2) ωo maximizes Co(ω) + a[W(ω,T) – bT]; (3) ωo maximizes U(ω) – Co(ω) + Co(ω) + a[W(ω,T) – bT]; (4) there exists Iω − that maximizes Co(ω) + a[W(ω,T) – bT] such that Co( Iω − ) = 0.12 These conditions imply that )()( ooo CU ωω ωω = , which serves as the basis for the interest group’s contribution schedule. Grossman and Helpman show that such a contribution schedule is truthful as it“ reflects the true preferences of the interest group”. It also follows that ),()( TaWU oo ωω ωω −= , which states that distortions are raised to a level at which the marginal benefit to the interest group equals the marginal loss in public support for the government. Given this equilibrium condition, and provided that 0TWω < , an increase in T lowers distortions.
12 For more details, see our forthcoming working paper (Mayer and Mourmouras, 2001).

- 13 -
.0)()(
),(<
+−
=oo
oT
o
aWU
TaW
dTd
ωωωω
ωωωω
ω (5)
In other words, even though assistance is provided unconditionally, the government reacts to an increase in the level of IFI assistance by lowering distortions. This is reflected in the slope of the RR locus in Figure 1. Note also that the impact of unconditional assistance on policies depends only on the level of assistance, not on whether it takes the form of grants or loans. The IFI selects the amount of assistance it provides to maximize (4) with respect to T, while taking account of the government’s policy reaction function (5) (Figure 1). A government that does not receive any economic assistance chooses economic policies that result in a distortion index of ω-I. The corresponding level of welfare for the government is given by G0. If the IFI provides economic assistance, it is in the interest of the government to reduce economic distortions along the RR locus. There are two important influences on the government’s response to economic assistance. First, there is the government’s concern for the welfare of the general public, as expressed by the value of a; the less its concern for the general public, the less it reduces distortions as more assistance is received. Second, there is the impact of distortions on the effectiveness of economic assistance, as expressed by the value of WωT <0. The more detrimental distortions are to the effectiveness of economic assistance, the more they will be reduced as more assistance is received. The IFI’s optimal choice of unconditional economic assistance is To, resulting in distortions of ωo. Given the incumbent government’s policy reaction curve, RR, the IFI chooses that level of assistance that puts it on the highest attainable IFI welfare contour, namely Io at point B. At this point:
*
* (1 )T T T
W W U aW
W W b aWω ω ωω ωω
ω
γγ γ
+ +=
+ + −, (6)
Conditional Assistance
The essence of conditionality is that the IFI makes the magnitude of its assistance contingent on the economic policies and associated distortions implemented by the recipient government. The IFI, thereby, joins the domestic interest group as another principal in a common agency situation. The aims of the two principals are starkly conflicting, however. The interest group gains from more distortions, the IFI gains from fewer distortions. The choice of distortions is made by the incumbent government. The provision of conditional assistance can be described as a two-stage game. In the first stage, the IFI decides on its economic assistance schedule and the interest group chooses its contribution schedule. In the second stage, the government selects the degree of policy distortions. The choices 1 1 1( , , )C T ω represent a subgame-perfect Nash equilibrium if and
only if: (1) 1C and 1T are feasible; (2) 1ω maximizes G [ω, 1T (ω)]; (3) 1ω maximizes

- 14 -
V(ω)+G[ω, 1T (ω)]; (4) 1ω maximizes 1 * 1 1[ , ( )] [ , ( )] [ , ( )]Y T Y T G Tγ ω ω ω ω ω ω+ + ; (5) there
exist ω-V and ω-I that maximize G [ω, 1T (ω)] such that 1C (ω-V) = 0 and 1C (ω-I) = 0, respectively. In addition to the restrictions on the lobby’s contribution schedule discussed earlier, conditions (3) and (4) stipulate that equilibrium policies must maximize, respectively, the joint welfare of the government and the lobby and the government and the IFI. If this were not true, the lobby or the IFI could offer the government alternative contribution and assistance schedules that would be mutually beneficial. The lobby and the IFI must also worry about what policy would be chosen if the lobby’s contribution or the IFI’s assistance were lowered sufficiently that the government would opt to set policies while neglecting the lobby’s or the IFI’s interests entirely (GH, page 845). Hence, the last requirement, condition (5), requires that there exist policy distortions that elicit zero contribution from the lobby and the IFI that the government finds equally attractive as the equilibrium 1ω . As shown in Bernheim and Whinston (1986), we may restrict our attention to contribution schedules that are truthful everywhere. Our working paper shows that the truthful Nash equilibrium ( 1ω , 1T , 1C ) is characterized by the following equations (Figure 1):
1 1 1( ) ( )U Cω ωω ω= . (7)
( )*
* (1 )T T T
U aW W W
a W b W W bω ω ω ωγ
γ γ+ +
=− + + −
. (8)
1 1 1 1 1[ , ( , )] ( ,0) [ ( ) ( )]/I IIW T B W U U aω ω ω ω ω− −= + − , (9)
where 1VB and 1
IB are the interest group’s and the IFI’s equilibrium levels of net welfare. Equations (7)-(8) are consequences, respectively, of maximizing the joint welfare of the government and the interest group and the government and the IFI. In a truthful equilibrium, the interest group and the IFI set their respective contribution schedules so that marginal changes in contributions equal the marginal change in the group’s welfare for a small change in policy. The welfare contour of the government, accounting for truthful contribution offers from the domestic interest group, is Go. Along this contour, the government is kept as well off as in the absence of IFI assistance. In terms of Figure 1, the IFI’s truthful assistance schedule is the downward-sloping part of its indifference curve 1I . Given this assistance schedule, the government selects economic policies that maximize the joint welfare of the IFI and the government, accounting for truthful contributions by the domestic lobby. This is attained in point C in Figure 1. This maximum must occur in the range of ω where both the government’s and the IFI’s welfare contours are negatively sloped. This implies that
0U aWω ω+ > and * (1 ) 0T TW W bγ γ+ + − < when evaluated at 1ω .
- 15 -
Equation (9) helps us determine the equilibrium level of assistance, 1T ( 1ω ), analytically. It is derived by noting, first, that 1T ( 1ω ) must make the government indifferent between choosing the policy it adopts under the conditional transfer 1ω and the policy it would adopt in the absence of IFI assistance, Iω − . In addition, the domestic interest group must offer a truthful equilibrium contribution 1C ( 1ω ) that makes the government indifferent between the equilibrium policy 1ω and the policy it would adopt in the absence of any domestic lobbying group, 0Iω − = . The effectiveness of conditional and unconditional IFI assistance can be easily compared in our model. Even though conditional assistance improves the welfare of the IFI, the recipient government is better off when assistance is provided unconditionally. In other words, although the equilibrium with conditional assistance is Pareto optimal and the equilibrium under unconditional assistance is not, the two are noncomparable. Note that as drawn in Figure 1, the government pursues less distorting policies and the IFI spends less on assistance when it is provided conditionally. But this is not necessarily always the case. It is possible for the amount of assistance or the degree of policy distortions (but not both) to be greater with conditional than unconditional assistance. In terms of comparative static results, it can be shown that (1) the less the government is concerned about the general public relative to the interest group, the smaller is the value of a and the higher is the degree of distortion; (2) the more sensitive a country’s economic performance is to distortionary policies, the larger is the absolute value of ( )Wω ⋅ , and the smaller is the equilibrium level of distortion; (3) the more effective the transfer is in raising national welfare, the higher is ( )TW ⋅ , and the lower is the value of ω . Hence, the more effective transfers are, the easier it is to get rid of distortionary policies; (4) the more a country’s policies affect welfare in the rest of the world, the larger is the absolute value of
*Wω and the lower is the equilibrium value of ω ; (5) the higher is the weight of the recipient
country in the IFI’s objective function the higher is γ and the lower is the equilibrium value of ω . Hence, the more closely aligned the IFI’s preferences are to those of the borrowing countries the lower will the equilibrium level of policy distortions be. It is also possible to ascertain the intensity of conditionality in the neighborhood of 1ω , as expressed by the slopes of the G and I contours at the equilibrium point C. Based on equation (8), conditionality is “stiffer” the smaller is the increase in IFI assistance for a given reduction in policy distortions. Conditionality is less intense the larger is the domestic lobby’s marginal benefit from policy distortions; the less representative the country’s government is; the more harm distortions cause to the recipient’s or the creditor’s national welfare; the larger is the recipient country’s weight in the IFI’s objective function; the higher is the rate of repayment; the higher is the disutility from transfers in the creditor countries; or the lower is the impact of assistance on recipient country welfare. The result that conditionality would be intensified following a reduction in the rate of assistance repayment seems consistent with Michael Bruno’s position, expressed during his years as chief

- 16 -
economist of the World Bank, that conditionality is most effective in crises, since market interest rates faced by borrowing countries amidst a crisis rise significantly while IFI rates of charge do not (or rise by less). The result that a lower disutility of transfers to the rest of the world is associated with less stringent conditionality also seems consistent with the practice of attaching few if any strings to humanitarian and other emergency assistance.
Figure 1. Equilibrium With Conditional and Unconditional IFI Assistance
T
R
G1
B To
T1 C G0
R I1 I0 A
O ω1 ωo ω-I ω Grants vs. Loans
The IFI can offer conditional assistance either in the form of loans or in the form of grants. In our model, the form of assistance is reflected in the value of b. In case of an unsubsidized loan, b=1; in case of a grant, b=0; and for less than fully subsidized loans, 0<b<1. The question we are addressing here is what form of aid is most effective from the point of view of the IFI. It can be shown that the change in the IFI’s objective, equation (4), in response to changes in b is given by
*
T T
T
dI W WT
db W b
+=
−. (10)
Moreover, it can be shown that * 0T TW W+ < implies that (a) the right-hand side of (10) is
negative; and (b) 1 / 0d dbω > . In other words, conditional grants lead borrowers to adopt less-distorting policies. Moreover, such grants result in greater welfare for the IFI than loans. A sufficient condition for the marginal disutility of assistance to creditor countries to exceed the marginal utility to recipient countries is that the IFI cares about borrowing countries at
- 17 -
least as much as it does for creditors. In that case, given that * (1 ) 0T TW W bγ γ+ + − < in
equilibrium, 1γ ≥ implies * 0T TW W+ < . Moreover, if an equilibrium with conditional
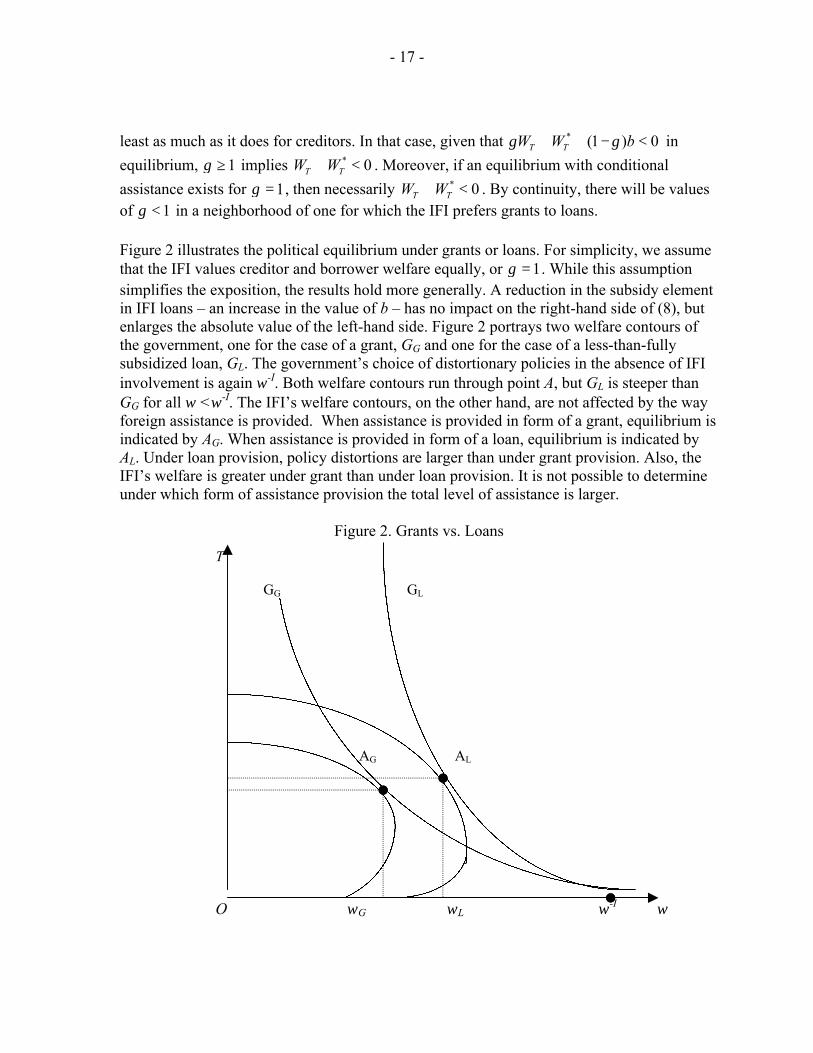
assistance exists for 1γ = , then necessarily * 0T TW W+ < . By continuity, there will be values of 1γ < in a neighborhood of one for which the IFI prefers grants to loans. Figure 2 illustrates the political equilibrium under grants or loans. For simplicity, we assume that the IFI values creditor and borrower welfare equally, or 1γ = . While this assumption simplifies the exposition, the results hold more generally. A reduction in the subsidy element in IFI loans – an increase in the value of b – has no impact on the right-hand side of (8), but enlarges the absolute value of the left-hand side. Figure 2 portrays two welfare contours of the government, one for the case of a grant, GG and one for the case of a less-than-fully subsidized loan, GL. The government’s choice of distortionary policies in the absence of IFI involvement is again ω-I. Both welfare contours run through point A, but GL is steeper than GG for all ω <ω-I. The IFI’s welfare contours, on the other hand, are not affected by the way foreign assistance is provided. When assistance is provided in form of a grant, equilibrium is indicated by AG. When assistance is provided in form of a loan, equilibrium is indicated by AL. Under loan provision, policy distortions are larger than under grant provision. Also, the IFI’s welfare is greater under grant than under loan provision. It is not possible to determine under which form of assistance provision the total level of assistance is larger.
Figure 2. Grants vs. Loans
T
GG GL
AG AL
O ωG ωL ω-I
ω

- 18 -
III. EMPIRICS
A. The Data
We analyzed the implementation of 170 SBA, EFF, and ESAF/PRGF programs approved between 1992 and 1998. About 48 percent of the programs in our sample were SBAs, followed by PRGF/ESAF programs (38 percent) and EFFs (15 percent) (Table 1). Construction of one comprehensive indicator of success, which reflects assessment of whether broad program objectives were reached would require thorough analysis of each program by an expert body and is beyond the scope of this paper. An alternative strategy is to attempt to capture the essential features of program implementation from different angles, using information available in MONA, IFS data and program documents. To this end, we constructed the following four indicators of program implementation: (1) a binary variable measuring program interruptions. This variable captures both major and minor program interruptions and is motivated by Mecagni’s (1999) work; (2) a binary variable capturing irreversible program interruptions. This measure captures programs that went off track and were not revived subsequently (i.e., were either cancelled or were allowed to lapse because of the policy slippages); (3) an overall implementation index, which represents the average fraction of macro and structural conditionality implemented; and (4) the ratio of disbursed to committed amount traditionally used in the literature. Variables (3) and (4) are continuous and take values between zero and 100. While none of the indices is a perfect measure of program success, each captures important dimensions of program implementation. The macro and structural implementation indices give us quantitative information on implementation rate by type of condition but may overstate the degree of program implementation because MONA fails to capture information on programs that are interrupted and not subject to further Board reviews. The interruption dummies, which are based on MONA data and additional information from program documents, complement the macro and structural implementation indices by capturing significant program stoppages. The share of disbursed funds provides useful information on the proportion of approved assistance actually delivered for non-precautionary arrangements and actual duration of the program compared to the scheduled one. The implementation indices and interruption dummies provide useful information about performance of precautionary programs, cancelled programs and some unusual cases where no drawings were made despite good results. The four measures of program success are significantly correlated with each other (Table 2).13
13 The only exception was the reversible-interruption indicator which is not significantly correlated with the structural implementation index. Since the reversible interruption dummy captures “small” policy slippages that were subsequently corrected, we decided not to include this measure in our econometric analysis.

- 19 -
We identify three major groups of factors that might affect probability of success of Fund supported programs. These are political economy variables, variables describing the Fund’s behavior, and initial and external conditions. On the political economy side, we collected data from several sources, namely, the Political Institutions Database at the World Bank (Beck et al; 2001), the International Country Risk Guide (ICRG), the Polity IV dataset, the CIA World Factbook.14 While we tried to use the same data as Dollar and Svensson, this was not always possible. First, their measure of political instability (the average number of government crises) comes from a proprietary database (Banks, 1994). As an alternative, we constructed a measure of political instability using data on internal conflict from ICRG. This 12 point measure captures the degree of political violence in the country and its actual and potential impact on governance. We recoded this variable so that higher values reflect higher degree of political conflict and set its value to 12 if there was a change in the chief executive during the course of the program. The data on change in chief executive come from the Political Institutions database and the CIA World Factbook. Second, our data on democratically elected incumbents come from a different source (the Political Institutions Database), although one of the primary sources of this database is the Europe Yearbook where Dollar and Svensson obtained their data. The main hypothesis that emerges from the theoretical model of Section II is that the implementation of reforms is affected by special interests. While the model treats these interests as being distinct from the government sector, reality is more complex. The government is not a monolith, consisting of political parties that might represent groups whose interests may or may not be in conflict with reforms. Parliament is another crucial player in policy making since legislative approval is often required for successful implementation of key reforms. Data on special interests represented in parliaments around the world are available from the Political Institutions database. To test the hypothesis that the presence of influential lobbies lowers the probability of program success, we constructed a variable measuring the strength of special interests in parliament. This variable indicates the maximum share of seats in the parliament held by parties that represent nationalistic, religious, rural and regional interest groups. Regarding the remaining right-hand side variables, we include political instability, ethnic fractionalization and political cohesion. Political instability is distinct from parliamentary divisions and jeopardizes program implementation. Ethnic fractionalization leads to conflict in society, which is also a threat to reform efforts. Political cohesion (from the Political Institutions database) emphasizes the heterogeneous nature of the government and the legislature. In presidential systems of government, a high degree of political cohesion is said to exist if the same party is in control of the executive and legislature. In parliamentary systems, political cohesion is associated with one-party majority governments. Lower political cohesion introduces more uncertainty regarding the implementation of reforms. If
14 The Appendix provides a detailed description of the data.

- 20 -
the government and legislature are not in concord, it is more likely that either could be in conflict with reform objectives. An important factor not considered by Dollar-Svensson is the quality of bureaucracy. This variable, which is available from the ICRG, is an important shock absorber that tends to minimize policy deviations when governments change. A high quality bureaucracy has the strength and expertise to govern without drastic changes in policies or interruptions in government services. It also tends to have established mechanisms for recruitment and training and to be insulated to a degree from political pressures. In countries with poor bureaucracies, changes in government tend to be traumatic in terms of policy formulation and day-to-day administrative functions, which can impact negatively program implementation. Since the importance of bureaucracy is more sharply felt during the time when government changes, we included only a term that interacts the strength of the bureaucracy with the dummy variable indicating a change in chief executive. When we included the quality of bureaucracy itself in the regression, the coefficient on that term was insignificant. On the Fund side, we include two major groups of variables, one measuring Fund effort and the other capturing the impact of conditionality. To measure Fund effort we constructed three variables: (1) Fund effort, measured by the dollar cost of programs. This is based on BRS data on staff hours spent on Use of Fund Resources (UFR) and Technical Assistance (TA), average staff salaries by grade, and information on resident representative costs provided by OBP; (2) the number of Fund staff missions; and (3) the number of missions days. For all Fund effort variables we had to make a decision on how to attribute the data on hours/missions available by countries and months to specific programs. We used approval dates and actual end dates of programs. Recognizing that we might be losing a significant part of Fund effort invested in program preparation, we also constructed alternative measures of this variable taking into account Fund effort in the country three and six months before program approval. Econometric results for alternative measures were essentially the same and are not reported here. Dollar and Svensson found that initial conditions do not matter for successful implementation of World Bank-supported programs. We also believe that if programs are properly designed then initial conditions should not play a significant role in program success as they will be reflected in adjustments to conditionality and Fund effort. The set of variables included as initial conditions in our regressions are: central government balance as percent of GDP; current account balance as percent of GDP; the level of gross reserves at the start of the program; initial inflation; initial level of GDP per capita; and initial debt to the Fund in relation to quota. To control for external conditions, we use the same terms of trade shock variable employed by Dollar and Svensson, namely the difference between the growth rate of dollar export prices times the share of exports in GDP and the growth rate of dollar import prices times the share of imports in GDP.

- 21 -
B. Descriptive Statistics
Table 1 shows program implementation by type of arrangement. The various measures of program implementation are mutually correlated (Table 2). Although implementation indices do not change much over time, there are two clear peaks in irreversible interruptions for programs approved in 1994 and 1996, and two troughs in the share of disbursed funds in 1993 and 1997. These are attributable to the financial crises of the mid- and late-1990s. About 44 percent of all programs experienced an irreversible interruption and 70 percent of all programs experienced either a major or a minor interruption. Nonetheless, approximately 71 percent of committed funds were disbursed on average (excluding precautionary arrangements, cancelled and on-going programs). For programs for which information is available in MONA, the average implementation index is a relatively high 76 percent. The macro implementation index is significantly higher (80 percent) than the structural implementation index (67 percent). However, implementation indices most likely overstate program performance. MONA collects data only for program test dates subject to Board approval or review. Information on some programs experiencing major interruptions is therefore not available. Table 3 shows the features of “successful” and “failed” programs as measured by the binary variable indicating absence of irreversible interruptions. Although failed and successful programs appear to be similar in many respects, several differences stand out. First, countries that successfully implemented Fund programs were experiencing much higher inflation (83 percent per annum) at the start of the program than countries that did not succeed (53 percent per annum). On the other hand, successful programs started with substantially smaller budget deficits (2.5 percent of GDP) as compared to unsuccessful ones (4.8 percent of GDP). Terms of trade shocks were stronger and initial reserves lower in countries with unsuccessful programs. By contrast, Dollar and Svensson had found no significant differences between successful and unsuccessful programs as far as initial conditions and terms of trade shocks are concerned. The Fund seems to invest more effort into successful rather than failed programs. This is in contrast, once again, with the Dollar-Svensson finding that the World Bank invested more effort in the programs that are eventually unsuccessful. While indicative, differences in initial conditions and terms of trade shock across successful and failed Fund programs should be carefully interpreted. If programs are designed optimally, they should set realistic targets in relation to initial conditions and timely adjust their conditionality in response to evolving domestic circumstances and external shocks. Whether a program succeeds or not lies entirely on the shoulders of country authorities. As discussed below, we do indeed find that when we control for political economy variables and Fund effort and conditionality, initial conditions do not matter for program implementation.
C. Econometric Methodology
Our choice of econometric technique was guided by the need to make efficient use of the information contained in our imperfect implementation indicators and data availability. One
- 22 -
complication is presented by the fact that one of our indicators is a binary variable while the other two are continuous variables, which makes it difficult to combine all three in a single econometric model. Limited availability of political economy data is an additional consideration. Even though implementation measures are available for 170 programs, political economy variables are only available for about 60 programs. Our approach is to apply first a simple version of the Multiple Indicators and Multiple Causes (MIMIC) model (see Goldberger et al). This model combines three implementation measures in a pooled sample and then estimates the chosen specification using proper techniques. Amemiya’s Instrumental Variables (IV) probit method is used to estimate regressions where the left-hand side variable is a binary indicator. Amemiya’s IV tobit is used in regressions of the share of disbursed funds and the overall implementation index. Our model can be described as follows. If *
iy is the unobservable probability of successful program implementation, then
* ' 'i y y i y i yiy P Fα γ β ε= + + + (11)
where iP is a vector of country i political economy variables, iF is a vector of variables
under the Fund’s control, yα , yγ , and yβ are vectors of coefficients, and yiε is a stochastic
disturbance term. The variables controlled by the Fund are given by
' 'i F F i F i FiF P Zα γ λ ε= + + + , (12)
where Fα , Fγ and Fλ are vectors of coefficients, Fiε is another error term, and iZ is a vector of exogenous variables that are correlated with donor behavior but do not systematically influence the probability of success. Since the Fund responds to shocks hitting programs by adjusting its effort and conditionality, yiε and Fiε are correlated. We use IV
techniques to obtain consistent estimates of the coefficients in equation (11). Since we do not observe *
iy we cannot estimate equation (11) directly. However we have
three indicators of success, which are correlated with *iy . We can relate our observed
measures of implementation to the unobserved probability of success as follows:
*1 1 1i i iy y Uδ= + (13)
*2 2 2i i iy y Uδ= + (14)
*3 3 3i i iy y Uδ= + , (15)
where 1iy , 2iy and 3iy are our three implementation measures, and 1iU , 2iU and 3iU are measurement errors which are possibly correlated. We then substitute equation (12) into (11) and (11) into (13)-(15) to obtain a system of equations which can be treated as a system of seemingly unrelated regressions. This system can then be estimated to obtain reduced form

- 23 -
coefficients which then can be used to recover the parameters yγ and yβ . To calculate the
variance of yγ and yβ we employ the delta-method. This approach requires normalization of
one of the coefficients δ being equal to one. A computationally convenient version of this model arises if the coefficients δ are all unity. The resulting specification is essentially a random effects model with random effect yiε . If Fund effort were not simultaneously
determined with the success probability then the random effect yiε would be uncorrelated
with the set of regressors in iF and be iP . We could then obtain consistent estimates of this model by pooling the three implementation measures in one variable and regressing it on the same set of political economy and Fund effort variables for a particular program. However, since Fund effort is simultaneously determined with the probability of success, we apply the random effects IV estimator to obtain consistent estimates of the coefficients on political economy and Fund effort variables. This approach has two limitations. First, the linear in probability model may not be appropriate for the irreversible interruptions indicator. Second, the assumption of constant variance needed to apply the random effects model is hard to justify in the linear in probability model. These caveats notwithstanding, pooling our indicators in a random effects model has significant informational advantages. We then reestimate the model for each of the implementation measures separately, using the appropriate probit and tobit technique for each of our three success measures. The results of both estimations lead to similar conclusions regarding the effect of political economy and Fund-related variables, which to some extend justifies our approach. We do recognize, however, that it would be useful to extend our data set in the future when more political economy data becomes available and check the robustness of our results.15
D. Instruments
In light of the endogeneity of Fund variables, reaching a definitive conclusion about their impact on the probability of success of Fund supported programs requires a list of appropriate IVs. The instruments must be correlated with variables under the Fund’s control and be uncorrelated with the shocks hitting programs. It is difficult to find instruments for all endogenous variables simultaneously. Out of all Fund variables, the share of structural conditions in the total number of conditions seems the least subject to later revisions in the course of the program, so we treat this variable as exogenous. For the remaining Fund variables we use the following IVs (Table 5, first stage regressions).
• The average share of bilateral aid by the G-7 to the country before the start of the
program. Since G-7 members comprise 45 percent of the Fund’s voting power, we thought that this variable captures the “weight” that the Fund puts on a particular
15 The Political Institutions database is currently being updated.

- 24 -
country with a Fund-supported program in place. We computed this variable by calculating the share of its total bilateral aid that each of G-7 member allocated to a particular country. Then we averaged this share across G-7 members. This variable is akin to γ in our theoretical model: the higher is γ the less are policy distortions as the Fund gives bigger loans to these countries and/or relaxes conditionality. In line with the prediction of the theory, this variables is positively correlated with the loans size as percent of quota at the 5 percent significance level and positively correlated with the share of quantitative PCs waived at the 10 percent significance level.
• Approval year. Since the number of conditions per program year has been increasing
over time, it is positively correlated with approval year and we can use approval year as an IV for the number of conditions per program year
• Expected program duration. Certainly the loan size as percent of quota is positively
correlated with expected program duration. The share of quantitative PCs waived is negatively correlated with expected program duration. This probably reflects the fact that, the longer is the program the more time the Fund has to adjust conditionality in due course to respond to changes in internal and external circumstances rather than issue waivers in order to salvage the program.
• Fund quota (log). Fund quota is significantly positively correlated with the share of
quantitative PCs waived (at the 5 percent significance level), and with the intensity of Fund effort per program year (at the 10 percent significance level). Fund quota captures two important aspects. First, it determines the size of the loan and, therefore, the amount “at stake” for the Fund. And second, it determines the voting power of the country at the Fund. Both aspects contribute to the fact that higher Fund quota implies higher Fund effort invested in the program and higher share of quantitative PCs waved.
• Dummy for ESAF/PRGF. The total number of conditions per program year is
smaller for ESAF/PRGFs compared to SBAs/EFFs. In contrast, the share of waivers is higher for ESAF programs. This relationship is studied in more detail in the forthcoming Modalities paper
• GDP per capita (log). This is the only initial condition from Dollar and Svensson’s
list that we included in our own IV set. It was not significantly correlated with program success when we included it in the original regression. The level of country’s GDP should not affect probability of program success directly as it is taken into account when the program is designed. Richer countries require less Fund effort (this variable is negatively correlated with Fund effort per program year) and get higher loans as percent of quota.
• Regional dummies. Fund effort per program year is higher in Latin America and
Caribbean and East Asia (significant at 10 percent level) as compared to Europe and

- 25 -
the Middle East. Compared to the other regions, loan size as percent of quota is higher in Latin America and Caribbean, Sub-Saharan Africa and East Asia.
• Population (log). This variable is negatively correlated with the share of quantitative
PCs waived. F-statistics on the IV set for all endogenous variables were significant. It should be mentioned that our IVs are correlated with variables under the Fund’s control and are not correlated with the regression error in the main regressions. They cannot be interpreted as helping to determine Fund variables since we did not include other significant variables that determine Fund behavior in these regressions.
E. Results
Dollar and Svensson emphasize that the relationship between Bank effort and the probability of program success is endogenous. Once this endogeneity is taken into account, Bank effort does not significantly influence the probability of program success. We find that this holds true for Fund programs as well. We proceed as follows. We first present the results of random effects estimation ignoring the endogeneity of variables under the Fund’s control (Table 4). Column (1) replicates the regression of our success variables on the political economy variables used by Dollar and Svensson. Our data do not show the same strong relationship between these political economy variables and the probability of success of Fund-supported programs. In fact, the coefficients in our regression are insignificant, both individually and jointly. The reasons for these differences are not altogether clear. Take the finding by Dollar-Svensson that implementation of Bank-supported programs benefits from the presence of democratically elected governments, which does not show up in our regressions. While Dollar-Svensson do not provide a theoretical explanation, one possible rationale is that democratic governments represent the interests of the general public, which should make it easier to support welfare-improving reforms. But there democratically elected governments may block reforms if their main objectives are focused on nationalistic or religious self-determination (regardless of the degree of ethnic diversity), or in case their own electoral or private interests are in conflict with the objectives of reform programs. As discussed in Section II, the experience of the transition economies is a good illustration of this possibility. In these economies, democratically elected governments consist of officials with socialist backgrounds who retain their old way of thinking as well as their privileges, with which they do not have any incentive to depart. We now turn to other important determinants of success not captured in the Dollar-Svensson regression, especially the role which vested interests play in program failures. Column 2 of Table 4 presents the results of random effects regressions, both for a linear in probability and tobit specifications. In the tobit model, the coefficient on the “strength of lobbies” is negative and significant at the 5 percent level. The coefficients on the index of political cohesion on the interaction of the quality of bureaucracy and the change in chief executive is positive and

- 26 -
significant in tobit specification. Interestingly, once we included additional political economy variables, which we believe might affect the probability of program success, the coefficients on ethnic fractionalization and ethnic fractionalization squared became significant and took the same signs as in Dollar and Svensson regressions. As expected, the coefficients on all initial conditions came out individually and jointly insignificant. Initial conditions in the IV regressions came out insignificant. Column 3 in Table 4 provides the results of estimation excluding initial conditions. The coefficients on political economy variables do not change appreciably. In column 4 of Table 4 we included a set of variables under the Fund’s control, ignoring their endogeneity for now. These variables are: Fund effort (measured by dollar cost of staff hours spent on UFR and TA in the country during program implementation per program year, log), total number of conditions per program year, share of quantitative performance criteria waived, the share of structural conditions in the total number of conditions, and the loan size in relation to Fund quota (log). These variables came out insignificant in the regression. Table 6 presents the result of estimating a linear in probability IV model with random effects on a pooled sample using the set of IVs specified in Table 5. We include Fund-related endogenous variables in the regressions, one at a time. In all specifications, the coefficients on Fund variables are insignificant while the political economy variables are significant and have the expected signs (except for time in power). Since the dummy for democratically elected governments was insignificant in all regressions we excluded it from subsequent regressions. We also performed likelihood ratio tests for the tobit specification. This showed that this exclusion does not worsen substantially model performance. The overidentifying restrictions test shows that including additional IVs in the regression is valid. Coefficients on all exogenous variables and on IVs in the regression of the residual from IV regression were not significantly different from zero. The Hausman test shows that IV random effects regressions are not different from the simple random effects model. This implies that we would not be much mistaken by ignoring endogeneity of Fund variables and performing simple random effects model since Fund variables are insignificant anyway. In all specifications, the coefficients on Fund variables were insignificant while the political economy variables were significant with the expected signs.16 Fund effort per program year and the loan size in relation to Fund quota are correlated.17 In the last column of Table 6 we present the results of estimation including loan size in relation to quota, the number of
16 The exception is time in power, although time in power squared was significant at 10 percent level.
17 Since most IVs that were significantly correlated with the Fund effort were also significantly correlated with one of the other endogenous variables, we did not include Fund effort and loan size together in one IV regression.

- 27 -
conditions per program year and the share of quantitative PCs waved but excluding Fund effort.18 Dollar and Svensson treated loan size as exogenous. Moreover, they used loan size as an IV for Fund effort. We tend to view loan size as endogenous: the Fund adjusts the amount of its loans to respond to changing circumstances. Therefore, we included both the Fund effort and the loan size in relation to quota in the regression (Column (4), Table 4). The coefficients on Fund variables were not significantly different from zero in these regressions. We also performed IV estimation including all other Fund variables except for the loan size as percent of quota (column 3, Table 6). Again in this case all Fund variables came out insignificant. Noting that the Hausman test showed that IV regressions were not much different from a simple random effects model and the coefficients on all Fund variables were insignificant in simple random effects model, we conclude that none of the included Fund variables significantly affects the probability of program success once we control for relevant political economy variables.
We then re-estimate our model on each of the three implementation indices separately. In Table 7a we present the results of linear in probability and probit/tobit models with the set of political economy variables used by Dollar and Svensson in the right-hand side. Since time in power was insignificant in most of the regressions on a pooled sample, we excluded this variable from subsequent regressions.19 As in the random effects model, the coefficients on all political economy variables were insignificant for the non-interruption dummy and the share of disbursed funds. For the average implementation index though, ethnic fractionalization and ethnic fractionalization squared appeared to be significant.
Table 7b presents estimates of regressions of each of the three implementation measures separately on our own choice of political economy variables. As in the random effects case, the following coefficients were significant and take the expected signs for both the non-interruption dummy and the share of disbursed funds: ethnic fractionalization; political instability; strength of special interests; index of political cohesion; and quality of bureaucracy interacted with the change in chief executive. However, in the regression of the average overall implementation index only two coefficients are significant: ethnic fractionalization (at 5 percent level); and strength of lobbies (at 10 percent level). The results using the average overall implementation index are the least reliable. The reason for that is that even though all three measures are not perfect indicators of program success, the measurement error in the other two implementation indices can be safely assumed to be uncorrelated with the regressors in our model. When this is the case, measurement error in
18 While it would be desirable to find the set of IVs which would allow us to include all endogenous variables at once, the conclusions regarding the significance of Fund variables and political economy variables would not change.
19 Our small sample size was a limiting factor in the number of regressors we could include.

- 28 -
the left-hand side variable simply adds to the error term in the regression and we obtain consistent coefficient estimates. Estimation using average overall implementation index should be taken with more caution as measurement error for unsuccessful programs might be higher than for successful ones and might also be correlated with political economy variables which lead to program failure.20
We then add Fund variables in the regression (Table 7c), ignoring their endogeneity. The signs and significance of the coefficients on political economy variables do not change. Fund effort is significant at the 10 percent level for the non-interruption dummy and insignificant for the other two measures. In the regression of the average overall implementation index, the coefficients on the number of conditions per program year and the share of quantitative PCs waived turned out negative and significant. However, the latter result reflects the fact that, by construction, the implementation index is assigned a value of zero if the condition was waived. This implies that the share of quantitative PCs waived should clearly be treated as an endogenous variable. Interestingly, after we included variables under the Fund’s control, the predictive power of probit model went down from 82 percent to 76 percent.21
Because of the small number of observations, we added one endogenous variable in our regression at a time. In this case, we could also narrow down the set of IVs used for each of the endogenous variables. We present the results of shorter versions of the first stage regressions in Table 8. Interestingly, in these regressions the strength of the special interest groups and the degree of political cohesion is correlated with Fund decisions. Stronger lobbies are associated with more conditions per program year and a lower share of quantitative PCs waived. In countries where the degree of political cohesion is relatively high, the Fund seems to impose fewer conditions and to issue relatively more waivers. F-statistics on all of the IV sets are significant.
Finally, Table 9 presents the result of IV estimation using Amemiya’s (1978) probit/tobit GLS-type estimators for three implementation measures separately. The results broadly confirm the picture we obtained in the random effects model. Political economy variables are important determinants of program success while variables capturing Fund behavior do not appear to significantly influence the program prospects. Note that the predictive power of the probit regression again declined compared to the case when we did not include Fund variables (probit regression in Table 7b).
20 This is due to the way information on compliance with conditionality is collected in MONA for failing programs for which further board reviews are not established.
21 We use the following prediction rule: the model predicts a value of 1 for the non-interruption dummy if the predicted probability from probit model is greater than or equal to ½ , and zero otherwise. The predictive power of the model is the share of correctly predicted outcomes in the probit regression.

- 29 -
In conclusion, our main findings may be summarized as follows.
• The strength of special interests in parliament can jeopardize program prospects. The magnitude of this effect varies considerably. In response to a one percentage decrease in the share of seats held by special interests in parliament, the probability of major program interruption declines by one percentage point and the overall implementation index declines by 13 percent. However, we are reluctant to place too much emphasis on the estimated marginal effects as a small sample size and measurement error in our implementation indices makes our estimates relatively imprecise. However, the fact the strength of special interests variable is significant in almost all specifications allows us to conclude that the more powerful special interest groups are in the parliament the less likely the Fund program will succeed.
• A high degree of political cohesion increases the probability of successful program implementation. This underscores that the interaction between the government and parliament is an important consideration when evaluating program perspectives.
• Too much or too little ethnic diversity is bad for reforms. The turning point varies between 43 percent to 51 percent (Table 7b). This is close to the estimates obtained by Dollar and Svensson for Bank programs (44-49 percent).
• Political instability negatively affects the probability of program success. This is similar to what Dollar and Svensson found for Bank programs.
• Effective government bureaucracies tend to cushion the effect of political instability during times of government change. The coefficient on the variable that interacts the quality of the bureaucracy and the change in the chief executive is positive in many specifications.
• The government’s length of tenure does not seem to be a direct cause of program failure.
While we recognize that we have a small sample and imperfect indicators of program implementation, our findings appear to reinforce the major conclusions obtained by Dollar and Svensson. Political economy variables are the major determinants of success in reform programs supported by IFI resources. We provided convincing evidence of the importance of two major political economy factors not present in their study, namely the strength of special interests in parliament and the degree of political cohesion in the country.
IV. CONCLUDING REMARKS
Our main findings are relatively easy to summarize. First, our preliminary empirical results appear to confirm, broadly speaking, the principal message of Dollar and Svensson. The prospects of Fund-supported programs depend on a few observable domestic political

- 30 -
economy indicators. In addition to ethnic fragmentation and political instability, which were relevant in the Bank staff’s work, we found that the strength of special interests is an important element in explaining the prospects of Fund-supported programs. Although our relatively small sample size makes it difficult to reach a definitive conclusion, this finding appears to be robust to the specification of our regressions, to the choice of left-hand side variable, and is also in line with the predictions of our theoretical model. Second, although our theoretical model confirms the global welfare-improving role of conditional IFI assistance, they also point to the incentives borrowing governments have in lobbying for unconditional aid. The welfare implications of different degrees of concessional IFI financing are also interesting. We found that if borrowing countries are sufficiently well-represented in the IFIs, conditional grants dominate conditional loans in welfare terms and could be used to improve policy performance in borrowing countries. But this raises difficult issues about the revolving nature of the Fund’s and other IFIs’ resources. More research is needed to flesh out this important question. Regarding extensions, our empirical methodology could be used to address some additional econometric issues concerning Fund-supported programs. One is the role of prior actions in program implementation. Using related techniques, ongoing work in PDR is exploring the ways in which historically the Fund has adjusted this particular tool of conditionality and the results obtained (Thomas, 2001). His findings are generally supportive of the notion that the Fund has tended to use more prior actions in subsequent programs with a member when previous program implementation was not satisfactory. This is intended to serve as a filter by signaling the authorities’ commitment to comply with conditionality before the Fund approves further disbursement of its resources. Consistent with Dollar and Svensson and this paper, Thomas finds that when political economy variables are controlled for, program implementation (as measured by our index of program interruptions) has not systematically improved as a result. A second issue that we have not explored is the possible presence of defensive lending by the Fund and its implications for program implementation. Being an initial condition, a member’s debt to the Fund at the outset of a program ought to not matter at the margin, as the Fund will presumably take this debt into account in designing the program. But it would be interesting to examine more closely the empirical link between countries’ debt to the Fund and program prospects. Are countries with larger initial debt to the Fund more likely to receive larger loans and is the share of these loans disbursed systematically influenced by the presence of high initial indebtedness to the Fund? Regarding theory, while the model described in the paper is useful in organizing our thinking about the interactions between IFIs and borrowing governments, it has some important limitations, which should be addressed in future research. First, we assumed that policy choices and outcomes were perfectly costlessly observed by all players. However, the design and implementation of IFI conditionality is complicated by asymmetries of information between the IFI and the government. Secondly, the model is static, not allowing consideration of signaling, reputation, credibility, default, and commitment effects of IFI

- 31 -
assistance. As already mentioned, especially critical is the question of the intertemporal allocation of assistance and its appropriate form (whether grants or loans).

- 32 -
V. REFERENCES
Adam, Christopher S., and Stephen A. O'Connell, 1997, “Aid, Taxation and Development: Analytical Perspectives on Aid Effectiveness in Sub-Saharan Africa,” Mimeo, University of Oxford and Swarthmore College (October).
Alesina, Alberto, and David Dollar, 1998, “Who Gives Foreign Aid to Whom and Why,” NBER Working Paper 66122 (June).
Åslund, Enders, 1999, “Why Has Russia’s Economic Transformation Been So Arduous?”
Carnegie Endowment for International Peace. Paper prepared for the Annual World Bank Conference on Development Economics, Washington, D.C., April 28-30, 1999.
Banks, A.S., 1994 “Cross-National Time Series Data Archive,” Center for Social Analysis.
State University of New York, Binghamton. Becker, Gary S., 1983, “A Theory of Competition Among Pressure Groups for Political
Influence,” Quarterly Journal of Economics 98 (3), (August). Bernheim, B. Douglas and Michael D. Whinston, 1986, “Menu Auctions, Resource
Allocation, and Economic Influence,” Quarterly Journal of Economics 101 (1), 1-32 (February).
Botchwey, Kwesi, Paul Collier, Jan Willem Gunning, and Koichi Hamada, 1998. External
Evaluation of the ESAF: Report by a Group of Independent Experts. Washington: International Monetary Fund.
Boughton, James M., 2001. Silent Revolution: The International Monetary Fund 1979-1989. Washington: International Monetary Fund.
Bridgman, Benjamin R., Igor D. Livshits and James C. MacGee, 2001, “For Sale: Barriers to Riches,” Mimeo, University of Minnesota and Federal Reserve Bank of Minnesota (January).
Burnside, Craig, and David Dollar, 2000, “Aid, Policies, and Growth,” American Economic Review, 847-868 (September).
Conway, Patrick, 1998, “Evaluating Fund Programs: Methodology and Empirical Estimates,”
Working Paper, University of North Carolina (May).
Conway, Patrick, 1994, “IMF Lending Programs: Participation and Impact,” Journal of Development Economics 45, 365-391.
- 33 -
Dalmazzo, Alberto, and Guido de Blasio, 2001, “Resources and Incentives to Reform: A Model and Some Evidence on Sub-Saharan African Countries,” IMF Working Paper WP/01/86 (June).
Dixit, Avinash, 2001, “Some Lessons from Transaction-Cost Politics for Less-Developed
Countries,” Mancur Olson lecture delivered at the University of Maryland (October). Available on the Internet at http://www.bsos.umd.edu/umccc/dixit.pdf.
Dixit, Avinash, 2000, “IMF Programs as Incentive Mechanisms,” mimeo, IMF (June). Dixit, Avinash, Gene M. Grossman, and Elhanan Helpman, 1997, “Common Agency and
Coordination: General Theory and Application to Government Policy Making,” Journal of Political Economy 105 (4), 752-769 (August).
Dollar D. and Svensson J. (2000) “What Explains the Success or Failure of Bank-Supported
Adjustment Programs”, The Economic Journal 110 (October), 894-917 Drazen, Allan, 2000, Political Economy in Macroeconomics, Princeton, N.J, Princeton
University Press. Easterly W. (1998) “The quest for Growth. How we understand the tropics trying to figure
out how to make poor countries rich”, (growth web-site) Easterly W. and Levine R. (1997) “Africa’s growth tragedy: policies and ethnic division”,
Quarterly Journal of Economics, vol. 112, pp.1203-50 Grossman, Gene M., and Elhanan Helpman, 1994, Protection for Sale, American Economic
Review 84 (September), pp. 833-50. Havrylyshyn, Oleh, and John Odling-Smee, 2000, Political Economy of Stalled Reforms,
Finance and Development 37 (3). Hellman, Joel, and Daniel Kaufmann, 2001, “Confronting the Challenge of State Capture in
Transition Economies,” Finance and Development 38 (3), (September). International Monetary Fund, 2001a, “Conditionality in IMF-Supported Programs—Policy
Issues.” Available via the Internet at http://www.imf.org. International Monetary Fund, 2001b, “Structural Conditionality in IMF-Supported
Programs.” Available via the Internet at http://www.imf.org. International Monetary Fund, 2001c, “Strengthening Country Ownership of Fund-Supported
Programs,” Forthcoming.

- 34 -
Khan, Mohsin S., and Sunil Sharma, 2001, IMF Conditionality and Country Ownership of Programs, IMF Working Paper No. 01/142 (October).
Krueger, Anne, 1974, “The Political Economy of a Rent-Seeking Society,” American
Economic Review, Vol.64 (3), pp.291-303. Krusell, Per, and Jose-Victor Rios-Rull, 1996, Vested Interests in a Positive Theory of
Stagnation and Growth, Review of Economic Studies 63, 301-29. Mecagni M. (1999) “The Causes of Program Interruptions, in Hugh Bredenkamp and Susan
Schadler, Editors, Economic Adjustment and Reform in Low-Income Countries”, International Monetary Fund, 215-276.
Odling-Smee, John, 2001, “Belarus: Recent Experience and Challenges Ahead,” Speech given at the Belarusian Academy of Management, Minsk (November 6).
Available on the Internet at http://www.imf.org.
Olson, Mancur, 1993, “Dictatorship, Democracy and development,” American Political Science Review, Vol.87 (3), pp.567-76. Olson, Mancur, 1982, The Rise and Decline of Nations, New Haven, CT: Yale University
Press. Svensson, J., 1998, “Reforming donor institutions: aid tournaments,” Mimeo, World Bank. Thomas, Allun, 2001, “The Use of Prior Actions in Fund-Supported Programs,” IMF Working Paper (forthcoming). Ul Haque, Nadeem, and Mohsin S. Khan, “Do IMF-Supported Programs Work? A Survey of
the Cross-Country Empirical Evidence,” IMF Working Paper 98/169 (December).
Vreeland, James R., 2000, “The IMF: Lender of Last Resort or Scapegoat?” Mimeo, Department of Political Science, Yale University (April).

Table 1. Program* Implementation by Type of Arrangement
Type of Arrangement
Number of Programs*
Number of Programs* excluding precautionary arrangements as well as cancelled and on-going
programs 8/
Share of programs
having Interruptions
1/ 6/
Share of programs having
Irreversible Interruptions 2/ 6/
Average Macro Implementation Index 3/ 6/ 7/
Average Structural
Implementation Index 4/ 6/7/
Average Overall Implementation
Index 5/ 6/7/
Average share of committed funds
disbursed 8/(In percent)
EFF 25 13 68 40 87.0 75.4 83.3 72.1
PRGF/ESAF 64 51 73.4 45.3 77.1 71.3 72.9 77.2
SBA 81 41 67.9 43.2 81.0 60.8 76.0 63.7
Total 170 105 70.0 43.5 80.3 67.4 75.8 71.3
8/ The average share of disbursed funds was computed across the sample of programs excluding precautionary arrangements (on approval and turned into precautionary) as well as cancelled and on-going programs.
* Multiyear arrangements are treated as one program. This is a sample of programs approved between 1992 and 1998 and available from MONA database (our sample is missing 16 SBAs, one ESAF and one EFF program approved in 1992). The sample of EFF programs is quite small to make reliable conclusions regarding relative performance of EFF compared to ESAF and SBA programs.
1/ An interruption occurs if an SBA program review was delayed by more than 3 months or not completed at all; if a program review for ESF/PRGF programs was delayed by more than 6 months or not completed at all; if there was an interval of more than 6 months between two subsequent years of a multiyear arrangement; or if at least one of the annual arrangements was not approved (exceptions are programs which were cancelled and replaced by another program, in which case noncompleted reviews and nonapproved annual arrangements are not counted as interruptions).
2/ An irreversible interruption occurs if either: (i) the last scheduled program review was not completed (all programs); or (ii) all scheduled reviews were completed but the subsequent annual arrangement was not approved (ESAF/PRGF arrangements).
7/ Sample size for implementation indices was smaller (150 programs), which corresponds to the sample constructed for "Structural Conditionality in Fund-Supported Programs", we simply extended structural index used in this paper to macro and overall implementation indices
3/ The Macro Implementation Index for a given macro performance criterion is equal to 100 percent if macro performance criterion was met or met after modification and it is equal to zero if macro
Implementation Indices across all macro performance criteria for this program.
4/ The Structural Implementation Index for a given structural condition is equal to 100 percent if structural condition was met or met with small delay for structural benchmarks; it is equal to 50 percent if structural condition was partially met or delayed for performance criteria and it is equal to zero if structural condition was not met. The Structural Implementation Index for a program then is computed as the average of Structural Implementation Indices across all structural conditions for this program.
5/ The Average Overall Implementation Index for a given program is the average of Macro and Structural Implementation indices over all conditions in this program.
6/ The Macro and Structural implementation indices were computed from information available in MONA. Since MONA questionnaires are sent only for programs for which Board meetings are scheduled, implementation information is missing on many conditions for programs with noncompleted reviews. Since these were typically unsuccessful programs, the macro and structural indices may overstate program implementation. Interruption indices were constructed using additional information from country documents and other sources.
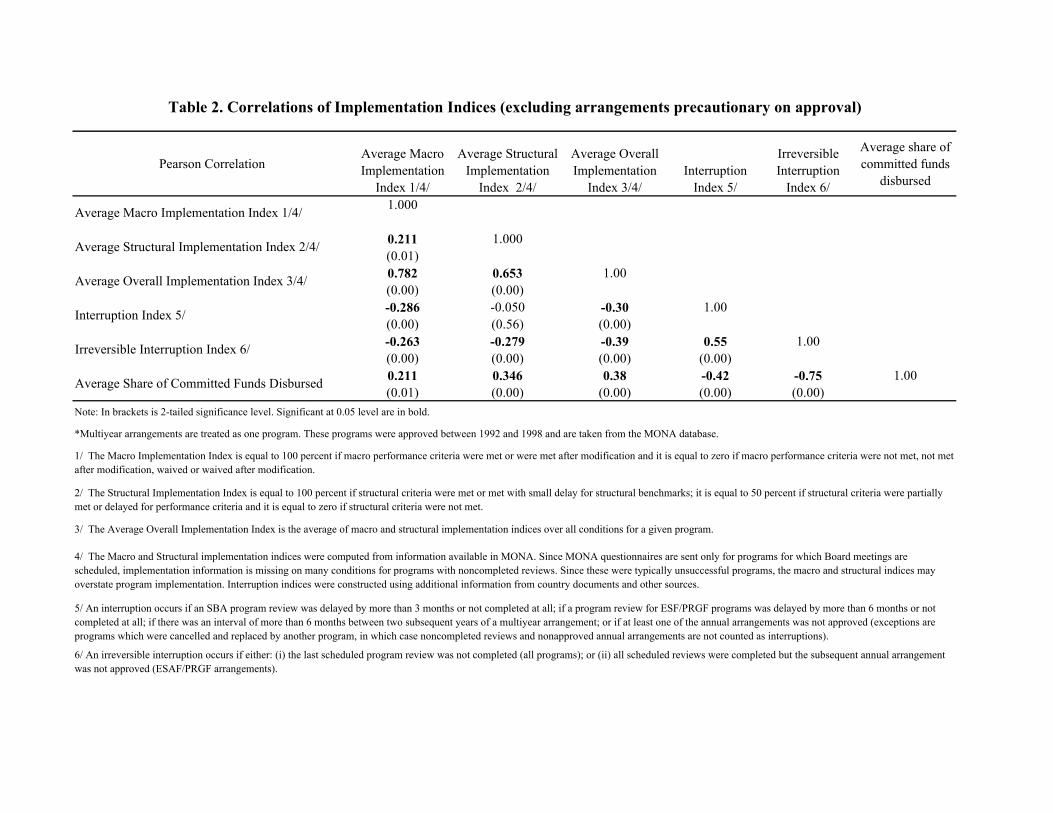
Pearson CorrelationAverage Macro Implementation
Index 1/4/
Average Structural Implementation
Index 2/4/
Average Overall Implementation
Index 3/4/Interruption
Index 5/
Irreversible Interruption
Index 6/
Average share of committed funds
disbursed
1.000
0.211 1.000(0.01)0.782 0.653 1.00(0.00) (0.00)-0.286 -0.050 -0.30 1.00(0.00) (0.56) (0.00)-0.263 -0.279 -0.39 0.55 1.00(0.00) (0.00) (0.00) (0.00)0.211 0.346 0.38 -0.42 -0.75 1.00(0.01) (0.00) (0.00) (0.00) (0.00)
Interruption Index 5/
4/ The Macro and Structural implementation indices were computed from information available in MONA. Since MONA questionnaires are sent only for programs for which Board meetings are scheduled, implementation information is missing on many conditions for programs with noncompleted reviews. Since these were typically unsuccessful programs, the macro and structural indices may overstate program implementation. Interruption indices were constructed using additional information from country documents and other sources.
1/ The Macro Implementation Index is equal to 100 percent if macro performance criteria were met or were met after modification and it is equal to zero if macro performance criteria were not met, not met after modification, waived or waived after modification.
2/ The Structural Implementation Index is equal to 100 percent if structural criteria were met or met with small delay for structural benchmarks; it is equal to 50 percent if structural criteria were partially met or delayed for performance criteria and it is equal to zero if structural criteria were not met.
3/ The Average Overall Implementation Index is the average of macro and structural implementation indices over all conditions for a given program.
5/ An interruption occurs if an SBA program review was delayed by more than 3 months or not completed at all; if a program review for ESF/PRGF programs was delayed by more than 6 months or not completed at all; if there was an interval of more than 6 months between two subsequent years of a multiyear arrangement; or if at least one of the annual arrangements was not approved (exceptions are programs which were cancelled and replaced by another program, in which case noncompleted reviews and nonapproved annual arrangements are not counted as interruptions).
6/ An irreversible interruption occurs if either: (i) the last scheduled program review was not completed (all programs); or (ii) all scheduled reviews were completed but the subsequent annual arrangement was not approved (ESAF/PRGF arrangements).
Table 2. Correlations of Implementation Indices (excluding arrangements precautionary on approval)
Irreversible Interruption Index 6/
Average Share of Committed Funds Disbursed
Note: In brackets is 2-tailed significance level. Significant at 0.05 level are in bold.
*Multiyear arrangements are treated as one program. These programs were approved between 1992 and 1998 and are taken from the MONA database.
Average Macro Implementation Index 1/4/
Average Structural Implementation Index 2/4/
Average Overall Implementation Index 3/4/

Political Economy Characteristics Average Number of Programs Average Number of
ProgramsEthnic Fractionalization 46 58 51 50
Political Instability 1/ 4.86 67 5.68 57
Executive Index of Electoral Competitiveness (in percent) 2/ 61 82 56 62
Time in Power (years) 6.08 98 5.15 74
Strength of Special Interests 3/ 16 66 25 54
Index of Political Cohesion 4/ 2.37 81 2.00 62
Quality of Bureaucracy 5/ 1.72 67 1.81 57
Variables under Fund ControlFund Effort per Program (in millions of US$) 6/ 1.74 99 1.56 72Total Number of Conditions per Program Year 65 95 56 68
Share of Quantitative PCs Waived (percent) 8.33 99 7.22 73
Share of Structural Conditions (percent) 37 95 40 68
Loan Size (agreed amount in millions of SDRs) 620 95 526 69
Macro Characteristics
Initial GDP per capita per year (US dollars) 1494 98 1291 74
Initial Debt to the Fund (actual holdings as percent quota) 177 99 159 74
Initial Central Government balance (in percent of GDP) -2.50 88 -4.74 68
Initial Level of Reserves (gross, in billions of SDR) 2.28 83 1.69 66
Initial Inflation (percent per annum) 80 98 53 74
Initial Current Account Balance (in percent of GDP) -5.32 98 -5.87 74Terms of Trade Shock (growth rate during the program period in percent) -90 98 -15 74
4/ The index of political cohesion is defined as follows: in presidential systems a high degree of political cohesion is said to exist if the same party is in control of the executive and legislature; in parliamentary systems a high degree of political cohesion means a one-party majority government. See the Annex for a more detailed definition.
Note: Bold figures indicate significance at the 5 percent level, bold and italic figures indicate significance at 10% level
Table 3. Features of Successful and Failed Fund programsSuccessful Failed
5/ Bureaucracy quality (ICRG) measures the quality of a country's bureaucracy on a 4 point scale. See the Annex for a more detailed definition. We interacted this variable with the dummy indicating that there was a change in chief executive (Political Institutions Database and CIA World Fact Book for most recent years).
6/ Fund effort is estimated dollar cost of Fund programs computed based on BRS data on hours spend by the staff on program implementation (it includes both preparation and supervision of the program) and estimated average salaries of the staff by grade. We also made use of the dollar costs of resident representatives provided by OPM.
*/ This model was estimated on a pooled sample of three implementation measures as left-hand side variables, ignoring the endogeneity of variables under the Fund's control. The measures of program success used are: (1) a binary variable indicating no irreversible program interruption; (2) the share of funds committed by the Fund under an arrangement disbursed (we excluded the measure of committed funds disbursed for arrangements precautionary on approval; cancelled programs that did not have irreversible interruption and arrangements that turned precautionary were treated as fully disbursed (100 percent)); and (3) the average share of conditions implemented. Regression also included constant term, which is omitted in the table.
1/ This index is computed based on the index of internal conflict provided by the ICRG on a scale from 0 to 12. Higher values of the index correspond to more internal political instability. We replaced the value of this variable by its maximum score (12) if there was a change in chief executive in the course of Fund program.
2/ Dummy variable which equals one 1 if the executive index of electoral competitiveness is equal to 7 and zero otherwise. The executive index of electoral competitiveness is from the Database of Political Institutions at the World Bank. It ranges from 1 to 7, with higher values corresponding to more competitive elections.
3/ Computed as the maximum share of seats in the parliament held by parties representing special interests (Political Institutions Database, World Bank). Four special interest groups are identified : religious, nationalistic, regional and rural.
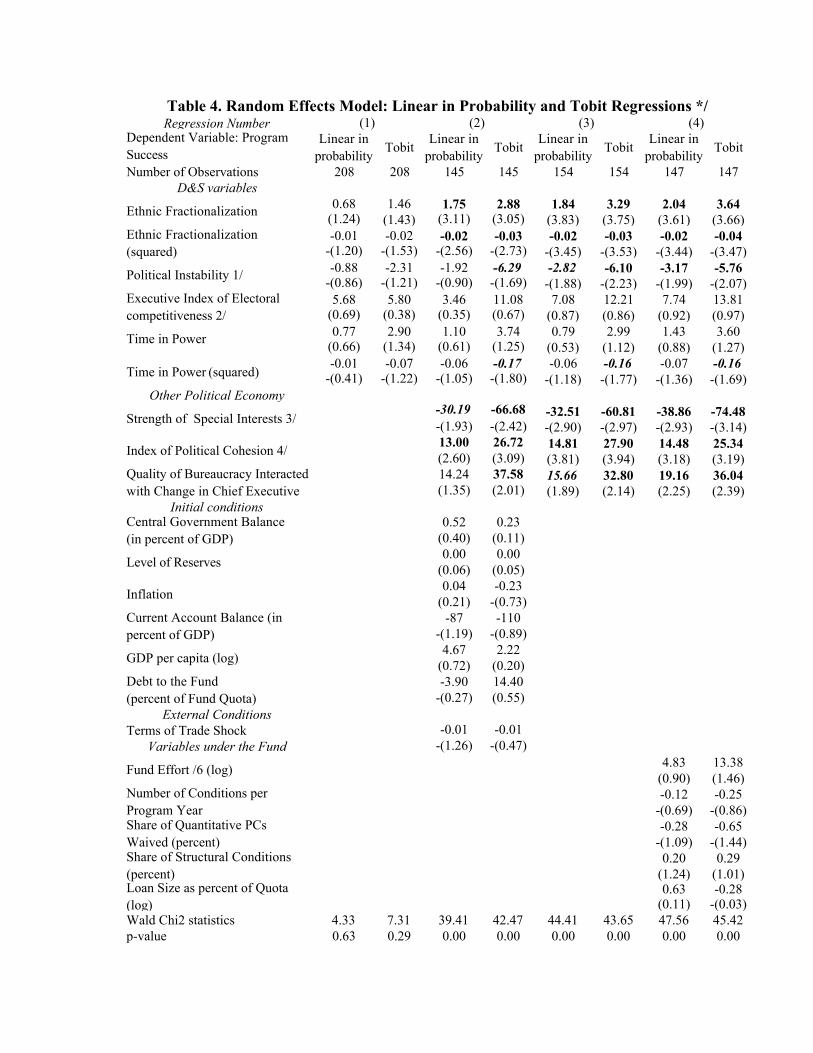
Regression NumberDependent Variable: Program Success
Linear in probability Tobit Linear in
probability Tobit Linear in probability Tobit Linear in
probability Tobit
Number of Observations 208 208 145 145 154 154 147 147D&S variables
0.68 1.46 1.75 2.88 1.84 3.29 2.04 3.64(1.24) (1.43) (3.11) (3.05) (3.83) (3.75) (3.61) (3.66)-0.01 -0.02 -0.02 -0.03 -0.02 -0.03 -0.02 -0.04
-(1.20) -(1.53) -(2.56) -(2.73) -(3.45) -(3.53) -(3.44) -(3.47)-0.88 -2.31 -1.92 -6.29 -2.82 -6.10 -3.17 -5.76
-(0.86) -(1.21) -(0.90) -(1.69) -(1.88) -(2.23) -(1.99) -(2.07)5.68 5.80 3.46 11.08 7.08 12.21 7.74 13.81
(0.69) (0.38) (0.35) (0.67) (0.87) (0.86) (0.92) (0.97)0.77 2.90 1.10 3.74 0.79 2.99 1.43 3.60
(0.66) (1.34) (0.61) (1.25) (0.53) (1.12) (0.88) (1.27)-0.01 -0.07 -0.06 -0.17 -0.06 -0.16 -0.07 -0.16
-(0.41) -(1.22) -(1.05) -(1.80) -(1.18) -(1.77) -(1.36) -(1.69)Other Political Economy
-30.19 -66.68 -32.51 -60.81 -38.86 -74.48-(1.93) -(2.42) -(2.90) -(2.97) -(2.93) -(3.14)13.00 26.72 14.81 27.90 14.48 25.34(2.60) (3.09) (3.81) (3.94) (3.18) (3.19)14.24 37.58 15.66 32.80 19.16 36.04(1.35) (2.01) (1.89) (2.14) (2.25) (2.39)
Initial conditions0.52 0.23
(0.40) (0.11)0.00 0.00
(0.06) (0.05)0.04 -0.23
(0.21) -(0.73)-87 -110
-(1.19) -(0.89)4.67 2.22
(0.72) (0.20)-3.90 14.40
-(0.27) (0.55)External Conditions
Terms of Trade Shock -0.01 -0.01Variables under the Fund -(1.26) -(0.47)
4.83 13.38(0.90) (1.46)-0.12 -0.25
-(0.69) -(0.86)-0.28 -0.65
-(1.09) -(1.44)0.20 0.29
(1.24) (1.01)0.63 -0.28
(0.11) -(0.03)Wald Chi2 statistics 4.33 7.31 39.41 42.47 44.41 43.65 47.56 45.42p-value 0.63 0.29 0.00 0.00 0.00 0.00 0.00 0.00
Time in Power (squared)
Index of Political Cohesion 4/
Central Government Balance (in percent of GDP)
Current Account Balance (in percent of GDP)
GDP per capita (log)
Fund Effort /6 (log)
Debt to the Fund (percent of Fund Quota)
Loan Size as percent of Quota (log)
Number of Conditions per Program Year
Share of Structural Conditions (percent)
Share of Quantitative PCs Waived (percent)
Ethnic Fractionalization
Ethnic Fractionalization (squared)
Level of Reserves
Inflation
Political Instability 1/
Executive Index of Electoral competitiveness 2/
Time in Power
Quality of Bureaucracy Interacted with Change in Chief Executive
Strength of Special Interests 3/
Table 4. Random Effects Model: Linear in Probability and Tobit Regressions */(1) (2) (3) (4)
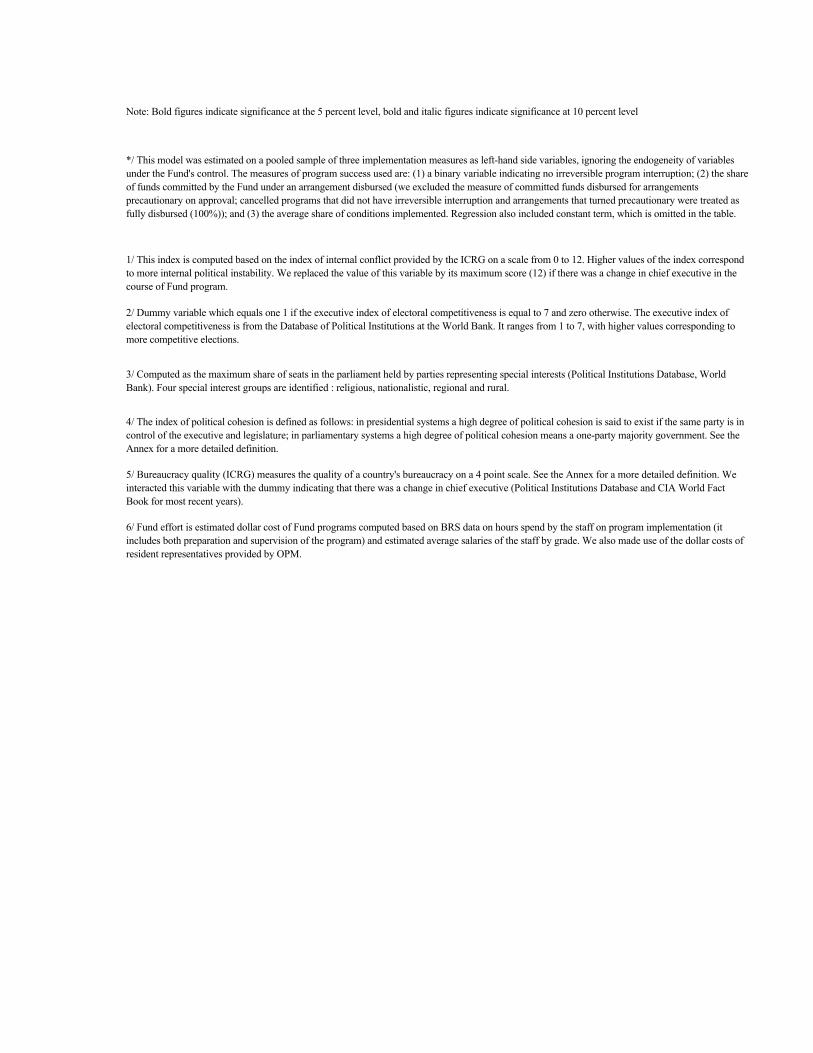
Note: Bold figures indicate significance at the 5 percent level, bold and italic figures indicate significance at 10 percent level
*/ This model was estimated on a pooled sample of three implementation measures as left-hand side variables, ignoring the endogeneity of variables under the Fund's control. The measures of program success used are: (1) a binary variable indicating no irreversible program interruption; (2) the share of funds committed by the Fund under an arrangement disbursed (we excluded the measure of committed funds disbursed for arrangements precautionary on approval; cancelled programs that did not have irreversible interruption and arrangements that turned precautionary were treated as fully disbursed (100%)); and (3) the average share of conditions implemented. Regression also included constant term, which is omitted in the table.
6/ Fund effort is estimated dollar cost of Fund programs computed based on BRS data on hours spend by the staff on program implementation (it includes both preparation and supervision of the program) and estimated average salaries of the staff by grade. We also made use of the dollar costs of resident representatives provided by OPM.
3/ Computed as the maximum share of seats in the parliament held by parties representing special interests (Political Institutions Database, World Bank). Four special interest groups are identified : religious, nationalistic, regional and rural.
4/ The index of political cohesion is defined as follows: in presidential systems a high degree of political cohesion is said to exist if the same party is in control of the executive and legislature; in parliamentary systems a high degree of political cohesion means a one-party majority government. See the Annex for a more detailed definition.
2/ Dummy variable which equals one 1 if the executive index of electoral competitiveness is equal to 7 and zero otherwise. The executive index of electoral competitiveness is from the Database of Political Institutions at the World Bank. It ranges from 1 to 7, with higher values corresponding to more competitive elections.
1/ This index is computed based on the index of internal conflict provided by the ICRG on a scale from 0 to 12. Higher values of the index correspond to more internal political instability. We replaced the value of this variable by its maximum score (12) if there was a change in chief executive in the course of Fund program.
5/ Bureaucracy quality (ICRG) measures the quality of a country's bureaucracy on a 4 point scale. See the Annex for a more detailed definition. We interacted this variable with the dummy indicating that there was a change in chief executive (Political Institutions Database and CIA World Fact Book for most recent years).
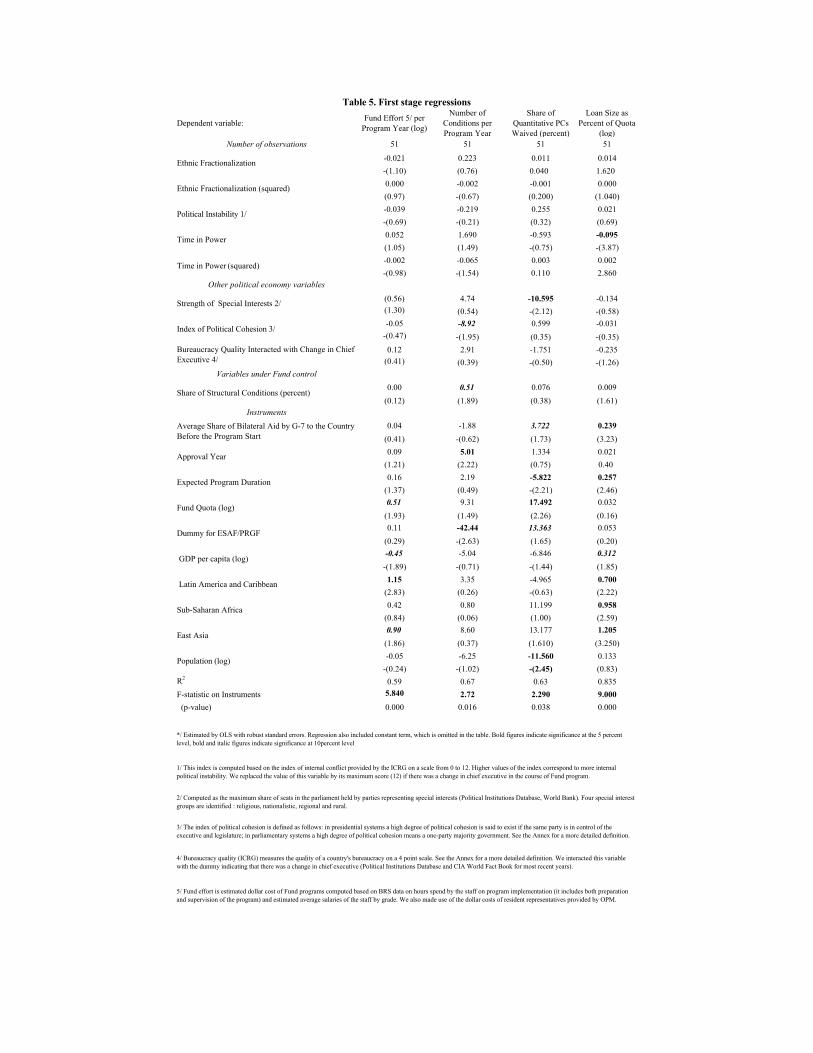
Dependent variable: Fund Effort 5/ per Program Year (log)
Number of Conditions per Program Year
Share of Quantitative PCs Waived (percent)
Loan Size as Percent of Quota
(log)Number of observations 51 51 51 51
-0.021 0.223 0.011 0.014-(1.10) (0.76) 0.040 1.6200.000 -0.002 -0.001 0.000(0.97) -(0.67) (0.200) (1.040)-0.039 -0.219 0.255 0.021-(0.69) -(0.21) (0.32) (0.69)0.052 1.690 -0.593 -0.095(1.05) (1.49) -(0.75) -(3.87)-0.002 -0.065 0.003 0.002-(0.98) -(1.54) 0.110 2.860
Other political economy variables
(0.56) 4.74 -10.595 -0.134(1.30) (0.54) -(2.12) -(0.58)-0.05 -8.92 0.599 -0.031
-(0.47) -(1.95) (0.35) -(0.35)0.12 2.91 -1.751 -0.235
(0.41) (0.39) -(0.50) -(1.26)Variables under Fund control
0.00 0.51 0.076 0.009(0.12) (1.89) (0.38) (1.61)
Instruments0.04 -1.88 3.722 0.239
(0.41) -(0.62) (1.73) (3.23)0.09 5.01 1.334 0.021
(1.21) (2.22) (0.75) 0.400.16 2.19 -5.822 0.257
(1.37) (0.49) -(2.21) (2.46)0.51 9.31 17.492 0.032
(1.93) (1.49) (2.26) (0.16)0.11 -42.44 13.363 0.053
(0.29) -(2.63) (1.65) (0.20)-0.45 -5.04 -6.846 0.312
-(1.89) -(0.71) -(1.44) (1.85)1.15 3.35 -4.965 0.700
(2.83) (0.26) -(0.63) (2.22)0.42 0.80 11.199 0.958
(0.84) (0.06) (1.00) (2.59)0.90 8.60 13.177 1.205
(1.86) (0.37) (1.610) (3.250)-0.05 -6.25 -11.560 0.133
-(0.24) -(1.02) -(2.45) (0.83)R2 0.59 0.67 0.63 0.835F-statistic on Instruments 5.840 2.72 2.290 9.000 (p-value) 0.000 0.016 0.038 0.000
*/ Estimated by OLS with robust standard errors. Regression also included constant term, which is omitted in the table. Bold figures indicate significance at the 5 percent level, bold and italic figures indicate significance at 10percent level
5/ Fund effort is estimated dollar cost of Fund programs computed based on BRS data on hours spend by the staff on program implementation (it includes both preparation and supervision of the program) and estimated average salaries of the staff by grade. We also made use of the dollar costs of resident representatives provided by OPM.
4/ Bureaucracy quality (ICRG) measures the quality of a country's bureaucracy on a 4 point scale. See the Annex for a more detailed definition. We interacted this variable with the dummy indicating that there was a change in chief executive (Political Institutions Database and CIA World Fact Book for most recent years).
1/ This index is computed based on the index of internal conflict provided by the ICRG on a scale from 0 to 12. Higher values of the index correspond to more internal political instability. We replaced the value of this variable by its maximum score (12) if there was a change in chief executive in the course of Fund program.
2/ Computed as the maximum share of seats in the parliament held by parties representing special interests (Political Institutions Database, World Bank). Four special interest groups are identified : religious, nationalistic, regional and rural.
3/ The index of political cohesion is defined as follows: in presidential systems a high degree of political cohesion is said to exist if the same party is in control of the executive and legislature; in parliamentary systems a high degree of political cohesion means a one-party majority government. See the Annex for a more detailed definition.
East Asia
Population (log)
Dummy for ESAF/PRGF
GDP per capita (log)
Latin America and Caribbean
Sub-Saharan Africa
Fund Quota (log)
Index of Political Cohesion 3/
Bureaucracy Quality Interacted with Change in Chief Executive 4/
Ethnic Fractionalization
Ethnic Fractionalization (squared)
Political Instability 1/
Average Share of Bilateral Aid by G-7 to the Country Before the Program Start
Share of Structural Conditions (percent)
Approval Year
Expected Program Duration
Table 5. First stage regressions
Time in Power
Time in Power (squared)
Strength of Special Interests 2/
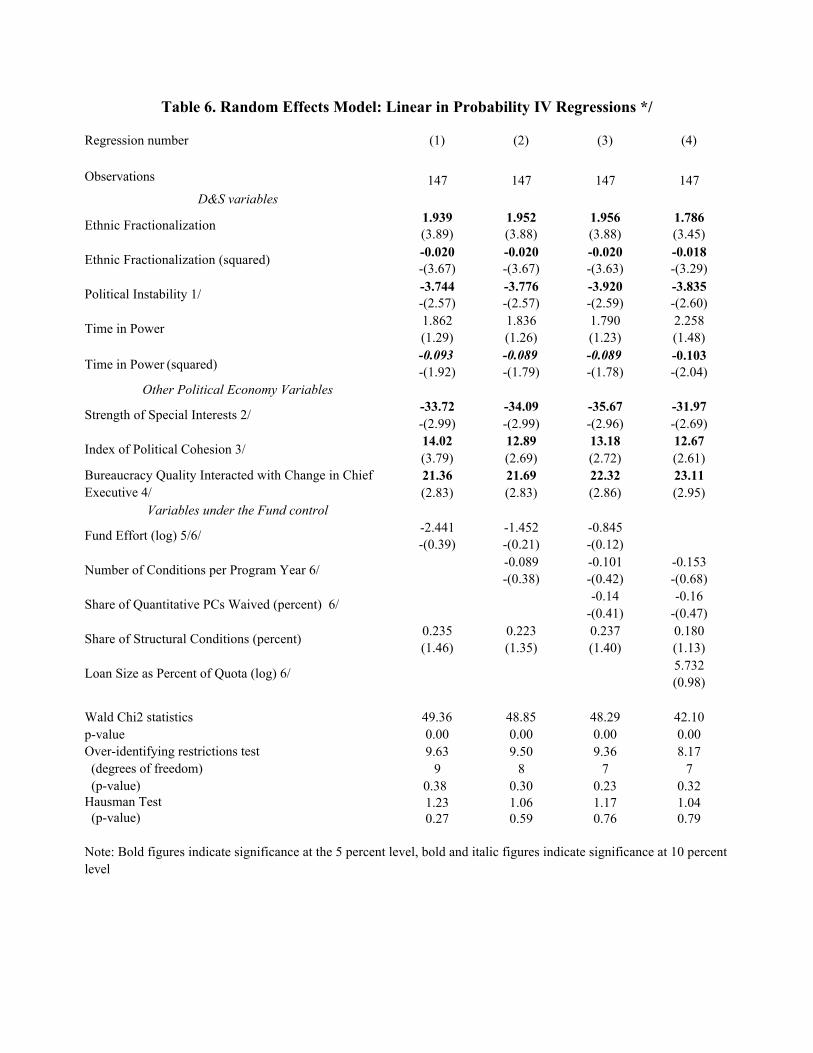
Regression number (1) (2) (3) (4)
Observations 147 147 147 147D&S variables
1.939 1.952 1.956 1.786(3.89) (3.88) (3.88) (3.45)-0.020 -0.020 -0.020 -0.018-(3.67) -(3.67) -(3.63) -(3.29)-3.744 -3.776 -3.920 -3.835-(2.57) -(2.57) -(2.59) -(2.60)1.862 1.836 1.790 2.258(1.29) (1.26) (1.23) (1.48)-0.093 -0.089 -0.089 -0.103-(1.92) -(1.79) -(1.78) -(2.04)
Other Political Economy Variables-33.72 -34.09 -35.67 -31.97-(2.99) -(2.99) -(2.96) -(2.69)14.02 12.89 13.18 12.67(3.79) (2.69) (2.72) (2.61)21.36 21.69 22.32 23.11(2.83) (2.83) (2.86) (2.95)
Variables under the Fund control-2.441 -1.452 -0.845-(0.39) -(0.21) -(0.12)
-0.089 -0.101 -0.153-(0.38) -(0.42) -(0.68)
-0.14 -0.16-(0.41) -(0.47)
0.235 0.223 0.237 0.180(1.46) (1.35) (1.40) (1.13)
5.732(0.98)
Wald Chi2 statistics 49.36 48.85 48.29 42.10p-value 0.00 0.00 0.00 0.00Over-identifying restrictions test 9.63 9.50 9.36 8.17 (degrees of freedom) 9 8 7 7 (p-value) 0.38 0.30 0.23 0.32Hausman Test 1.23 1.06 1.17 1.04 (p-value) 0.27 0.59 0.76 0.79
Note: Bold figures indicate significance at the 5 percent level, bold and italic figures indicate significance at 10 percent level
Loan Size as Percent of Quota (log) 6/
Number of Conditions per Program Year 6/
Share of Structural Conditions (percent)
Share of Quantitative PCs Waived (percent) 6/
Fund Effort (log) 5/6/
Ethnic Fractionalization
Ethnic Fractionalization (squared)
Time in Power (squared)
Table 6. Random Effects Model: Linear in Probability IV Regressions */
Political Instability 1/
Bureaucracy Quality Interacted with Change in Chief Executive 4/
Strength of Special Interests 2/
Index of Political Cohesion 3/
Time in Power

6/ Treated as endogenous variable in this regression
4/ Bureaucracy quality (ICRG) measures the quality of a country's bureaucracy on a 4 point scale. See the Annex for a more detailed definition. We interacted this variable with the dummy indicating that there was a change in chief executive (Political Institutions Database and CIA World Fact Book for most recent years).
5/ Fund effort is estimated dollar cost of Fund programs computed based on BRS data on hours spend by the staff on program implementation (it includes both preparation and supervision of the program) and estimated average salaries of the staff by grade. We also made use of the dollar costs of resident representatives provided by OPM.
*/ This model was estimated on a pooled sample of three implementation measures as left-hand side variables, using random effects IV estimator with the set of instruments as specified in Table 5. The measures of program success used are: (1) a binary variable indicating no irreversible program interruption; (2) the share of funds committed by the Fund under an arrangement disbursed (we excluded the measure of committed funds disbursed for arrangements precautionary on approval; cancelled programs that did not have irreversible interruption and arrangements that turned precautionary were treated as fully disbursed (100percent)); and (3) the average share of conditions implemented. Regression also included constant term, which is omitted in the table.
1/ This index is computed based on the index of internal conflict provided by the ICRG on a scale from 0 to 12. Higher values of the index correspond to more internal political instability. We replaced the value of this variable by its maximum score (12) if there was a change in chief executive in the course of Fund program.
2/ Computed as the maximum share of seats in the parliament held by parties representing special interests (Political Institutions Database, World Bank). Four special interest groups are identified : religious, nationalistic, regional and rural.
3/ The index of political cohesion is defined as follows: in presidential systems a high degree of political cohesion is said to exist if the same party is in control of the executive and legislature; in parliamentary systems a high degree of political cohesion means a one-party majority government. See the Annex for a more detailed definition.

Dependent variable
Model Linear in probability Probit Linear in
probability Tobit Linear in probability Tobit
Observations 76 76 67 67 65 65
D&S variables
0.720 0.019 0.081 0.069 0.849 0.892
(0.77) (0.82) (0.15) (0.07) (3.72) (4.02)
-0.009 0.000 -0.001 -0.001 -0.011 -0.012
-(0.79) -(0.89) -(0.18) -(0.12) -(4.31) -(4.60)-1.359 -0.035 -1.294 -2.258 0.004 0.040
-(0.81) -(0.80) -(1.30) -(1.16) (0.01) (0.10)9.665 0.257 -1.214 0.999 2.907 3.382
(0.68) (0.74) -(0.13) (0.06) (0.75) (0.97)3.091 0.083 0.582 2.140 0.300 0.332
(1.68) (1.69) (0.61) (0.93) (0.68) (0.74)-0.073 -0.002 -0.012 -0.050 -0.001 -0.001
-(1.52) -(1.54) -(0.54) -(0.86) -(0.07) -(0.07)R2 0.09 0.05 0.33Predictive ability of the model (percent) 3/ 61.84
Table 7a. Linear in Probability and Probit/Tobit Regressions on Three Implementation Measures Separately
*/ For the regression of the share of committed funds disbursed we excluded arrangements precautionary on approval. Cancelled programs that did not have irreversible interruption and arrangements that turned precautionary were treated as fully disbursed (100percent)
D&S Specification of Political Economy Variables
Non-Interruption Dummy
Note: Bold figures indicate significance at the 5 percent level, bold and italic figures indicate significance at 10 percent level
Share of Committed Funds Disbursed*
Average Overall Implementation Index
3/ Predictive ability of the model is computed as follows: if predicted value from probit regression was higher or equal to 0.5 we count this prediction as no interruption, otherwise we count this prediction as interruption, then we compare the actual outcome with predicted outcome and compute the share of correct predictions
Ethnic Fractionalization
Time in Power
Time in Power (squared)
Ethnic Fractionalization (squared)
Political Instability 1/
Executive Index of Electoral Competitiveness 2/
1/ This index is computed based on the index of internal conflict provided by the ICRG on a scale from 0 to 12. Higher values of the index correspond to more internal political instability. We replaced the value of this variable by its maximum score (12) if there was a change in chief executive in the course of Fund program.
2/ Dummy variable which equals one 1 if the executive index of electoral competitiveness is equal to 7 and zero otherwise. The executive index of electoral competitiveness is from the Database of Political Institutions at the World Bank. It ranges from 1 to 7, with higher values corresponding to more competitive elections.

Dependent variable
Model Linear in probability Probit Linear in
probability Tobit Linear in probability Tobit
Observations 56 56 49 49 49 49
D&S variables
2.38 0.09 1.37 1.96 1.17 1.22
(2.74) (2.52) (2.49) (2.25) (4.39) (4.56)
-0.02 0.00 -0.01 -0.02 -0.01 -0.01
-(2.44) -(2.28) -(2.16) -(1.90) -(4.84) -(4.86)-7.21 -0.28 -3.40 -5.96 0.10 0.14
-(2.77) -(2.43) -(2.41) -(2.33) (0.14) (0.19)Other political economy variables
-56.42 -2.14 -33.25 -49.86 -10.81 -11.08
-(3.01) -(2.44) -(2.45) -(2.48) -(1.98) -(1.86)22.73 0.88 14.33 20.95 1.16 1.24
(4.66) (2.69) (4.45) (3.30) (0.48) (0.64)37.07 1.47 16.74 29.05 0.76 0.64
(3.28) (2.03) (2.80) (2.06) (0.20) (0.16)
R2 0.38 0.45 0.38Predictive ability of the model (percent) 5/ 82.14
Table 7b. Linear in Probability and Probit/Tobit Regressions on Three Implementation Measures Separately
*/ For the regression of the share of committed funds disbursed we excluded arrangements precautionary on approval. Cancelled programs that did not have irreversible interruption and arrangements that turned precautionary were treated as fully disbursed (100percent)
Our Specification of Political Economy Variables
Non-Interruption Dummy
Share of Committed Funds Disbursed*
Average Overall Implementation Index
Bureaucracy Quality Interacted with Change in Chief Executive 4/
3/ The index of political cohesion is defined as follows: in presidential systems a high degree of political cohesion is said to exist if the same party is in control of the executive and legislature; in parliamentary systems a high degree of political cohesion means a one-party majority government. See the Annex for a more detailed definition.
Index of Political Cohesion 3/
1/ This index is computed based on the index of internal conflict provided by the ICRG on a scale from 0 to 12. Higher values of the index correspond to more internal political instability. We replaced the value of this variable by its maximum score (12) if there was a change in chief executive in the course of Fund program.
2/ Computed as the maximum share of seats in the parliament held by parties representing special interests (Political Institutions Database, World Bank). Four special interest groups are identified : religious, nationalistic, regional and rural.
Note: Bold figures indicate significance at the 5 percent level, bold and italic figures indicate significance at 10 percent level
Ethnic Fractionalization
Ethnic Fractionalization (squared)
Political Instability 1/
Strength of Special Interests 2/

4/ Bureaucracy quality (ICRG) measures the quality of a country's bureaucracy on a 4 point scale. See the Annex for a more detailed definition. We interacted this variable with the dummy indicating that there was a change in chief executive (Political Institutions Database and CIA World Fact Book for most recent years).
5/ Predictive ability of the model is computed as follows: if predicted value from probit regression was higher or equal to 0.5 we count this prediction as no interruption, otherwise we count this prediction as interruption, then we compare the actual outcome with predicted outcome and compute the share of correct predictions
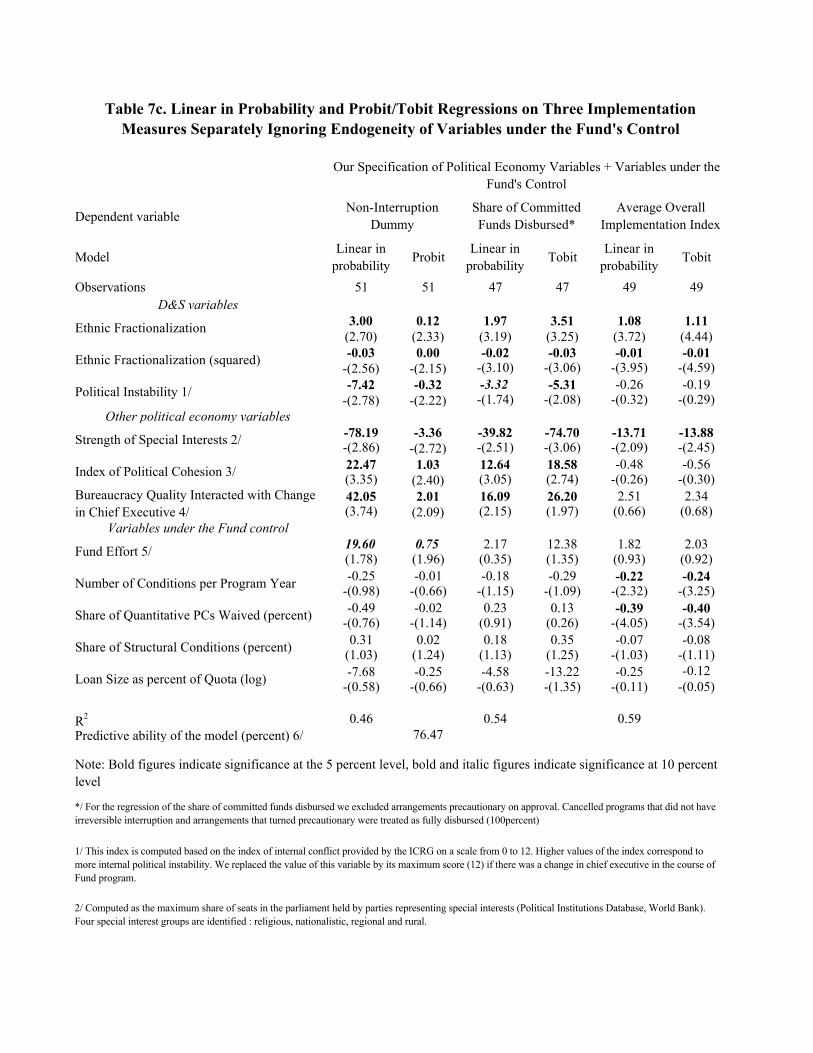
Dependent variable
Model Linear in probability Probit Linear in
probability Tobit Linear in probability Tobit
Observations 51 51 47 47 49 49D&S variables
3.00 0.12 1.97 3.51 1.08 1.11(2.70) (2.33) (3.19) (3.25) (3.72) (4.44)-0.03 0.00 -0.02 -0.03 -0.01 -0.01
-(2.56) -(2.15) -(3.10) -(3.06) -(3.95) -(4.59)-7.42 -0.32 -3.32 -5.31 -0.26 -0.19
-(2.78) -(2.22) -(1.74) -(2.08) -(0.32) -(0.29)Other political economy variables
-78.19 -3.36 -39.82 -74.70 -13.71 -13.88-(2.86) -(2.72) -(2.51) -(3.06) -(2.09) -(2.45)22.47 1.03 12.64 18.58 -0.48 -0.56(3.35) (2.40) (3.05) (2.74) -(0.26) -(0.30)42.05 2.01 16.09 26.20 2.51 2.34(3.74) (2.09) (2.15) (1.97) (0.66) (0.68)
Variables under the Fund control19.60 0.75 2.17 12.38 1.82 2.03(1.78) (1.96) (0.35) (1.35) (0.93) (0.92)-0.25 -0.01 -0.18 -0.29 -0.22 -0.24
-(0.98) -(0.66) -(1.15) -(1.09) -(2.32) -(3.25)-0.49 -0.02 0.23 0.13 -0.39 -0.40
-(0.76) -(1.14) (0.91) (0.26) -(4.05) -(3.54)0.31 0.02 0.18 0.35 -0.07 -0.08
(1.03) (1.24) (1.13) (1.25) -(1.03) -(1.11)-7.68 -0.25 -4.58 -13.22 -0.25 -0.12
-(0.58) -(0.66) -(0.63) -(1.35) -(0.11) -(0.05)
R2 0.46 0.54 0.59Predictive ability of the model (percent) 6/ 76.47
1/ This index is computed based on the index of internal conflict provided by the ICRG on a scale from 0 to 12. Higher values of the index correspond to more internal political instability. We replaced the value of this variable by its maximum score (12) if there was a change in chief executive in the course of Fund program.
2/ Computed as the maximum share of seats in the parliament held by parties representing special interests (Political Institutions Database, World Bank). Four special interest groups are identified : religious, nationalistic, regional and rural.
Note: Bold figures indicate significance at the 5 percent level, bold and italic figures indicate significance at 10 percent level
Table 7c. Linear in Probability and Probit/Tobit Regressions on Three Implementation Measures Separately Ignoring Endogeneity of Variables under the Fund's Control
*/ For the regression of the share of committed funds disbursed we excluded arrangements precautionary on approval. Cancelled programs that did not have irreversible interruption and arrangements that turned precautionary were treated as fully disbursed (100percent)
Share of Quantitative PCs Waived (percent)
Loan Size as percent of Quota (log)
Ethnic Fractionalization (squared)
Political Instability 1/
Fund Effort 5/
Bureaucracy Quality Interacted with Change in Chief Executive 4/
Strength of Special Interests 2/
Share of Structural Conditions (percent)
Ethnic Fractionalization
Number of Conditions per Program Year
Index of Political Cohesion 3/
Our Specification of Political Economy Variables + Variables under the Fund's Control
Non-Interruption Dummy
Share of Committed Funds Disbursed*
Average Overall Implementation Index
3/ The index of political cohesion is defined as follows: in presidential systems a high degree of political cohesion is said to exist if the same party is in control of the executive and legislature; in parliamentary systems a high degree of political cohesion means a one-party majority government. See the Annex for a more detailed definition.
4/ Bureaucracy quality (ICRG) measures the quality of a country's bureaucracy on a 4 point scale. See the Annex for a more detailed definition. We interacted this variable with the dummy indicating that there was a change in chief executive (Political Institutions Database and CIA World Fact Book for most recent years).
5/ Fund effort is estimated dollar cost of Fund programs computed based on BRS data on hours spend by the staff on program implementation (it includes both preparation and supervision of the program) and estimated average salaries of the staff by grade. We also made use of the dollar costs of resident representatives provided by OPM.
6/ Predictive ability of the model is computed as follows: if predicted value from probit regression was higher or equal to 0.5 we count this prediction as no interruption, otherwise we count this prediction as interruption, then we compare the actual outcome with predicted outcome and compute the share of correct predictions

Dependent variable: Fund Effort 5/ per Program Year (log)
Number of Conditions per Program Year
Share of Quantitative PCs Waived (percent)
Loan Size as Percent of
Quota (log)
-0.030 0.148 -0.066 0.014-(1.80) (0.54) -(0.34) (1.58)
0.000 -0.001 0.001 0.000(1.37) -(0.47) (0.36) -(0.91)-0.052 -0.444 -1.168 0.030-(1.14) -(0.48) -(1.00) (0.64)
Other political economy variables(0.53) 6.82 -11.42 -0.181.430 0.950 -2.010 -0.780(0.02) -8.22 2.54 -0.060.360 -1.950 2.130 -0.780-(0.07) -0.70 3.71 -0.23-0.290 -0.120 0.760 -1.050
Instruments0.097(1.71)
7.74(3.36)
0.29 0.443(2.38) (6.12)0.39 2.14 4.28
(3.60) (0.87) (2.82)-19.54 9.77-(3.49) (2.88)
-0.31 -3.02 0.181-(1.87) -(1.43) 1.620
R2 0.463 0.585 0.357 0.598F-statistic on Instruments 0.47 5.64 4.35 5.97 (p-value) 0.00 0.00 0.01 0.00
Table 8. First stage regressions*
*/ Estimation by OLS with robust standard errors. Bold figures indicate significance at the 5 percent level, bold and italic figures indicate significance at 10% level.
1/ This index is computed based on the index of internal conflict provided by the ICRG on a scale from 0 to 12. Higher values of the index correspond to more internal political instability. We replaced the value of this variable by its maximum value (12) if there was a change in the head of state in the course of Fund program.
Political Instability 1/
Index of Political Cohesion 3/
Bureaucracy Quality Interacted with Change in Chief Executive 4/
Ethnic Fractionalization
Ethnic Fractionalization (squared)
Strength of Special Interests 2/
Average Share of Bilateral Aid by G-7 to the Country Before the Program Start
2/ Computed as the maximum share of seats in the parliament held by parties representing special interests (Political Institutions Database, World Bank). Four special interest groups are identified : religious, nationalistic, regional and rural.
3/ The index of political cohesion is defined as follows: for a parliamentary system, a high degree of political cohesion corresponds to the case when executive and legislature are hold by the same party. See the Annex for a more detailed definition.
Dummy for ESAF/PRGF
GDP per capita (log)
Approval Year
Expected Program Duration
Quota (log)

4/ Bureaucracy quality (ICRG) measures the quality of a country's bureaucracy on a 4 point scale. See the Annex for a more detailed definition. We interacted this variable with the dummy indicating that there was a change in the head of state (Political Institutions Database and CIA World Fact Book for most recent years).
5/ Fund effort is estimated dollar cost of Fund programs computed based on BRS data on hours spend by the staff on UFR and TA in the country during program implementation (it includes both preparation and supervision of the program) and estimated average salaries of the staff by grade

Dependent variable
Regression # (1) (2) (3) (4)
Observations 55 55 55 55D&S variables
0.089 0.070 0.116 0.073(2.20) (1.68) (2.09) (1.79)-0.001 -0.001 -0.001 -0.001-(2.06) -(1.49) -(2.03) -(1.63)-0.252 -0.260 -0.197 -0.272-(2.10) -(2.01) -(1.28) -(2.14)
Other political economy variables-2.488 -1.860 -2.098 -1.814-(2.40) -(1.77) -(1.64) -(1.96)0.970 0.669 0.869 0.841(2.64) (1.59) (1.89) (2.63)1.474 1.395 1.192 1.519(1.77) (1.78) (1.19) (2.09)
Variables under the Fund control0.434(0.88)
-0.015-(0.80)
0.094(1.51)
0.351(0.71)
Predictive ability of the model 6/ 67.27 64.71 70.91 67.31Note: Bold figures indicate significance at the 5 percent level, bold and italic figures indicate significance at 10 percent level
1/ This index is computed based on the index of internal conflict provided by the ICRG on a scale from 0 to 12. Higher values of the index correspond to more internal political instability. We replaced the value of this variable by its maximum score (12) if there was a change in chief executive in the course of Fund program.
2/ Computed as the maximum share of seats in the parliament held by parties representing special interests (Political Institutions Database, World Bank). Four special interest groups are identified : religious, nationalistic, regional and rural.
3/ The index of political cohesion is defined as follows: in presidential systems a high degree of political cohesion is said to exist if the same party is in control of the executive and legislature; in parliamentary systems a high degree of political cohesion means a one-party majority government. See the Annex for a more detailed definition.
*/ For IV estimation of each implementation measure separately we use shorter IV sets as specified in Table 8. IV regression for non-interruption dummy was estimated using two-stage Amemiya (1978) GLS procedure (IV probit)
Bureaucracy Quality Interacted with Change in Chief Executive 4/
Strength of Special Interests 2/
Table 9a. IV regressions* for Non-Interruption Dummy Taking into Account Endogeneity of Variables under the Fund's Control
Political Instability 1/
Loan Size as Percent of Quota (log) 7/
Number of Conditions per Program Year 7/
Fund Effort 5/7/
Non-Interruption Dummy
Index of Political Cohesion 3/
Ethnic Fractionalization
Ethnic Fractionalization (squared)
Share of Quantitative PCs Waived (percent) 7/
7/ Treated as endogenous variable in this regression
4/ Bureaucracy quality (ICRG) measures the quality of a country's bureaucracy on a 4 point scale. See the Annex for a more detailed definition. We interacted this variable with the dummy indicating that there was a change in chief executive (Political Institutions Database and CIA World Fact Book for most recent years).
5/ Fund effort is estimated dollar cost of Fund programs computed based on BRS data on hours spend by the staff on program implementation (it includes both preparation and supervision of the program) and estimated average salaries of the staff by grade. We also made use of the dollar costs of resident representatives provided by OPM.
6/ Predictive ability of the model is computed as follows: if predicted value from probit regression was higher or equal to 0.5 we count this prediction as no interruption, otherwise we count this prediction as interruption, then we compare the actual outcome with predicted outcome and compute the share of correct predictions.

Dependent variable
Regression # (1) (2) (3) (4)
Observations 49 49 49 49D&S variables
1.853 2.304 2.085 2.229(1.93) (2.43) (2.35) (2.47)-0.017 -0.022 -0.021 -0.021-(1.69) -(2.12) -(2.14) -(2.18)-5.765 -6.199 -4.379 -4.940-(2.22) -(2.27) -(1.62) -(2.02)
Other political economy variables-48.897 -48.089 -39.154 -50.612-(2.25) -(2.26) -(1.86) -(2.50)20.338 11.378 17.342 22.350(3.35) (1.34) (2.65) (3.56)28.611 29.135 21.351 24.406(2.02) (1.98) (1.45) (1.82)
Variables under the Fund control-0.874-(0.07)
-0.921-(1.99)
1.258(1.33)
2.983(0.25)
Note: Bold figures indicate significance at the 5 percent level, bold and italic figures indicate significance at 10 percent level
Fund Effort 5/6/
Share of Quantitative PCs Waived (percent) 6/
Table 9b. IV regressions* for the Average Share of Committed Funds Disbursed Taking into Account Endogeneity of Variables under the Fund's Control
Ethnic Fractionalization
Share of Committed Funds Disbursed**
Strength of Special Interests 2/
Political Instability 1/
Loan Size as Percent of Quota (log) 6/
Number of Conditions per Program Year 6/
Ethnic Fractionalization (squared)
Index of Political Cohesion 3/
Bureaucracy Quality Interacted with Change in Chief Executive 4/
*/ For IV estimation of each implementation measure separately we use shorter IV sets as specified in Table 8. IV regression for the share of committed funds disbursed was estimated using two-stage Amemiya (1978) GLS procedure (IV tobit)
1/ This index is computed based on the index of internal conflict provided by the ICRG on a scale from 0 to 12. Higher values of the index correspond to more internal political instability. We replaced the value of this variable by its maximum score (12) if there was a change in chief executive in the course of Fund program.
6/ Treated as endogenous variable in this regression
3/ The index of political cohesion is defined as follows: in presidential systems a high degree of political cohesion is said to exist if the same party is in control of the executive and legislature; in parliamentary systems a high degree of political cohesion means a one-party majority government. See the Annex for a more detailed definition.
4/ Bureaucracy quality (ICRG) measures the quality of a country's bureaucracy on a 4 point scale. See the Annex for a more detailed definition. We interacted this variable with the dummy indicating that there was a change in chief executive (Political Institutions Database and CIA World Fact Book for most recent years).
5/ Fund effort is estimated dollar cost of Fund programs computed based on BRS data on hours spend by the staff on program implementation (it includes both preparation and supervision of the program) and estimated average salaries of the staff by grade. We also made use of the dollar costs of resident representatives provided by OPM.
2/ Computed as the maximum share of seats in the parliament held by parties representing special interests (Political Institutions Database, World Bank). Four special interest groups are identified : religious, nationalistic, regional and rural.
**/ For the regression of the share of committed funds disbursed we excluded arrangements precautionary on approval. Cancelled programs that did not have irreversible interruption and arrangements that turned precautionary were treated as fully disbursed (100 percent)

Dependent variable
Regression # (1) (2) (3) (4)
Observations 49 49 49 49D&S variables
1.129 1.186 1.149 1.154(3.86) (4.93) (4.63) (3.99)-0.013 -0.014 -0.013 -0.013-(4.18) -(5.32) -(4.62) -(4.42)0.016 -0.088 -0.117 0.125(0.02) -(0.13) -(0.16) (0.16)
Other political economy variables-9.223 -10.429 -13.085 -9.636-(1.43) -(1.94) -(2.31) -(1.49)1.012 -1.013 1.889 1.386(0.52) -(0.44) (1.02) (0.69)0.812 1.590 1.758 0.855(0.21) (0.43) (0.47) (0.21)
Variables under the Fund control-2.364-(0.67)
-0.180-(1.50) -0.300
-(1.16)
2.306(0.62)
Note: Bold figures indicate significance at the 5 percent level, bold and italic figures indicate significance at 10 percent level
Strength of Special Interests 2/
Table 9c. IV regressions* for the Average Overall Implementation Index Taking into Account Endogeneity of Variables under the Fund's Control
Average Overall Implementation Index
Political Instability 1/
Ethnic Fractionalization
Ethnic Fractionalization (squared)
Loan Size as Percent of Quota (log) 6/
Number of Conditions per Program Year 6/
Fund Effort 5/6/
Index of Political Cohesion 3/
Share of Quantitative PCs Waived (percent) 6/
Bureaucracy Quality Interacted with Change in Chief Executive 4/

6/ Treated as endogenous variable in this regression
5/ Fund effort is estimated dollar cost of Fund programs computed based on BRS data on hours spend by the staff on program implementation (it includes both preparation and supervision of the program) and estimated average salaries of the staff by grade. We also made use of the dollar costs of resident representatives provided by OPM.
*/ For IV estimation of each implementation measure separately we use shorter IV sets as specified in Table 8. IV regression for the average overall implementation index was estimated using two-stage Amemiya (1978) GLS procedure (IV tobit)
1/ This index is computed based on the index of internal conflict provided by the ICRG on a scale from 0 to 12. Higher values of the index correspond to more internal political instability. We replaced the value of this variable by its maximum score (12) if there was a change in chief executive in the course of Fund program.
2/ Computed as the maximum share of seats in the parliament held by parties representing special interests (Political Institutions Database, World Bank). Four special interest groups are identified : religious, nationalistic, regional and rural.
3/ The index of political cohesion is defined as follows: in presidential systems a high degree of political cohesion is said to exist if the same party is in control of the executive and legislature; in parliamentary systems a high degree of political cohesion means a one-party majority government. See the Annex for a more detailed definition.
4/ Bureaucracy quality (ICRG) measures the quality of a country's bureaucracy on a 4 point scale. See the Annex for a more detailed definition. We interacted this variable with the dummy indicating that there was a change in chief executive (Political Institutions Database and CIA World Fact Book for most recent years).