What Determines Cash Holdings at Privately Held and ... ANNUAL MEETINGS/2012-… · 2 What...
64
1 What Determines Cash Holdings at Privately Held and Publicly Traded Firms? Evidence from 20 Emerging Markets Irina BEZHENTSEVA University of Greenwich Business School Thomas HALL Christopher Newport University USA [email protected] Cesario MATEUS University of Greenwich Business School [email protected] October 10, 2011 ABSTRACT This paper constitutes the first large sample study to examine how firm-level characteristics and national-level institutions affect firms’ cash balances. The empirical results support three main findings. First, firms in countries that are more market- oriented and foster entrepreneurship have larger cash reserves. Second, the same determinants of cash balances for public firms also apply for private firms. Third, private firms start to accumulate cash reserves for a level of short term debt over total assets that are on average 65 percent higher than for public firms. Keywords: Cash Holdings, Debt, Central and Eastern Europe JEL classification codes: G32 Preliminary draft Please do not quote without Permission
Transcript of What Determines Cash Holdings at Privately Held and ... ANNUAL MEETINGS/2012-… · 2 What...

1
What Determines Cash Holdings at Privately Held and
Publicly Traded Firms? Evidence from 20 Emerging Markets
Irina BEZHENTSEVA University of Greenwich Business School
Thomas HALL Christopher Newport University
USA
Cesario MATEUS University of Greenwich Business School
October 10, 2011
ABSTRACT
This paper constitutes the first large sample study to examine how firm-level
characteristics and national-level institutions affect firms’ cash balances. The empirical
results support three main findings. First, firms in countries that are more market-
oriented and foster entrepreneurship have larger cash reserves. Second, the same
determinants of cash balances for public firms also apply for private firms. Third,
private firms start to accumulate cash reserves for a level of short term debt over total
assets that are on average 65 percent higher than for public firms.
Keywords: Cash Holdings, Debt, Central and Eastern Europe
JEL classification codes: G32
Preliminary draft
Please do not quote without Permission

2
What Determines Cash Holdings at Privately Held and
Publicly Traded Firms? Evidence from 20 Emerging Markets
1 Introduction
Many researchers have examined the willingness of firms to hold cash, and the majority
of such studies have focused on analysis of large companies listed on stock exchanges.
These firms presumably have strong relationships with capital markets, and therefore
less need for precautionary balances vis-à-vis small privately held companies. Because
financial crises and market imperfections arguably impact small and medium-size
enterprises more than large firms, however, it is important to consider whether the
factors that affect cash holdings at publicly traded companies also affect cash holdings
at non-listed firms. Even less work has been done concerning privately held firms in
emerging markets; in those settings, institutional variation at the national level may alter
the motivations for firms to hold cash. This paper will examine cash holdings by both
listed and privately-held companies in Central and Eastern Europe. We examine a
sample of 16,786 listed and unlisted firms from twenty countries for the period 2001 to
2010 (104,605 firm-year observations). This region is ideal for our purposes, because it
contains a large number of countries at various stages of financial and institutional
development, yet unlike many other emerging market contexts, the countries are
advanced enough that consistent and high-quality data on privately held firms exists.
This paper has several objectives: First, we examine whether national-level
characteristics (such as the level of development of financial institutions or
macroeconomic factors) are related to average levels of cash balances relative to total
assets. Second, we test whether the same factors that affect cash balances in large listed
firms also apply for small-medium sized firms. Third, because cash can be viewed as
―negative debt‖, we examine the impact of debt levels on cash balances.
The paper proceeds as follows. Section 2 is dedicated to the literature review and
motivates the central hypotheses. Section 3 presents the data sources and discusses
sample selection and financial information. In Section 4 the model and variables used in

3
the empirical analysis to test the effect of firm’s characteristics and institutional factors
on cash balances are discussed. Results are presented in section 5; section 6 concludes.
2. Background on determinants of cash holdings
Keynes (1936) argued that the desired level of money holdings can be thought of as
deriving from either transactions demand (cash is used to reduce transactions costs such
as making payroll, paying bills, etc.) or precautionary demand (cash is used as a buffer
or insurance to protect the firm in the event of difficult circumstances).
Corporate finance researchers suggest three models that determine main characteristics
that influence on a decision of companies to keep cash. The trade-off model (Ferreira
and Vilela, 2004) argues that companies set the optimal level of cash reserves
comparing marginal benefits and costs of holding cash. The model explains that one of
the benefits from cash holding is a decrease of likelihood that a company will be
affected by financial distress. The reason to hold cash could be explained as
precautionary motives. In this case, companies use cash reserves as insurance in order to
survive in a period of uncertainty and unstable situations on the market. Moreover, the
model emphasize that using this cash cushion companies can apply an optimal
investment policy if they met financial constrains.
Transaction and precautionary demand for cash is studied by Lins (2009), who finds
that firms use cash and lines of credit for different purposes. Lines of credit are more
used by companies in order to get external financing for future investment opportunities.
Excessive cash has the role of the buffer against future financial cataclysms. Sufi (2009)
argues that cash represents unconditional liquidity whereas lines of credit are merely
conditional. Lins (2009) provides additional reasons, for instance if the firms do not pay
dividends, have less agency problems and locate in countries with more developed
credit markets.
The pecking order model of Myers and Majluf (1984) states that companies keep cash
in order to finance new projects and opportunities. In order to minimize the cost driven
by asymmetric information, however, companies use cash as a first available tool; they
turn to safe and risky debt and equities only as a last resort. The main idea of this theory

4
is that companies do not possess a target cash amount, but rather they use cash as a
buffer between earnings and investments. This theory is very important for small and
medium-size firms because in conditions of asymmetric information they are more
affected than large and multinational corporations. As a result, firms with higher levels
of information asymmetry should have more cash, ceteris paribus. Some studies
consider how volatility of cash flows affects firm-level cash holding (Faulkender, 2002;
Irvine and Pontiff, 2008; Han and Qiu, 2007, Acharya, 2007; Zhou, 2009).
The free-cash flow model (Jensen 1986) argues that managers of companies create
reserves from excessive cash in order to get more assets under their control, in order to
increase their power and to be free to accept new projects without a permission of the
shareholders. Due to internal financing they can reduce a level of monitoring activity.
However, this problem is not serious in privately-held companies because there is more
probable that owners execute functions of managers. However, in this situation the
companies are more flexible and independent from external credits and debt holders
(Berger and Udell, 2003). In this case the level of cash will directly depend on the level
of managerial ownership.
Variation in average cash-to-assets ratios can be explained by national-level factors
such as macroeconomic performance, corruption, and the legal system characteristics
(Pinkowitz et al., 2003, 2007) such as creditor protection afforded by law (Guney et al,
2007). Chen and Chuang (2009) examine how corporate governance affects cash
reserves. Dittmar et al. (2003) analyzes cross-country differences relative to amount of
cash held by companies. Variation in cash holding is explained by such specific factors
as a level of corruption, country risk and a level of protection of shareholders’ rights.
Inflation represents one of other macroeconomic factors that are very important and
influence on companies’ cash holdings. Pinkowitz et al. (2003) analyses countries with
low growth, less well-developed financial markets and higher macroeconomic volatility.
They find that the level of cash reserves is related positively to the level of economic
development. The research confirms the theory of Keynes (1936 cited in Zhou, 2009)
that explains the reason of cash holding as a transaction demand. That means that
companies keep cash as the available at any time buffer in order to pay daily payments
and liabilities. It is easier than ask money from credit institutions, in particular, when
interest rate is high or the access to capital markets is confined.

5
Other research examines in depth the relationship between leverage and cash balances.
Guney (2007) finds that this relationship is not linear; firms hold more cash when
leverage is either very low or very high. The research provided results for the turning
point at which negative relationship between debt and cash holdings turns to positive.
The findings show ―the range of values of leverage from about 39% (for the UK) to
about 59% (for Japan). The values for France, The US and Germany are about 48%,
49% and 54%, respectively‖ (Guney 2007). The results also show that the relationship
become stronger ―with greater anti-director rights‖. Harford (2011) considers how the
average maturity of the firm’s debt affects its cash holdings, and these findings are re-
examined by Garcia-Teruel and Martinez-Solano (2008).
Firm size has also been identified as a determinant of cash holdings. Ferreira and Vilela
(2004) provide two explanations why large companies might hold excessive cash. The
first reason is that larger firms have higher number of shareholders that tend them to
managerial discretion. The second reason is that large companies keep large amount of
cash in order to prevent a takeover. Foley (2007) analyzed cash reserves accumulated
by large companies, and finds that tax laws encourage multinational firms to hold more
cash. Another finding is that companies that operate abroad have positive tendency
between cash holdings and income if they face difficulties to raise capital for foreign
operations abroad or capital investment opportunities abroad are bigger or more volatile
than domestic opportunities. These findings are examined critically by Duchin (2010)
and Irvine and Pontiff (2009). Bates (2009) confirms that the analysis of average cash
ratio during recent years shows the strong increase cash reserves as for small and
medium companies the same as for largest firms. He finds that cash reserves have
grown across the board, but that the extent of its growth is much more significant for
smaller and recently listed firms, for firms that do not pay dividends and that operate in
industries that experienced higher increases in idiosyncratic volatility.
To summarize, in this paper, we pose three central research questions about firms in
Central and Eastern Europe:
Do national-level institutional characteristics affect firm-level cash holdings
(Dittmar, et al, 2003; Pinkowitz et al., 2003, 2007; Chen and Chuang, 2009)?
6
Do the factors that determine cash holdings at publicly traded firms also affect
cash holdings at privately held firms—does listed status or size matter (Ferreira
and Vilela, 2004; Foley, 2007; Duchin, 2010; Irvine and Pontiff, 2009; Bates,
2009)?
What is the relationship between short-term debt and cash holding (Gurney,
2007)?
3 Data and Sample Selection
The primary accounting and financial data for the sample has been downloaded
from ORBIS database. ORBIS is a comprehensive pan-European database with
accounting and financial information from both public and private firms across Western,
Central and Eastern European Countries. One of the advantages of this database beside
the huge amount of information is to provide comparable and uniform format for the
balance sheets and financial statements allowing comparison among countries,
something that without this harmonization would not be possible due to the differences
in accounting procedures across countries. This study comprises an analysis of the
determinants of cash holdings using a sample of countries belonging to both Central and
Eastern Europe. The database provides initially twenty different countries and 18,685
firms (both private and public). However, for Belarus and Albania there is no
accounting and financial information available, which reduced the number of countries
to eighteen and the number of firms to 18,167. The eighteen countries by alphabetic
order are: Bosnia Herzegovina, Bulgaria, Croatia, Czech Republic, Estonia, Hungary,
Latvia, Lithuania, Macedonia, Montenegro Poland, Moldova, Romania, Russia, Serbia,
Slovakia, Slovenia and Ukraine. Online version of ORBIS allows only the data
collection for the last ten years. Therefore, if one additional year is added to a particular
firm the first year is dropped if the firm has more than 10 years of available data.
Therefore the time period of this study is from 2001 to 2010. Several additional criteria
have been used to obtain the final sample. Moving forward, firm year observations with
few available financial information (not allowing to construct the variables), firms in
which total assets it is not equal to current liabilities plus noncurrent liabilities plus
shareholder’s funds (difference permitted 10,000 USD) and firms where balance sheet
items present wrongly negative values has been excluded from the sample. The final
sample consists of 16,786 firms and 104,605 firm year observations.

7
Table 1 reports both the number of firms by country in the initial and final sample and
the number of firms public and private.
[PLEASE insert Table 1 here]
Russia is by far the country which provides more firms to the final sample used in this
study accounting with a total of 5,863 firms (34.9 percent of the whole sample) divided
between public and private firms, with 15.8 and 49.7 percent, respectively. Therefore,
later an additional analysis for Russia should be undertaken. Other important countries
are Poland and Serbia with a total together of around 20 percent of the number of firms
in the sample. Less important in our sample are countries such Croatia, Estonia, Latvia,
Lithuania, Macedonia, Montenegro and Slovenia which all together account just for
6.39 percent of the sample (1,072 firms). When dividing the sample in terciles, the top
and bottom six countries represent 77.2 and 4.51 percent of firms, respectively.
Therefore the sample is quite unbalanced in terms of the countries contribution. This is
not new and has been reported in several other studies that address cross country
analysis. As an example, in Mateus (2006) which investigate sixteen countries in
western Europe regarding taxes and corporate debt policy, the top 3 countries in the
sample and the last six accounts for the whole sample with 60 and 7 percent of the firms
respectively. In terms of private and public firms as reported in figure 1, private firms
are in a larger number (56 percent) but due to the poor quality of data provided and
collected from private firms, listed firms account for an unusual percentage of the final
sample. In terms of listed firms, Romania, Russia and Serbia represent precisely 50
percent of the sub sample for listed firms. Countries such Czech Republic, Estonia,
Hungary, Latvia, Lithuania and Slovakia are almost irrelevant in the final sample with
just 2.5 percent of the firms. In relation to the set of private firms the scenery do not
differ so much since Russia accounts for 49.7 percent of the sample and the eight
―smaller‖ countries only 2.6 percent.
[PLEASE insert Figure1 here]
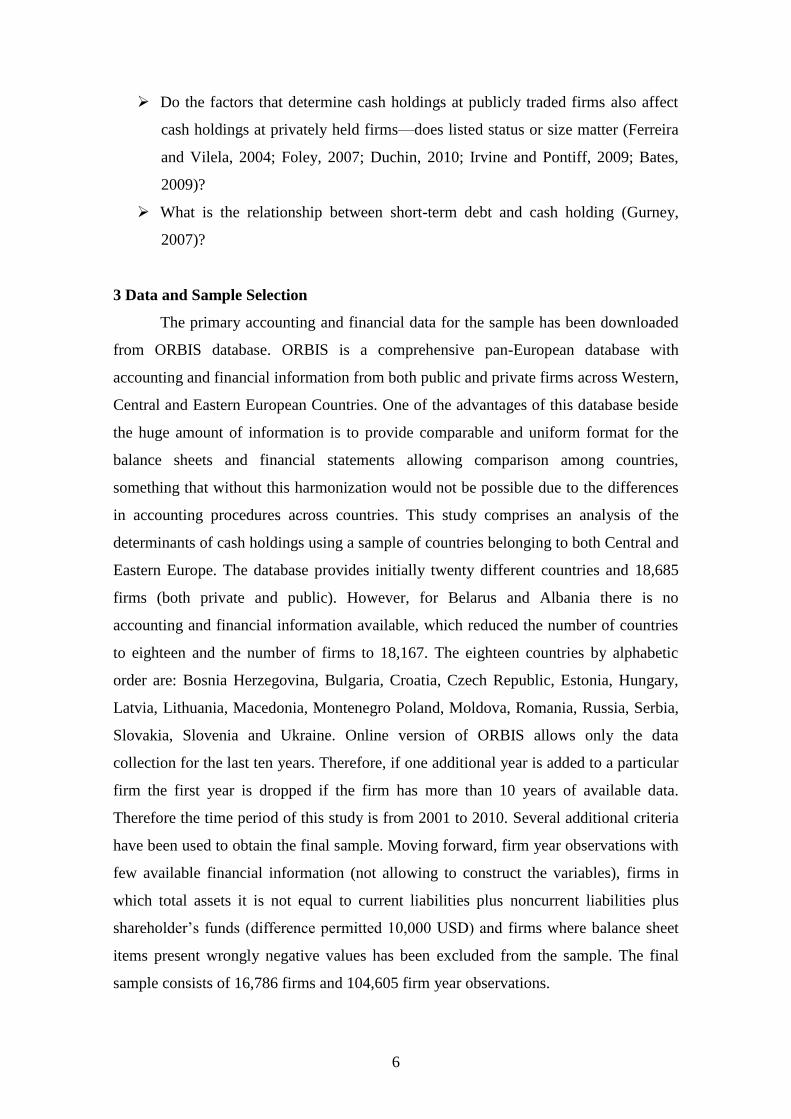
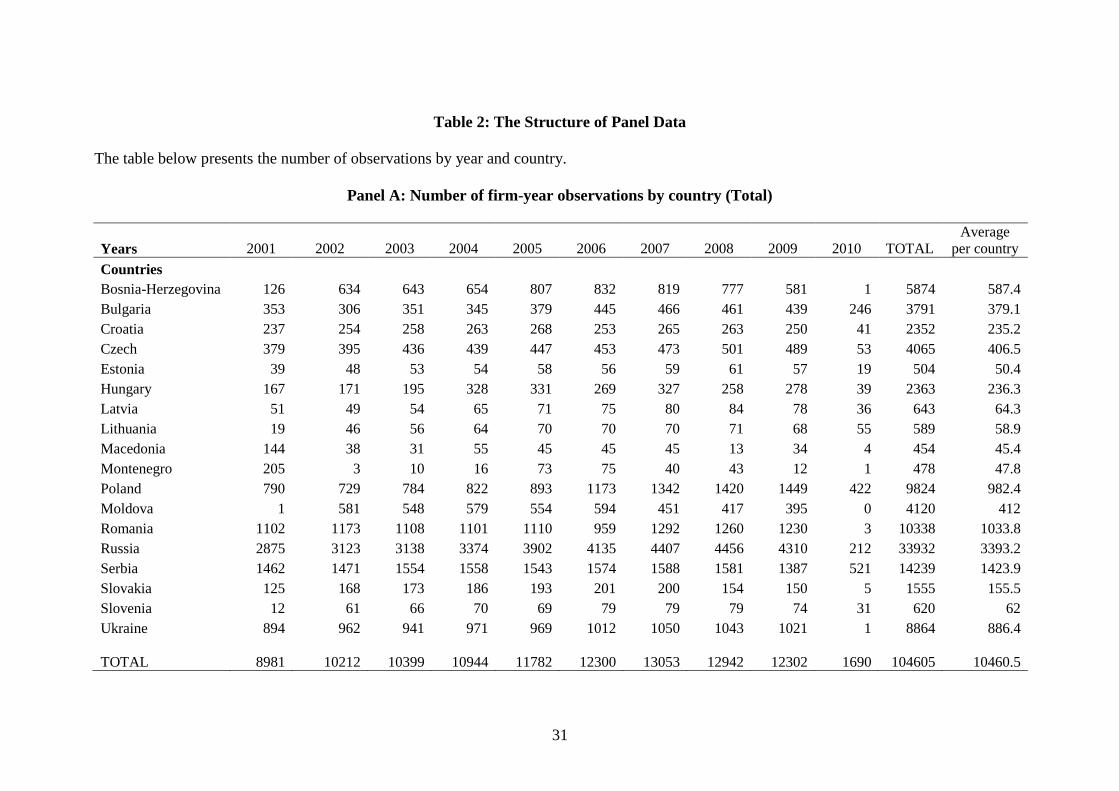
Table 2 reports the panel data structure for the final sample presenting the number of
firm-year observations by country and year.

8
[PLEASE insert Table 2 here]
Firms are allowed ―to leave and enter‖ the dataset over time. With this procedure the
survival bias is reduced and therefore the dataset is unbalanced in the sense that some
firms have more observations than others. On average the number of year observations
per firm in the sample is six years. Above the average there are eleven of eighteen
countries but since Russia is below the average with 5.8 years on average that drops the
overall average. The countries with more observations per firm are Serbia, Croatia and
Estonia with 8.8, 7.47 and 7.46 years respectively. Nevertheless besides Serbia the other
two countries are of less importance in terms of number of firms in the final sample. On
the other side are Macedonia and Montenegro with less than 3 years of data per firm, on
average. Important as well is the pattern of total number of firm observations per year.
In fact, starting in the year of 2002 and until 20071 the number of observations has been
increasing continuously at an average rate of 5 percent, from 10,212 to 13,053
observations. The years of 2008 and 2009 shows a slight drop to 12,942 and 12,302
observations respectively, maybe due to some extraordinary bankruptcies arise from the
financial crisis and/or the reluctance of some firms to provide information, since in the
case of private firms they make it available voluntarily. In terms of final number of firm
year observations, the top three countries (Russia, Serbia and Romania provide 58,509
observations, 56 percent of the total.
[PLEASE insert Table 3 here]
Another important and interesting information is the one shown in table 3 referring to
the number of firms divided in four different sectors: Manufacturing, Retail, Wholesale
and Services. Since the firms could operate in more than a level in the supply chain
Orbis database provides this interesting and helpful information and when the firm
operates in more than a level it is reported where the firm has it most important activity.
This information is relevant for the current research since firms located in Services and
Retails should get paid earlier, therefore less cash balances will be required. In our
sample for 558 firms this information is not available, mainly to Russia and Poland with
161 and 117 firms, respectively. The sector with more firms is Services which accounts
1 The years 2001 and 2010 are not consider since they are marginal years due the fact that if information
for year 2010 is added for a firm the year 2001 information is drop off.

9
43 percent being Retail the one with lowest number, 899 firms and 5 percent of the
whole sample. Russia is the country with more firms in all different sectors, Serbia is
the second country concentrated in manufacturing and retail and Poland in services and
wholesales. Figure 2, reports detailed percentages of the different sectors in the sample.
[PLEASE insert Figure 2 here]
Table 4 (panel A to C) reports the average common-size balance sheets scaled by total
assets for the year 2008 divided in all sample (12,942 firms, panel A), Listed firms
(6,161 firms, panel B) and Private firms (6,781 firms, panel C)2. Thirteen countries have
more than 70 percent of all firms reported in this year, with just two with less than 20
percent (Macedonia and Montenegro). Therefore, for these two countries the results
have to be analyzed carefully. For Panel A (all firms) one can highlight that the amount
of fixed assets as a percentage of total assets is between 59 percent (Bosnia Herzegovina)
and 82 percent (Montenegro). However the biggest countries (Russia, Serbia, Romania,
Poland and Ukraine) have percentages between 54.1 and 71.57 percent where Ukraine is
the smallest and Romania is the biggest from this range. In what regards to tangible
assets Romania, Serbia and Russia have values between 44.02 and 52.81 percent. Since
tangible assets can be and are often used as collateral the countries with higher
percentage of this assets can afford higher long term debt, therefore they can have a
longer debt maturity. The remaining assets such as stocks and debtors lie between 3 and
11 percent (stocks) and 5 and 20 percent (debtors). These variations are much greater
than the ones reported in Mateus [2006] mainly due to more heterogeneity of the
countries in this sample. More important is the cash and cash equivalents for this group
of countries. In fact besides Poland which account for 8.6 percent, for the other
countries the values are between 1.59 and 6.11 percent for Serbia and Check Republic,
respectively.
[PLEASE insert Table 4 Panel A here]
On the liability side of the balance sheet excluding four marginal countries the
shareholder’s funds account between 43.18 and 54.51 percent for Romania and Serbia,
2 We choose the year 2008 for being one with highest number of observations and more recent. In fact, 77
percent of the firms reported information in this year.

10
respectively. The amount of current liabilities ranges from 22-40 percent whereas
creditors a very important financing soured as reported in Mateus [2006] accounts on
average across countries by 9 percent substantially below of the value for south
European countries (between 16 and 24 percent).
[PLEASE insert Table 4 Panel B and C here]
Panels B and C on the same table 4 shown the average balance sheets for the year 2008
divided the firms into Public and Private. Some differences among these two groups of
firms can be highlighted. The amount of fixed assets as a percentage of total assets are
mixed between listed and private firms with 50 percent of countries with higher and 50
percent with lower value for private firms. In 10 of the 18 countries other assets such
stocks and debtors are higher to listed compared with private firms. More important the
cash holding is on general higher for listed firms in particularly to the country with
more firms and observations in the sample. In fact, for Russia cash reserves accounts is
double for listed in comparison with private firms. Listed firms seem to have more
equity in their capital structure. In Mateus (2006) a mixed result is reported and in
Berger and Udell (1998) for a US sample of SMEs the average small firm depend 49.6
percent on equity while in our sample only nine of eighteen countries the average equity
is above 45 percent. Therefore, as a first look private firms in Central and Eastern
Europe countries look more in debt than the US study but less than in Western Europe
as reported in Mateus (2006) where 12 up to 16 countries have a percentage of equity
below 40%. As an example, Russia and Romania averages are close to 40 percent where
for Serbia is 60 percent. For Listed firms the average value increases to Russia and
Romania, 57 and 54, respectively and drops to Serbia to 43 percent. For the other items
the results are mixed not offering any particular pattern among Public and Private firms.
This could be due to the different sectors in which the firms operates, the different
stages of development of the banking system, competition policy, security markets, etc
or even the differences between countries that are already part of the European union,
the one that want to join and others that do not have plans to do so, for instance as
Bosnia Herzegovina, Moldova, Russia, Serbia and Ukraine.
[PLEASE insert Table 5 here]

11
Table 5 reports for the period 2001-2010 both the average annual unemployment rate
percentage defined as the share of the labor force that is without work but available for;
seeking employment3
and transition indicators such as: Large and small scale
privatization, enterprise restructuring, price liberalization, trade & Forex system,
competition policy, banking reform & interest rate liberalization, securities markets &
non-bank financial institutions and overall infrastructure reform4. For countries such
Bosnia Herzegovina, Montenegro and in some stage Serbia the data regarding inflation
rate is not as good as expected. In fact, the number of years with available data are
reduced to one, three and six, respectively. In terms of transition indicators the source
does not provide figures for both Czech Republic and Macedonia. It can be observed
that such indicators does not move independently ones from others since all of them
represents the ability of the country to promote the transition to an open market-oriented
economy and to foster entrepreneurship. Therefore, an increase of that ability will affect
all the indicators, pushing all of them up (higher number refers to be more close to
achieve the propose aim). Therefore, as will be explained later the use of all indicators
is not appropriate in our analysis because they are highly correlated with each other that
create econometric problems in the regressions estimation. Countries such Hungary,
Estonia and Lithuania in comparison with Serbia, Moldova and Montenegro show to be
more closer to an open market oriented economy and the promotion of entrepreneurship.
4. Model, Variables Specification and Statistics Analysis
4.1 Model
The basic empirical model is a multiple variables regression model. As
discussed previously this research aims to investigate the factors that affect both cash
reserves at both micro and macroeconomic levels. From the rational point of view firms
tend to hold cash in order to decrease transaction costs and to create a liquidity shield.
In fact firms during the last years as reported in some studies (Opler et al. 1999)
increased significantly the proportion of cash holding relative to their assets, due
probably market imperfections and internal factors. According to previous literature
cash holding of firm i at time t it is given by:
3 Definitions of labor force and unemployment differ by country. Orgaization source: International
Labour Organization, Key Indicators of the Labour Market database. 4 The annual unemployment rates are obtained by the World Bank website and the transition indicators
from the European Bank from Reconstruction and Development, Transition Report 2010 ―Recovery and
Reform‖.

12
CASHit = +MICRO MICROi t + MACRO MACROi t + TRANSITION TRANSITIONi t +
IND INDt + COUNT COUNTt + IND YEARS t (1)
where, CASH is the observed level of cash holding for firm i at time y, is intercept
term, MICRO is a vector of firm’s characteristics which includes debt levels, debt
maturity, profitability, liquidity, firm independence, size and the disclosure of
unconsolidated or consolidated accounts, MACRO is a vector of macroeconomic factors
by year and country such as unemployment rate, TRANSITION is a variable that
aggregates countries according to their stage of development towards to open market
economy and entrepreneurship promotion (different criteria are used), IND is a binary
variable for the industry types (manufacturing, wholesale, retail and services), COUNT
is a binary variable representing the different countries in the sample and YEARS is a
binary variable to control the difference in years.
Equation (1) can be estimated as a ―linear model ―and the parameters, β are
estimated jointly.
4.2 Variables Specification and univariate statistics analysis
In this sub-section the dependent and explanatory variables and their statistical
analysis (mean, standard deviation, etc) are presented. The objective is to have a set of
explanatory variables that explain the determinants of cash holding for both firm-
specific and institutional/macroeconomic factors. The choice between holding more or
less cash will depend on the amount of short term debt hold by the firm, the maturity of
debt, the situation in terms of liquidity, profitability, size of the firm, etc and
macroeconomic/institutional factors such unemployment rate and transition indicators
and the specificity of each country, industry and year.
4.2.1 The measure of cash holding
The measure of firm’s cash reserves follows the approach used in previous
research as cash and cash equivalents over total assets.

13
[PLEASE insert Table 6 here]
Table 6 reports the mean, median and standard deviation of cash holdings per
country and divided in public and private firms.
On average for the whole sample the cash reserves represents 5.66 percent of total
assets. When divided among public and private firms there is a higher volume of cash
reserves for private compared with public firms, 6.74 and 4.56 percent, respectively.
Analyzing by country, Estonia, Czech Republic and Poland have averages above 9
percent. On the other side countries such as Bosnia Herzegovina, Macedonia,
Montenegro, Moldova and Serbia report averages below 3 percent. When the evaluation
is done public versus private firms per country the scenario does not change. In fact
with exception for Montenegro, Poland and Russia all the other countries present lower
average cash reserves for public in comparison to private firms. The analysis of the
median is quite interesting showing non normality of the sample. The total averages
drops significantly from an average of 5.66 percent to 1.50 percent. The same situation
happens for both public and private firms with 1.09 and 2.04 respectively. This is could
be due to the number of firm-year observations with a value of zero to cash reserves. In
terms of the standard deviation, private firms have a higher value compared with public
ones 12.48 and 9.65 percent, respectively, with the higher values for public firms to
Romania and Poland (above 11 percent) and in the case of private ones to Estonia and
Slovakia above 15 percent. This variation among countries and between types of firms
is very interesting under the point of view of finding evidence of the determinants of
cash reserves.
4.2.2 The Impact of short term debt
We claim that the relationship between leverage and cash holdings is not linear.
Previous research shown that there is no linear relationship (Guney 2007) supporting
that until a certain amount of leverage firms tend to reduce cash holdings but when this
amount increases substantially firm’s tend to begin to accumulate cash reserves to avoid
possible financial distress. In this paper the measure of leverage is given by short term
bank loans over total assets. The reason to measure as short term and not long or total
debt is quite intuitive. In fact short term debt is defined with maturity until one year and
in most of the cases is used as an open account that firms can roll over during the years.

14
In the case of ―bad times‖ financial institutions can claim its total payment at the
renewal which can affect the survival of the firm. Therefore we are of the opinion that
short term debt should capture better the non-linear relationship with cash reserves,
since long term debt is most of the time supplied with collateral (Bartholdy et al. 2010).
4.2.3 Maturity of debt
The maturity of debt should also influence cash balances. The use of short term debt
force firms to periodically renewal and negotiate the conditions of loans with the risk of
no refinancing (Guney et al (2007), Ferreira and Vilela 2004, Harford 2011). We
measure maturity as noncurrent liabilities over total liabilities and expect a negative
relationship with cash balances.
4.2.4 Profitability
The variable to capture the effect of profitability in cash reserves is defined as profit
(loss) before taxation over total assets (collected directly from ORBIS database). More
profitable firms are better rated and have more easily access to external finance and at
lower cost. Therefore, they tend to accumulate more cash to prevent against earnings
volatility or short of liquidity. Consequently a positive relationship between profitability
and cash reserves is expected.
4.2.5 The size effect
Firm size has been documented as a statistical significant variable to explain cash
reserves variations. Larger firms are more diversified, can by far get easily bank
financing and access to capital markets, can minimize the borrowing cost and less likely
to go bankrupt (Foley 2007, Ferreira and Vilela 2004, Opler 1999). For all of this it is
expected a negative relationship between firm size measured as natural logarithm of
total assets and cash balances.
4.2.6 Unconsolidated vs. consolidated accounts
The dataset provides information regarding if the accounts are in the unconsolidated or
consolidated format. We use unconsolidated accounts when available and consolidated
just in the other cases. Indeed with consolidated accounts it is not possible to categorize
precisely the country effect because those firms even if their headquarters are in a
specific country operate in a variety of countries. However, in terms of cash balances is

15
relevant to analyze both cases. As highlighted by Ferreira and Vilela (2004), Foley
(2007) and Opler (1999) that multinational firms tend to hold more cash due to tax
effects and if they difficulties to raise capital from foreign operations. We use a binary
variable quoted one if unconsolidated accounts and zero otherwise expecting a negative
correlation with cash balances.
4.2.7 Firm Independence
Orbis provides information regarding firm’s ownership structure though an indicator.
This indicator divides the firms in four different categories from A to D. Level A states
no shareholder with more than 25 percent direct or total ownership, level B no
shareholder recorded with more than 50 percent direct, indirect or total ownership, level
C no shareholder recorded with more than 50% direct, indirect or total ownership and
finally level D with one shareholder recorded with more than 50% direct ownership. We
use a binary variable equal to one if level D (less firm independence) and zero otherwise
expecting a positive relationship with cash reserves. In fact firms at level D should have
less agency problems due the lack of conflicts between managers and shareholders and
as suggested by Jensen (1986) management of companies create excessive reserves
from excessive cash in order to get more assets under control. However, shareholders
try to overcome that problem by demanding higher dividend payments and issue debt if
new projects come under analysis. In private held firms with less agency problems
should hold more cash in order to be more flexible and independent from external
credits and debt holders.
4.2.8 Transition Indicators
We aggregate the transition indicators such as: Large and small scale privatization,
enterprise restructuring, price liberalization, trade & Forex system, competition policy,
banking reform & interest rate liberalization, securities markets & non-bank financial
institutions and overall infrastructure reform in a country binary variable to establish the
effect on cash holdings due to how much close the country is of promoting the transition
to an open market-oriented economy and to foster entrepreneurship. Countries are
divided in two groups, quoting one if the country belongs to the 50 percent better
ranked and zero otherwise. Additionally, two binary variables were prepared: quoting
one if the country is part of the European Union and zero otherwise and quoting one if

16
the country is not part of the European Union and does not have plans to join and zero
otherwise. Finally, the countries are separated in quartiles with the first representing
countries that are closer to the open market oriented economy and to promote
entrepreneurship and the fourth the countries in the bottom of the scale. The expectation
in terms of relationship with cash holdings is mixed. For one side the pursue to open
market economy will enable firms to have an easier access to credit, with financial
institutions more developed which as a consequence less cash reserves to run the daily
activity of the firm. On the other hand, better institutions, and improved rule of law and
regulation will drive to a higher level of creditor protection which will increases the
likelihood of bankruptcy if a company has financial problems and therefore
shareholders might be oriented to choose a more conservative policy and increase cash
reserves in order to fill the commitments of the firm.
4.2.9 Liquidity
Firms have differences between collection and credit periods. In fact firms that have a
positive balance between debtors and creditors should have less cash in their balances.
These differences could be patterned across industry and within a supply chain, where
the linkage among firms helps the propagation of liquidity shocks from downstream to
upstream firms. An increase in the level of trade credit granted by wholesalers generates
a liquidity cascade throughout the chain (Guedes and Mateus 2008). It is expected a
negative relationship between liquidity and cash reserves. We measure liquidity as
Debtors minus creditors minus cash over total assets.
4.2.10 Probability of default
The main theories regarding capital structure suggests alternatives to measure firm’s
bankruptcy, the collateral value of assets, firm’s size, volatility of earnings and
bankruptcy probability. Of all these alternatives, the one we found to be more
appropriated to measure the impact in cash reserves are the probability of default. Two
different scenarios could come from our analysis. If firms are aware of increase in the
probability of the default they tend to protect themselves by holding more cash. If that
situation comes by ―surprise‖ as it was during the financial crisis that affected all firms
independently of their previous situation one can expect a negative relationship. Since
our sample covers as well the years 2007-2009 we expect a negative relationship

17
between increase of probability of default and cash balances. This should be the
immediate reaction when the probability of bankruptcy increases. In a second moment
firm will start to accumulate more cash. Since the probability of default measure is not
lagged we do expect a negative relationship between probability of default and cash
reserves. In this paper we use Altman’s Z-score as a measure for probability of default.
Altman’s Z-score is a very well known measure but subject to some criticism if used
indistinctly among countries, years and firms. In fact Altman’s coefficients were
calculated using US data and to listed firms and, later, with different coefficients to
private firms. To overcome the problem of having in our sample both listed and private
firms we use both equations. Additionally we use a binary variable equal to one if the
firm is in a distress zone and zero if it is in a gray or safe zone. Below the equations
used for the Altman’s Z-score calculations:
PUBLIC FIRMS
working Capital Retained EarningsZscore = 1.2 +1.4 +
Total Assets Total Assets
EBIT Market Value of Equity Sales3.3 +0.6 +0.999
Total Assets Total Liabilities Total Assets
and,
PUBLIC FIRMS
Current Assets - Current Liabilities Retained EarningsZscore = 0.717 +0.847 +
Total Assets Total Assets
EBIT Book Value of Equity Sales3.10 +0.420 +0.998
Total Assets Total Liabilities Total Assets
Therefore if the Z-score is below 1.81 and 1.23 for public and private firms respectively
the firm is considered to be in a distress zone and quoted as one, and zero otherwise (if
in gray or safe zone).
4.2.11 Unemployment rate
Unemployment rate will have an important role on the proportion of cash reserves held
in different countries. If firms have a ―captive‖ labor market it is difficult for people to
find jobs elsewhere and they will be more likely to suspend payroll. Thus, firms located
in countries with higher unemployment will be less likely to hold cash balances. As a

18
result cash demand will be higher for countries with lower (structural) unemployment
rates.
Table 7 (Panel A to C) reports summary statistics for the variables defined previously
and to be used in the regression analysis dividing in values to all sample, public and
private firms.
[PLEASE insert Table 7 here]
For the whole sample on average Short term debt accounts for 8.39 percent of total
assets, having on average public firms less short term debt than their private
counterparts, 5.95 and 10.77 percent, respectively. The maturity of debt is longer to
private firms and there are substantially more profitable. Finally, private firms are
shorter in liquidity which can explain both the higher maturity and more short term debt.
Many companies can issue long-term debt so that they do not have to refinance in what
to be considered as ―bad times‖ and this could be principally important for highly
levered firms.
[PLEASE insert Table 8 here]
Table 8 describes the variables used in this study and their expected relationship
with cash reserves.
[PLEASE insert Table 9 here]
Table 9 presents a correlation matrix for the key variables in the data: STDEBT,
MATURITY, ROA, SIZE, UNCONSOLIDATED, INDUSTRY, CONCENTRATION,
UNEMPLOYMENT, WCAPITAL AND DZSCORE.
Table 9 confirms that multicollinearity is not a problem for this sample of both Public
and Private Central and European firms. One can highlight the following correlation
among independent variables: i) larger firms are more profitable and less independent, ii)
as longer the maturity less short term debt in the capital structure of the firm, iii) higher

19
liquidity is positively correlated with short term debt, iv) the debt of firms that report
unconsolidated accounts has shorter maturity, and v) unemployment rate in the country
is negatively correlated with profitability. Additionally, to control if the number of firm-
year observations and cash reserves that equal to zero influence on the results obtained,
the model 1 for the full sample and for public and private firms was tested5. The results
did not suffer any significant change in terms of statistical significance and signal of the
coefficients. Overall the results seem to be robust.
5 2049 firm-year observations were dropped from the sample.

20
5. Results
5.1 Testing for the determinants of cash balances
In section 3 the basic test equation for multiple variable regression analysis is written as
follow:
CASHit = +MICRO MICROi t + MACRO MACROi t + TRANSITION TRANSITIONi t +
IND INDt + COUNT COUNTt + IND YEARS t (2)
This equation is estimated using a pooled sample across firms and time periods
from 2001 to 2010. The model is estimated in five different specifications for each
measure of transition indicators.
[PLEASE insert Table 10 Panel A here]
In table 10 (Panel A), the first group of regressions for the full sample, 104,605 firm-
year observations is presented. In each panel five different regressions are estimated
with the use of different set of variables. The first column named ―model 1‖ presents the
results for the variables reported in the previous section: Short term debt (STDEBT and
STDEBT^2), maturity, profitability (ROA), size, unconsolidated, industry concentration
(independence), transition indicators, unemployment, liquidity (WCAPITAL) and
Altman’s Z-score (DZSCORE). The variable TRANSITION 1A in panel A refers to the
approach discussed previously where the countries are divided into two groups, quoting
one if the country belongs to the 50 percent better ranked according to the transition
indicators from the European Bank from Reconstruction and Development and zero
otherwise. Due to missing information from some firms and years regarding accounting
figures to calculate Altman’s Z-score and also for countries and years in the case of the
variable UNEMPLOYMENT the number in the first model is reduced to 55,892
observations. Overall, the variables are statistical significant for one percent level (p-
value below 0.001) and with the predicted signs presented previously in table 8. The
variable STDEBT is U-shaped confirming that the relationship with cash reserves is
negative and statistically significant at the one percent level across all countries as well
as there is a positive and statistical significant at one percent level for all countries for
the ―estimated coefficient‖ of the quadratic leverage term. The minimum level of cash
reserves is estimated when short term debt is 28.58 percent of total assets. MATURITY

21
is negatively related with cash balances for a one percent significance level, showing
that longer debt maturity induce firms to hold less cash reserves. In terms of transition
indicators the results support the hypothesis that more developed countries, with better
institutions, improved rule of law and regulation and as a consequence enhanced
creditor’s protection, shareholders would be oriented to choose a more conservative
policy with inevitable increase of cash reserves. Firm’s with unconsolidated accounts
shows on average less cash reserves in comparison with the consolidated counterparts.
In fact as stated by Ferreira and Vilela (2004), Foley (2007) and Opler (1999)
multinational firms tend to hold more cash due to tax effects and if they have difficulties
to raise capital from foreign operations, which could be the case for this sample of firms
in Central and Eastern Europe. In terms of independence indicator, less independent
firms tend on average to have more cash reserves. Size as discussed in Foley (2007),
Ferreira and Vilela (2004) and Opler (1999) has negative relationship with cash reserves.
On average a one percent increase in size (measured by natural logarithm of total assets)
will have an impact of 0.51 percent reduction in cash reserves. Finally, manufacturing
firms are more likely to have larger cash balances than retail, wholesale and services
firms; an increase in liquidity have a negative impact in cash reserves, firm’s in
countries with higher unemployment rate have less cash reserves and an increase in the
probability of financial distress is associated with less cash reserves. Overall, the model
has adjusted R-squared of 0.3032 which is good fit for a panel data analysis.
Column 2 in table 10 panel A (model 2), reports the results but when the variable
Altman’s Z-score is dropped from the analysis. The reason is to include more firm-year
observations in the analysis and therefore to control if the results will change due to that
fact. The number of firm-year observations increased substantially but the statistical
significance and the sign of the coefficients did not changed. The adjusted R-squared
marginally declines to 0.2941 but showing the relevance of the Altman’s Z-score as a
good predictor of cash reserves. Model 3 (third column) adjust the number of variables,
eliminating now the variable unemployment. The reason is the same as the one
presented previously and with that procedure the number of firm-year observations
increased again with no significant change in the significance and sign for independent
variables coefficients. Finally, for the last two columns country and year binary
variables are included excluding the variable TRANSITION due multicollinearity

22
problems. 6 Once again the results have not changed in terms of significance and the
variables relationship with cash reserves.
[PLEASE insert Table 10 Panel B and C here]
Panels B and C of table 10 shows the same five models presented previously but for the
case where the ―transition indicators‖ are defined in a different way. In panel B two
binary variables are built TRANSITION 1B for countries that are part of European Union
such as: Bulgaria, Czech Republic, Estonia, Hungary, Latvia, Lithuania, Poland,
Romania, Slovakia and Slovenia and TRANSITION 2B for countries that are not part
and do not plan to be such as: Bosnia Herzegovina, Moldova, Russia, Serbia and
Ukraine. The results and statistical significance do not differ when this approach for
country divisions is used. As for the previous panel the other variables do not change in
terms of significance and relation with cash reserves. Finally, for panel C the approach
is to divide the countries by quartiles. The first quartile is defined as the group of
countries in the top of the hierarchy of development according transition indicators from
the European Bank from Reconstruction and Development. The fourth quartile shows
the countries in the bottom of the scale. The countries are Estonia, Hungary, Poland,
Slovakia and Bosnia Herzegovina, Macedonia and Serbia for the first and fourth
quartile, respectively. More important in all the analysis is that nevertheless the model
used or the approach in terms of dividing the countries in more or less close of
promoting the transition to an open market-oriented economy and to foster
entrepreneurship, the variables are all significant and with the expected relation with
cash reserves. However, one of the approaches have to be chosen in terms how to divide
the countries, the separation among countries that belong to European union and the
ones that does not, shows the better fit in terms of R-squared.
[PLEASE insert Table 11 Panel A to C here]
Table 11 and 12 (panels A to C) present the same methodology used in table 10 (again
five models) but dividing in private (table 11) and public firms (table 12).
6 For the countries Russia is the basis case and for the year 2008.

23
[PLEASE insert Table 12 Panel A to C here]
The first result to be presented is the significance and expected signs of the coefficients
in the different approaches to categorize the countries and for the different models
presented. However, the fit of the models are better for private than public firms, even
though the number of observations in both sub-samples is very similar, 52,821 and
51,784 for private and public firms, respectively. In terms of the independent variables,
the results show a higher effect of the increase of maturity on cash reserves decline for
public firms, a very similar impact of profitability and a more evident cause of increase
in size and decrease in cash reserves for private firms. This could be due the fact that
size is not so important for public firms since they have access to alternative source of
financing just by the simple fact of being listed. In the case of private firms, the ―too big
to fall’ might apply more significantly, and in that sense as they become bigger the
concerns about financial distress and bankruptcy are less. Additionally, less independent
firms at public level have a higher impact in cash reserves. As a summary, the results
overall shows the significance of the variables analyzed in the multiple regressions
undertaken.
5.2 The Short term debt turning point
The U-shaped pattern verified in short term debt in relation to cash reserves should be
analyzed in more detail.
[PLEASE insert Table 13 here]
According to Guney (2007) the results for the ―turning point‖ in debt are between 39
and 54 percent when analyzed countries such UK, Japan, France USA and Germany.
However, an interesting analysis will be to control the existence of differences in the
―turning point‖ among public and private firms in Central and Eastern Europe. Results
are presented in Table 13 for the ―turning point‖ for the whole 45 regressions from
tables 10 to 12. Overall it is shown that independently of the model and the approach
used to divide countries in the ones more close to promoting the transition to an open
market-oriented economy and to foster entrepreneurship for others more far of that
objective. Private firms across the different countries and for the time period 2001-2010
decrease their cash reserves until a level of short term debt that is much higher than for

24
public firms. Across the sample, private firms start to accumulate cash reserves for a
level of short term debt over total assets that are on average 65 percent higher than the
one for the public firms. In summary, public firms start to accumulate cash reserves for
a level of short term debt that is much smaller than their private counterpart.

25
6. Conclusions
This paper has investigated the factors that influence cash balances for a sample of firms
during the period 2001- 2010 using a rich data set of Central and Eastern European
firms that includes over 104,605 firm-year observations. The paper set out to address
three research questions: Does the level of financial institution development and
macroeconomic factors play an important role in determining cash balances? Second, do
the same factors determining cash balances for large listed firms also apply to small-
medium sized firms? Third, how do debt levels affect on cash balances?
The empirical results support three main findings. First, firms in countries that are more
market-oriented and that foster entrepreneurship have larger cash reserves, despite a
presumably stronger precautionary motive for cash holdings in countries with less
market orientation. Second, the same determinants of cash balances for public firms
apply for private firms. Third, private firms start to accumulate cash reserves for a level
of short term debt over total assets that are on average 65 percent higher than the one for
public firms.
Further research could extend the analysis to Western European countries and to
analyze the short term debt turning point across industries, differentiating for example
manufacturing, wholesale, retail or services companies.

26
References
1. ACHARYA V.V. ET AL. (2007) ―Is cash negative debt? A hedging perspective
on corporate financial policies‖ The Journal of Financial Intermediation, Volume 16,
Issue 4, October PP. 515-554 [Online] Available from :
http://www.sciencedirect.com/science/article/pii/S1042957307000186, [Accessed: 2
July 2011].
2. BARTHOLDY J. ET AL. (2010) ―Financing of SMEs: Do they match their
assets with liabilities‖ Working paper [Online] Available from:
http://www.rcfea.org/papers_sme/paper_Bartholdy_Mateus_Olson.pdf, [Accessed: 5
July 2011].
3. BATES T.W. ET AL. (2009) ―Why Do U.S. Firms Hold So Much More Cash
than They Used To?‖ The Journal of Finance VOL. LXIV, NO. 5 October [Online]
Available from: http://www.cob.ohio-
state.edu/fin/faculty/stulz/publishedpapers/jofi_1492.pdf, [Accessed: 29 March 2011]
4. BERGER A. AND UDELL G. (1998) ―The economics of small business finance:
the roles of private equity and debt markets in the financial growth cycle‖ The Journal
of Banking and Finance, Volume 22 (6/8), PP. 613-673 [Online] Available from:
http://www.sciencedirect.com/science/article/pii/S0378426698000387, [Accessed: 29
March 2011].
5. BERGER A. AND UDELL G. (2005) ―Small Business and Debt Finance‖
Handbook of Entrepreneurship Research International Handbook Series on
Entrepreneurship, Volume 1, Part 5, 299-328 [Online] Available from:
http://www.springerlink.com/content/n147624212w8156v/, [Accessed: 29 March 2011].
6. BOOT A. (2000) ―Relationship banking: What do we know?‖ The Journal of
Financial Intermediation, Volume 9, Issue 1, January, PP. 7-25 [Online] Available
from:
http://www1.fee.uva.nl/fm/PAPERS/Awaboot/english/Relationship_banking_know_JFI
.pdf, [Accessed: 28 March 2011].
7. BRUNNERMEIER M.K. AND YOGO M. (2009) ―A Note on Liquidity Risk
Management‖ American Economic Review, American Economic Association Volume
99, Issue 2, May, PP. 578-583 [Online] Available from:
https://hq.ssrn.com/login/pubSignInJoin.cfm?nber_id=w14727, [Accessed: 15 July
2011].
8. CHEN Y. AND CHUANG W. (2009) ―Alignment or entrenchment? Corporate
governance and cash holdings in growing firms‖ Journal of Business Research
Volume 62, Issue 11, November 2009, pp. 1200-1206 [Online] Available from:
http://www.sciencedirect.com/science?_ob=MImg&_imagekey=B6V7S-4T1SFM4-2-
1&_cdi=5850&_user=634187&_pii=S0148296308001392&_origin=gateway&_coverD

27
ate=11%2F30%2F2009&_sk=999379988&view=c&wchp=dGLbVlW-
zSkzS&md5=353d090b958bff8e21ff6de21c443df2&ie=/sdarticle.pdf, [Accessed: 29
March 2011].
9. DITTMAR A. ET AL. (2003) ―International Corporate Governance and
Corporate Cash Holdings‖ The Journal of Financial and Quantitative Analysis, Volume
38, Number 1, March PP. 111-133 [Online] Available from:
http://webuser.bus.umich.edu/adittmar/Research/JFQA-2003.pdf, [Accessed: 3 July
2011].
10. DUCHIN R. (2010) ―Cash Holdings and Corporate Diversification‖ The Journal
of Finance, Volume 65, Issue 3, June PP. 955-992 [Online] Available from:
http://www.afajof.org/afa/forthcoming/5254.pdf, [Accessed: 30 July 2011].
11. FAULKENDER M. W. (2002) ―Cash Holdings Among Small Businesses‖
SSRN Working paper, March [Online] Available from:
http://papers.ssrn.com/sol3/papers.cfm?abstract_id=305179, [Accessed: 25 July 2011].
12. FERREIRA M.A.AND VILELA A.S. (2004) ―Why Do Firms Hold Cash?
Evidence from EMU Countries‖ European Financial Management, Vol. 10, No. 2, 295–
319 [Online] Available from: http://onlinelibrary.wiley.com/doi/10.1111/j.1354-
7798.2004.00251.x/pdf, [Accessed: 29 March 2011].
13. FOLEY C.F. ET AL. (2007) ―Why do firms hold so much cash? A tax-based
explanation‖ The Journal of Financial Economics, Volume 87, Issue 3, December, PP.
579-607 [Online] Available from: http://www.people.hbs.edu/ffoley/Cash.pdf,
[Accessed: 20 July 2011].
14. GARCIA-TERUEL P.J. AND MARTINEZ-SOLANO P. (2008) ―On the
Determinants of SME Cash Holdings: Evidence from Spain‖ Journal of Business
Finance & Accounting, 2008-01, vol. 35, issue 1-2, pp. 127-149 [Online] Available
from: http://onlinelibrary.wiley.com/doi/10.1111/j.1468-5957.2007.02022.x/pdf,
[Accessed: 29 March 2011].
15. GUEDES J.C. AND MATEUS C. (2008) ―Trade Credit Linkages along a
Supply Chain: Evidence for the Italian textile sector‖ SSRN Working paper [Online]
Available from: http://papers.ssrn.com/sol3/papers.cfm?abstract_id=1308189,
[Accessed: 1 July 2011].
16. GUNEY ET AL. (2007) ―International Evidence on the Non-
Linear Impact of Leverage on Corporate Cash Holdings‖ Journal of Multinational
Financial Management Vol. 17 No. 1 [Online] Available from:
http://papers.ssrn.com/sol3/papers.cfm?abstract_id=1517110, [Accessed: 29 March
2011].
17. HAN S. AND QIU J. (2007) ―Corporate precautionary cash holdings‖ The
Journal of Corporate Finance, Volume 13, Issue 1, March PP.43-57 [Online] Available

28
from: http://www.sciencedirect.com/science/article/pii/S0929119906000253, [Accessed:
30 July 2011].
18. HARFORD J. ET AL. (2011) ―Refinancing Risk and Cash Holdings‖ SSRN
Working paper, August [Online ] Available from:
http://papers.ssrn.com/sol3/papers.cfm?abstract_id=1810199&download=yes,
[Accessed: 21 July 2011].
19. IRVINE P.J. AND PONTIFF J. (2009) ―Idiosyncratic Return Volatility, Cash
Flows, and Product Market Competition‖ The Review of Financial Studies Volume 22,
Issue 3, PP. 1149-1177 [Online] Available from:
https://www2.bc.edu/~pontiff/Documents/12_idio-rfs.pdf, [Accessed: 2 July 2011].
20. JENSEN M. C. (1986) ―Agency costs of free cash flow, corporate financing and
takeovers‖ The American Economic Review, Volume 76, Number 2, PP. 323-329
[Online] Available from: http://www.sml.hw.ac.uk/ms75/GP%20Papers/G32.pdf,
[Accessed: 2 July 2011].
21. LINS K.V. ET AL. (2010) ―What Drives Corporate Liquidity? An International
Survey of Cash Holdings and Lines of Credit‖ The Journal of Financial Economics,
Volume 98, Issue 1, October, PP. 160-176 [Online] Available from:
http://www.sciencedirect.com/science/article/pii/S0304405X10001078, [Accessed: 21
July 2011].
22. MATEUS C. (2006) ―Taxes and Corporate Debt Policy : Evidence for unlisted
firms of sixteen European Countries‖ Working paper [Online] Available from:
http://www.efmaefm.org/efma2006/papers/650123_full.pdf, [Accessed: 2 July 2011].
23. MYERS S.C AND MAJLUF N.S. (1984) ―Corporate financing and investment
decisions when firms have information that investors do not have‖ The Journal of
Financial Economics, Volume 13, Issue 2, June, PP. 187-221 [Online] Available from:
http://www.sciencedirect.com/science/article/pii/0304405X84900230, [Accessed: 30
July 2011].
24. OPLER T. ET AL. (1999) ―The determinants and implications of corporate cash
holding‖ Journal of Financial Economics 52 3-46 [Online] Available from:
http://www.cob.ohio-
state.edu/fin/faculty/stulz/publishedpapers/Determinants_cash%20holdings.pdf,
[Accessed: 29 March 2011].
25. PINKOWITZ L. ET AL. (2003) ―Do firms in countries with poor protection of
investor rights hold more cash?‖ Dice Center Working Paper № 2003-29 November
[Online] Available from: http://papers.ssrn.com/sol3/papers.cfm?abstract_id=476442,
[Accessed: 29 March 2011].
26. PINKOWITZ L. ET AL. (2007) ―Cash Holdings, Dividend Policy, and
Corporate Governance: A Cross-Country Analysis‖ Journal of Applied Corporate

29
Finance, Vol. 19, Issue 1, pp. 81-87 [Online] Available from:
http://papers.ssrn.com/sol3/papers.cfm?abstract_id=1090700, [Accessed: 29 March
2011].
27. RAMIRES A. AND TADESSE S. (2009) ―Corporate cash holdings, uncertainty
avoidance, and the multinationality of firms‖ International Business Review Volume 18,
Issue 4, August pp.387-403 [Online] Available
from: http://www.sciencedirect.com/science?_ob=MImg&_imagekey=B6VGK-
4W232BR-1-
1&_cdi=6041&_user=634187&_pii=S0969593109000328&_origin=gateway&_coverD
ate=08%2F31%2F2009&_sk=999819995&view=c&wchp=dGLzVlb-
zSkWb&md5=aa5fa605525515ad3e64073bd9ab068d&ie=/sdarticle.pdf, [Accessed: 29
March 2011].
28. SUFI A. (2009) ―Bank Lines of Credit in Corporate Finance: An Empirical
Analysis‖ The Review of Financial Studies, Volume 22, Issue 3, PP. 1057-1088 [Online]
Available from: http://fdic.gov/bank/analytical/cfr/2005/sept/workshop_Asufi.pdf,
[Accessed: 30 July 2011].
29. ZHOU J. (2009) ―Increase in Cash Holdings: Pervasive or Sector-Specific?‖
University of Toronto [Online] Available from:
http://69.175.2.130/~finman/Reno/Papers/increaseincashholdings_Jan152009_fma09.pd
f, [Accessed: 29 March 2011].

30
Appendices
Table 1: Number of Firms by country
Countries Full Sample Listed No-Listed
Initial Final Initial Final Initial Final
Albania 5 0 0 0 5 0
Belarus 513 0 0 0 513 0
Bosnia Herzegovina 893 889 884 881 9 8
Bulgaria 598 535 384 371 214 164
Croatia 318 315 194 194 124 121
Czech Republic 867 715 19 17 848 698
Estonia 66 66 15 15 51 51
Hungary 571 517 39 32 532 485
Latvia 106 105 35 35 71 70
Lithuania 110 79 35 33 75 46
Macedonia 242 206 192 187 50 19
Montenegro 214 212 211 209 3 3
Poland 1969 1866 578 550 1391 1316
Moldova 649 647 643 641 6 6
Romania 1405 1405 1001 1001 404 404
Russian Federation 5934 5863 1179 1157 4755 4706
Serbia 1624 1624 1503 1503 121 121
Slovakia 466 341 152 135 314 206
Slovenia 116 89 68 50 48 39
Ukraine 2019 1312 324 311 1695 1001
TOTAL 18685 16786 7456 7322 11229 9464
31
Table 2: The Structure of Panel Data
The table below presents the number of observations by year and country.
Panel A: Number of firm-year observations by country (Total)
Years 2001 2002 2003 2004 2005 2006 2007 2008 2009 2010 TOTAL
Average
per country
Countries
Bosnia-Herzegovina 126 634 643 654 807 832 819 777 581 1 5874 587.4
Bulgaria 353 306 351 345 379 445 466 461 439 246 3791 379.1
Croatia 237 254 258 263 268 253 265 263 250 41 2352 235.2
Czech 379 395 436 439 447 453 473 501 489 53 4065 406.5
Estonia 39 48 53 54 58 56 59 61 57 19 504 50.4
Hungary 167 171 195 328 331 269 327 258 278 39 2363 236.3
Latvia 51 49 54 65 71 75 80 84 78 36 643 64.3
Lithuania 19 46 56 64 70 70 70 71 68 55 589 58.9
Macedonia 144 38 31 55 45 45 45 13 34 4 454 45.4
Montenegro 205 3 10 16 73 75 40 43 12 1 478 47.8
Poland 790 729 784 822 893 1173 1342 1420 1449 422 9824 982.4
Moldova 1 581 548 579 554 594 451 417 395 0 4120 412
Romania 1102 1173 1108 1101 1110 959 1292 1260 1230 3 10338 1033.8
Russia 2875 3123 3138 3374 3902 4135 4407 4456 4310 212 33932 3393.2
Serbia 1462 1471 1554 1558 1543 1574 1588 1581 1387 521 14239 1423.9
Slovakia 125 168 173 186 193 201 200 154 150 5 1555 155.5
Slovenia 12 61 66 70 69 79 79 79 74 31 620 62
Ukraine 894 962 941 971 969 1012 1050 1043 1021 1 8864 886.4
TOTAL 8981 10212 10399 10944 11782 12300 13053 12942 12302 1690 104605 10460.5

32
Panel B: Number of firm-year observations by country (Public firms)
Years 2001 2002 2003 2004 2005 2006 2007 2008 2009 2010 TOTAL
Average per
country
Countries
Bosnia-Herzegovina 125 630 639 649 802 825 812 769 574 1 5826 582.6
Bulgaria 249 227 251 233 266 314 332 332 313 243 2760 276
Croatia 144 153 153 157 160 150 158 162 153 33 1423 142.3
Czech 14 9 10 10 10 10 8 9 9 4 93 9.3
Estonia 5 8 9 9 12 12 13 14 15 15 112 11.2
Hungary 16 14 17 24 25 23 26 27 25 10 207 20.7
Latvia 22 16 18 25 30 28 30 31 31 29 260 26
Lithuania 4 15 22 26 30 30 29 30 30 31 247 24.7
Macedonia 127 38 31 54 42 42 43 13 33 4 427 42.7
Montenegro 202 3 9 15 72 74 39 43 12 1 470 47
Poland 111 97 126 138 157 236 327 408 473 370 2443 244.3
Moldova 0 577 545 576 553 593 447 413 394 0 4098 409.8
Romania 894 916 885 880 885 687 946 931 897 3 7924 792.4
Russia 816 842 765 828 916 1025 1094 1090 1092 204 8672 867.2
Serbia 1401 1411 1473 1465 1445 1471 1483 1476 1286 429 13340 1334
Slovakia 68 92 83 87 82 91 88 62 65 5 723 72.3
Slovenia 8 34 37 38 40 45 45 45 43 18 353 35.3
Ukraine 232 236 239 250 261 280 300 306 301 1 2406 240.6
TOTAL 4438 5318 5312 5464 5788 5936 6220 6161 5746 1401 51784 5178.4

33
Panel C: Number of firm-year observations by country (Private firms)
Years 2001 2002 2003 2004 2005 2006 2007 2008 2009 2010 TOTAL
Average per
country
Countries
Bosnia-Herzegovina 1 4 4 5 5 7 7 8 7 0 48 4.8
Bulgaria 104 79 100 112 113 131 134 129 126 3 1031 103.1
Croatia 93 101 105 106 108 103 107 101 97 8 929 92.9
Czech 365 386 426 429 437 443 465 492 480 49 3972 397.2
Estonia 34 40 44 45 46 44 46 47 42 4 392 39.2
Hungary 151 157 178 304 306 246 301 231 253 29 2156 215.6
Latvia 29 33 36 40 41 47 50 53 47 7 383 38.3
Lithuania 15 31 34 38 40 40 41 41 38 24 342 34.2
Macedonia 17 0 0 1 3 3 2 0 1 0 27 2.7
Montenegro 3 0 1 1 1 1 1 0 0 0 8 0.8
Poland 679 632 658 684 736 937 1015 1012 976 52 7381 738.1
Moldova 1 4 3 3 1 1 4 4 1 0 22 2.2
Romania 208 257 223 221 225 272 346 329 333 0 2414 241.4
Russia 2059 2281 2373 2546 2986 3110 3313 3366 3218 8 25260 2526
Serbia 61 60 81 93 98 103 105 105 101 92 899 89.9
Slovakia 57 76 90 99 111 110 112 92 85 0 832 83.2
Slovenia 4 27 29 32 29 34 34 34 31 13 267 26.7
Ukraine 662 726 702 721 708 732 750 737 720 0 6458 645.8
TOTAL 4543 4894 5087 5480 5994 6364 6833 6781 6556 289 52821 5282.1

34
Table 3: Number of Firms by country/sector Sector Manufacturing Services Retail Wholesales N/A TOTAL
Countries
Bosnia Herzegovina 369 380 66 49 25 889
Bulgaria 192 295 16 28 4 535
Croatia 109 153 18 32 3 315
Czech Republic 257 282 51 113 12 715
Estonia 12 42 6 5 1 66
Hungary 158 245 30 72 12 517
Latvia 33 50 6 13 3 105
Lithuania 30 28 5 15 1 79
Macedonia 116 59 8 15 8 206
Montenegro 67 97 15 25 8 212
Poland 605 820 78 246 117 1866
Moldova 265 261 65 43 13 647
Romania 566 594 66 112 67 1405
Russian Federation 1825 2511 280 1086 161 5863
Serbia 658 648 103 129 86 1624
Slovakia 165 121 18 25 12 341
Slovenia 42 37 5 5 0 89
Ukraine 536 519 63 169 25 1312
TOTAL 6005 7142 899 2182 558 16786

35
Table 4: Average Balance Sheets Item as a Fraction of Total Assets
Panel A: Total Firms Year 2008 (12,942firms)
Countries
Number of Firms 777 461 263 501 61 258 84 71 13 43 1420 417 1260 4456 1581 154 79 1043
Assets
Fixed Assets 58.96% 68.04% 73.03% 62.27% 64.31% 64.72% 72.50% 67.76% 57.96% 81.99% 63.89% 62.81% 71.57% 60.93% 71.40% 72.60% 73.03% 54.10%
Intangible assets
18.60% 3.80% 4.72% 1.67% 2.32% 10.67% 1.31% 2.58% 0.75% 1.68% 3.09% 41.79% 15.42% 1.62% 2.63% 0.90% 5.26% 1.53%
Tangible Assets
33.87% 47.59% 59.27% 50.72% 43.18% 40.27% 49.80% 49.51% 54.78% 78.01% 49.00% 4.57% 51.08% 44.02% 52.81% 67.09% 53.24% 39.63%
Other Fixed
Assets 6.50% 16.65% 9.03% 9.89% 20.21% 13.89% 21.39% 15.68% 7.01% 2.30% 12.07% 16.45% 5.07% 15.00% 15.96% 4.62% 14.54% 12.57%
Current Assets
40.96% 31.96% 26.97% 37.73% 35.69% 33.77% 27.50% 32.24% 42.04% 18.01% 36.08% 37.19% 28.43% 39.07% 28.60% 27.40% 26.97% 45.89%
Stocks
3.28% 8.50% 6.16% 6.94% 4.80% 8.70% 7.24% 7.70% 15.96% 3.15% 9.37% 11.61% 8.10% 7.93% 8.17% 6.38% 7.66% 9.94%
Debtors
5.34% 15.93% 11.50% 11.53% 12.53% 6.56% 5.55% 6.06% 16.46% 11.53% 13.78% 19.52% 13.79% 9.12% 12.17% 9.21% 11.74% 14.60%
Other Current
Assets
32.41% 7.52% 9.27% 19.27% 18.36% 18.52% 14.70% 10.39% 9.31% 3.33% 13.02% 6.06% 6.54% 20.97% 8.26% 11.81% 7.56% 21.35%
Cash and Cash
Equivalents 2.03% 4.91% 3.48% 6.11% 5.22% 3.92% 5.17% 2.15% 6.31% 2.66% 8.61% 1.45% 5.19% 5.58% 1.59% 5.35% 2.92% 4.00%

36
Shareholders’
Funds and
Liabilities
Shareholders’
Funds 51.33% 53.07% 49.75% 51.01% 42.82% 36.37% 41.91% 49.76% 57.74% 78.55% 47.30% 63.33% 43.18% 48.22% 54.51% 52.86% 32.19% 41.16%
Capital
36.95% 19.80% 38.65% 25.96% 16.66% 13.17% 17.33% 21.38% 42.62% 1.37% 23.16% 22.11% 14.99% 11.36% 49.26% 35.16% 7.76% 14.18%
Other
Shareholder’s
Funds
14.38% 33.27% 11.10% 25.05% 26.16% 22.13% 23.96% 28.38% 15.12% 8.64% 24.15% 41.22% 28.20% 36.86% 5.49% 17.26% 24.43% 27.16%
Liabilities
48.67% 46.93% 50.25% 48.99% 57.18% 63.63% 58.09% 50.24% 42.26% 21.45% 52.70% 36.67% 56.82% 51.78% 45.49% 47.14% 67.81% 58.84%
Non Current
Liabilities 8.64% 22.43% 23.27% 16.67% 26.47% 29.44% 35.60% 15.16% 12.37% 8.91% 21.59% 8.75% 32.53% 20.94% 16.83% 21.53% 35.35% 18.29%
Long Term
Debt
4.82% 20.66% 21.32% 8.85% 16.62% 49.24% 21.99% 10.38% 11.50% 6.30% 8.75% 6.33% NA 13.93% 11.62% 4.32% 21.93% 9.51%
Other Non
Current
Liabilities
3.82% 1.82% 1.95% 7.82% 9.85% 30.65% 14.92% 6.61% 1.88% 2.61% 13.79% 2.43% NA 7.01% 5.20% 17.21% 14.34% 8.38%
Provisions
2.05% 0.00% 1.20% 1.86% 0.04% 11.38% 2.69% 0.07% 0.80% 0.00% 6.01% 0.00% NA 1.93% 0.67% 65.45% 4.98% 2.40%
Current
Liabilities 40.03% 24.50% 26.98% 32.32% 30.71% 34.18% 22.49% 35.08% 29.89% 12.54% 31.11% 27.92% 24.29% 30.84% 28.66% 25.62% 32.46% 40.56%
Loans
3.08% 6.26% 3.66% 4.08% 15.91% 6.88% 3.92% 3.09% 7.20% 7.06% 3.97% 3.10% NA 7.59% 8.60% 5.42% 8.31% 9.31%
Creditors
5.93% 8.61% 8.84% 10.81% 5.20% 6.32% 5.77% 8.01% 8.68% 1.89% 10.66% 14.22% NA 9.29% 13.05% 9.88% 11.37% 15.69%
Other
Current
Liabilities 31.02% 9.63% 14.48% 17.43% 10.12% 18.36% 12.80% 6.87% 15.11% 3.58% 16.59% 10.60% NA 13.07% 7.01% 10.35% 12.78% 15.55%

37
Table 4: Average Balance Sheets Item as a Fraction of Total Assets
Panel B: LISTED Firms Year 2008 (6,161 firms)
Countries
Number of Firms 769 332 162 9 14 27 31 30 13 43 408 413 931 1090 1476 62 45 306
Assets
Fixed Assets 68.14% 66.71% 63.41% 74.62% 75.27% 68.91% 73.52% 74.75% 57.96% 81.99% 66.15% 55.55% 68.51% 69.06% 55.23% 62.38% 71.90% 50.53%
Intangible assets
3.35% 1.42% 2.72% 6.23% 6.92% 10.65% 2.35% 3.02% 0.75% 1.68% 6.81% 28.92% 2.17% 2.84% 1.17% 3.23% 7.09% 0.29%
Tangible Assets
59.58% 41.59% 52.84% 61.48% 70.05% 48.65% 55.93% 65.72% 54.78% 78.01% 49.83% 4.32% 54.73% 54.16% 46.62% 54.01% 46.24% 41.56%
Other Fixed
Assets 5.21% 23.70% 7.86% 6.92% 4.42% 9.61% 15.24% 6.01% 7.01% 2.30% 9.74% 22.31% 11.60% 12.18% 7.44% 5.14% 18.57% 8.48%
Current Assets
31.71% 33.29% 36.58% 25.38% 24.73% 31.09% 26.48% 25.25% 42.04% 18.01% 33.84% 44.45% 31.49% 30.94% 44.77% 37.62% 28.10% 49.47%
Stocks
6.07% 11.52% 9.13% 2.66% 9.77% 6.80% 11.76% 7.14% 15.96% 3.15% 11.39% 15.44% 12.46% 6.98% 15.49% 13.06% 7.73% 11.04%
Debtors
9.54% 15.22% 13.63% 8.52% 5.19% 12.85% 5.52% 8.07% 16.46% 11.53% 10.71% 23.99% 12.49% 6.50% 16.81% 12.22% 11.40% 19.08%
Other Current
Assets
16.24% 6.55% 13.83% 14.20% 9.77% 14.37% 9.20% 10.05% 9.31% 3.33% 11.82% 5.02% 6.54% 17.44% 12.47% 12.33% 8.97% 19.34%
Cash and Cash
Equivalents 3.05% 4.85% 7.10% 12.38% 6.04% 8.59% 3.69% 4.58% 6.31% 2.66% 7.47% 1.41% 4.68% 7.93% 1.83% 4.66% 2.43% 2.86%

38
Shareholders’
Funds and
Liabilities
Shareholders’
Funds 56.14% 51.07% 52.38% 46.91% 40.21% 47.58% 61.60% 61.53% 57.74% 78.55% 50.30% 56.37% 54.25% 57.42% 43.06% 64.72% 40.64% 46.06%
Capital
58.94% 17.14% 34.67% 18.61% 22.11% 6.80% 21.77% 22.80% 42.62% 1.37% 10.53% 21.95% 21.70% 9.23% 35.91% 34.75% 8.28% 13.00%
Other
Shareholder’s
Funds
-2.80% 33.94% 17.71% 28.31% 18.10% 40.78% 39.84% 38.72% 15.12% 8.64% 39.77% 34.42% 32.55% 48.19% 7.46% 29.90% 32.36% 33.27%
Liabilities
43.86% 48.93% 47.62% 53.09% 59.79% 52.42% 38.40% 38.47% 42.26% 21.45% 49.70% 43.63% 45.75% 42.58% 56.94% 35.28% 59.36% 53.94%
Non Current
Liabilities 13.41% 24.23% 16.82% 24.80% 40.02% 28.58% 21.78% 16.42% 12.37% 8.91% 21.83% 10.00% 19.41% 19.90% 17.34% 6.86% 23.88% 15.60%
Long Term
Debt
8.30% 22.91% 13.66% 11.26% 39.18% 33.00% 16.09% 6.45% 11.50% 6.30% 11.13% 8.05% NA 12.39% 11.27% 2.23% 19.86% 9.43%
Other Non
Current
Liabilities
5.11% 1.32% 3.16% 13.55% 0.83% 14.74% 8.03% 9.96% 1.88% 2.61% 12.18% 1.96% NA 7.52% 6.08% 4.63% 5.13% 6.47%
Provisions
1.50% 0.02% 2.65% 6.16% 0.07% 6.57% 0.83% 0.12% 0.80% 0.00% 6.02% 0.00% NA 6.10% 0.74% 8.69% 6.37% 1.40%
Current
Liabilities 30.45% 24.70% 30.80% 28.28% 19.77% 23.84% 16.61% 22.06% 29.89% 12.54% 27.88% 33.63% 26.34% 22.68% 39.59% 28.42% 35.48% 38.34%
Loans
5.20% 6.29% 3.66% 0.75% 4.49% 5.34% 1.03% 4.43% 7.20% 7.06% 1.97% 3.29% NA 4.38% 14.02% 0.67% 6.62% 9.12%
Creditors
10.40% 9.83% 12.14% 8.26% 5.78% 9.76% 6.30% 7.19% 8.68% 1.89% 7.54% 17.21% NA 5.90% 17.15% 16.51% 10.80% 15.55%
Other
Current
Liabilities 14.85% 8.58% 15.00% 19.27% 10.14% 15.98% 9.29% 10.44% 15.11% 3.58% 18.40% 13.13% NA 12.41% 8.42% 11.24% 18.06% 13.66%

39
Table 4: Average Balance Sheets Item as a Fraction of Total Assets
Panel B: PRIVATE Firms Year 2008 (6,781 firms)
Countries
Number of Firms 8 129 101 492 47 231 53 41 0 0 1012 4 329 3,366 105 92 34 737
Assets
Fixed Assets 50.02% 68.56% 76.77% 59.45% 60.41% 63.67% 72.21% 64.91% 0.00% 0.00% 62.95% 80.08% 72.35% 53.68% 79.07% 73.42% 74.16% 55.50%
Intangible assets
33.45% 4.71% 5.51% 0.63% 0.81% 10.61% 1.01% 2.40% 0.00% 0.00% 1.56% 72.39% 18.77% 0.53% 3.32% 0.71% 3.44% 2.02%
Tangible Assets
8.83% 49.88% 61.77% 48.26% 34.44% 38.00% 48.07% 42.88% 0.00% 0.00% 48.65% 5.19% 50.15% 35.01% 55.75% 68.15% 60.18% 38.88%
Other Fixed
Assets 7.75% 13.96% 9.49% 10.56% 25.16% 14.89% 23.13% 19.63% 0.00% 0.00% 13.05% 2.51% 3.42% 17.53% 19.99% 4.58% 10.54% 14.17%
Current Assets
49.98% 31.44% 23.23% 40.55% 39.59% 34.41% 27.79% 35.09% 0.00% 0.00% 37.02% 19.92% 27.65% 46.32% 20.93% 26.58% 25.84% 44.49%
Stocks
0.56% 7.34% 5.00% 7.91% 3.04% 9.10% 5.97% 8.11% 0.00% 0.00% 8.52% 2.50% 7.00% 8.78% 4.70% 5.84% 7.59% 9.51%
Debtors
1.26% 16.20% 10.67% 12.21% 15.13% 5.10% 5.56% 5.28% 0.00% 0.00% 15.06% 8.91% 14.12% 11.44% 9.97% 8.97% 12.09% 12.84%
Other Current
Assets
48.16% 7.90% 7.49% 20.43% 21.42% 19.51% 16.25% 10.53% 0.00% 0.00% 13.53% 8.52% 6.53% 24.11% 6.26% 11.77% 6.16% 22.14%
Cash and Cash
Equivalents 1.04% 4.93% 2.07% 4.68% 4.92% 2.79% 5.59% 1.16% 0.00% 0.00% 9.09% 1.55% 5.32% 3.49% 1.48% 5.41% 3.40% 4.44%

40
Shareholders’
Funds and
Liabilities 46.64% 53.83% 48.73% 51.95% 43.74% 33.65% 36.34% 44.95% 0.00% 0.00% 46.06% 79.88% 40.38% 40.01% 59.94% 51.90% 23.80% 39.24%
Shareholders’
Funds 15.53% 20.83% 40.21% 27.64% 14.72% 14.72% 16.08% 20.80% 0.00% 0.00% 28.42% 22.49% 13.29% 13.26% 55.59% 35.19% 7.24% 14.64%
Capital
31.11% 33.01% 8.53% 24.31% 29.02% 17.58% 19.46% 24.14% 0.00% 0.00% 17.64% 57.39% 27.09% 26.76% 4.55% 16.23% 16.55% 24.77%
Other
Shareholder’s
Funds
46.64% 53.83% 48.73% 51.95% 43.74% 33.65% 36.34% 44.95% 0.00% 0.00% 46.06% 79.88% 40.38% 40.01% 59.94% 51.90% 23.80% 39.24%
Liabilities
53.36% 46.17% 51.27% 48.05% 56.26% 66.35% 63.66% 55.05% 0.00% 0.00% 53.94% 20.12% 59.62% 59.99% 40.06% 48.10% 76.20% 60.76%
Non Current
Liabilities 4.00% 21.75% 25.78% 14.81% 21.65% 29.65% 39.51% 14.64% 0.00% 0.00% 21.49% 5.78% 35.85% 21.87% 16.58% 22.72% 46.74% 19.34%
Long Term
Debt
1.44% 19.89% 24.31% 8.31% 8.60% 34.81% 23.10% 12.98% 0.00% 0.00% 7.79% 2.23% NA 15.30% 11.79% 4.48% 23.75% 9.54%
Other Non
Current
Liabilities
2.57% 2.02% 1.47% 6.51% 13.05% 39.18% 16.41% 5.20% 0.00% 0.00% 14.45% 3.55% NA 6.56% 4.79% 18.23% 22.98% 9.12%
Provisions
2.39% 0.00% 0.64% 0.54% 0.03% 0.00% 2.61% 0.05% 0.00% 0.00% 6.03% 0.00% NA 0.28% 0.63% 92.66% 2.34% 2.78%
Current
Liabilities 49.35% 24.42% 25.49% 33.24% 34.60% 36.69% 24.15% 40.41% 0.00% 0.00% 32.45% 14.34% 23.77% 38.12% 23.47% 25.39% 29.46% 41.43%
Loans
1.02% 6.25% 3.66% 4.84% 19.49% 6.30% 4.74% 2.54% 0.00% 0.00% 4.82% 2.64% NA 10.47% 6.03% 5.84% 9.99% 9.38%
Creditors
1.58% 8.14% 7.55% 11.39% 5.00% 5.54% 5.62% 8.54% 0.00% 0.00% 11.96% 7.13% NA 12.32% 11.11% 9.37% 11.94% 15.74%
Other
Current
Liabilities 46.76% 10.03% 14.28% 17.01% 10.12% 15.37% 13.79% 5.39% 0.00% 0.00% 15.83% 4.58% NA 13.67% 6.34% 10.28% 7.53% 16.30%

41
Table 5: Unemployment percentage rate (period average) and Transition Indicators Unemployme
nt Rate %
(average)
Large scale
privatization
Small scale
privatization Enterprise
restructuring
Price
liberalization
Trade &
Forex system
Competition
Policy
Banking
reform &
interest rate
liberalization
Securities
markets &
non-bank
financial
institutions
Overall
infrastructure
reform
Countries Bosnia Herzegovina 28.49 3.00 3.00 2.00 4.00 4.00 2.00 3.00 1.67 2.33 Bulgaria 11.35 4.00 4.00 2.67 4.33 4.33 3.00 3.67 3.00 3.00 Croatia 12.66 3.33 4.33 3.00 4.00 4.33 3.00 4.00 3.00 3.00 Czech Republic 6.99 NA NA NA NA NA NA NA NA NA Estonia 8.93 4.00 4.33 3.67 4.33 4.33 3.67 4.00 3.67 3.33 Hungary 7.04 4.00 4.33 3.67 4.33 4.33 3.33 4.00 4.00 3.67 Latvia 10.36 3.67 4.33 3.00 4.33 4.33 3.33 3.67 3.00 3.00 Lithuania 10.21 4.00 4.33 3.00 4.33 4.33 3.33 3.67 3.33 3.00 Macedonia 34.49 NA NA NA NA NA NA NA NA NA Moldova 6.71 3.00 3.67 2.00 4.00 4.00 2.00 3.00 1.67 2.33 Montenegro 30.30 3.33 4.33 3.67 4.33 4.33 3.33 3.67 3.67 3.33 Poland 14.81 3.00 4.00 2.00 4.00 4.33 2.33 3.00 2.00 2.33 Romania 6.98 3.67 3.67 2.67 4.33 4.33 2.67 3.33 3.00 3.33 Russian Federation 7.50 3.00 4.00 2.33 4.00 3.33 2.33 2.67 3.00 2.67 Serbia 18.08 2.67 3.67 2.33 4.00 4.00 2.00 3.00 2.00 2.33 Slovakia 15.08 4.00 4.33 3.67 4.33 4.33 3.33 3.67 3.00 3.33 Slovenia 5.83 3.00 4.33 3.00 4.00 4.33 2.67 3.33 3.00 3.00 Ukraine 8.19 3.00 4.00 2.33 4.00 4.00 2.33 3.00 2.67 2.33

42
Table 6: Summary Statistics for Cash Holdings (Average 2001-2010)
The sample consists of 104,605 observations for firms on ORBIS database over the period 2001-2010.
The countries are (in alphabetic order): ): Bosnia Herzegovina, Bulgaria, Croatia, Czech Republic, Estonia, Hungary, Latvia, Lithuania, Macedonia, Montenegro, Poland,
Moldova, Romania, Russian Federation, Serbia, Slovakia, Slovenia and Ukraine. Cash is Cash and cash equivalents over Total Assets.
Statistics Mean Median Std. Deviation
Cash Holdings All Listed No-
Listed
All Listed No-
Listed
All Listed No-
Listed
Countries
Bosnia Herzegovina 0.0230 0.0229 0.0351 0.0032 0.0032 0.0136 0.0678 0.0679 0.0480
Bulgaria 0.0843 0.0780 0.1012 0.0261 0.0211 0.0473 0.1479 0.1508 0.1384
Croatia 0.0359 0.0264 0.0505 0.0107 0.0070 0.0184 0.0771 0.0568 0.0989
Czech Republic 0.0940 0.0720 0.0945 0.0429 0.0526 0.0424 0.1424 0.0774 0.1435
Estonia 0.0982 0.0873 0.1013 0.0423 0.0586 0.0347 0.1428 0.0817 0.1559
Hungary 0.0682 0.0715 0.0679 0.0286 0.0414 0.0268 0.1167 0.0832 0.1194
Latvia 0.0897 0.0667 0.1053 0.0412 0.0265 0.0470 0.1388 0.0842 0.1642
Lithuania 0.0433 0.0399 0.0457 0.0212 0.0182 0.0235 0.0616 0.0610 0.0620
Macedonia 0.0163 0.0162 0.0186 0.0014 0.0014 0.0016 0.0386 0.0385 0.0405
Montenegro 0.0200 0.0202 0.0099 0.0025 0.0025 0.0073 0.0546 0.0550 0.0082
Poland 0.0929 0.0993 0.0977 0.0461 0.0526 0.0488 0.1218 0.1245 0.1252
Moldova 0.0271 0.0271 0.0291 0.0058 0.0058 0.0049 0.0604 0.0605 0.0461
Romania 0.0704 0.0658 0.0854 0.0255 0.0222 0.0392 0.1157 0.1116 0.1269
Russian Federation 0.0590 0.0611 0.0581 0.0153 0.0166 0.0138 0.1222 0.1226 0.1247
Serbia 0.0263 0.0257 0.0345 0.0057 0.0053 0.0142 0.0612 0.0613 0.0587
Slovakia 0.0725 0.0610 0.0824 0.0272 0.0234 0.0334 0.1332 0.1057 0.1525
Slovenia 0.0359 0.0284 0.0458 0.0093 0.0091 0.0096 0.0830 0.0522 0.1107
Ukraine 0.0424 0.0380 0.0440 0.0085 0.0074 0.0090 0.1037 0.1090 0.1016
TOTAL 0.0566 0.0456 0.0674 0.0150 0.0109 0.0204 0.1122 0.0965 0.1248

43
Table 7: Summary Statistics for the independent variables
Panel A: ALL SAMPLE Statistics Mean Median Std Dev.
Variables
STDEBT 0.0839 0.0071 0.1602
MATURITY 0.1899 0.0576 0.2795
ROA 3.2403 1.55 15.7260
SIZE 9.6450 9.8552 2.4846
UNEMPLOYMENT 10.1014 7.8598 5.5392
WCAPITAL 0.08475 0.0618 0.4852
Panel B: Public Firms Statistics Mean Median Std Dev.
Variables
STDEBT 0.0595 0.0040 0.1144
MATURITY 0.1885 0.0664 0.2436
ROA 0.2819 0.3500 14.5873
SIZE 8.5804 8.4815 2.3367
WCAPITAL 0.1034 0.0735 0.5436
Panel C: Private Firms Statistics Mean Median Std Dev.
Variables
STDEBT 0.1077 0.0122 0.1918
MATURITY 0.1912 0.0499 0.3107
ROA 6.1573 3.2100 16.2545
SIZE 10.6886 10.8371 2.1615
WCAPITAL 0.6647 0.0493 0.4193

44
Table 8: Variables Definition and expected relationship with Cash holdings
Variables Definition Expected relationship
with Cash Holdings
Cash Cash and Cash Equivalents / Total Assets ----
STdebt Short Term Bank Loans / Total Assets U shaped
Maturity Debt maturity = non current liabilities / total debt Negative
ROA Return on Total Assets = Profit (loss) before taxation / Total Assets Positive
Size Natural logarithm of Total Assets Negative
Unconsolidated Dummy variable equal to one if unconsolidated accounts and zero otherwise Negative
Concentration Equal to one if there is a recorded shareholder with more than 49.9% equity capital and zero
otherwise
Positive
Unemployment Total Unemployment = Percentage of total labor force Negative
Wcapital Working Capital = Stocks + Debtors - Creditors Negative
DZscore Binary variable for Bankruptcy Prediction equal to 1 if distress zone and zero if safe or gray zone Negative
Transition 1A Binary variable equal to 1 if Bulgaria, Czech Republic, Croatia, Estonia, Hungary, Latvia, Lithuania,
Poland and Slovakia and zero otherwise.
+/-
Transitions 1B Binary variable equal to 1 if Bulgaria, Czech Republic, Estonia, Hungary, Latvia, Lithuania, Poland,
Romania, Slovakia and Slovenia and zero otherwise
+/-
Transition 2B Binary variable equal to 1 if Bosnia Herzegovina, Moldova, Russia, Serbia and Ukraine and zero
otherwise
-/+
Transition 1C Binary variable equal to 1 if Estonia, Hungary, Poland and Slovakia and zero otherwise +/-
Transition 2C Binary variable equal to 1 if Bosnia Herzegovina, Macedonia, Moldova and Serbia and Zero
otherwise.
-/+
Country Binary variable per country ----
Sector Binary variable per industry type: Manufacturing, Retail, Wholesale and Services ----
Year Binary variable per year ----

45
Table 15: Correlation Matrix
STDEBT MATURITY ROA SIZE UNCONSOLIDATED INDUSTRY CONCENTRATION UNEMPLOYMENT WCAPITAL DZSCORE
STDEBT 1.0000
MATURITY -0.1206 1.0000
ROA -0.0934 -0.0384 1.0000
SIZE 0.0188 0.2639 0.1245 1.0000
UNCONSOLIDATED 0.0541 -0.1498 -0.0555 -0.3354 1.0000
INDUSTRY -0.0553 0.0091 -0.0157 -0.0614 0.0194 1.0000
CONCENTRATION 0.0072 0.0355 0.0565 0.2278 0.0341 -0.0061 1.000
UNEMPLOYMENT 0.0356 -0.0183 -0.1551 -0.1442 0.0662 0.0108 -0.0575 1.0000
WCAPITAL 0.1264 -0.0188 0.0661 -0.0599 0.0209 -0.2055 -0.0234 -0.0572
1.0000
DZSCORE -0.0132 -0.0178 0.0042 -0.0077 -0.0090 0.0190 -0.0171 -0.0150
-0.0223
1.0000

46
Table 10: Multiple Variable Regressions (Full sample)
PANEL A: Developed vs. Developing Countries The sample consists of 104,605 observations for firms on ORBIS database over the period 2001-2010.
The following regression is estimated:
Cashit = + STDEBT STDEBTi t + STDEBT^2 STDEBT^2i t + MATURITY MATURITYi t + ROA ROAi t + SIZE SIZEi t + UNCONSOLIDATED UNCONSOLIDATEDi t + INDUSTRY
INDUSTRYi t + CONCENTRATION CONCENTRATIONi t + CRISIS CRISISi t + TRANSITION TRANSITIONi t + WCAPITAL WCAPITALi t + UNEMPLOYMENT UNEMPLOYMENTi t +
DZSORE DZSCOREi t + YEARS YEARS t ++ COUNTRIES COUNTRIESi t + eit
CASHi t is the cash holding of firm i in year t. is the constant term. STDEBTi t is a quadratic function of short term bank loans over total assets of firm i in year t.
MATURITYi t is equal to non current liabilities over total debt of firm i in year t. ROAi t is equal to Return on Total Assets of firm i in year t. SIZEi t is defined by the natural
logarithm of total assets of firm i in year t. UNCONSOLIDATEDi t is a binary variable equal to one if firm i in year t reports unconsolidated accounts and zero otherwise.
SECTORi is a binary variable referring to the Sector which the firm operates (Manufacturing, Wholesale, Retail or Services). CONCENTRATION i t binary variable equal to
one if firm i in year t has a recorded shareholder (s) with more than 49.9% of equity capital. TRANSITION t refers to group of countries aligned by different criteria of
developing. UNEMPLOYMENTt refers to the percentage of labor force unemployed for each country in year t. WCAPITALi t is defined as Stocks+Debtors-Creditors over
Total Assets of firm i in year t. DZSCOREi t is binary variable using Altman’s Bankruptcy prediction equal to 1 if firm i in year t is in a distress zone and zero if in safe or
gray zone. The countries are (in alphabetic order): Bosnia Herzegovina, Bulgaria, Croatia, Czech Republic, Estonia, Hungary, Latvia, Lithuania, Macedonia, Montenegro,
Poland, Moldova, Romania, Russian Federation, Serbia, Slovakia, Slovenia and Ukraine. White heteroskedasticity - consistent standard errors & covariance. t-statistics in
parenthesis. Superscript * indicate statistical significance at 0,01(*), 0,05 (**) and 0,10 (***) percent levels. Countries and Years dummy variables were included in some of
the regressions (as reported)
Model 1 2 3 4 5
Variables
STDEBT -0.1430*
(-13.1311)
-0.0760*
(-9.4288)
-0.08067*
(-6.9131)
-0.0727*
(-5.2385)
-0.0766*
(-5.5132)
STDEBT^2 0.2304*
(18.6100)
0.0804*
(9.1051)
0.0942*
(8.3624)
0.07229*
(5.5015)
0.0739*
(5.6300)
MATURITY -0.0251*
(-13.3691)
-0.0295*
(-20.7842)
-0.0287*
(-17.1061)
-0.02171*
(-13.8753)
-0.0234*
(-14.8014)
ROA 0.0015*
(34.5648)
0.0014*
(36.2211)
0.0015*
(29.8000)
0.0012*
(26.4854)
0.0013*
(26.6326)
SIZE -0.0051*
(-15.6185)
-0.0072*
(-26.4805)
-0.0056*
(-22.4669)
-0.0076*
(-28.7461)
-0.0082*
(-30.6068)

47
UNCONSOLIDATED -0.0239*
(-17.7788)
-0.0266*
(-17.6077)
-0.0279*
(-18.6687)
-0.0262*
(-16.2208)
-0.0251*
(-15.6856)
INDUSTRY 0.0095*
(4.1673)
0.0081*
(4.7543)
0.01089*
(4.5468)
0.0092*
(3.8124)
0.0084*
(3.5063)
CONCENTRATION 0.0046
(6.3070)
0.0062*
(9.1877)
0.0081*
(11.7847)
0.0036*
(4.8335)
0.0037
(4.9450)
TRANSITION 1A 0.0330*
(33.9384)
0.0396*
(43.6820)
0.0375*
(41.6497)
---- ----
UNEMPLOYMENT -0.0010
(-12.6348)
-0.0019*
(-27.0203)
---- ---- ----
WCAPITAL -0.1511
(-7.7857)
-0.1672
(-12.3330)
-0.14471*
(-7.2205)
-0.1489*
(-7.0213)
-0.1488*
(-7.0250)
DZSCORE -0.0207*
(-11.1162)
---- ---- ---- ----
Constant 0.1468*
(20.7769)
0.1736*
(36.1283)
0.1324*
(29.6670)
0.1659*
(40.0654)
0.1781*
(42.3622)
Nr observations 55,892 85,547 95,016 95,016 95,106
Adjusted R-squared 0.3032 0.2941 0.2617 0.2873 0.2912
Year Dummy NO NO NO NO YES
Country Dummy NO NO NO YES YES

48
Table 10: Multiple Variable Regressions (Full sample)
PANEL B: European Union vs. No-European Union Countries The sample consists of 104,605 observations for firms on ORBIS database over the period 2001-2010.
The following regression is estimated:
Cashit = + STDEBT STDEBTi t + STDEBT^2 STDEBT^2i t + MATURITY MATURITYi t + ROA ROAi t + SIZE SIZEi t + UNCONSOLIDATED UNCONSOLIDATEDi t + INDUSTRY
INDUSTRYi t + CONCENTRATION CONCENTRATIONi t + CRISIS CRISISi t + TRANSITION TRANSITIONi t + WCAPITAL WCAPITALi t + UNEMPLOYMENT UNEMPLOYMENTi t +
DZSORE DZSCOREi t + YEARS YEARS t ++ COUNTRIES COUNTRIESi t + eit
CASHi t is the cash holding of firm i in year t. is the constant term. STDEBTi t is a quadratic function of short term bank loans over total assets of firm i in year t.
MATURITYi t is equal to non current liabilities over total debt of firm i in year t. ROAi t is equal to Return on Total Assets of firm i in year t. SIZEi t is defined by the natural
logarithm of total assets of firm i in year t. UNCONSOLIDATEDi t is a binary variable equal to one if firm i in year t reports unconsolidated accounts and zero otherwise.
SECTORi is a binary variable referring to the Sector which the firm operates (Manufacturing, Wholesale, Retail or Services). CONCENTRATIONi t binary variable equal to
one if firm i in year t has a recorded shareholder (s) with more than 49.9% of equity capital. TRANSITION t refers to group of countries aligned by different criteria of
developing. UNEMPLOYMENTt refers to the percentage of labor force unemployed for each country in year t. WCAPITALi t is defined as Stocks+Debtors-Creditors over
Total Assets of firm i in year t. DZSCOREi t is binary variable using Altman’s Bankruptcy prediction equal to 1 if firm i in year t is in a distress zone and zero if in safe or
gray zone. The countries are (in alphabetic order): Bosnia Herzegovina, Bulgaria, Croatia, Czech Republic, Estonia, Hungary, Latvia, Lithuania, Macedonia, Montenegro,
Poland, Moldova, Romania, Russian Federation, Serbia, Slovakia, Slovenia and Ukraine. White heteroskedasticity - consistent standard errors & covariance. t-statistics in
parenthesis. Superscript * indicate statistical significance at 0,01(*), 0,05 (**) and 0,10 (***) percent levels. Countries and Years dummy variables were included in some of
the regressions (as reported)
Model 1 2 3 4 5
Variables
STDEBT -0.1169*
(-10.4041)
-0.05385*
(-6.1480)
-0.0600*
(-4.7051)
-0.0727*
(-5.2385)
-0.0766*
(-5.5132)
STDEBT^2 0.2045*
(16.5698)
0.0611*
(6.6170)
0.07471*
(6.2299)
0.07229*
(5.5015)
0.0739*
(5.6300)
MATURITY -0.0249*
(-13.9299)
-0.0288*
(-20.4384)
-0.0279*
(-16.1715)
-0.02171*
(-13.8753)
-0.0234*
(-14.8014)
ROA 0.0016*
(34.6376)
0.0015*
(36.0336)
0.0015*
(29.0676)
0.0012*
(26.4854)
0.0013*
(26.6326)
SIZE -0.0041*
(-10.8243)
-0.0061*
(-22.2561)
-0.0048*
(-19.2799)
-0.0076*
(-28.7461)
-0.0082*
(-30.6068)

49
UNCONSOLIDATED -0.0236
(-17.6072)
-0.0258*
(-17.0418)
-0.0264*
(-16.9975)
-0.0262*
(-16.2208)
-0.0251*
(-15.6856)
INDUSTRY 0.0098*
(4.0033)
0.0088*
(4.9766)
0.0113*
(4.5449)
0.0092*
(3.8124)
0.0084*
(3.5063)
CONCENTRATION 0.0030*
(4.1061)
0.0052*
(7.6873)
0.0058*
(9.6121)
0.0036*
(4.8335)
0.0037
(4.9450)
TRANSITION 1B 0.0284*
(19.6665)
0.0296*
(19.6283)
0.03394*
(15.1566)
---- ----
TRANSITION 2B -0.0121
(-6.8337)
-0.0127*
(-7.9100)
-0.0091*
(-5.7941)
---- ----
UNEMPLOYMENT -0.0005*
(-5.7172)
-0.0015*
(-20.3311)
---- ---- ----
WCAPITAL -0.1573*
(-7.7408)
-0.1726*
(-12.2393)
-0.1500*
(-7.1740)
-0.1489*
(-7.0213)
-0.1488*
(-7.0250)
DZSCORE -0.0187
(-11.0448)
---- ---- ---- ----
Constant 0.1359*
(16.0881)
0.1659*
(30.1622)
0.1291*
(30.0313)
0.1659*
(40.0654)
0.1781*
(42.3622)
Nr observations 55,892 85,547 95,016 95,016 95,106
Adjusted R-squared 0.3169 0.3009 0.2714 0.2873 0.2912
Year Dummy NO NO NO NO YES
Country Dummy NO NO NO YES YES

50
Table 10: Multiple Variable Regressions (Full sample)
PANEL C: Developed vs. Developing Countries (by quartiles) The sample consists of 104,605 observations for firms on ORBIS database over the period 2001-2010.
The following regression is estimated:
Cashit = + STDEBT STDEBTi t + STDEBT^2 STDEBT^2i t + MATURITY MATURITYi t + ROA ROAi t + SIZE SIZEi t + UNCONSOLIDATED UNCONSOLIDATEDi t + INDUSTRY
INDUSTRYi t + CONCENTRATION CONCENTRATIONi t + CRISIS CRISISi t + TRANSITION TRANSITIONi t + WCAPITAL WCAPITALi t + UNEMPLOYMENT UNEMPLOYMENTi t +
DZSORE DZSCOREi t + YEARS YEARS t ++ COUNTRIES COUNTRIESi t + eit
CASHi t is the cash holding of firm i in year t. is the constant term. STDEBTi t is a quadratic function of short term bank loans over total assets of firm i in year t.
MATURITYi t is equal to non current liabilities over total debt of firm i in year t. ROAi t is equal to Return on Total Assets of firm i in year t. SIZEi t is defined by the natural
logarithm of total assets of firm i in year t. UNCONSOLIDATEDi t is a binary variable equal to one if firm i in year t reports unconsolidated accounts and zero otherwise.
SECTORi is a binary variable referring to the Sector which the firm operates (Manufacturing, Wholesale, Retail or Services). CONCENTRATION i t binary variable equal to
one if firm i in year t has a recorded shareholder (s) with more than 49.9% of equity capital. TRANSITION t refers to group of countries aligned by different criteria of
developing. UNEMPLOYMENTt refers to the percentage of labor force unemployed for each country in year t. WCAPITALi t is defined as Stocks+Debtors-Creditors over
Total Assets of firm i in year t. DZSCOREi t is binary variable using Altman’s Bankruptcy prediction equal to 1 if firm i in year t is in a distress zone and zero if in safe or
gray zone. The countries are (in alphabetic order): Bosnia Herzegovina, Bulgaria, Croatia, Czech Republic, Estonia, Hungary, Latvia, Lithuania, Macedonia, Montenegro,
Poland, Moldova, Romania, Russian Federation, Serbia, Slovakia, Slovenia and Ukraine. White heteroskedasticity - consistent standard errors & covariance. t-statistics in
parenthesis. Superscript * indicate statistical significance at 0,01(*), 0,05 (**) and 0,10 (***) percent levels. Countries and Years dummy variables were included in some of
the regressions (as reported)
Model 1 2 3 4 5
Variables
STDEBT -0.1253*
(-11.0864)
-0.07655*
(-9.4178)
-0.08233*
(-6.9851)
-0.0727*
(-5.2385)
-0.0766*
(-5.5132)
STDEBT^2 0.2059*
(16.3815)
0.0728*
(8.1815)
0.0788*
(6.8653)
0.07229*
(5.5015)
0.0739*
(5.6300)
MATURITY -0.0157*
(-8.2591)
-0.0222*
(-15.4582)
-0.0208*
(-12.0677)
-0.02171*
(-13.8753)
-0.0234*
(-14.8014)
ROA 0.0015*
(33.4235)
0.0013*
(34.337)
0.0013*
(26.5281)
0.0012*
(26.4854)
0.0013*
(26.6326)
SIZE -0.0058*
(-14.9730)
-0.0084*
(-28.3094)
-0.0081*
(-27.5052)
-0.0076*
(-28.7461)
-0.0082*
(-30.6068)

51
UNCONSOLIDATED -0.0211*
(-15.3640)
-0.02657*
(-17.488)
-0.0278*
(-18.5230)
-0.0262*
(-16.2208)
-0.0251*
(-15.6856)
INDUSTRY 0.0098*
(4.1715)
0.00797*
(4.6521)
0.0095*
(3.9121)
0.0092*
(3.8124)
0.0084*
(3.5063)
CONCENTRATION 0.0026*
(3.5831)
0.0039*
(5.8214)
0.0045*
(6.59100
0.0036*
(4.8335)
0.0037
(4.9450)
TRANSITION 1C 0.0265*
(21.1085)
0.0321*
(-33.3711)
0.0291*
(25.6213)
---- ----
TRANSITION 2C -0.0289*
(-21.3288)
-0.0384*
(-33.3711)
-0.0444*
(-42.1259)
---- ----
UNEMPLOYMENT -0.0003*
(-3.7516)
-0.0005*
(-7.5257)
---- ---- ----
WCAPITAL -0.1531*
(-.7.7379)
-0.1673*
(-12.2666)
-0.1463
(-7.2160)
-0.1489*
(-7.0213)
-0.1488*
(-7.0250)
DZSCORE -0.02336*
(-12.5576)
---- ---- ---- ----
Constant 0.1566*
(20.4513)
0.1855*
(37.3475)
0.1759*
(33.5752)
0.1659*
(40.0654)
0.1781*
(42.3622)
Nr observations 55,892 85,547 95,016 95,016 95,106
Adjusted R-squared 0.3059 0.2960 0.2752 0.2873 0.2912
Year Dummy NO NO NO NO YES
Country Dummy NO NO NO YES YES

52
Table 11: Multiple Variable Regressions (Private Firms)
PANEL A: Developed vs. Developing Countries The sample consists of 52,821 observations for firms on ORBIS database over the period 2001-2010.
The following regression is estimated:
Cashit = + STDEBT STDEBTi t + STDEBT^2 STDEBT^2i t + MATURITY MATURITYi t + ROA ROAi t + SIZE SIZEi t + UNCONSOLIDATED UNCONSOLIDATEDi t + INDUSTRY
INDUSTRYi t + CONCENTRATION CONCENTRATIONi t + TRANSITION TRANSITIONi t + WCAPITAL WCAPITALi t + UNEMPLOYMENT UNEMPLOYMENTi t + DZSORE
DZSCOREi t + YEARS YEARS t ++ COUNTRIES COUNTRIESi t + eit
CASHi t is the cash holding of firm i in year t. is the constant term. STDEBTi t is a quadratic function of short term bank loans over total assets of firm i in year t.
MATURITYi t is equal to non current liabilities over total debt of firm i in year t. ROAi t is equal to Return on Total Assets of firm i in year t. SIZEi t is defined by the natural
logarithm of total assets of firm i in year t. UNCONSOLIDATEDi t is a binary variable equal to one if firm i in year t reports unconsolidated accounts and zero otherwise.
SECTORi is a binary variable referring to the Sector which the firm operates (Manufacturing, Wholesale, Retail or Services). CONCENTRATIONi t binary variable equal to
one if firm i in year t has a recorded shareholder (s) with more than 49.9% of equity capital. TRANSITION t refers to group of countries aligned by different criteria of
developing. UNEMPLOYMENTt refers to the percentage of labor force unemployed for each country in year t. WCAPITALi t is defined as Stocks+Debtors-Creditors over
Total Assets of firm i in year t. DZSCOREi t is binary variable using Altman’s Bankruptcy prediction equal to 1 if firm i in year t is in a distress zone and zero if in safe or
gray zone. The countries are (in alphabetic order): Bosnia Herzegovina, Bulgaria, Croatia, Czech Republic, Estonia, Hungary, Latvia, Lithuania, Macedonia, Montenegro,
Poland, Moldova, Romania, Russian Federation, Serbia, Slovakia, Slovenia and Ukraine. White heteroskedasticity - consistent standard errors & covariance. t-statistics in
parenthesis. Superscript * indicate statistical significance at 0,01(*), 0,05 (**) and 0,10 (***) percent levels. Countries and Years dummy variables were included in some of
the regressions (as reported)
Model 1 2 3 4 5
Variables
STDEBT -0.1001*
(-7.36233)
-0.0595*
(-4.3130)
-0.0580*
(-4.2055)
-0.0492*
(-3.2636)
-0.0509*
(-3.3882)
STDEBT^2 0.1367*
(8.2229)
0.0514*
(3.8895)
0.0514*
(3.8894)
0.0418*
(2.9411)
0.0400*
(2.8295)
MATURITY -0.0178*
(-6.9594)
-0.0216*
(-10.9026)
-0.0210*
(-10.6964)
-0.0209*
(-10.6496)
-0.0232*
(-11.6747)
ROA 0.0016*
(25.2460)
0.0013*
(23.6502)
0.0013*
(24.2333)
0.0013*
(23.3357)
0.0013*
(23.2024)
SIZE -0.0107*
(-20.2317)
-0.0115*
(-27.0390)
-0.0113*
(-26.9062)
-0.0111*
(-26.3353)
-0.0123*
(-27.7015)

53
UNCONSOLIDATED -0.0100*
(-5.1306)
-0.0072*
(-3.5809)
-0.0064*
(-3.1813)
-0.0044*
(-2.1050)
-0.0063*
(-2.9798)
INDUSTRY 0.0109*
(5.0396)
0.0122*
(5.0969)
0.0122*
(5.1403)
0.0117*
(4.7254)
0.0102*
(4.1860)
CONCENTRATION 0.0040*
(3.2923)
0.0060*
(6.1992)
0.0058*
(5.9573)
0.0089*
(9.0795)
0.0086*
(8.8161)
TRANSITION 1A 0.0449*
(32.0288)
0.0468*
(38.5680)
0.0416*
(37.9326)
---- ----
UNEMPLOYMENT -0.0010*
(-6.6590)
-0.0015*
(-9.9953)
---- ---- ----
WCAPITAL -0.1827*
(-11.6198)
-0.1665*
(-8.4269)
-0.1668*
(-8.4611)
-0.1701*
(-8.3264)
-0.1699*
(-8.3508)
DZSCORE -0.0142*
(-8.25314)
---- ---- ---- ----
Constant 0.1880*
(26.8580)
0.1940*
(31.8195)
0.1792*
(30.5400)
0.1743*
(30.0670)
0.1979*
(31.8165)
Nr observations 26,626 47,912 48,382 48,382 48,382
Adjusted R-squared 0.3406 0.3140
0.3130
0.3233
0.3286
Year Dummy NO NO NO NO YES
Country Dummy NO NO NO YES YES

54
Table 11: Multiple Variable Regressions (Private Firms)
PANEL B: European Union vs. No-European Union Countries The sample consists of 52,821 observations for firms on ORBIS database over the period 2001-2010.
The following regression is estimated:
Cashit = + STDEBT STDEBTi t + STDEBT^2 STDEBT^2i t + MATURITY MATURITYi t + ROA ROAi t + SIZE SIZEi t + UNCONSOLIDATED UNCONSOLIDATEDi t + INDUSTRY
INDUSTRYi t + CONCENTRATION CONCENTRATIONi t + TRANSITION TRANSITIONi t + WCAPITAL WCAPITALi t + UNEMPLOYMENT UNEMPLOYMENTi t + DZSORE
DZSCOREi t + YEARS YEARS t ++ COUNTRIES COUNTRIESi t + eit
CASHi t is the cash holding of firm i in year t. is the constant term. STDEBTi t is a quadratic function of short term bank loans over total assets of firm i in year t.
MATURITYi t is equal to non current liabilities over total debt of firm i in year t. ROAi t is equal to Return on Total Assets of firm i in year t. SIZEi t is defined by the natural
logarithm of total assets of firm i in year t. UNCONSOLIDATEDi t is a binary variable equal to one if firm i in year t reports unconsolidated accounts and zero otherwise.
SECTORi is a binary variable referring to the Sector which the firm operates (Manufacturing, Wholesale, Retail or Services). CONCENTRATION i t binary variable equal to
one if firm i in year t has a recorded shareholder (s) with more than 49.9% of equity capital. TRANSITIONt refers to group of countries aligned by different criteria of
developing. UNEMPLOYMENTt refers to the percentage of labor force unemployed for each country in year t. WCAPITALi t is defined as Stocks+Debtors-Creditors over
Total Assets of firm i in year t. DZSCOREi t is binary variable using Altman’s Bankruptcy prediction equal to 1 if firm i in year t is in a distress zone and zero if in safe or
gray zone. The countries are (in alphabetic order): Bosnia Herzegovina, Bulgaria, Croatia, Czech Republic, Estonia, Hungary, Latvia, Lithuania, Macedonia, Montenegro,
Poland, Moldova, Romania, Russian Federation, Serbia, Slovakia, Slovenia and Ukraine. White heteroskedasticity - consistent standard errors & covariance. t-statistics in
parenthesis. Superscript * indicate statistical significance at 0,01(*), 0,05 (**) and 0,10 (***) percent levels. Countries and Years dummy variables were included in some of
the regressions (as reported)
Model 1 2 3 4 5
Variables
STDEBT -0.0814*
(-5.8930)
-0.0464*
(-3.2461)
-0.0458*
(-3.2094)
-0.0492*
(-3.2636)
-0.0509*
(-3.3882)
STDEBT^2 0.1211*
(7.2883)
0.0408*
(3.0197)
0.0417*
(3.0906)
0.0418*
(2.9411)
0.0400*
(2.8295)
MATURITY -0.0186*
(-7.3061)
-0.0214*
(-10.8342)
-0.0207*
(-10.5383)
-0.0209*
(-10.6496)
-0.0232*
(-11.6747)
ROA 0.0016*
(25.3712)
0.0013*
(23.5487)
0.0014*
(24.0297)
0.0013*
(23.3357)
0.0013*
(23.2024)
SIZE -0.0107*
(-20.3327)
-0.0113*
(-26.6329)
-0.0111*
(-26.5790)
-0.0111*
(-26.3353)
-0.0123*
(-27.7015)

55
UNCONSOLIDATED -0.0084*
(-4.2135)
-0.0053*
(-2.6487)
-0.0041**
(-2.0288)
-0.0044**
(-2.1050)
-0.0063*
(-2.9798)
INDUSTRY 0.0106*
(4.7135)
0.0122*
(4.9817)
0.0123*
(5.0496)
0.0117*
(4.7254)
0.0102*
(4.1860)
CONCENTRATION 0.0077*
(6.3760)
0.0086*
(8.8753)
0.0080*
(8.3944)
0.0089*
(9.0795)
0.0086*
(8.8161)
TRANSITION 1B 0.0256*
(9.2816)
0.02398
(8.3155)
0.0268*
(9.4578)
---- ----
TRANSITION 2B -0.0275*
(-9.4121)
-0.0274*
(-9.1076)
-0.0203*
(-6.9999)
---- ----
UNEMPLOYMENT -0.0009*
(-6.0303)
-0.0014*
(-9.6966)
---- ---- ----
WCAPITAL -0.1875*
(-11.6258)
-0.1692*
(-8.4120)
-0.1692*
(-8.4457)
-0.1701*
(-8.3264)
-0.1699*
(-8.3508)
DZSCORE -0.0113*
(-6.9888)
---- ---- ---- ----
Constant 0.2036*
(24.1505)
0.2119*
(27.7989)
0.1910*
(26.9338)
0.1743*
(30.0670)
0.1979*
(31.8165)
Nr observations 26,626 47,912 48,382 48,382 48,382
Adjusted R-squared 0.355
0.3205
0.3198
0.3233
0.3286
Year Dummy NO NO NO NO YES
Country Dummy NO NO NO YES YES

56
Table 11: Multiple Variable Regressions (Private Firms)
PANEL C: Developed vs. Developing Countries (by quartiles) The sample consists of 52,821 observations for firms on ORBIS database over the period 2001-2010.
The following regression is estimated:
Cashit = + STDEBT STDEBTi t + STDEBT^2 STDEBT^2i t + MATURITY MATURITYi t + ROA ROAi t + SIZE SIZEi t + UNCONSOLIDATED UNCONSOLIDATEDi t + INDUSTRY
INDUSTRYi t + CONCENTRATION CONCENTRATIONi t + TRANSITION TRANSITIONi t + WCAPITAL WCAPITALi t + UNEMPLOYMENT UNEMPLOYMENTi t + DZSORE
DZSCOREi t + YEARS YEARS t ++ COUNTRIES COUNTRIESi t + eit
CASHi t is the cash holding of firm i in year t. is the constant term. STDEBTi t is a quadratic function of short term bank loans over total assets of firm i in year t.
MATURITYi t is equal to non current liabilities over total debt of firm i in year t. ROAi t is equal to Return on Total Assets of firm i in year t. SIZEi t is defined by the natural
logarithm of total assets of firm i in year t. UNCONSOLIDATEDi t is a binary variable equal to one if firm i in year t reports unconsolidated accounts and zero otherwise.
SECTORi is a binary variable referring to the Sector which the firm operates (Manufacturing, Wholesale, Retail or Services). CONCENTRATIONi t binary variable equal to
one if firm i in year t has a recorded shareholder (s) with more than 49.9% of equity capital. TRANSITION t refers to group of countries aligned by different criteria of
developing. UNEMPLOYMENTt refers to the percentage of labor force unemployed for each country in year t. WCAPITALi t is defined as Stocks+Debtors-Creditors over
Total Assets of firm i in year t. DZSCOREi t is binary variable using Altman’s Bankruptcy prediction equal to 1 if firm i in year t is in a distress zone and zero if in safe or
gray zone. The countries are (in alphabetic order): Bosnia Herzegovina, Bulgaria, Croatia, Czech Republic, Estonia, Hungary, Latvia, Lithuania, Macedonia, Montenegro,
Poland, Moldova, Romania, Russian Federation, Serbia, Slovakia, Slovenia and Ukraine. White heteroskedasticity - consistent standard errors & covariance. t-statistics in
parenthesis. Superscript * indicate statistical significance at 0,01(*), 0,05 (**) and 0,10 (***) percent levels. Countries and Years dummy variables were included in some of
the regressions (as reported)
Model 1 2 3 4 5
Variables
STDEBT -0.0958*
(-6.9707)
-0.0699*
(-5.0316)
-0.0673*
(-4.8552)
-0.0492*
(-3.2636)
-0.0509*
(-3.3882)
STDEBT^2 0.1259*
(7.4991)
0.0558*
(4.2015)
0.0546*
(4.1107)
0.0418*
(2.9411)
0.0400*
(2.8295)
MATURITY -0.0125*
(-4.9261)
-0.0194*
(-9.7132)
-0.0191*
(-9.6596)
-0.0209*
(-10.6496)
-0.0232*
(-11.6747)
ROA 0.0016*
(24.9898)
0.0013*
(23.0876)
0.0013*
(23.6049)
0.0013*
(23.3357)
0.0013*
(23.2024)
SIZE -0.0092*
(-17.6909)
-0.0108*
(-25.5029)
-0.0105*
(-25.2836)
-0.0111*
(-26.3353)
-0.0123*
(-27.7015)

57
UNCONSOLIDATED -0.0062*
(-3.0783)
-0.0077*
(-3.7247)
-0.0081*
(-3.9455)
-0.0044**
(-2.1050)
-0.0063*
(-2.9798)
INDUSTRY 0.0129*
(5.9028)
0.0132*
(5.4953)
0.0132*
(5.5347)
0.0117*
(4.7254)
0.0102*
(4.1860)
CONCENTRATION 0.0044*
(3.5231)
0.0060*
(6.0497)
0.0057*
(5.7989)
0.0089*
(9.0795)
0.0086*
(8.8161)
TRANSITION 1B 0.0414*
(24.1204)
0.0463*
(28.2938)
0.0371*
(27.7004)
---- ----
TRANSITION 2B 0.0045*
(1.4790)
0.0063*
(2.2195)
-0.0133*
(-7.4393)
---- ----
UNEMPLOYMENT -0.0016*
(-8.4988)
-0.0017*
(-9.1828)
--- ---- ----
WCAPITAL -0.1846*
(-11.6318)
-0.1668*
(-8.4148)
-0.1671*
(-8.4495)
-0.1701*
(-8.3264)
-0.1699*
(-8.3508)
DZSCORE -0.0200*
(-12.0356)
---- ---- ---- ----
Constant 0.1847*
(25.8553)
0.1957*
(31.4391)
0.1801*
(30.5003)
0.1743*
(30.0670)
0.1979*
(31.8165)
Nr observations 26,626 47,912 48382 48,382 48,382
Adjusted R-squared 0.3293
0.3035
0.3031
0.3233
0.3286
Year Dummy NO NO NO NO YES
Country Dummy NO NO NO YES YES

58
Table 12: Multiple Variable Regressions (Public Firms)
PANEL A: Developed vs. Developing Countries The sample consists of 51,784 observations for firms on ORBIS database over the period 2001-2010.
The following regression is estimated:
Cashit = + STDEBT STDEBTi t + STDEBT^2 STDEBT^2i t + MATURITY MATURITYi t + ROA ROAi t + SIZE SIZEi t + UNCONSOLIDATED UNCONSOLIDATEDi t + INDUSTRY
INDUSTRYi t + CONCENTRATION CONCENTRATIONi t + TRANSITION TRANSITIONi t + WCAPITAL WCAPITALi t + UNEMPLOYMENT UNEMPLOYMENTi t + DZSORE
DZSCOREi t + YEARS YEARS t + COUNTRIES COUNTRIESi t + eit
CASHi t is the cash holding of firm i in year t. is the constant term. STDEBTi t is a quadratic function of short term bank loans over total assets of firm i in year t.
MATURITYi t is equal to non current liabilities over total debt of firm i in year t. ROAi t is equal to Return on Total Assets of firm i in year t. SIZEi t is defined by the natural
logarithm of total assets of firm i in year t. UNCONSOLIDATEDi t is a binary variable equal to one if firm i in year t reports unconsolidated accounts and zero otherwise.
SECTORi is a binary variable referring to the Sector which the firm operates (Manufacturing, Wholesale, Retail or Services). CONCENTRATION i t binary variable equal to
one if firm i in year t has a recorded shareholder (s) with more than 49.9% of equity capital. TRANSITION t refers to group of countries aligned by different criteria of
developing. UNEMPLOYMENTt refers to the percentage of labor force unemployed for each country in year t. WCAPITALi t is defined as Stocks+Debtors-Creditors over
Total Assets of firm i in year t. DZSCOREi t is binary variable using Altman’s Bankruptcy prediction equal to 1 if firm i in year t is in a distress zone and zero if in safe or
gray zone. The countries are (in alphabetic order): Bosnia Herzegovina, Bulgaria, Croatia, Czech Republic, Estonia, Hungary, Latvia, Lithuania, Macedonia, Montenegro,
Poland, Moldova, Romania, Russian Federation, Serbia, Slovakia, Slovenia and Ukraine. White heteroskedasticity - consistent standard errors & covariance. t-statistics in
parenthesis. Superscript * indicate statistical significance at 0,01(*), 0,05 (**) and 0,10 (***) percent levels. Countries and Years dummy variables were included in some of
the regressions (as reported)
Model 1 2 3 4 5
Variables
STDEBT -0.1164*
(-14.9740)
-0.1301*
(20.0265)
-0.1371*
(-10.4846)
-0.1067*
(-5.9348)
-0.1153*
(-6.3115)
STDEBT^2 0.2057*
(12.2885)
0.1840*
(14.1464)
0.2022*
(13.1057)
0.1519*
(7.5486)
0.1573*
(7.7803)
MATURITY -0.0229
(-12.2413)
-0.0323*
(-18.1447)
-0.0288*
(-13.8305)
-0.0187*
(-8.9372)
-0.0204*
(-9.4481)
ROA 0.0014*
(23.6109)
0.0014*
(29.2401)
0.0015*
(16.5463)
0.0013*
(16.4918)
0.0013*
(16.7533)
SIZE -0.0036*
(-14.0173)
-0.0044*
(-17.5688)
-0.0036*
(-11.3846)
-0.0052*
(-17.8851)
-0.0057*
(-18.9515)

59
UNCONSOLIDATED -0.0351*
(-18.0950)
-0.0385*
(-17.6795)
-0.0448*
(-18.6226)
-0.0461*
(-12.0883)
-0.0441*
(-11.8418)
INDUSTRY 0.0019**
(2.1766)
0.0028**
(3.2195)
0.0074**
(2.2079)
0.0071**
(2.0476)
0.0064***
(1.8730)
CONCENTRATION 0.0039*
(4.2401)
0.0023**
(2.6351)
0.0038*
(4.4103)
-0.0021**
(-2.3338)
-0.0019**
(-2.1060)
TRANSITION 1A 0.0178*
(13.5293)
0.0240*
(15.9930)
0.0257*
(13.6277) ---- ----.
UNEMPLOYMENT -0.0011*
(-16.2370)
-0.0017*
(-23.1666)
---- ---- ----
WCAPITAL -0.1604*
(-35.0480)
-0.1596*
(-35.9344)
-0.1069**
(-3.4531)
-0.1161**
(-3.3116)
-0.1157**
(-3.3043)
DZSCORE -0.0256*
(-24.5478)
----- ----- ---- -----
Constant 0.1523*
(40.0083)
0.1621*
(40.2533)
0.1275*
(21.0939)
0.1347*
(21.2665)
0.1526*
(23.0949)
Nr observations 28932 37635 46634 46634 46634
Adjusted R-squared 0.2962 0.2675 0.2091 0.2460 0.2501
Year Dummy NO NO NO NO YES
Country Dummy NO NO NO YES YES

60
Table 12: Multiple Variable Regressions (Public Firms)
PANEL B: European Union vs. No-European Union Countries The sample consists of 51,784 observations for firms on ORBIS database over the period 2001-2010.
The following regression is estimated:
Cashit = + STDEBT STDEBTi t + STDEBT^2 STDEBT^2i t + MATURITY MATURITYi t + ROA ROAi t + SIZE SIZEi t + UNCONSOLIDATED UNCONSOLIDATEDi t + INDUSTRY
INDUSTRYi t + CONCENTRATION CONCENTRATIONi t + TRANSITION TRANSITIONi t + WCAPITAL WCAPITALi t + UNEMPLOYMENT UNEMPLOYMENTi t + DZSORE
DZSCOREi t + YEARS YEARS t ++ COUNTRIES COUNTRIESi t + eit
CASHi t is the cash holding of firm i in year t. is the constant term. STDEBTi t is a quadratic function of short term bank loans over total assets of firm i in year t.
MATURITYi t is equal to non current liabilities over total debt of firm i in year t. ROAi t is equal to Return on Total Assets of firm i in year t. SIZEi t is defined by the natural
logarithm of total assets of firm i in year t. UNCONSOLIDATEDi t is a binary variable equal to one if firm i in year t reports unconsolidated accounts and zero otherwise.
SECTORi is a binary variable referring to the Sector which the firm operates (Manufacturing, Wholesale, Retail or Services). CONCENTRATIONi t binary variable equal to
one if firm i in year t has a recorded shareholder (s) with more than 49.9% of equity capital. TRANSITION t refers to group of countries aligned by different criteria of
developing. UNEMPLOYMENTt refers to the percentage of labor force unemployed for each country in year t. WCAPITALi t is defined as Stocks+Debtors-Creditors over
Total Assets of firm i in year t. DZSCOREi t is binary variable using Altman’s Bankruptcy prediction equal to 1 if firm i in year t is in a distress zone and zero if in safe or
gray zone. The countries are (in alphabetic order): Bosnia Herzegovina, Bulgaria, Croatia, Czech Republic, Estonia, Hungary, Latvia, Lithuania, Macedonia, Montenegro,
Poland, Moldova, Romania, Russian Federation, Serbia, Slovakia, Slovenia and Ukraine. White heteroskedasticity - consistent standard errors & covariance. t-statistics in
parenthesis. Superscript * indicate statistical significance at 0,01(*), 0,05 (**) and 0,10 (***) percent levels. Countries and Years dummy variables were included in some of
the regressions (as reported)
Model 1 2 3 4 5
Variables
STDEBT -0.0810*
(-10.4332)
-0.0946*
(-14.5023)
-0.1052*
(-6.3435)
-0.1067*
(-5.9348)
-0.1153*
(-6.3115)
STDEBT^2 0.1682*
(10.1466)
0.1451*
(11.3026)
0.1636*
(8.9600)
0.1519*
(7.5486)
0.1573*
(7.7803)
MATURITY -0.0217*
(-11.7335)
-0.0311*
(-17.5860)
-0.0279*
(-13.2967)
-0.0187*
(-8.9372)
-0.0204*
(-9.4481)
ROA 0.0014*
(24.1379)
0.0015*
(29.9259)
0.0015*
(15.9541)
0.0013*
(16.4918)
0.0013*
(16.7533)
SIZE -0.0026*
(-10.1557)
-0.0031*
(-12.2540)
-0.0025*
(-9.6197)
-0.0052*
(-17.8851)
-0.0057*
(-18.9515)

61
UNCONSOLIDATED -0.0327*
(-17.3218)
-0.0351*
(-16.5869)
-0.0406*
(-13.8885)
-0.0461*
(-12.0883)
-0.0441*
(-11.8418)
INDUSTRY 0.0020**
(2.3987)
0.0033**
(3.8043)
0.0080**
(2.2939)
0.0071**
(2.0476)
0.0064***
(1.8730)
CONCENTRATION -0.0008
(-0.8494)
-0.0020**
(-2.3058)
-0.0004
(-0.4990)
-0.0021**
(-2.3338)
-0.0019**
(-2.1060)
TRANSITION 1B 0.0306*
(18.1229)
0.0327*
(19.2887)
0.0322*
(8.0793)
----
----
TRANSITION 2B -0.0043**
(-2.8565)
-0.0028***
(-1.9002)
-0.0045**
(-3.3123)
----
----
UNEMPLOYMENT -0.0005*
(-7.1637)
-0.0012*
(-16.4396)
----
----
----
WCAPITAL -0.1707*
(-36.8349)
-0.1678*
(-37.0816)
-0.1138**
(-3.3747)
-0.1161**
(-3.3116)
-0.1157**
(-3.3043)
DZSCORE -0.0250*
(-24.4324)
---- ----- ---- -----
Constant 0.1315*
(30.8236)
0.1388*
(31.0970)
0.1146*
(24.0128)
0.1347*
(21.2665)
0.1526*
(23.0949)
Nr observations 28,932 37,635 46,634 46634 46634
Adjusted R-squared 0.3181 0.2823 0.2253 0.2460 0.2501
Year Dummy NO NO NO NO YES
Country Dummy NO NO NO YES YES

62
Table 12: Multiple Variable Regressions (Public Firms)
PANEL C: Developed vs. Developing Countries (by quartiles) The sample consists of 51,784 observations for firms on ORBIS database over the period 2001-2010.
The following regression is estimated:
Cashit = + STDEBT STDEBTi t + STDEBT^2 STDEBT^2i t + MATURITY MATURITYi t + ROA ROAi t + SIZE SIZEi t + UNCONSOLIDATED UNCONSOLIDATEDi t + INDUSTRY
INDUSTRYi t + CONCENTRATION CONCENTRATIONi t + TRANSITION TRANSITIONi t + WCAPITAL WCAPITALi t + UNEMPLOYMENT UNEMPLOYMENTi t + DZSORE
DZSCOREi t + YEARS YEARS t ++ COUNTRIES COUNTRIESi t + eit
CASHi t is the cash holding of firm i in year t. is the constant term. STDEBTi t is a quadratic function of short term bank loans over total assets of firm i in year t.
MATURITYi t is equal to non current liabilities over total debt of firm i in year t. ROAi t is equal to Return on Total Assets of firm i in year t. SIZEi t is defined by the natural
logarithm of total assets of firm i in year t. UNCONSOLIDATEDi t is a binary variable equal to one if firm i in year t reports unconsolidated accounts and zero otherwise.
SECTORi is a binary variable referring to the Sector which the firm operates (Manufacturing, Wholesale, Retail or Services). CONCENTRATION i t binary variable equal to
one if firm i in year t has a recorded shareholder (s) with more than 49.9% of equity capital. TRANSITION t refers to group of countries aligned by different criteria of
developing. UNEMPLOYMENTt refers to the percentage of labor force unemployed for each country in year t. WCAPITALi t is defined as Stocks+Debtors-Creditors over
Total Assets of firm i in year t. DZSCOREi t is binary variable using Altman’s Bankruptcy prediction equal to 1 if firm i in year t is in a distress zone and zero if in safe or
gray zone. The countries are (in alphabetic order): Bosnia Herzegovina, Bulgaria, Croatia, Czech Republic, Estonia, Hungary, Latvia, Lithuania, Macedonia, Montenegro,
Poland, Moldova, Romania, Russian Federation, Serbia, Slovakia, Slovenia and Ukraine. White heteroskedasticity - consistent standard errors & covariance. t-statistics in
parenthesis. Superscript * indicate statistical significance at 0,01(*), 0,05 (**) and 0,10 (***) percent levels. Countries and Years dummy variables were included in some of
the regressions (as reported) Model 1 2 3 4 5
Variables
STDEBT -0.0838*
(-10.6396)
-0.1082*
(-16.5688)
-0.1141*
(-7.6663)
-0.1067*
(-5.9348)
-0.1153*
(-6.3115)
STDEBT^2 0.1699*
(10.1794)
0.1554*
(11.9233)
0.1619*
(9.3764)
0.1519*
(7.5486)
0.1573*
(7.7803)
MATURITY -0.0143*
(-7.8463)
-0.0229*
(-13.3263)
-0.0199*
(-8.1467)
-0.0187*
(-8.9372)
-0.0204*
(-9.4481)
ROA 0.0013*
(23.0204)
0.0014*
(27.9783)
0.0013*
(15.4743)
0.0013*
(16.4918)
0.0013*
(16.7533)
SIZE -0.0056*
(-19.9847)
-0.0069*
(-23.8051)
-0.0064*
(-13.4053)
-0.0052*
(-17.8851)
-0.0057*
(-18.9515)

63
UNCONSOLIDATED -0.0337*
(-16.6954)
-0.0413*
(-18.1426)
-0.0444*
(-17.5101)
-0.0461*
(-12.0883)
-0.0441*
(-11.8418)
INDUSTRY 0.0013**
(1.5815)
0.0022**
(2.5735)
0.0068***
(1.9076)
0.0071**
(2.0476)
0.0064***
(1.8730)
CONCENTRATION 0.0019**
(2.0415)
0.0001
(0.1135)
0.0010
(1.2247)
-0.0021**
(-2.3338)
-0.0019**
(-2.1060)
TRANSITION 1C 0.0161*
(7.3144)
0.0150*
(6.5805)
0.0123*
(5.2558)
----
----.
TRANSITION 2C -0.0325*
(-27.4983)
-0.0369*
(-30.0172)
-0.0390*
(-15.1887)
----
----.
UNEMPLOYMENT -0.0001***
(-1.7545)
-0.0004*
(-6.2721)
----
----
----
WCAPITAL -0.1657*
(-36.1189)
-0.1632*
(-36.5138)
-0.1133**
(-3.4260)
-0.1161**
(-3.3116)
-0.1157**
(-3.3043)
DZSCORE -0.0271*
(-25.8328)
---- ----- ---- -----
Constant 0.1725*
(40.8339)
0.1888*
(41.1557)
0.1736*
(19.3396)
0.1347*
(21.2665)
0.1526*
(23.0949)
Nr observations 28,932 37,635 46,634 46634 46634
Adjusted R-squared 0.3159 0.2827 0.2359 0.2460 0.2501
Year Dummy NO NO NO NO YES
Country Dummy NO NO NO YES YES

64
Table 13: Short term debt turning point The table presents for each of the regressions from tables 9 to 11 (models 1 to 5) the ―turning point‖ e.g. maximum level of short term bank loans over total assets before cash
reserves start to increase. This value is calculated as :
^20 2 0STDebt STDebt
Cash
STDebt
Model 1 Model 2 Model 3 Model 4 Model 5
All
Panel A 0.3103 0.4726 0.4282 0.5028 0.5183
Panel B 0.2858 0.4407 0.4016 0.5028 0.5183
Panel C 0.3043 0.5258 0.5224 0.5028 0.5183
Public
Panel A 0.2829 0.3535 0.3390 0.3512 0.3665
Panel B 0.2408 0.3260 0.3215 0.3512 0.3665
Panel C 0.2466 0.3481 0.3524 0.3512 0.3665
Private
Panel A 0.3661 0.5788 0.5642 0.5885 0.6363
Panel B 0.3361 0.5686 0,5492 0.5885 0.6363
Panel C 0.3805 0.6263 0.6163 0.5885 0.6363