What covariance mechanisms underlie green red … · Vision Research 40 (2000) 613–628 What...
16
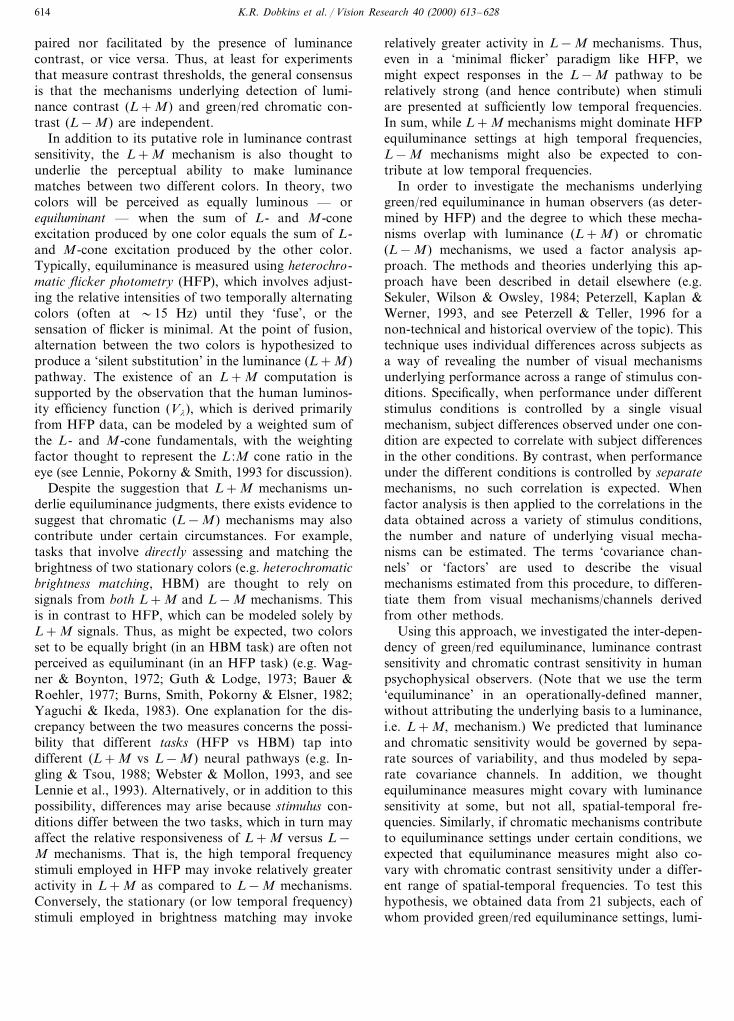
Vision Research 40 (2000) 613–628 What covariance mechanisms underlie green/red equiluminance, luminance contrast sensitivity and chromatic (green/red) contrast sensitivity? Karen R. Dobkins *, Karen L. Gunther, David H. Peterzell Department of Psychology, Uni6ersity of California, San Diego, La Jolla, CA 92093, USA Received 29 March 1999; received in revised form 16 September 1999 Abstract In order to investigate the mechanisms underlying green/red equiluminance matches in human observers and their relationship to mechanisms subserving luminance and/or chromatic (green/red) contrast sensitivity, we tested 21 human subjects along these dimensions at 16 different spatial and temporal frequencies (spatial frequency, 0.25 – 2 c/deg; temporal frequency, 2–16 Hz) and applied factor analysis to extract mechanisms underlying the data set. The results from our factor analysis revealed separate sources of variability for green/red equiluminance, luminance sensitivity and chromatic sensitivity, thus suggesting separate mechanisms underlying each of the three main conditions. When factor analysis was applied separately to green/red equiluminance data, two temporally-tuned factors were revealed (factor 1, 2–4 Hz; factor 2, 8–16 Hz), suggesting the existence of separate mechanisms underlying equiluminance settings at low versus high temporal frequencies. In addition, although the three main conditions remained separate in our factor analysis of the entire data set, our correlation matrix nonetheless revealed systematic correlations between equiluminance settings and luminance sensitivity at high temporal frequencies, and between equiluminance settings and chromatic sensitivity at low temporal frequencies. Taken together, these data suggest that the high temporal frequency factor underlying green/red equiluminance is governed predominantly by luminance mechanisms, while the low temporal frequency factor receives contribution from chromatic mechanisms. © 2000 Elsevier Science Ltd. All rights reserved. Keywords: Green – red equiluminance; Chromatic; Luminance; Individual differences; Factor analysis; Magnocellular and parvocellular pathways; Temporal and spatial contrast sensitivity www.elsevier.com/locate/visres 1. Introduction Theories of color vision typically posit three post-re- ceptoral ‘channels’, which are derived from the sums and differences of the three cone types. One channel, the ‘luminance’ channel, signals a weighted sum of long-wavelength-selective (L ) and medium-wavelength- selective (M) cones, i.e. L +M (with some debate re- garding the contribution of short-wavelength-selective (S ) cones). Two ‘chromatic’ channels signal weighted sums and differences of the cones. The green /red chro- matic channel signals differences between L - and M- cones (i.e. L – M). The tritan chromatic channel signals differences between S -cones and the sum of L - and M-cones (i.e. S -(L +M)). Here, we focus on only two of the three channels, the ‘luminance’ and ‘green/red chromatic’ channels. Many psychophysical and neurophysiological studies have investigated the degree to which these color sig- nals remain separate and independent throughout the visual pathway. In experiments using adaptation (e.g. Krauskopf, Williams & Heeley, 1982; Bradley, Switkes & De Valois, 1988), masking (e.g. Gegenfurtner & Kiper, 1992; Mullen & Losada, 1994, 1999; Sankeralli & Mullen, 1997; Giulianini & Eskew, 1998; but cf. Switkes, Bradley & De Valois, 1988) and summation (e.g. Cole, Stromeyer & Kronauer, 1990; Chaparro, Stromeyer, Kronauer & Eskew, 1994; Mullen, Cropper & Losada, 1997; Mullen & Sankeralli, 1999, but cf. Gur & Akri, 1992) paradigms, the detection of chromatic (green/red) stimuli at contrast threshold is neither im- * Corresponding author. Tel.: +1-858-534-5434. E-mail address: [email protected] (K.R. Dobkins) 0042-6989/00/$ - see front matter © 2000 Elsevier Science Ltd. All rights reserved. PII:S0042-6989(99)00211-4
Transcript of What covariance mechanisms underlie green red … · Vision Research 40 (2000) 613–628 What...
Vision Research 40 (2000) 613–628
What covariance mechanisms underlie green/red equiluminance,luminance contrast sensitivity and chromatic (green/red) contrast
sensitivity?
Karen R. Dobkins *, Karen L. Gunther, David H. PeterzellDepartment of Psychology, Uni6ersity of California, San Diego, La Jolla, CA 92093, USA
Received 29 March 1999; received in revised form 16 September 1999
Abstract
In order to investigate the mechanisms underlying green/red equiluminance matches in human observers and their relationshipto mechanisms subserving luminance and/or chromatic (green/red) contrast sensitivity, we tested 21 human subjects along thesedimensions at 16 different spatial and temporal frequencies (spatial frequency, 0.25–2 c/deg; temporal frequency, 2–16 Hz) andapplied factor analysis to extract mechanisms underlying the data set. The results from our factor analysis revealed separatesources of variability for green/red equiluminance, luminance sensitivity and chromatic sensitivity, thus suggesting separatemechanisms underlying each of the three main conditions. When factor analysis was applied separately to green/red equiluminancedata, two temporally-tuned factors were revealed (factor 1, 2–4 Hz; factor 2, 8–16 Hz), suggesting the existence of separatemechanisms underlying equiluminance settings at low versus high temporal frequencies. In addition, although the three mainconditions remained separate in our factor analysis of the entire data set, our correlation matrix nonetheless revealed systematiccorrelations between equiluminance settings and luminance sensitivity at high temporal frequencies, and between equiluminancesettings and chromatic sensitivity at low temporal frequencies. Taken together, these data suggest that the high temporal frequencyfactor underlying green/red equiluminance is governed predominantly by luminance mechanisms, while the low temporalfrequency factor receives contribution from chromatic mechanisms. © 2000 Elsevier Science Ltd. All rights reserved.
Keywords: Green–red equiluminance; Chromatic; Luminance; Individual differences; Factor analysis; Magnocellular and parvocellular pathways;Temporal and spatial contrast sensitivity
www.elsevier.com/locate/visres
1. Introduction
Theories of color vision typically posit three post-re-ceptoral ‘channels’, which are derived from the sumsand differences of the three cone types. One channel,the ‘luminance’ channel, signals a weighted sum oflong-wavelength-selective (L) and medium-wavelength-selective (M) cones, i.e. L+M (with some debate re-garding the contribution of short-wavelength-selective(S) cones). Two ‘chromatic’ channels signal weightedsums and differences of the cones. The green/red chro-matic channel signals differences between L- and M-cones (i.e. L–M). The tritan chromatic channel signalsdifferences between S-cones and the sum of L- and
M-cones (i.e. S− (L+M)). Here, we focus on only twoof the three channels, the ‘luminance’ and ‘green/redchromatic’ channels.
Many psychophysical and neurophysiological studieshave investigated the degree to which these color sig-nals remain separate and independent throughout thevisual pathway. In experiments using adaptation (e.g.Krauskopf, Williams & Heeley, 1982; Bradley, Switkes& De Valois, 1988), masking (e.g. Gegenfurtner &Kiper, 1992; Mullen & Losada, 1994, 1999; Sankeralli& Mullen, 1997; Giulianini & Eskew, 1998; but cf.Switkes, Bradley & De Valois, 1988) and summation(e.g. Cole, Stromeyer & Kronauer, 1990; Chaparro,Stromeyer, Kronauer & Eskew, 1994; Mullen, Cropper& Losada, 1997; Mullen & Sankeralli, 1999, but cf. Gur& Akri, 1992) paradigms, the detection of chromatic(green/red) stimuli at contrast threshold is neither im-
* Corresponding author. Tel.: +1-858-534-5434.E-mail address: [email protected] (K.R. Dobkins)
0042-6989/00/$ - see front matter © 2000 Elsevier Science Ltd. All rights reserved.
PII: S 0 0 4 2 -6989 (99 )00211 -4
K.R. Dobkins et al. / Vision Research 40 (2000) 613–628614
paired nor facilitated by the presence of luminancecontrast, or vice versa. Thus, at least for experimentsthat measure contrast thresholds, the general consensusis that the mechanisms underlying detection of lumi-nance contrast (L+M) and green/red chromatic con-trast (L−M) are independent.
In addition to its putative role in luminance contrastsensitivity, the L+M mechanism is also thought tounderlie the perceptual ability to make luminancematches between two different colors. In theory, twocolors will be perceived as equally luminous — orequiluminant — when the sum of L- and M-coneexcitation produced by one color equals the sum of L-and M-cone excitation produced by the other color.Typically, equiluminance is measured using heterochro-matic flicker photometry (HFP), which involves adjust-ing the relative intensities of two temporally alternatingcolors (often at �15 Hz) until they ‘fuse’, or thesensation of flicker is minimal. At the point of fusion,alternation between the two colors is hypothesized toproduce a ‘silent substitution’ in the luminance (L+M)pathway. The existence of an L+M computation issupported by the observation that the human luminos-ity efficiency function (Vl), which is derived primarilyfrom HFP data, can be modeled by a weighted sum ofthe L- and M-cone fundamentals, with the weightingfactor thought to represent the L :M cone ratio in theeye (see Lennie, Pokorny & Smith, 1993 for discussion).
Despite the suggestion that L+M mechanisms un-derlie equiluminance judgments, there exists evidence tosuggest that chromatic (L−M) mechanisms may alsocontribute under certain circumstances. For example,tasks that involve directly assessing and matching thebrightness of two stationary colors (e.g. heterochromaticbrightness matching, HBM) are thought to rely onsignals from both L+M and L−M mechanisms. Thisis in contrast to HFP, which can be modeled solely byL+M signals. Thus, as might be expected, two colorsset to be equally bright (in an HBM task) are often notperceived as equiluminant (in an HFP task) (e.g. Wag-ner & Boynton, 1972; Guth & Lodge, 1973; Bauer &Roehler, 1977; Burns, Smith, Pokorny & Elsner, 1982;Yaguchi & Ikeda, 1983). One explanation for the dis-crepancy between the two measures concerns the possi-bility that different tasks (HFP vs HBM) tap intodifferent (L+M vs L−M) neural pathways (e.g. In-gling & Tsou, 1988; Webster & Mollon, 1993, and seeLennie et al., 1993). Alternatively, or in addition to thispossibility, differences may arise because stimulus con-ditions differ between the two tasks, which in turn mayaffect the relative responsiveness of L+M versus L−M mechanisms. That is, the high temporal frequencystimuli employed in HFP may invoke relatively greateractivity in L+M as compared to L−M mechanisms.Conversely, the stationary (or low temporal frequency)stimuli employed in brightness matching may invoke
relatively greater activity in L−M mechanisms. Thus,even in a ‘minimal flicker’ paradigm like HFP, wemight expect responses in the L−M pathway to berelatively strong (and hence contribute) when stimuliare presented at sufficiently low temporal frequencies.In sum, while L+M mechanisms might dominate HFPequiluminance settings at high temporal frequencies,L−M mechanisms might also be expected to con-tribute at low temporal frequencies.
In order to investigate the mechanisms underlyinggreen/red equiluminance in human observers (as deter-mined by HFP) and the degree to which these mecha-nisms overlap with luminance (L+M) or chromatic(L−M) mechanisms, we used a factor analysis ap-proach. The methods and theories underlying this ap-proach have been described in detail elsewhere (e.g.Sekuler, Wilson & Owsley, 1984; Peterzell, Kaplan &Werner, 1993, and see Peterzell & Teller, 1996 for anon-technical and historical overview of the topic). Thistechnique uses individual differences across subjects asa way of revealing the number of visual mechanismsunderlying performance across a range of stimulus con-ditions. Specifically, when performance under differentstimulus conditions is controlled by a single visualmechanism, subject differences observed under one con-dition are expected to correlate with subject differencesin the other conditions. By contrast, when performanceunder the different conditions is controlled by separatemechanisms, no such correlation is expected. Whenfactor analysis is then applied to the correlations in thedata obtained across a variety of stimulus conditions,the number and nature of underlying visual mecha-nisms can be estimated. The terms ‘covariance chan-nels’ or ‘factors’ are used to describe the visualmechanisms estimated from this procedure, to differen-tiate them from visual mechanisms/channels derivedfrom other methods.
Using this approach, we investigated the inter-depen-dency of green/red equiluminance, luminance contrastsensitivity and chromatic contrast sensitivity in humanpsychophysical observers. (Note that we use the term‘equiluminance’ in an operationally-defined manner,without attributing the underlying basis to a luminance,i.e. L+M, mechanism.) We predicted that luminanceand chromatic sensitivity would be governed by sepa-rate sources of variability, and thus modeled by sepa-rate covariance channels. In addition, we thoughtequiluminance measures might covary with luminancesensitivity at some, but not all, spatial-temporal fre-quencies. Similarly, if chromatic mechanisms contributeto equiluminance settings under certain conditions, weexpected that equiluminance measures might also co-vary with chromatic contrast sensitivity under a differ-ent range of spatial-temporal frequencies. To test thishypothesis, we obtained data from 21 subjects, each ofwhom provided green/red equiluminance settings, lumi-
K.R. Dobkins et al. / Vision Research 40 (2000) 613–628 615
nance contrast sensitivity values and chromatic contrastsensitivity values at 16 different spatial-temporal fre-quencies. Factor analysis was then applied to the datato investigate the number and tuning of covariancechannels underlying the results.
2. Methods
2.1. Subjects
Twenty-two subjects (including the three authors)participated in these experiments. All subjects had nor-mal or corrected-to-normal vision, and normal green-red color vision (as assessed by the Ishihara Test forcolor deficiency). Subject age ranged from 18 to 41years (mean, 23 years; S.D., 6.5 years). One subject wasunable to provide reliable green/red equiluminance set-tings, and thus his data were excluded from our analy-ses. Data from 21 subjects were retained.
2.2. Apparatus
Visual stimuli were generated on a Nanao F2-21monitor (21 in. display, 1024×768 pixels, 105 Hz)driven by a Cambridge Research Systems (CRS) VideoBoard. The 15-bit video board allowed for 32 768 dis-crete luminance levels. The CIE (x, y) coordinates forthe monitor primaries were: red (0.625, 0.340), green(0.285, 0.605), and blue (0.150, 0.065). The maximumoutput for the monitor was calibrated to equal energywhite (CIE chromaticity coordinates=0.333, 0.333),and the voltage/luminance relationship was linearizedindependently for each of the three guns in the display,using a Gamma Correction System (‘OptiCal 265M’,purchased from CRS). A PR-650 SpectraColorimeter(Photoresearch) was used for spectroradiometric andphotometric measurements of our stimuli.
2.3. Stimuli
Stimuli consisted of horizontally-oriented, chromatic(green/red) and luminance (white/black) sinusoidalgratings, counterphase-reversed (temporal sinusoidal) at16 different combinations of spatial and temporal fre-quencies (SF=0.25, 0.5, 1, and 2 c/deg; TF=2, 4, 8,and 16 Hz). We chose to go no higher in spatialfrequency than 2 c/deg in order to avoid luminanceartifacts produced by chromatic aberration (Flitcroft,1989; Logothetis, Schiller, Charles & Hurlbert, 1990;Cavanagh & Anstis, 1991). Gratings subtended 5.4° ofvisual angle, and were convolved with a Gaussian circu-lar envelope (Gabor standard deviation=2.7°) to elim-inate spatial edges. Gratings were presented with thezero-crossing positioned in the center of the stimulus toensure equal number of light and dark (or green and
red) bars in the stimulus. Note that because stimulussize was held constant across all conditions, the totalnumber of cycles necessarily varied across differentspatial frequencies.
All gratings (chromatic and luminance) were modu-lated through equal energy white (CIE=0.333, 0.333)at 28 cd/m2, and were of the same mean chromaticityand luminance as the background. Chromatic (green/red) gratings were created to selectively modulate activ-ity within L- and M-cones, while keeping the S-coneexcitation constant (S-cone activation=approximately1.0 units in MacLeod-Boynton chromaticity space, nor-malized to equal energy white, see Boynton, 1996).Chromatic gratings were employed for the purpose ofobtaining: (1) green/red equiluminance settings; and (2)chromatic contrast sensitivities. Luminance (white/black) gratings were produced by sinusoidally modulat-ing the luminance of the white background, and wereemployed for the purpose of obtaining luminance con-trast sensitivities. The contrast of all gratings is de-scribed in terms of the root-mean-square (r.m.s.) conecontrast produced in L- and M-cones (described be-low). The benefit of a cone contrast metric is that itstandardizes across apparati and laboratories, and al-lows for the expression of chromatic and luminancecontrast in comparable units (e.g. Mullen, 1985; Lennie& D’Zmura, 1988; Chaparro, Stromeyer, Huang, Kro-nauer & Eskew, 1993).
2.3.1. Cone contrast calculationsAlthough our monitor calibration allowed us to
specify any desired cone contrast, we nonetheless usedthe PR-650 SpectraColorimeter to confirm the L- andM-cone contrasts produced by our stimuli. For Vl-equiluminant stimuli, L- and M-cone excitations pro-duced by the ‘green’ peak (L(g,V
l), M(g,V
l)) and ‘red’
peak (L(r,Vl), M(r,V
l)) of the gratings were obtained by
integrating the product of stimulus spectral output(readings taken in 4 nm intervals from 380 to 780 nm)with the Stockman, MacLeod and Johnson (1993) L-and M-cone fundamentals for 2° stimuli. For stimulidiffering from Vl equiluminance, we obtained L- andM-cone excitations produced by the green (Lg, Mg) andred (Lr, Mr) peaks of the stimulus, using the followingformulas:
Lg= (G/GVl)�L(g,V
l) (1a)
Mg= (G/GVl)�M(g,V
l) (1b)
Lr= (R/RVl)�L(r,V
l) (1c)
Mr= (R/RVl)�M(r,V
l) (1d)
where L(g,Vl), M(g,V
l), L(r,V
l) and M(r,V
l) refer to the cone
excitations produced by the green and red peaks in theVl-equiluminant stimulus (as determined above), GV
l
and RVl
are the green and red luminances of those
K.R. Dobkins et al. / Vision Research 40 (2000) 613–628616
Vl-equiluminant stimuli (which are necessarily equal toone another), and G and R are the green and redluminances that are not Vl-equiluminant. The use ofthis formula circumvented the need to measure thespectral output for different green/red pairs employedin these studies. The validity of these equations wasverified empirically for several green/red stimulus pairs.Cone excitations were used to compute L- and M-conecontrasts (CC): LCC= (Lg−Lr)/(Lg+Lr), MCC=(Mg−Mr)/(Mg+Mr). From these values, root-mean-square cone contrasts (r.m.s. CC=sqrt[(MCC
2 +LCC
2 )/2]) were determined. For luminance stimuli, r.m.s.cone contrasts directly correspond to conventionalMichelson contrast: [(Luminancemax−Luminancemin)/(Luminancemax+Luminancemin)].
Note that our calculation of cone excitations relieson the use of cone fundamentals for the ‘standard’observer (as determined by Stockman et al., 1993).Because cone fundamentals are expected to differ some-what across individuals (based on differences acrosssubjects in lmax, photopigment optical density, as wellas lens and macular pigment), there will be some errorin cone excitations derived from a standard set of conefundamentals for all subjects (see Bieber, Kraft &Werner, 1998). In addition, because relative L- versusM-cone weights and phase-lags can vary with stimulusparameters such as spatial-temporal frequency andbackground chromaticity (e.g. Hamer & Tyler, 1992;Stromeyer, Chaparro, Tolias & Kronauer, 1997), usinga standard set of cone fundamentals to determine thecone excitations elicited across a range of stimulusparameters can also introduce error into estimates.Although we cannot rule out such error, we expect it tobe quite small since our equal energy white backgroundis roughly metameric (in terms of the relative excitationof L- and M-cones) with a 570 nm light, a wavelengthwhich reportedly does not produce variability in theresponses of L- and M-cones as a function of spatial-temporal frequency (Stromeyer et al., 1997).
2.4. Paradigm
2.4.1. GeneralFor all portions of these experiments, subjects were
tested in a dark room and viewed the video displaybinocularly from a chin rest situated 57 cm away.Subjects were instructed to maintain fixation on a smallcentral cross, and provide perceptual reports via key-presses on a response box. No feedback was provided.Three main conditions were tested: (1) green/red equilu-minance [G/R-EQUIL]; (2) luminance contrast sensitiv-ity [LUM-CS]; and (3) chromatic contrast sensitivity[CHROM-CS]. Data for these three main conditionswere obtained at each of 16 different spatial-temporalfrequencies. Thus, for the entire experiment, each sub-ject provided 48 data points (16 G/R-EQUIL, 16
LUM-CS and 16 CHROM-CS), derived from a total ofat least 4000 trials. For each subject, 10–12 h wererequired to complete the entire experiment, with testingdivided into 1–2 h blocks.
2.4.2. Determining green/red equiluminance inindi6idual subjects
Standard HFP was used to obtain equiluminancepoints in individual subjects. Chromatic (green/red)counterphase gratings were centered on the fixationcross, and the luminance ratio of the grating wasadjusted with a key press. Luminance ratio is defined asG/R, where ‘G/R=1.0’ denotes Vl equiluminance, ‘G/R\1.0’ denotes green more luminous than red, and‘G/RB1.0’ denotes red more luminous than green. Oneach trial, subjects adjusted the G/R luminance ratio(interval step=1.2% change in G/R ratio) of the grat-ing until the percept of flicker was least salient. Thechromatic gratings employed for determining equilumi-nance produced 7.10% r.m.s. cone contrast in L- andM-cones (at Vl equiluminance). This cone contrastvalue was 5.1× the mean chromatic contrast threshold(averaged across all spatial-temporal frequency condi-tions), and ranged from 1.4× threshold for high fre-quency (i.e. 16 Hz, 2 c/deg) gratings to 8.7× thresholdfor low frequency (i.e. 2 Hz, 0.25 c/deg) gratings.
For each subject, equiluminance points were deter-mined from the mean of 20 trials, separately at each ofthe 16 different spatial-temporal frequency conditions(‘outlier’ trials were excluded if they were greater than2.5 S.D. from a subject’s mean on a particular condi-tion). Mean equiluminance values obtained in this man-ner were used to set the G/R luminance ratio for eachsubject when tested in the CHROM-CS condition (seebelow).
2.4.3. Contrast sensiti6ity paradigmContrast sensitivity was determined for both lumi-
nance and chromatic stimuli, at each of the 16 differentspatial-temporal frequencies. To this end, a Best-PESTstaircase procedure (Lieberman & Pentland, 1982) wasemployed in a spatial two-alternative forced-choiceparadigm. On each trial, the stimulus appeared centered2.5° to the left or right of fixation, and the subjectreported its location via a key press on a response box.Stimuli were presented for 300 ms, with contrastramped on and off in a cosine fashion within the firstand last 100 ms. The staircase procedure continueduntil the subject had completed at least 120 trials foreach stimulus condition. Contrast sensitivity measure-ments were divided into four different blocks. Eachblock contained four chromatic stimuli (chosen ran-domly out of the 16 different spatial-temporal frequen-cies) and four luminance stimuli (also chosen randomlyout of the 16 spatial-temporal frequencies), for a totalof eight stimulus conditions per block.
K.R. Dobkins et al. / Vision Research 40 (2000) 613–628 617
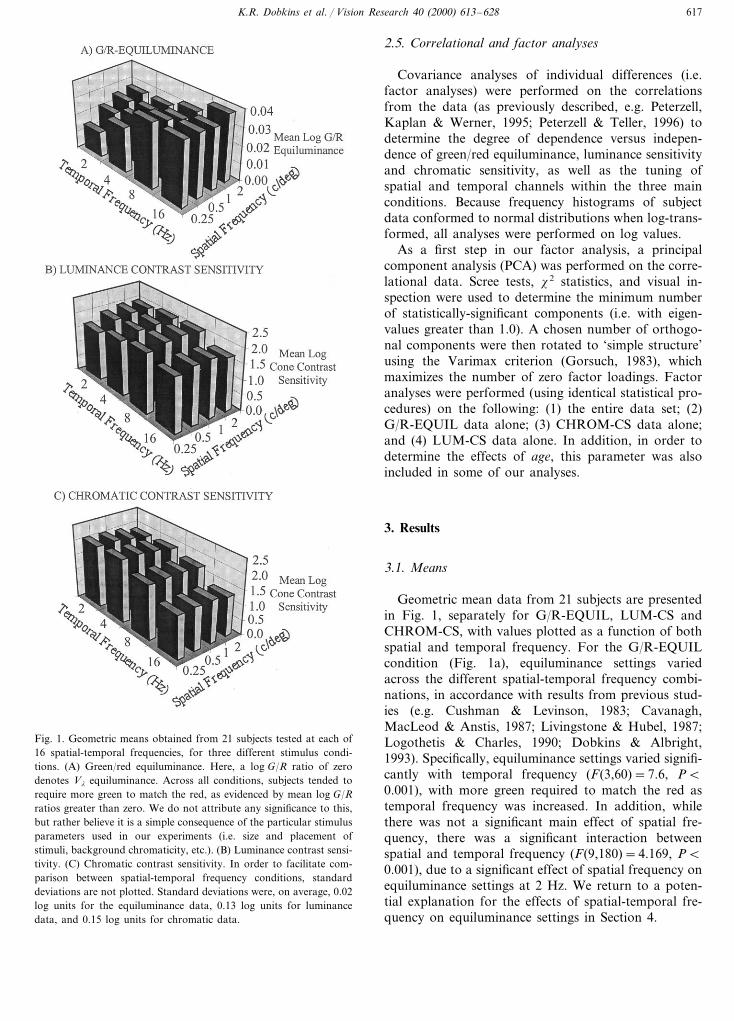
Fig. 1. Geometric means obtained from 21 subjects tested at each of16 spatial-temporal frequencies, for three different stimulus condi-tions. (A) Green/red equiluminance. Here, a log G/R ratio of zerodenotes Vl equiluminance. Across all conditions, subjects tended torequire more green to match the red, as evidenced by mean log G/Rratios greater than zero. We do not attribute any significance to this,but rather believe it is a simple consequence of the particular stimulusparameters used in our experiments (i.e. size and placement ofstimuli, background chromaticity, etc.). (B) Luminance contrast sensi-tivity. (C) Chromatic contrast sensitivity. In order to facilitate com-parison between spatial-temporal frequency conditions, standarddeviations are not plotted. Standard deviations were, on average, 0.02log units for the equiluminance data, 0.13 log units for luminancedata, and 0.15 log units for chromatic data.
2.5. Correlational and factor analyses
Covariance analyses of individual differences (i.e.factor analyses) were performed on the correlationsfrom the data (as previously described, e.g. Peterzell,Kaplan & Werner, 1995; Peterzell & Teller, 1996) todetermine the degree of dependence versus indepen-dence of green/red equiluminance, luminance sensitivityand chromatic sensitivity, as well as the tuning ofspatial and temporal channels within the three mainconditions. Because frequency histograms of subjectdata conformed to normal distributions when log-trans-formed, all analyses were performed on log values.
As a first step in our factor analysis, a principalcomponent analysis (PCA) was performed on the corre-lational data. Scree tests, x2 statistics, and visual in-spection were used to determine the minimum numberof statistically-significant components (i.e. with eigen-values greater than 1.0). A chosen number of orthogo-nal components were then rotated to ‘simple structure’using the Varimax criterion (Gorsuch, 1983), whichmaximizes the number of zero factor loadings. Factoranalyses were performed (using identical statistical pro-cedures) on the following: (1) the entire data set; (2)G/R-EQUIL data alone; (3) CHROM-CS data alone;and (4) LUM-CS data alone. In addition, in order todetermine the effects of age, this parameter was alsoincluded in some of our analyses.
3. Results
3.1. Means
Geometric mean data from 21 subjects are presentedin Fig. 1, separately for G/R-EQUIL, LUM-CS andCHROM-CS, with values plotted as a function of bothspatial and temporal frequency. For the G/R-EQUILcondition (Fig. 1a), equiluminance settings variedacross the different spatial-temporal frequency combi-nations, in accordance with results from previous stud-ies (e.g. Cushman & Levinson, 1983; Cavanagh,MacLeod & Anstis, 1987; Livingstone & Hubel, 1987;Logothetis & Charles, 1990; Dobkins & Albright,1993). Specifically, equiluminance settings varied signifi-cantly with temporal frequency (F(3,60)=7.6, PB0.001), with more green required to match the red astemporal frequency was increased. In addition, whilethere was not a significant main effect of spatial fre-quency, there was a significant interaction betweenspatial and temporal frequency (F(9,180)=4.169, PB0.001), due to a significant effect of spatial frequency onequiluminance settings at 2 Hz. We return to a poten-tial explanation for the effects of spatial-temporal fre-quency on equiluminance settings in Section 4.
K.R. Dobkins et al. / Vision Research 40 (2000) 613–628618
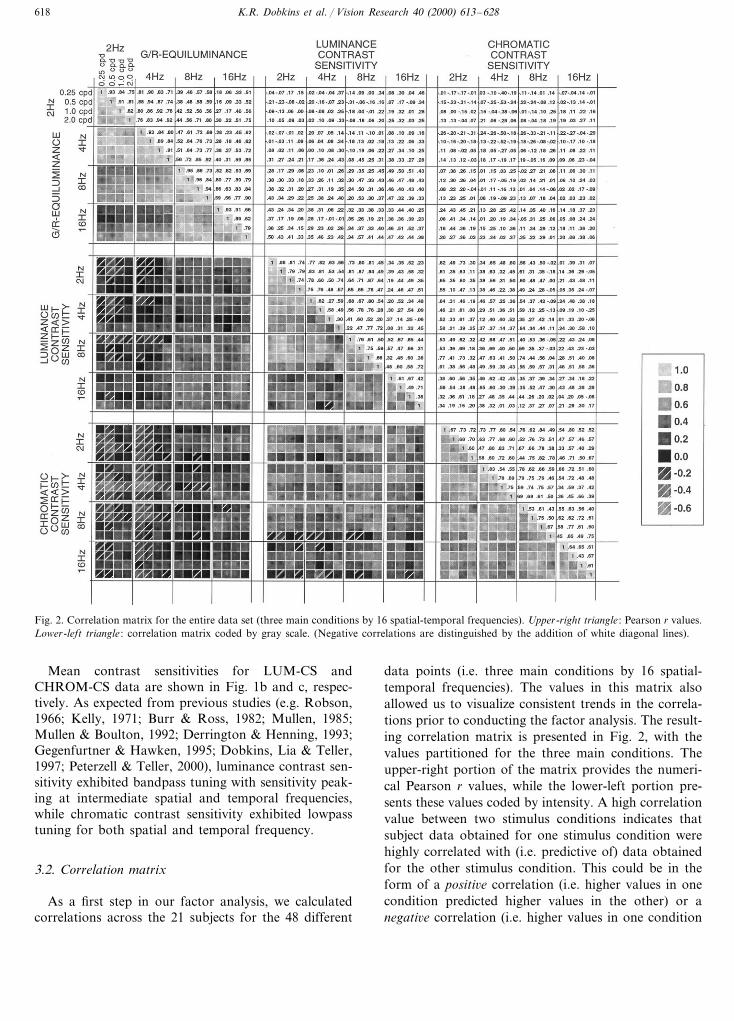
Fig. 2. Correlation matrix for the entire data set (three main conditions by 16 spatial-temporal frequencies). Upper-right triangle : Pearson r values.Lower-left triangle : correlation matrix coded by gray scale. (Negative correlations are distinguished by the addition of white diagonal lines).
Mean contrast sensitivities for LUM-CS andCHROM-CS data are shown in Fig. 1b and c, respec-tively. As expected from previous studies (e.g. Robson,1966; Kelly, 1971; Burr & Ross, 1982; Mullen, 1985;Mullen & Boulton, 1992; Derrington & Henning, 1993;Gegenfurtner & Hawken, 1995; Dobkins, Lia & Teller,1997; Peterzell & Teller, 2000), luminance contrast sen-sitivity exhibited bandpass tuning with sensitivity peak-ing at intermediate spatial and temporal frequencies,while chromatic contrast sensitivity exhibited lowpasstuning for both spatial and temporal frequency.
3.2. Correlation matrix
As a first step in our factor analysis, we calculatedcorrelations across the 21 subjects for the 48 different
data points (i.e. three main conditions by 16 spatial-temporal frequencies). The values in this matrix alsoallowed us to visualize consistent trends in the correla-tions prior to conducting the factor analysis. The result-ing correlation matrix is presented in Fig. 2, with thevalues partitioned for the three main conditions. Theupper-right portion of the matrix provides the numeri-cal Pearson r values, while the lower-left portion pre-sents these values coded by intensity. A high correlationvalue between two stimulus conditions indicates thatsubject data obtained for one stimulus condition werehighly correlated with (i.e. predictive of) data obtainedfor the other stimulus condition. This could be in theform of a positi6e correlation (i.e. higher values in onecondition predicted higher values in the other) or anegati6e correlation (i.e. higher values in one condition
K.R. Dobkins et al. / Vision Research 40 (2000) 613–628 619
predicted lower values in the other). Low (near zero)values indicate that there was little correlation betweenconditions.
As can be observed in the correlation matrix, thehighest correlations were found within each of thethree main conditions (i.e. G/R-EQUIL, LUM-CS,CHROM-CS). For example, correlations were positiveand uniformly high within the CHROM-CS condition,indicating that a subject who was more sensitive thanothers at one spatial-temporal frequency was typicallymore sensitive at all spatial-temporal frequencies. Agenerally similar pattern was observed for the LUM-CS condition, although relatively low correlations wereobserved between high (i.e. 16 Hz) and low (i.e. 2–4Hz) temporal frequencies. This pattern suggests theexistence of separate temporally-tuned mechanisms forLUM-CS, which is supported by the results of ourfactor analyses (below). For G/R-EQUIL data, thiseffect of temporal frequency was even more pro-nounced. Here, high positive correlations were foundseparately at low (i.e. 2–4 Hz) and at high (i.e. 8–16Hz) temporal frequencies, yet correlations between thetwo temporal frequency ranges were quite low. Thispattern in the correlation data indicates that a sub-ject’s equiluminance point at 2 Hz could be used topredict her equiluminance point at 4 Hz, but not at 8or 16 Hz (or vice versa).
Compared to the correlations observed within condi-tions, correlations across the three main conditionswere typically much lower, indicating that performancein one condition (e.g. LUM-CS) was not, in general, agood predictor of performance in the other two condi-tions (e.g. G/R-EQUIL or CHROM-CS). Noted ex-ceptions to this can be found, however. For example,G/R-EQUIL data at higher temporal frequencies (8and 16 Hz) correlated moderately with LUM-CS atthese same temporal frequencies (which can be ob-served by the relatively higher numbers and lightersquares in the high temporal frequency region of theG/R-EQUIL vs LUM-CS matrix). This indicates thata subject who, relative to others, required more greento match the red also tended to exhibit higher lumi-nance contrast sensitivity. In addition, there existedmoderate and systematic negati6e correlations betweenG/R-EQUIL and CHROM-CS at lower temporal (i.e.2 and 4 Hz) and lower spatial (i.e. 0.25 and 0.5 c/deg)frequencies. This indicates that a subject who requiredgreen more luminous than red (relative to others)tended to exhibit lower-than-average chromatic con-trast sensitivity under these spatial-temporal condi-tions. We return to the potential significance of thesecorrelations across the three main conditions in Sec-tion 4. (Also note that there were negative correlationsbetween G/R-EQUIL and LUM-CS, although thesevalues were smaller and less consistent. In addition,note that positive correlations between LUM-CS andCHROM-CS were generally low and not systematic.)
In sum, these results demonstrate that the highestcorrelations exist within the three main conditions, al-though some systematic correlations do appear to existacross conditions. To investigate these relationshipsfurther, we turn to the results of factor analysis, aprocedure that investigates statistically the covariancestructure of the data.
3.3. Factor analyses
3.3.1. Factor analysis of entire data setThe results from our factor analysis of the entire
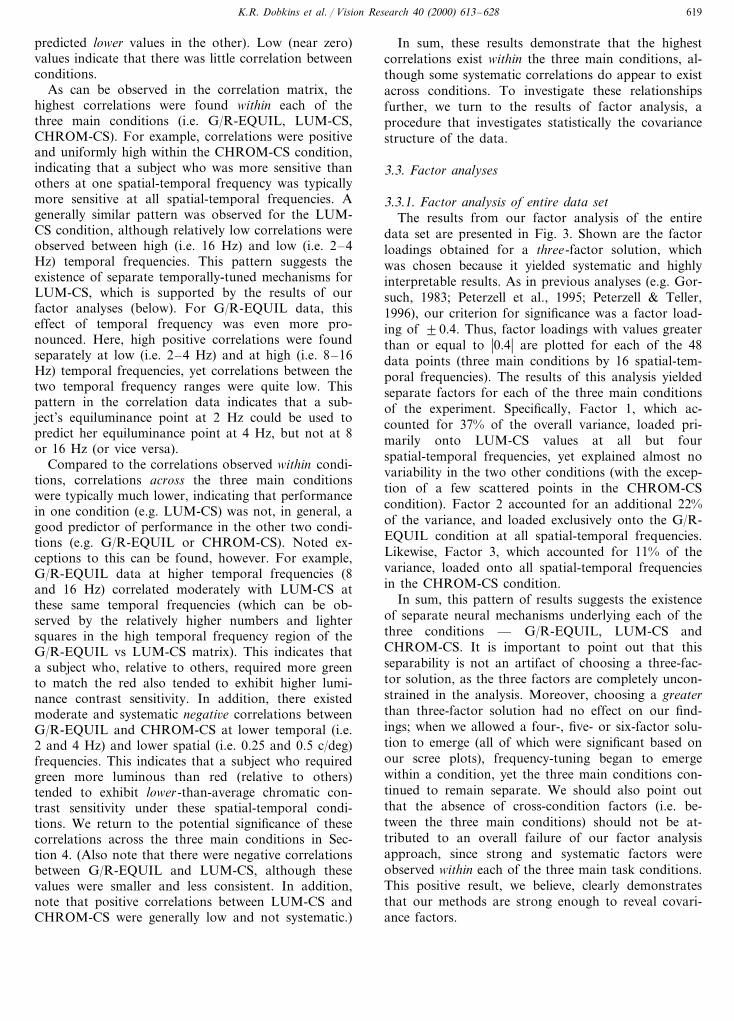
data set are presented in Fig. 3. Shown are the factorloadings obtained for a three-factor solution, whichwas chosen because it yielded systematic and highlyinterpretable results. As in previous analyses (e.g. Gor-such, 1983; Peterzell et al., 1995; Peterzell & Teller,1996), our criterion for significance was a factor load-ing of 90.4. Thus, factor loadings with values greaterthan or equal to �0.4� are plotted for each of the 48data points (three main conditions by 16 spatial-tem-poral frequencies). The results of this analysis yieldedseparate factors for each of the three main conditionsof the experiment. Specifically, Factor 1, which ac-counted for 37% of the overall variance, loaded pri-marily onto LUM-CS values at all but fourspatial-temporal frequencies, yet explained almost novariability in the two other conditions (with the excep-tion of a few scattered points in the CHROM-CScondition). Factor 2 accounted for an additional 22%of the variance, and loaded exclusively onto the G/R-EQUIL condition at all spatial-temporal frequencies.Likewise, Factor 3, which accounted for 11% of thevariance, loaded onto all spatial-temporal frequenciesin the CHROM-CS condition.
In sum, this pattern of results suggests the existenceof separate neural mechanisms underlying each of thethree conditions — G/R-EQUIL, LUM-CS andCHROM-CS. It is important to point out that thisseparability is not an artifact of choosing a three-fac-tor solution, as the three factors are completely uncon-strained in the analysis. Moreover, choosing a greaterthan three-factor solution had no effect on our find-ings; when we allowed a four-, five- or six-factor solu-tion to emerge (all of which were significant based onour scree plots), frequency-tuning began to emergewithin a condition, yet the three main conditions con-tinued to remain separate. We should also point outthat the absence of cross-condition factors (i.e. be-tween the three main conditions) should not be at-tributed to an overall failure of our factor analysisapproach, since strong and systematic factors wereobserved within each of the three main task conditions.This positive result, we believe, clearly demonstratesthat our methods are strong enough to reveal covari-ance factors.
K.R. Dobkins et al. / Vision Research 40 (2000) 613–628620
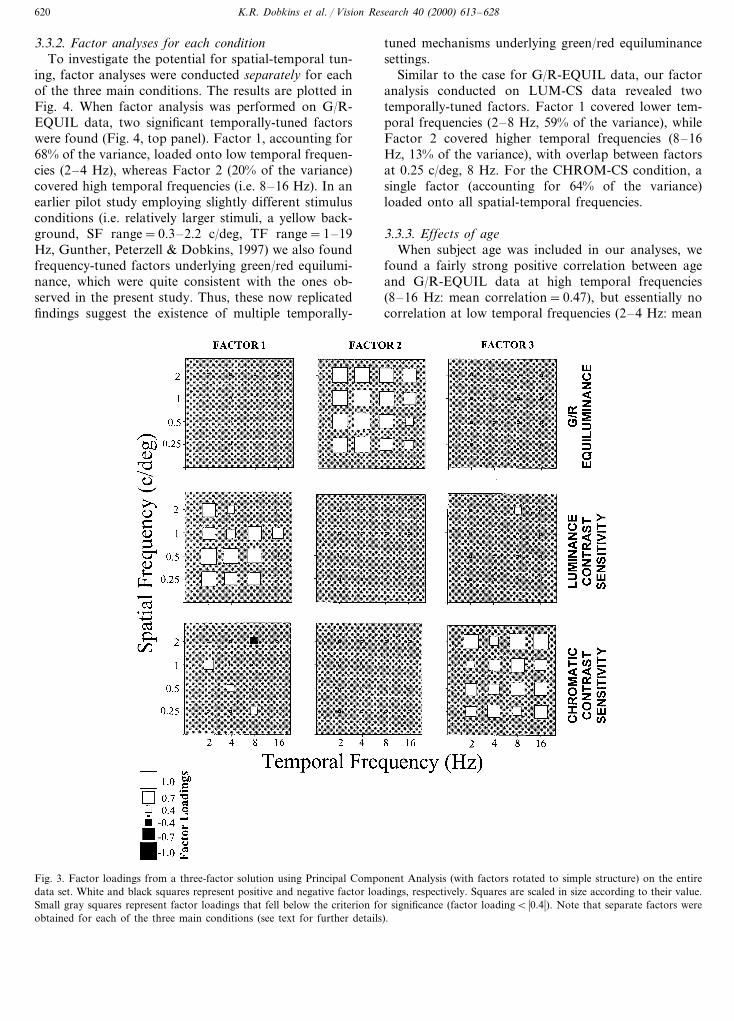
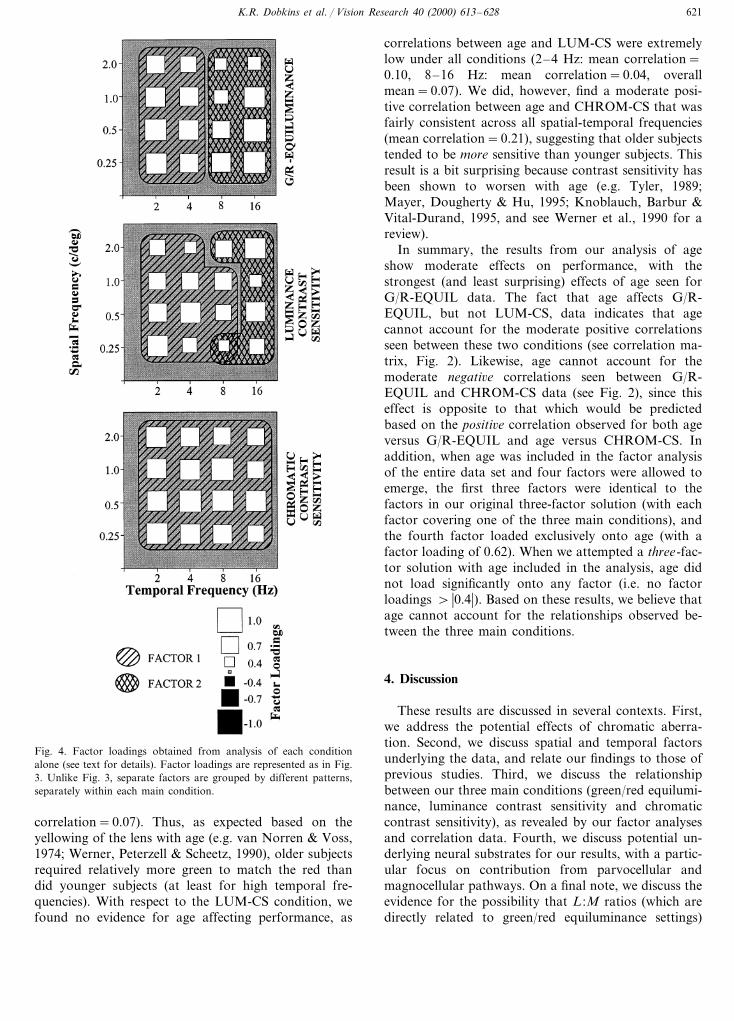
3.3.2. Factor analyses for each conditionTo investigate the potential for spatial-temporal tun-
ing, factor analyses were conducted separately for eachof the three main conditions. The results are plotted inFig. 4. When factor analysis was performed on G/R-EQUIL data, two significant temporally-tuned factorswere found (Fig. 4, top panel). Factor 1, accounting for68% of the variance, loaded onto low temporal frequen-cies (2–4 Hz), whereas Factor 2 (20% of the variance)covered high temporal frequencies (i.e. 8–16 Hz). In anearlier pilot study employing slightly different stimulusconditions (i.e. relatively larger stimuli, a yellow back-ground, SF range=0.3–2.2 c/deg, TF range=1–19Hz, Gunther, Peterzell & Dobkins, 1997) we also foundfrequency-tuned factors underlying green/red equilumi-nance, which were quite consistent with the ones ob-served in the present study. Thus, these now replicatedfindings suggest the existence of multiple temporally-
tuned mechanisms underlying green/red equiluminancesettings.
Similar to the case for G/R-EQUIL data, our factoranalysis conducted on LUM-CS data revealed twotemporally-tuned factors. Factor 1 covered lower tem-poral frequencies (2–8 Hz, 59% of the variance), whileFactor 2 covered higher temporal frequencies (8–16Hz, 13% of the variance), with overlap between factorsat 0.25 c/deg, 8 Hz. For the CHROM-CS condition, asingle factor (accounting for 64% of the variance)loaded onto all spatial-temporal frequencies.
3.3.3. Effects of ageWhen subject age was included in our analyses, we
found a fairly strong positive correlation between ageand G/R-EQUIL data at high temporal frequencies(8–16 Hz: mean correlation=0.47), but essentially nocorrelation at low temporal frequencies (2–4 Hz: mean
Fig. 3. Factor loadings from a three-factor solution using Principal Component Analysis (with factors rotated to simple structure) on the entiredata set. White and black squares represent positive and negative factor loadings, respectively. Squares are scaled in size according to their value.Small gray squares represent factor loadings that fell below the criterion for significance (factor loadingB �0.4�). Note that separate factors wereobtained for each of the three main conditions (see text for further details).
K.R. Dobkins et al. / Vision Research 40 (2000) 613–628 621
Fig. 4. Factor loadings obtained from analysis of each conditionalone (see text for details). Factor loadings are represented as in Fig.3. Unlike Fig. 3, separate factors are grouped by different patterns,separately within each main condition.
correlations between age and LUM-CS were extremelylow under all conditions (2–4 Hz: mean correlation=0.10, 8–16 Hz: mean correlation=0.04, overallmean=0.07). We did, however, find a moderate posi-tive correlation between age and CHROM-CS that wasfairly consistent across all spatial-temporal frequencies(mean correlation=0.21), suggesting that older subjectstended to be more sensitive than younger subjects. Thisresult is a bit surprising because contrast sensitivity hasbeen shown to worsen with age (e.g. Tyler, 1989;Mayer, Dougherty & Hu, 1995; Knoblauch, Barbur &Vital-Durand, 1995, and see Werner et al., 1990 for areview).
In summary, the results from our analysis of ageshow moderate effects on performance, with thestrongest (and least surprising) effects of age seen forG/R-EQUIL data. The fact that age affects G/R-EQUIL, but not LUM-CS, data indicates that agecannot account for the moderate positive correlationsseen between these two conditions (see correlation ma-trix, Fig. 2). Likewise, age cannot account for themoderate negati6e correlations seen between G/R-EQUIL and CHROM-CS data (see Fig. 2), since thiseffect is opposite to that which would be predictedbased on the positi6e correlation observed for both ageversus G/R-EQUIL and age versus CHROM-CS. Inaddition, when age was included in the factor analysisof the entire data set and four factors were allowed toemerge, the first three factors were identical to thefactors in our original three-factor solution (with eachfactor covering one of the three main conditions), andthe fourth factor loaded exclusively onto age (with afactor loading of 0.62). When we attempted a three-fac-tor solution with age included in the analysis, age didnot load significantly onto any factor (i.e. no factorloadings \ �0.4�). Based on these results, we believe thatage cannot account for the relationships observed be-tween the three main conditions.
4. Discussion
These results are discussed in several contexts. First,we address the potential effects of chromatic aberra-tion. Second, we discuss spatial and temporal factorsunderlying the data, and relate our findings to those ofprevious studies. Third, we discuss the relationshipbetween our three main conditions (green/red equilumi-nance, luminance contrast sensitivity and chromaticcontrast sensitivity), as revealed by our factor analysesand correlation data. Fourth, we discuss potential un-derlying neural substrates for our results, with a partic-ular focus on contribution from parvocellular andmagnocellular pathways. On a final note, we discuss theevidence for the possibility that L :M ratios (which aredirectly related to green/red equiluminance settings)
correlation=0.07). Thus, as expected based on theyellowing of the lens with age (e.g. van Norren & Voss,1974; Werner, Peterzell & Scheetz, 1990), older subjectsrequired relatively more green to match the red thandid younger subjects (at least for high temporal fre-quencies). With respect to the LUM-CS condition, wefound no evidence for age affecting performance, as
K.R. Dobkins et al. / Vision Research 40 (2000) 613–628622
may place constraints on both luminance and chro-matic contrast detection.
4.1. Chromatic aberration
Although our use of spatial frequencies 52 c/degshould preclude the existence of luminance artifactsarising from chromatic aberration of the eye (Flitcroft,1989; Logothetis et al., 1990; Cavanagh & Anstis,1991), we nonetheless address the potential effects ofthis phenomenon had it existed. First, because ourstimuli were presented near the fovea, the effects oftransverse (i.e. lateral) chromatic aberration are ex-pected to be negligible. Longitudinal chromatic aberra-tion, on the other hand, can produce luminancecontrast on the retina if a subject accommodates to oneof the two endpoint colors of the grating instead of tothe midpoint/background color. For example, accom-modating to the red peak of the chromatic grating willcause the green portion to be de-focused and thusattenuated in contrast. It is important to remember,however, that subjects were required to set the green/red grating to be equiluminant (using HFP). Thus, ifdifferential accommodation occurred (for example, tored), the equiluminance procedure would allow thesubject to compensate by increasing the luminance ofthe green. This resulting green/red value would then beappropriately used in the chromatic contrast sensitivitycondition. Moreover, had subjects been using lumi-nance contrast (as a result of chromatic aberration) todetect the green/red gratings, we would have expectedsystematic correlations between luminance and chro-matic contrast sensitivity at high spatial frequencies, apattern that is not seen in the correlation matrix orfactor analyses. For these reasons, we feel confidentthat, even had chromatic aberration existed, it did notcontribute to our results.
4.2. Temporal and spatial channels underlying contrastdetection
Several previous studies have demonstrated temporaland spatial channels underlying contrast detection ofluminance and chromatic contrast. With respect totemporal channels for luminance detection, results frommasking, summation and temporal frequency discrimi-nation paradigms point to the existence of two to fourtemporal-frequency-tuned channels (King-Smith & Ku-likowski, 1975; Tyler, 1975; Mandler & Makous, 1984;Moulden, Renshaw & Mather, 1984; Anderson & Burr,1985; Lehky, 1985; Tyler, 1989; Hammett & Smith,1992; Hess & Snowden, 1992; Metha & Mullen, 1996).In addition, results from previous studies employingfactor analyses on luminance contrast sensitivity dataalso suggest the existence of two to three temporalchannels (Mayer et al., 1995; Billock & Harding, 1996;
Peterzell, Dougherty & Billock, 1996a; Peterzell, Kelly,Chang, Gordon, Omaljev & Teller, 1996b; Peterzell,Chang, Kelly, Hartzler & Teller, 1997a; Peterzell,Dougherty & Mayer, 1997b). In the present study, ourfactor analyses revealed two temporal factors underly-ing luminance contrast detection (one loading onto 2–8Hz, the other loading onto 8–16 Hz, see Fig. 4, middlepanel), thus supporting the general consensus that atleast two mechanisms underlie temporal sensitivity forluminance stimuli.
For chromatic stimuli, the number of temporal chan-nels underlying contrast detection has been relativelyless explored. In one recent study employing temporalfrequency detection and discrimination techniques, twotemporal channels (one lowpass, one bandpass) ap-peared to underlie chromatic (green/red) sensitivity(Metha & Mullen, 1996). By contrast, our factor analy-ses revealed only a single temporal factor underlyingchromatic contrast sensitivity (Fig. 4, bottom panel).Clearly, more studies in the chromatic domain will berequired to resolve this issue.
With respect to spatial channels, the results of ourfactor analyses were somewhat surprising because theyyielded no spatial factors for either luminance or chro-matic contrast sensitivity data across the range of spa-tial frequencies tested (0.25–2 c/deg). These results areat odds with the sizeable literature obtained from mask-ing, summation and adaptation paradigms, which sup-ports at least two spatial channels below 2 c/deg forboth luminance (e.g. Tolhurst, 1973; Greenlee, Mag-nussen & Norby, 1988) and chromatic (e.g. Losada &Mullen, 1994; Mullen & Losada, 1994) stimuli, and forboth stationary and counterphase-reversing gratings(see Graham, 1989 for a review). Previous factor ana-lytic studies using stationary luminance-modulated grat-ings have reported multiple factors consistent with themasking, summation and adaptation literature (Sekuleret al., 1984; Peterzell & Teller, 1996, 2000). By contrast,studies that have applied factor analysis to data ob-tained for counterphase luminance-modulated gratingsreport only a single spatial covariance channel below 2c/deg (Billock & Harding, 1996, data re-analyzed byPeterzell et al., 1996), as is the case in the present factoranalysis. For chromatic stimuli, results from the factoranalyses of Peterzell and Teller (1996, 2000) agree withour findings of a single spatial covariancechannel below 2 c/deg. As such, the factor analyticresults for both stationary and counterphase chromaticgratings, although consistent with each other, are in-consistent with results obtained using more traditionalmethods.
It should also be pointed out that the factor analysisapproach may yield fewer factors than do other meth-ods (e.g. adaptation) if the channels revealed by theseother techniques are, in fact, correlated. That is, asingle covariance channel may represent a group of
K.R. Dobkins et al. / Vision Research 40 (2000) 613–628 623
intercorrelated channels that reveal their individualidentities in adaptation studies (see Peterzell & Teller,1996 for further discussion). This could occur if allchannels are manufactured from common inputs, forexample, from common subcortical inputs to differentclasses of frequency-tuned cortical cells, and adaptationoccurs at the cortical level only. In order to moredirectly test this possibility, it will be important tosystematically evaluate results obtained under differentparadigms (e.g. the factor analysis approach vs anadaptation paradigm), being careful to use identicalstimulus conditions and subjects across studies.
4.3. Relationship between green/red equiluminance,luminance contrast sensiti6ity and chromatic contrastsensiti6ity
When our factor analysis was performed on theentire data set, we found three main factors, eachloading separately onto one of the three main condi-tions: green/red equiluminance, luminance contrast sen-sitivity and chromatic contrast sensitivity (Fig. 3). Theindependence between luminance contrast sensitivityand chromatic (green/red) sensitivity observed in ourdata set confirms reports from previous psychophysicalstudies that have employed adaptation, masking orsummation paradigms (Krauskopf et al., 1982; Bradleyet al., 1988; Cole et al., 1990; Gegenfurtner & Kiper,1992; Chaparro et al., 1994; Mullen & Losada, 1994,1999; Mullen et al., 1997; Sankeralli & Mullen, 1997;Giulianini & Eskew, 1998; Mullen & Sankeralli, 1999).In addition, recent studies employing the factor analysisapproach have also observed separability between lumi-nance and chromatic contrast sensitivity for static grat-ing stimuli (Peterzell, Chang & Teller, 2000; Peterzell &Teller, 2000), and for steady-state sweep-VEP contrastsensitivity obtained with counterphase gratings (Pe-terzell et al., 1996, 1997). In sum, the results acrossdiverse studies strongly support the existence of sepa-rate mechanisms underlying the detection of luminanceand green/red chromatic contrast.
At first glance, the finding of separability betweencontrast sensitivity and green/red equiluminance set-tings in our factor analysis may seem somewhat surpris-ing, since we expected that green/red equiluminancewould at least be served by a luminance (i.e. L+M)mechanism, if not by both a luminance and chromatic(i.e. L−M) mechanism. There are two main possibili-ties why our factor analysis may not have extracted acommon factor between green/red equiluminance and(luminance or chromatic) contrast sensitivity. One, thesignals underlying the different perceptual phenomenamay be processed within a common neural pathway,yet be extracted at different le6els of visual processing.For example, green/red equiluminance may be deter-mined very early in visual processing, by the inputs of
L- and M-cones to retinal ganglion cells. Contrastsensitivity, on the other hand, may be largely deter-mined at the cortical level, by gain control mechanisms(e.g. Ohzawa, Sclar & Freeman, 1985), temporal filter-ing of signals (e.g. Lee, Pokorny, Smith, Martin &Valberg, 1990) or the variability of firing rate (e.g.Tolhurst, Movshon & Dean, 1983). If this were thecase, the mechanisms underlying equiluminance andcontrast sensitivity might be limited by separate sourcesof variability. This, in turn, might allow the measuresto remain separate in our factor analyses.
Alternatively, a relationship may exist between themeasures, yet not at a statistically significant level aswould be required to be pulled out by our factoranalysis. We tend to believe this second alternative,because the correlation matrix revealed interpretableresults, with systematic positive and negative correla-tions between green/red equiluminance and contrastsensitivity (see Fig. 2). Specifically, at high temporalfrequencies, higher-than-average G/R ratios were corre-lated with higher-than-average luminance contrast sen-sitivity. At low temporal frequencies, higher G/R ratioswere correlated with lower-than-average chromatic con-trast sensitivity. Although one could argue that thesecross-condition correlations were moderate at best (i.e.mean positive correlation=�0.35, mean negative cor-relation=�−0.20), it is the pattern of correlations (asopposed to the absolute numbers) that is revealing.
Interestingly, similar to the way in which these cross-condition correlations were observed separately at lowvs. high temporal frequencies, the results from ouranalyses of green/red equiluminance data also revealedseparate mechanisms underlying performance at low(2–4 Hz) vs. high (8–16 Hz) temporal frequencies (seenin the correlation matrix of Fig. 2 and the factorloadings of Fig. 4, top panel). Taken together, thesefindings suggest that the high temporal frequency mech-anism underlying green/red equiluminance settings isrelated to luminance sensitivity, while the low temporalfrequency mechanism is related to chromatic sensitivity.This pattern of results is consistent with the finding thatthe Vl function (derived mainly from HFP data ob-tained at high temporal frequencies, i.e. �15 Hz) canbe modeled by a simple weighted sum of L- andM-cone signals. Likewise, the possibility that chromatic(L−M) mechanisms contribute to the low temporalfrequency factor underlying equiluminance data is con-sistent with the observation that matches made betweentwo stationary colors (in a heterochromatic brightnessmatching task) can be modeled by contributions fromboth L−M and L+M mechanisms. Our results arealso consistent with a study by Webster and Mollon(1993) demonstrating that chromatic adaptation altersequiluminance settings at low, but not high, temporalfrequencies. Like the present study, their findings sup-port the existence of separate mechanisms (presumably
K.R. Dobkins et al. / Vision Research 40 (2000) 613–628624
L−M vs L+M) dominating equiluminance settings atlow versus high temporal frequencies (also see Lennie etal., 1993).
We should emphasize here that the task in ourexperiment (i.e. to minimize flicker in the stimulus) wasconstant across all spatial-temporal frequency condi-tions. Thus, the contribution of separate mechanisms toequiluminance settings is expected to be due to differenttemporal frequencies differentially affecting the relativeactivations of L−M vs L+M pathways, as opposedto task demands differentially tapping into one path-way versus the other (see Shioiri & Cavanagh, 1992 fora similar argument). This change in the relative activa-tions of L−M versus L+M pathways could explainwhy equiluminance settings tend to vary with temporalfrequency (as observed in the present and previousstudies). In addition to this possibility, the effect oftemporal frequency on equiluminance settings may bedue to phase-lags and/or relative cone weights betweenL- and M-cones that vary with temporal frequency (seeHamer & Tyler, 1992; Smith, Lee, Pokorny, Martin &Valberg, 1992; Stromeyer et al., 1997). As mentionedearlier in Section 2, the use of an equal energy whitebackground in our experiments is expected to producesmall (if not negligible) variability in phase-lags or coneweights. Nonetheless, we cannot rule out the possibilitythat this factor contributed to the observed effects oftemporal frequency on equiluminance settings.
4.4. Contributions from magnocellular 6ersuspar6ocellular pathways
In order to elucidate potential neural substrates un-derlying our psychophysical results, we turn to theknown response properties of neurons in the macaquevisual system. Comparisons between macaque and hu-mans are justified based on the known similaritiesbetween the visual systems of the two primates (e.g. DeValois, Morgan, Polson, Mead & Hull, 1974a; DeValois, Morgan & Snodderly, 1974b). In particular, wefocus on the properties of two distinct subcortical path-ways — parvocellular and magnocellular — whichoriginate in the retina and remain segregated upthrough layer 4C of area V1 (see Merigan & Maunsell,1993 or Dobkins & Albright, 1998 for a review). (Therealso exists a third pathway, the ‘koniocellular’ (K)pathway, which is less studied and appears to respondselectively to stimuli that modulate the S-cones, e.g.Irvin, Casagrande & Norton, 1993; Martin, White,Goodchild, Wilder & Sefton, 1997. This pathway is notrelevant to this discussion.) Although there exists sub-stantial evidence to suggest that the magnocellularpathway receives additive (i.e. L+M) cone input whilethe parvocellular pathway receives chromatically-oppo-nent (i.e. L−M) cone input, the notion of completedichotomy of function has been called into question on
several grounds. First, both cell types are known torespond to both chromatic (green/red) and luminancestimuli (e.g. Lee et al., 1990), suggesting that neuralpathways for chromatic and luminance processing arenot completely segregated. Second, stimulus parameters(such as spatial-temporal frequency and backgroundchromaticity) can produce phase-lags between L- andM-cones and/or between center and surround mecha-nisms, which in turn can alter the additive or subtrac-tive nature of L- and M-cone input to the two celltypes (e.g. Gouras & Zrenner, 1979; Derrington,Krauskopf & Lennie, 1984; Smith et al., 1992 and seeStromeyer et al., 1997).
Given these complications, it is perhaps surprisingthat psychophysical evidence supports independence be-tween chromatic and luminance contrast detection. Oneway this apparent discrepancy has been reconciled restson the fact that magnocellular cells are far more sensi-tive to luminance contrast than are parvocellular cells,while parvocellular cells are much more sensitive tochromatic contrast than are magnocellular cells (e.g.Hicks, Lee & Vidyasagar, 1983; Derrington & Lennie,1984; Lee et al., 1990). Thus, since the most sensitivesystem presumably underlies contrast detection atthreshold, it is reasonable to assume that magnocellularand parvocellular pathways provide the neural sub-strate for luminance and chromatic contrast sensitivity,respectively (see Lee et al., 1990; Smith, Pokorny, Davis& Yeh, 1995; Dobkins, Anderson & Lia, 1999). Thisnotion is not universally accepted, however. An oppos-ing point of view proposes that the parvocellular subdi-vision subserves both chromatic and luminancedetection, with the signals for the two types of contrast‘de-multiplexed’ at the level of visual cortex (e.g. In-gling & Martinez-Uriegas, 1983; Lennie & D’Zmura,1988; De Valois & De Valois, 1993; Billock, 1995;Mullen et al., 1997). Note that this idea rests on theassumption that, despite the superior luminance sensi-tivity of single magnocellular cells, the far more numer-ous parvocellular cells (outweighing magnocellular cellsin number by eight-fold) could, as a population, governluminance sensitivity revealed perceptually. The parvo-cellular pathway’s role in luminance sensitivity is par-tially supported by the results of lesion studies inmacaques, which show impaired luminance contrastsensitivity for low temporal frequencies/high spatialfrequencies after parvocellular lesions. By contrast,magnocellular lesions produce large impairments forhigh temporal frequencies/low spatial frequency stimuli(e.g. Merigan & Maunsell, 1990; Merigan, Katz &Maunsell, 1991). Given the controversy surroundingthis issue, it is currently unclear whether the indepen-dence of luminance and chromatic contrast sensitivitycan be mapped neatly onto magnocellular and parvo-cellular substrates, respectively.
K.R. Dobkins et al. / Vision Research 40 (2000) 613–628 625
With regard to the neural substrates for green/redequiluminance settings, results from several neurophysi-ological studies have shown that magnocellular, but notparvocellular, cells exhibit minimal responses when theluminance ratio between two colors is near human Vl
equiluminance (Lee, Martin & Valberg, 1988; Kaiser,Lee, Martin & Valberg, 1990; Logothetis et al., 1990;Valberg, Lee, Kaiser & Kremers, 1992, and seeDobkins & Albright, 1995 for similar results obtainedfrom the middle temporal area of visual cortex). Be-cause magnocellular responses mirror the perceptualphenomenon of ‘minimal saliency’ at equiluminance,this pathway has been implicated as providing theneural substrate for equiluminance. (It is interesting topoint out that the lack of correspondence betweenparvocellular and perceptual responses implies that par-vocellular responses are either ignored or attenuated byfilters at the cortical level, see Lee et al., 1990). Giventhe evidence from psychophysical studies for L−Mcontribution (at low temporal frequencies), however, atotal lack of parvocellular input to equiluminance set-tings would be surprising. This can perhaps be recon-ciled by proposing that previous neurophysiologicalstudies missed a contribution from parvocellular (L−M) cells, either because they used relatively high tem-poral frequencies and/or because the parvocellularcontribution is small and difficult to detect. Alterna-tively, parvocellular cells may not be required to ac-count for the psychophysical results if magnocellularcells, in fact, respond in a chromatically-opponent (L−M) fashion at low temporal frequencies (e.g. Smith etal., 1992; Stromeyer et al., 1997).
4.5. Do L:M ratios place constraints on luminance andchromatic contrast sensiti6ity?
In theory, an individual who exhibits a relatively highG/R equiluminance ratio is predicted to have a rela-tively high number of L- to M-cones (i.e. L :M coneratio) in the eye. This prediction is based on a simpleL+M model of green/red spectral sensitivity, i.e. twocolors are expected to be equiluminant when theweighted sums of L- and M-cones signals produced bythe two colors are equated. This weighting factor,which represents the L :M cone ratio in the eye, isthought to be approximately 2:1 in humans (see Lennieet al., 1993). The validity of this model has beensupported by several studies demonstrating that, withinindividual human subjects, L :M cone ratios derivedfrom green/red spectral sensitivity data correspondquite closely with those obtained using methods thatdirectly ‘count’ cone types in the eye (e.g. Vimal, Poko-rny, Smith & Shevell, 1989; Wesner, Pokorny, Shevell& Smith, 1991; Sharpe, Kremers, Knau, Berendschot &Usui, 1998; Brainard, Roorda, Yamauchi, Calderone,Metha, Neitz et al., 2000, and see Jacobs & Deegan,
1997; Dobkins, Thiele & Albright, 2000 for relevantexperiments in macaques).
Given that green/red spectral sensitivity is, in fact, areasonable indicator of L :M cone ratios (i.e. highergreen/red equiluminance settings reflecting higher L :Mratios), we can address how L :M ratios might placeconstraints on both luminance and chromatic contrastsensitivity. In our correlation matrix (Fig. 2), we ob-served positi6e correlations between green/red equilu-minance settings and luminance contrast sensitivity,yet negati6e correlations between green/red equilumi-nance settings and chromatic contrast sensitivity. Thisindicates that subjects with higher L :M cone ratios(relative to others) are at an advantage for detectingluminance contrast, yet at a disadvantage for detectingchromatic contrast. For chromatic (green/red) stimuli,sensitivity is thought to be implemented on the neu-ronal level by cells that receive chromatically-oppo-nent (i.e. L−M) cone input. Whether or not thiswiring arises as a consequence of selective or stochas-tic processes (e.g. Lennie, Haake & Williams, 1991;Reid & Shapley, 1992; Calkins & Sterling, 1996), anL :M ratio near 1:1 should be most advantageous forpairing L-cones with M-cones. Conversely, a high(and thus imbalanced) L :M ratio would yield theworst chances for chromatic opponency, and in turn,lower chromatic sensitivity. Thus, the correlation be-tween higher G/R ratios (indicative of higher L :Mratios) and lower chromatic contrast sensitivity seen inour data may reflect variation in the degree of chro-matic opponency across subjects, as dictated by L :Mcone ratios.
By contrast, with regard to luminance contrast sensi-tivity, a greater degree of cone homogeneity (i.e.higher L :M cone ratios) might be considered moreadvantageous. Consider the case of a heterogeneousL- and M-cone mosaic. Due to differential spectralsensitivities across cone types, a homogeneous (i.e.zero-contrast) field might produce small differences incone signals across a patch of retina, which would beconfusable with signals arising from a low-contrastluminance stimulus. Here, the visual system must dis-ambiguate differences in cone signals that are due toluminance variation in the stimulus from differencesthat are due to variation in spectral sensitivity acrosscone types. In theory, this could be achieved by ‘nor-malizing’ to the signal jitter produced by differentialcone spectral sensitivities. By contrast, a homogenouscone mosaic would avoid the need to disambiguatethe source of differential signals, and would conse-quently detect luminance variation more efficiently.Thus, the correlation between higher G/R ratios (in-dicative of higher L :M ratios) and higher luminancecontrast sensitivity seen in our data may reflect thissort of phenomenon. Experiments in our laboratoryare underway to investigate this issue further.
K.R. Dobkins et al. / Vision Research 40 (2000) 613–628626
Acknowledgements
This work was supported by NIH grant EY12153(KRD), NIH grant EY06706 (DHP), and a Fight-for-Sight Summer Fellowship SF98019 (KLG). We thankDr Thomas Wachtler, Dr Charles Stromeyer and oneanonymous reviewer for helpful comments on themanuscript.
References
Anderson, S. J., & Burr, D. C. (1985). Spatial and temporal selectiv-ity of the human motion detection system. Vision Research, 25,1147–1154.
Bauer, H. D., & Roehler, R. (1977). Brightness generation in thehuman visual system. Colour-brightness: a contribution of corti-cal colour channels to brightness sensation. Vision Research, 17,1211–1216.
Bieber, M. L., Kraft, J. M., & Werner, J. S. (1998). Effects of knownvariations in photopigments on L/M cone ratios estimated fromluminous efficiency functions. Vision Research, 38, 1961–1966.
Billock, V. A. (1995). Cortical simple cells can extract achromaticinformation from the multiplexed chromatic and achromatic sig-nals in the parvocellular pathway. Vision Research, 35, 2359–2369.
Billock, V. A., & Harding, T. H. (1996). Evidence of spatial andtemporal channels in the correlational structure of human spa-tiotemporal contrast sensitivity. Journal of Physiology (London),490, 509–517.
Boynton, R. (1996). History and current status of a physiologicallybased system of photometry and colorimetry. Journal of theOptical Society of America A, 13, 1609–1621.
Bradley, A., Switkes, E., & De Valois, K. (1988). Orientation andspatial frequency selectivity of adaptation to color and luminancegratings. Vision Research, 28, 841–856.
Brainard, D. H., Roorda, A., Yamauchi, Y., Calderone, J. B., Metha,A., Neitz, M., Neitz, J., Williams, D. R., & Jacobs, G. H. (2000).Functional consequences of the relative number of L and Mcones. Journal of the Optical Society of America A (in press).
Burns, S. A., Smith, V. C., Pokorny, J., & Elsner, A. E. (1982).Brightness of equal-luminance lights. Journal of the Optical Soci-ety of America, 72, 1225–1231.
Burr, D. C., & Ross, J. (1982). Contrast sensitivity at high velocities.Vision Research, 22, 479–484.
Calkins, D. J., & Sterling, P. (1996). Absence of spectrally specificlateral inputs to midget ganglion cells in primate retina. Nature,381, 613–615.
Cavanagh, P., & Anstis, S. (1991). The contribution of color tomotion in normal and color-deficient observers. Vision Research,31, 2109–2148.
Cavanagh, P., MacLeod, D. I., & Anstis, S. M. (1987). Equilumi-nance: spatial and temporal factors and the contribution ofblue-sensitive cones. Journal of the Optical Society of America A,4, 1428–1438.
Chaparro, A., Stromeyer, C. F. I., Huang, E. P., Kronauer, R. E., &Eskew, R. T. J. (1993). Colour is what the eye sees best. Nature,361, 348–350.
Chaparro, A., Stromeyer, C. F. I., Kronauer, R. E., & Eskew, R. T.J. (1994). Separable red-green and luminance detectors for smallflashes. Vision Research, 34, 751–762.
Cole, G. R., Stromeyer, C. F. I., & Kronauer, R. E. (1990). Visualinteractions with luminance and chromatic stimuli. Journal of theOptical Society of America A, 7, 128–140.
Cushman, W. B., & Levinson, J. Z. (1983). Phase shift in red andgreen counterphase flicker at high frequencies. Journal of theOptical Society of America, 73, 1557–1561.
De Valois, R. L., & De Valois, K. K. (1993). A multi-stage colormodel. Vision Research, 33, 1053–1065.
De Valois, R. L., Morgan, H. C., Polson, M. C., Mead, W. R., &Hull, E. M. (1974a). Psychophysical studies of monkey vision. I.Macaque luminosity and color vision tests. Vision Research, 14,53–67.
De Valois, R. L., Morgan, H., & Snodderly, D. M. (1974b). Psycho-physical studies of monkey vision. 3. Spatial luminance contrastsensitivity tests of macaque and human observers. Vision Re-search, 14, 75–81.
Derrington, A. M., & Henning, G. B. (1993). Detecting and discrim-inating the direction of motion of luminance and colour gratings.Vision Research, 33, 799–811.
Derrington, A. M., & Lennie, P. (1984). Spatial and temporal con-trast sensitivities of neurones in lateral geniculate nucleus ofmacaque. Journal of Physiology (London), 357, 219–240.
Derrington, A. M., Krauskopf, J., & Lennie, P. (1984). Chromaticmechanisms in lateral geniculate nucleus of macaque. Journal ofPhysiology (London), 357, 241–265.
Dobkins, K. R., & Albright, T. D. (1993). What happens if it changescolor when it moves? Psychophysical experiments on the nature ofchromatic input to motion detectors. Vision Research, 33, 1019–1036.
Dobkins, K. R., & Albright, T. D. (1995). Behavioral and neuraleffects of chromatic isoluminance in the primate visual motionsystem. Visual Neuroscience, 12, 321–332.
Dobkins, K. R., & Albright, T. D. (1998). The influence of chromaticinformation on visual motion processing in the primate visualsystem. In T. Watanabe, High-le6el motion processing — compu-tational, neurobiological and psychophysical perspecti6es (pp. 53–94). Cambridge: MIT Press.
Dobkins, K. R., Lia, B., & Teller, D. Y. (1997). Infant color vision:Temporal contrast sensitivity functions (tCSFs) for chromatic(red/green) stimuli in 3-month-olds. Vision Research, 37, 2699–2716.
Dobkins, K. R., Anderson, C. M., & Lia, B. (1999). Infant temporalcontrast sensitivity functions (tCSFs) mature earlier for luminancethan for chromatic stimuli: evidence for precocious magnocellulardevelopment? Vision Research, 39, 3223–3239.
Dobkins, K. R., Thiele, A., & Albright, T. D. (2000). Comparison ofred-green equiluminance points in humans and macaques: evi-dence for different L:M ratios between species. Journal of theOptical Society of America, A (in press).
Flitcroft, D. I. (1989). The interactions between chromatic aberration,defocus and stimulus chromaticity: implications for visual physiol-ogy and colorimetry. Vision Research, 29, 349–360.
Gegenfurtner, K. R., & Kiper, D. C. (1992). Contrast detection inluminance and chromatic noise. Journal of the Optical Society ofAmerica A, 9, 1880–1888.
Gegenfurtner, K. R., & Hawken, M. J. (1995). Temporal and chro-matic properties of motion mechanisms. Vision Research, 35,1547–1563.
Giulianini, F., & Eskew, R. T. J. (1998). Chromatic masking in the(DL/L, DM/M) plane of cone-contrast space reveals only twodetection mechanisms. Vision Research, 38, 3913–3926.
Gorsuch, R. L. (1983). Factor analysis (2nd ed.). Hillsdale, NJ:Erlbaum.
Gouras, P., & Zrenner, E. (1979). Enhancement of luminance flickerby color-opponent mechanisms. Science, 205, 587–589.
Graham, N. V. S. (1989). Visual pattern analyzers. New York: OxfordUniversity Press.
Greenlee, M. W., Magnussen, S., & Norby, K. (1988). Spatial visionof the achromat: spatial frequency and orientation-specific adap-tation. Journal of Physiology (London), 395, 661–678.
K.R. Dobkins et al. / Vision Research 40 (2000) 613–628 627
Gunther, K. L., Peterzell, D. H., & Dobkins, K. R. (1997). Whatmechanisms underlie red/green isoluminance matches at variousspatial and temporal frequencies? In6estigati6e Ophthalmology andVisual Science, 38(4), S892.
Gur, M., & Akri, V. (1992). Isoluminant stimuli may not expose thefull contribution of color to visual functioning: Spatial constrastsensitivity measurements indicate interaction between color andluminance processing. Vision Research, 32, 1253–1262.
Guth, S. L., & Lodge, H. R. (1973). Heterochromatic additivity,foveal spectral sensitivity and a new color model. Journal of theOptical Society of America, 63, 450–462.
Hamer, R. D., & Tyler, C. W. (1992). Analysis of visual modulationsensitivity: V. Faster visual response for G- than for R-conepathway? Journal of the Optical Society of America A, 9, 1889–1904.
Hammett, S. T., & Smith, A. T. (1992). Two temporal channels orthree? A re-evaluation. Vision Research, 32, 285–291.
Hess, R. F., & Snowden, R. J. (1992). Temporal properties of humanvisual filters: number, shapes and spatial covariation. Vision Re-search, 32, 47–59.
Hicks, T. P., Lee, B. B., & Vidyasagar, T. R. (1983). The responses ofcells in macaque lateral geniculate nucleus to sinusoidal gratings.Journal of Physiology (London), 337, 183–200.
Ingling, C. R., & Martinez-Uriegas, E. (1983). The relationshipbetween spectral sensitivity and spatial sensitivity for the primateR. g X-Channel. Vision Research, 23, 1495–1500.
Ingling, C. R., & Tsou, B. H. (1988). Spectral sensitivity for flickerand acuity criteria. Journal of the Optical Society of America. A, 5,1374–1378.
Irvin, G. E., Casagrande, V. A., & Norton, T. T. (1993). Center/sur-round relationships of magnocellular, parvocellular, and koniocel-lular relay cells in primate lateral geniculate nucleus. VisualNeuroscience, 10, 363–373.
Jacobs, G. H., & Deegan II, J. F. (1997). Spectral sensitivity ofmacaque monkeys measured with ERG flicker photometry. VisualNeuroscience, 14, 921–928.
Kaiser, P. K., Lee, B. B., Martin, P. R., & Valberg, A. (1990). Thephysiological basis of the minimally distinct border demonstratedin the ganglion cells of the macaque retina. Journal of Physiology(London), 422, 153–183.
Kelly, D. H. (1971). Theory of flicker and transient responses: II.Counterphase gratings. Journal of the Optical Society of America,61, 632–640.
King-Smith, P. E., & Kulikowski, J. J. (1975). Pattern and flickerdetection analysed by subthreshold summation. Journal of Physi-ology (London), 249, 519–548.
Knoblauch, K., Barbur, J. L., & Vital-Durand, F. (1995). Develop-ment and aging of chromatic sensitivity. In6estigati6e Ophthalmol-ogy and Visual Science, 36, 5910.
Krauskopf, J., Williams, D. R., & Heeley, D. W. (1982). Cardinaldirections of color space. Vision Research, 22, 1123–1131.
Lee, B. B., Martin, P. R., & Valberg, A. (1988). The physiologicalbasis of heterochromatic flicker photometry demonstrated in theganglion cells of the macaque retina. Journal of Physiology (Lon-don), 404, 323–347.
Lee, B. B., Pokorny, J., Smith, V. C., Martin, P. R., & Valberg, A.(1990). Luminance and chromatic modulation sensitivity ofmacaque ganglion cells and human observers. Journal of theOptical Society of America A, 7, 2223–2236.
Lehky, S. R. (1985). Temporal properties of visual channels measuredby masking. Journal of the Optical Society of America A, 2,1260–1272.
Lennie, P., & D’Zmura, M. (1988). Mechanisms of color vision.Critical Re6iews in Neurobiology, 3, 333–400.
Lennie, P., Haake, P. W., & Williams, D. R. (1991). The design ofchromatically opponent receptive fields. In M. S. Landy, & J. A.Movshon, Computational models of 6isual processing (pp. 71–82).Cambridge, MA: MIT Press.
Lennie, P., Pokorny, J., & Smith, V. C. (1993). Luminance. Journal ofthe Optical Society of America A, 10, 1283–1293.
Lieberman, H. R., & Pentland, A. P. (1982). Microcomputer-basedestimation of psychophysical thresholds: the best PEST. Beha6iourResearch Methods & Instrumentation, 14, 21–25.
Livingstone, M. S., & Hubel, D. H. (1987). Psychophysical evidencefor separate channels for the perception of form, color, move-ment, and depth. Journal of Neuroscience, 7, 3416–3468.
Logothetis, N. K., & Charles, E. R. (1990). The minimum motiontechnique applied to determine isoluminance in psychophysicalexperiments with monkeys. Vision Research, 30, 829–838.
Logothetis, N. K., Schiller, P. H., Charles, E. R., & Hurlbert, A. C.(1990). Perceptual deficits and the activity of the color-opponentand broad-band pathways at isoluminance. Science, 247, 214–217.
Losada, M. A., & Mullen, K. T. (1994). The spatial tuning ofchromatic mechanisms identified by simultaneous masking. VisionResearch, 34, 331–341.
Mandler, M. B., & Makous, W. (1984). A three channel model oftemporal frequency perception. Vision Research, 24, 1881–1887.
Martin, P. R., White, A. J., Goodchild, A. K., Wilder, H. D., &Sefton, A. E. (1997). Evidence that blue-on cells are part of thethird geniculocortical pathway in primates. European Journal ofNeuroscience, 9, 1536–1541.
Mayer, M. J., Dougherty, R. F., & Hu, L. T. (1995). A covariancestructure analysis of flicker sensitivity. Vision Research, 35, 1575–1583.
Merigan, W. H., & Maunsell, J. H. (1990). Macaque vision aftermagnocellular lateral geniculate lesions. Visual Neuroscience, 5,347–352.
Merigan, W. H., & Maunsell, J. H. (1993). How parallel are theprimate visual pathways? Annual Re6iew in Neuroscience, 16,369–402.
Merigan, W. H., Katz, L. M., & Maunsell, J. H. (1991). The effectsof parvocellular lateral geniculate lesions on the acuity and con-trast sensitivity of macaque monkeys. Journal of Neuroscience, 11,994–1001.
Metha, A. B., & Mullen, K. T. (1996). Temporal mechanisms under-lying flicker detection and identification for red–green and achro-matic stimuli. Journal of the Optical Society of America, A, 13,1969–1980.
Moulden, B., Renshaw, J., & Mather, G. (1984). Two channels forflicker in the human visual system. Perception, 13, 387–400.
Mullen, K. T. (1985). The contrast sensitivity of human colour visionto red-green and blue-yellow chromatic gratings. Journal of Phys-iology (London), 359, 381–400.
Mullen, K. T., & Boulton, J. C. (1992). Absence of smooth motionperception in color vision. Vision Research, 32, 483–488.
Mullen, K. T., & Losada, M. A. (1994). Evidence for separatepathways for color and luminance detection mechanisms. Journalof the Optical Society of America A, 11, 3136–3151.
Mullen, K. T., & Losada, M. A. (1999). The spatial tuning of colorand luminance peripheral vision measured with notch filterednoise masking. Vision Research, 39, 721–732.
Mullen, K. T., & Sankeralli, M. J. (1999). Evidence for the stochasticindependence of the blue–yellow, red–green and luminance detec-tion mechanisms revealed by subthreshold summation. VisionResearch, 39, 733–746.
Mullen, K. T., Cropper, S. J., & Losada, M. A. (1997). Absence oflinear subthreshold summation between red–green and luminancemechanisms over a wide range of spatio-temporal conditions.Vision Research, 37, 1157–1165.
Ohzawa, I., Sclar, G., & Freeman, R. D. (1985). Contrast gaincontrol in the cat’s visual system. Journal of Neurophysiology, 54,651–667.
Peterzell, D. H., & Teller, D. Y. (1996). Individual differences incontrast sensitivity functions: The lowest spatial frequency chan-nels. Vision Research, 36, 3077–3086.
K.R. Dobkins et al. / Vision Research 40 (2000) 613–628628
Peterzell, D. H., & Teller, D. Y. (2000). Spatial frequency tunedcovariance channels for red–green and luminance-modulatedgratings: psychophysical data from human adults. Vision Re-search, 40, 417–430.
Peterzell, D. H., Kaplan, P. S., & Werner, J. S. (1993). Individualdifferences in contrast sensitivity functions: the first four monthsof life in humans. Vision Research, 33, 381–396.
Peterzell, D. H., Kaplan, P. S., & Werner, J. S. (1995). Individualdifferences in contrast sensitivity functions: longitudinal study of4-, 6- and 8-month-old human infants. Vision Research, 35, 961–979.
Peterzell, D. H., Dougherty, R. F., & Billock, V. A. (1996a). Spa-tiotemporal co6ariance channels. Optical Society of America An-nual Meeting, Rochester NY.
Peterzell, D. H., Kelly, J. P., Chang, S. K., Gordon, S. J., Omaljev,L., & Teller, D. Y. (1996b). Spatial frequency channels for codingcolor and luminance: Adults’ and infants’ VEP contrast sensitivityfunctions. In6estigati6e Ophthalmology and Visual Science, 37,S1067.
Peterzell, D. H., Chang, S. K., Kelly, J. P., Hartzler, A. L., & Teller,D. Y. (1997a) The development of spatial frequency covariancechannels for color and luminance: psychophysical (FPL) andelectrophysiological (sweep-VEP) studies. Child Vision ResearchSociety, Pisa, Italy, June 6.
Peterzell, D. H., Dougherty, R. F., & Mayer, M. J. (1997b). Tempo-ral tuning of flicker-sensitive channels derived from individualdifferences in de Lange functions. Vision science and its applica-tions: technical digest, 6ol. 1 (pp. 218–221). Washington DC:Optical Society of America.
Peterzell, D. H., Chang, S. K., & Teller, D. Y. (2000). Spatialfrequency tuned covariance channels for red-green and lumi-nance-modulated gratings: psychophysical data from human in-fants. Vision Research, 40, 431–444.
Reid, R. C., & Shapley, R. M. (1992). Spatial structure of cone inputsto receptive fields in primate lateral geniculate nucleus. Nature,356, 716–718.
Robson, J. G. (1966). Spatial and temporal contrast-sensitivity func-tions of the visual system. Journal of the Optical Society ofAmerica, 56, 1141–1142.
Sankeralli, M. J., & Mullen, K. T. (1997). Postreceptoral chromaticdetection mechanisms revealed by noise masking in three-dimen-sional cone contrast space. Journal of the Optical Society ofAmerica, 14, 2633–2646.
Sekuler, R., Wilson, H. R., & Owsley, C. (1984). Structural modelingof spatial vision. Vision Research, 24, 689–700.
Sharpe, L. T., Kremers, J., Knau, H., Berendschot, T. T. J. M., &Usui, T. (1998). Ratios of L and M cones in the normal retina.Twenty-first European Conference on Visual Perception (Ab-stracts), 27, 26.
Shioiri, S., & Cavanagh, P. (1992). Achromatic form perception isbased on luminance, not brightness. Journal of the Optical Societyof America A, 9, 1672–1681.
Smith, V. C., Lee, B. B., Pokorny, J., Martin, P. R., & Valberg, A.(1992). Responses of macaque ganglion cells to the relative phaseof heterochromatically modulated lights. Journal of Physiology(London), 458, 191–221.
Smith, V. C., Pokorny, J., Davis, M., & Yeh, T. (1995). Mechanismssubserving temporal modulation sensitivity in silent-cone substitu-tion. Journal of the Optical Society of America A, 12, 241–249.
Stockman, A., MacLeod, D. I., & Johnson, N. E. (1993). Spectralsensitivities of the human cones. Journal of the Optical Society ofAmerica A, 10, 2491–2521.
Stromeyer, C. F. I., Chaparro, A., Tolias, A. S., & Kronauer, R. E.(1997). Colour adaptation modifies the long-wave versus middle-wave cone weights and temporal phases in human luminance (butnot red-green) mechanism. Journal of Physiology (London), 499,227–254.
Switkes, E., Bradley, A., & De Valois, K. K. (1988). Contrastdependence and mechanisms of masking interactions among chro-matic and luminance gratings. Journal of the Optical Society ofAmerica A, 5, 1149–1162.
Tolhurst, D. (1973). Separate channels for the analysis of the shapeand movement of a moving visual stimulus. Journal of Physiology,231, 385–402.
Tolhurst, D. J., Movshon, J. A., & Dean, A. F. (1983). The statisticalreliability of signals in single neurons in cat and monkey visualcortex. Vision Research, 23, 775–785.
Tyler, C. W. (1975). Analysis of visual modulation sensitivity: Twocomponents in flicker perception. Vision Research, 15, 843–848.
Tyler, C. W. (1989). Two processes control variations in flickersensitivity over the life span. Journal of the Optical Society ofAmerica A, 6, 481–490.
Valberg, A., Lee, B. B., Kaiser, P. K., & Kremers, J. (1992). Re-sponses of macaque ganglion cells to movement of chromaticborders. Journal of Physiology (London), 458, 579–602.
van Norren, D. V., & Voss, J. J. (1974). Spectral transmission of thehuman ocular media. Vision Research, 14, 1237–1244.
Vimal, R. L., Pokorny, J., Smith, V. C., & Shevell, S. K. (1989).Foveal cone thresholds. Vision Research, 29, 61–78.
Wagner, G., & Boynton, R. M. (1972). Comparison of four methodsof heterochromatic photometry. Journal of the Optical Society ofAmerica, 62, 1508–1515.
Webster, M. A., & Mollon, J. D. (1993). Contrast adaptation dissoci-ates different measures of luminous efficiency. Journal of theOptical Society of America A, 10, 1332–1340.
Werner, J. S., Peterzell, D. H., & Scheetz, A. J. (1990). Light, visionand aging. Optometry and Visual Science, 67, 214–229.
Wesner, M. F., Pokorny, J., Shevell, S. K., & Smith, V. C. (1991).Foveal cone detection statistics in color-normals and dichromats.Vision Research, 31, 1021–1037.
Yaguchi, H., & Ikeda, M. (1983). Contribution of opponent-colourchannels to brightness. In J. D. Mollon, & L. T. Sharpe, Colour6ision: physiology and psychophysics (pp. 353–360). London: Aca-demic.
.