What can we learn from 100,000 spinning hard drives? · 2017 Storage Developer Conference. © 2017...
33
What can we learn from 100,000 spinning hard drives? Andrew Klein Backblaze
Transcript of What can we learn from 100,000 spinning hard drives? · 2017 Storage Developer Conference. © 2017...
2017 Storage Developer Conference. © 2017 Backblaze Inc. All Rights Reserved. 1
What can we learn from 100,000 spinning hard drives?
Andrew KleinBackblaze
2017 Storage Developer Conference. © 2017 Backblaze Inc. All Rights Reserved. 2
Overview
History Drive Stats
Reliability over time Enterprise vs. consumer drives
SMART Stats Is predicting drive failure possible? Other attributes to consider
2017 Storage Developer Conference. © 2017 Backblaze Inc. All Rights Reserved. 3
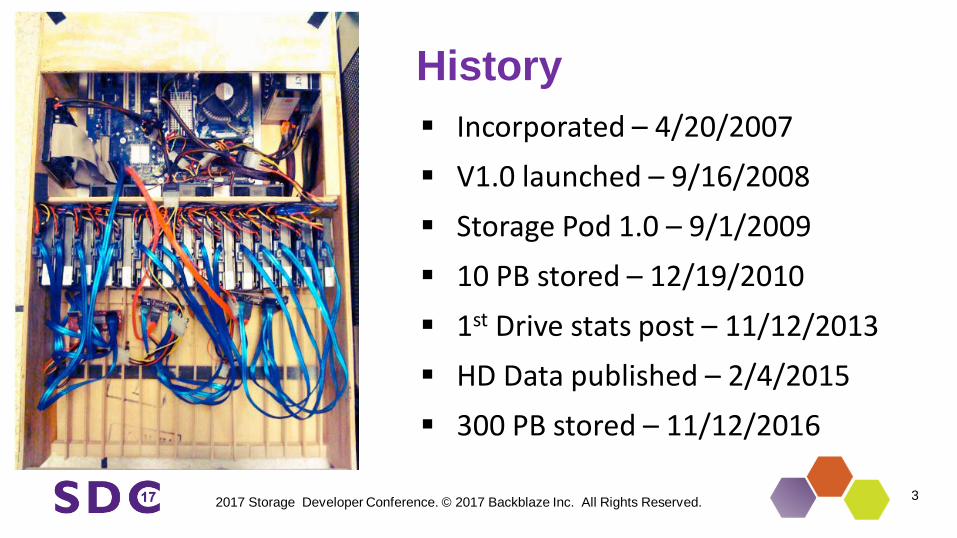
History Incorporated – 4/20/2007 V1.0 launched – 9/16/2008 Storage Pod 1.0 – 9/1/2009 10 PB stored – 12/19/2010 1st Drive stats post – 11/12/2013 HD Data published – 2/4/2015 300 PB stored – 11/12/2016
2017 Storage Developer Conference. © 2017 Backblaze Inc. All Rights Reserved. 4
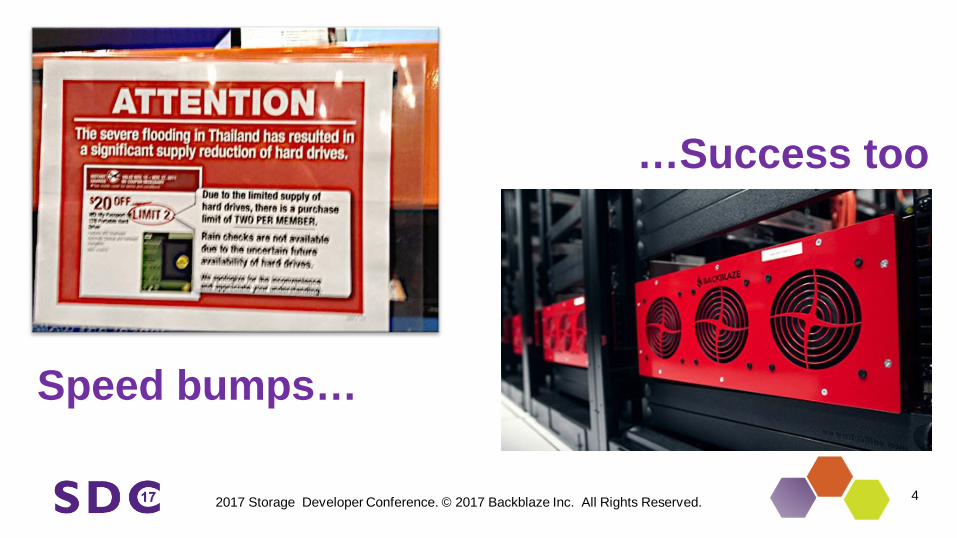
Speed bumps…
…Success too
2017 Storage Developer Conference. © 2017 Backblaze Inc. All Rights Reserved. 5
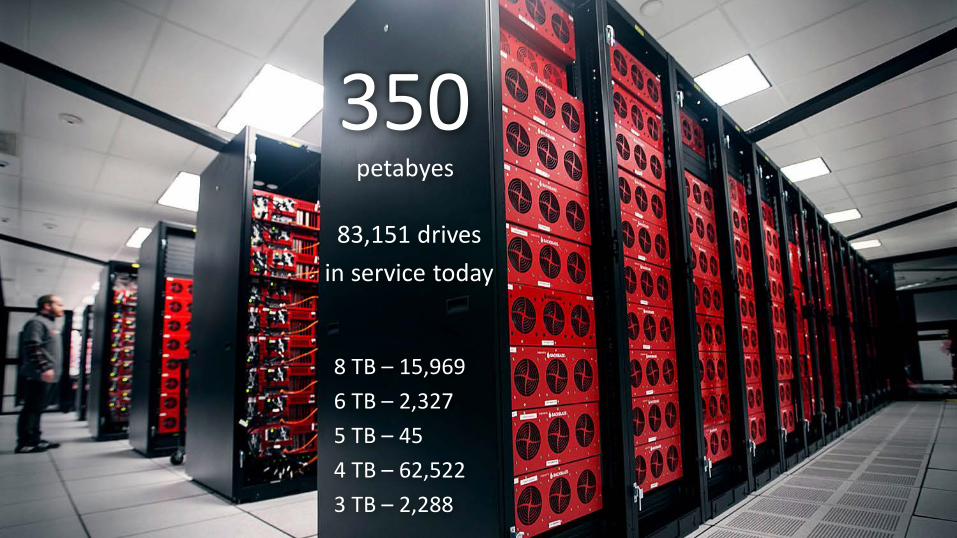
350petabyes
83,151 drivesin service today
8 TB – 15,9696 TB – 2,3275 TB – 45 4 TB – 62,5223 TB – 2,288
2017 Storage Developer Conference. © 2017 Backblaze Inc. All Rights Reserved. 6
Hard Drive Failure Rates at Backblaze
2017 Storage Developer Conference. © 2017 Backblaze Inc. All Rights Reserved. 7
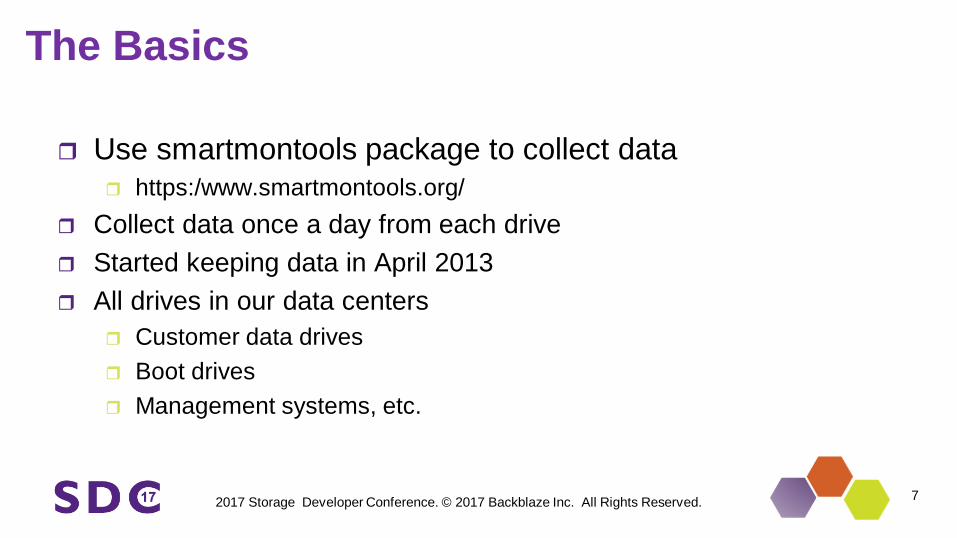
Use smartmontools package to collect data https:/www.smartmontools.org/
Collect data once a day from each drive Started keeping data in April 2013 All drives in our data centers
Customer data drives Boot drives Management systems, etc.
The Basics
2017 Storage Developer Conference. © 2017 Backblaze Inc. All Rights Reserved. 8
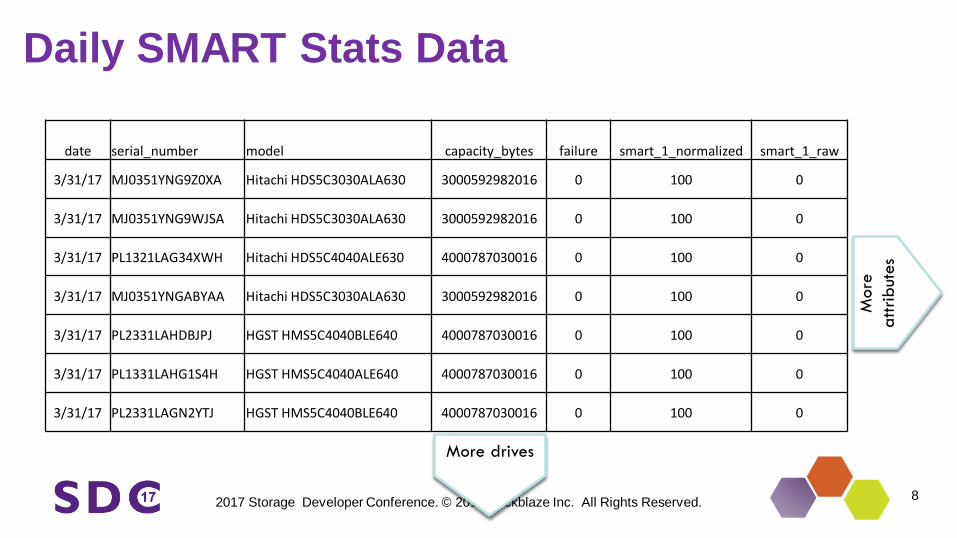
date serial_number model capacity_bytes failure smart_1_normalized smart_1_raw
3/31/17 MJ0351YNG9Z0XA Hitachi HDS5C3030ALA630 3000592982016 0 100 0
3/31/17 MJ0351YNG9WJSA Hitachi HDS5C3030ALA630 3000592982016 0 100 0
3/31/17 PL1321LAG34XWH Hitachi HDS5C4040ALE630 4000787030016 0 100 0
3/31/17 MJ0351YNGABYAA Hitachi HDS5C3030ALA630 3000592982016 0 100 0
3/31/17 PL2331LAHDBJPJ HGST HMS5C4040BLE640 4000787030016 0 100 0
3/31/17 PL1331LAHG1S4H HGST HMS5C4040ALE640 4000787030016 0 100 0
3/31/17 PL2331LAGN2YTJ HGST HMS5C4040BLE640 4000787030016 0 100 0
Mor
e at
trib
utes
More drives
Daily SMART Stats Data
2017 Storage Developer Conference. © 2017 Backblaze Inc. All Rights Reserved. 9
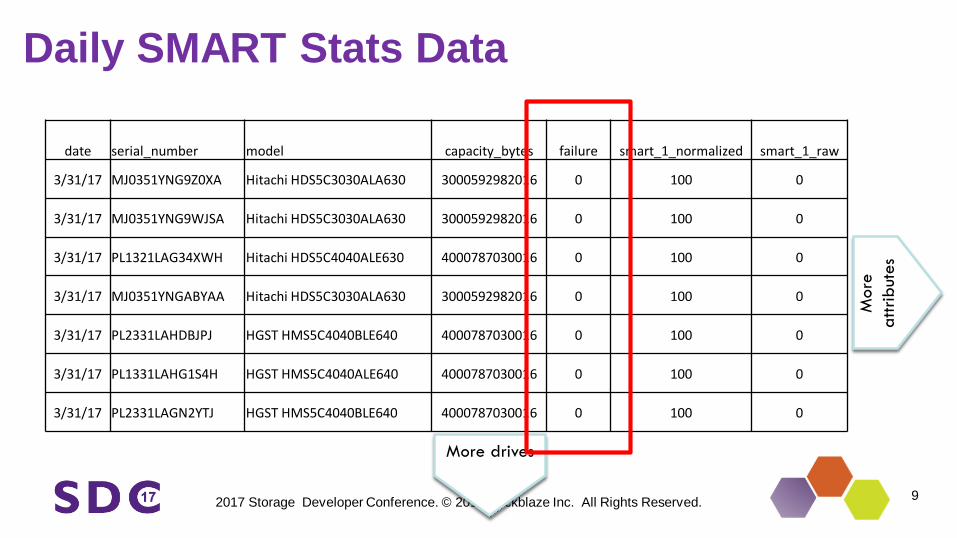
date serial_number model capacity_bytes failure smart_1_normalized smart_1_raw
3/31/17 MJ0351YNG9Z0XA Hitachi HDS5C3030ALA630 3000592982016 0 100 0
3/31/17 MJ0351YNG9WJSA Hitachi HDS5C3030ALA630 3000592982016 0 100 0
3/31/17 PL1321LAG34XWH Hitachi HDS5C4040ALE630 4000787030016 0 100 0
3/31/17 MJ0351YNGABYAA Hitachi HDS5C3030ALA630 3000592982016 0 100 0
3/31/17 PL2331LAHDBJPJ HGST HMS5C4040BLE640 4000787030016 0 100 0
3/31/17 PL1331LAHG1S4H HGST HMS5C4040ALE640 4000787030016 0 100 0
3/31/17 PL2331LAGN2YTJ HGST HMS5C4040BLE640 4000787030016 0 100 0
Mor
e at
trib
utes
More drives
Daily SMART Stats Data
2017 Storage Developer Conference. © 2017 Backblaze Inc. All Rights Reserved. 10
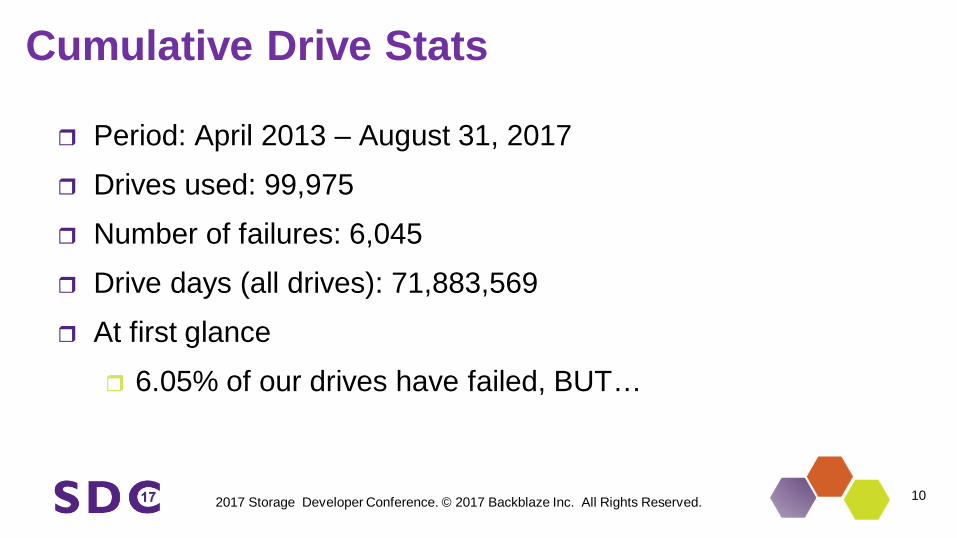
Period: April 2013 – August 31, 2017 Drives used: 99,975 Number of failures: 6,045 Drive days (all drives): 71,883,569 At first glance
6.05% of our drives have failed, BUT…
Cumulative Drive Stats
2017 Storage Developer Conference. © 2017 Backblaze Inc. All Rights Reserved. 11
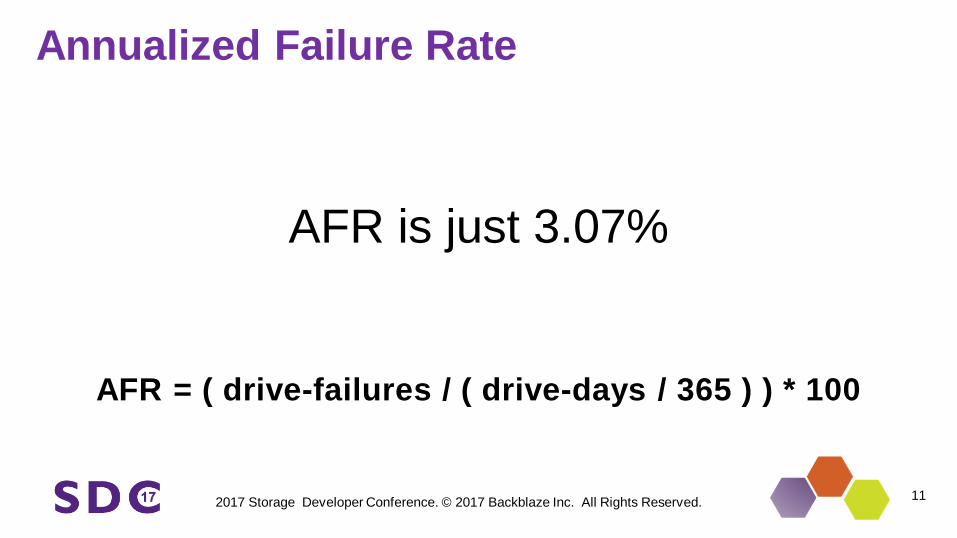
Annualized Failure Rate
AFR is just 3.07%
AFR = ( drive-failures / ( drive-days / 365 ) ) * 100
2017 Storage Developer Conference. © 2017 Backblaze Inc. All Rights Reserved. 12
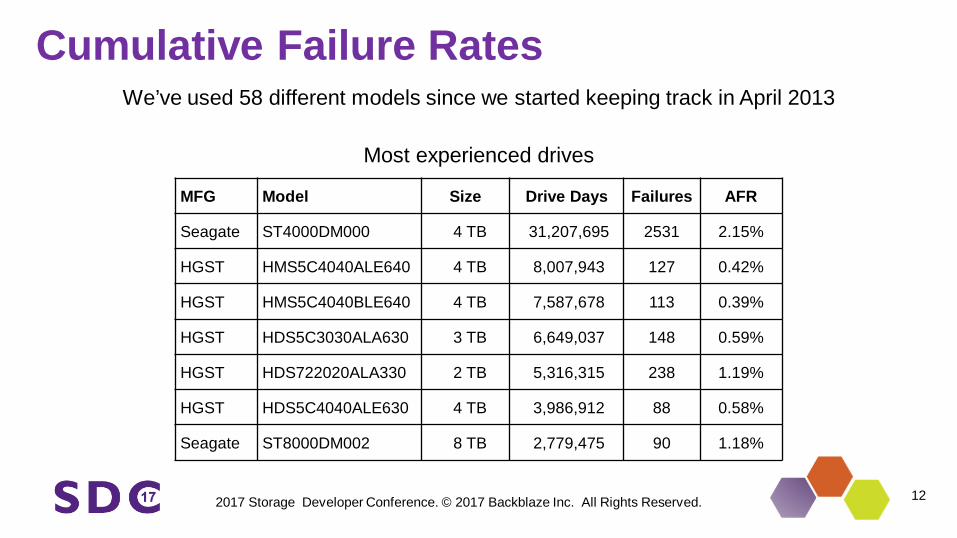
Cumulative Failure RatesWe’ve used 58 different models since we started keeping track in April 2013
MFG Model Size Drive Days Failures AFR
Seagate ST4000DM000 4 TB 31,207,695 2531 2.15%
HGST HMS5C4040ALE640 4 TB 8,007,943 127 0.42%
HGST HMS5C4040BLE640 4 TB 7,587,678 113 0.39%
HGST HDS5C3030ALA630 3 TB 6,649,037 148 0.59%
HGST HDS722020ALA330 2 TB 5,316,315 238 1.19%
HGST HDS5C4040ALE630 4 TB 3,986,912 88 0.58%
Seagate ST8000DM002 8 TB 2,779,475 90 1.18%
Most experienced drives
2017 Storage Developer Conference. © 2017 Backblaze Inc. All Rights Reserved. 13
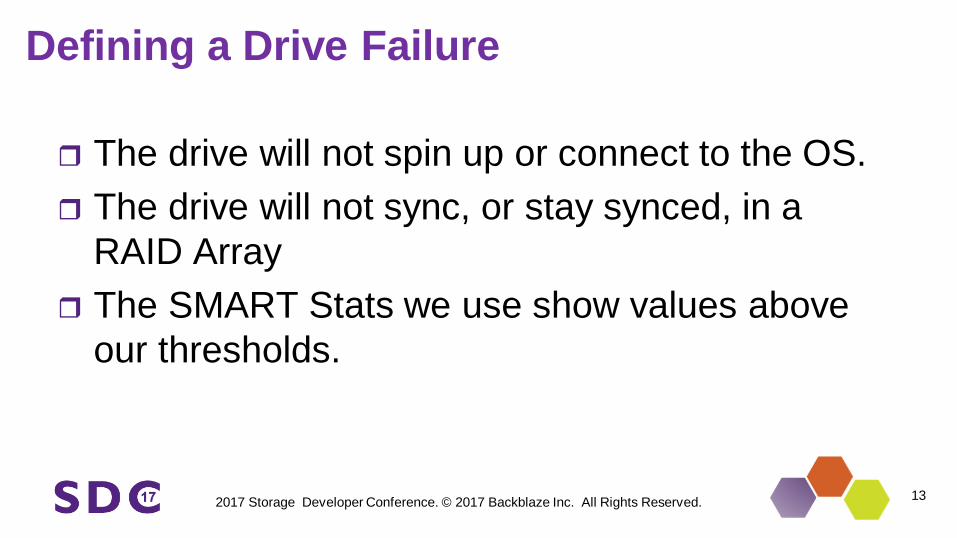
Defining a Drive Failure
The drive will not spin up or connect to the OS. The drive will not sync, or stay synced, in a
RAID Array The SMART Stats we use show values above
our thresholds.
2017 Storage Developer Conference. © 2017 Backblaze Inc. All Rights Reserved. 14
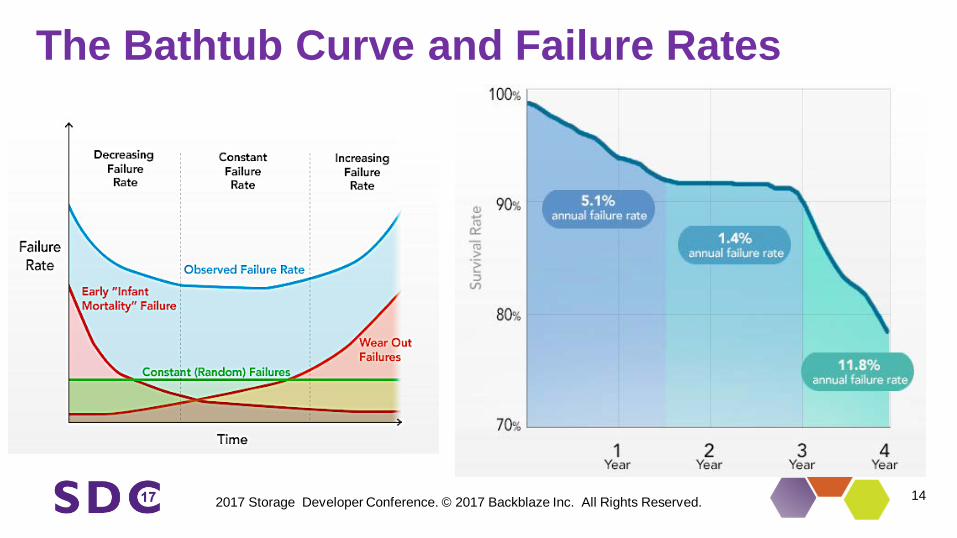
The Bathtub Curve and Failure Rates
2017 Storage Developer Conference. © 2017 Backblaze Inc. All Rights Reserved. 15
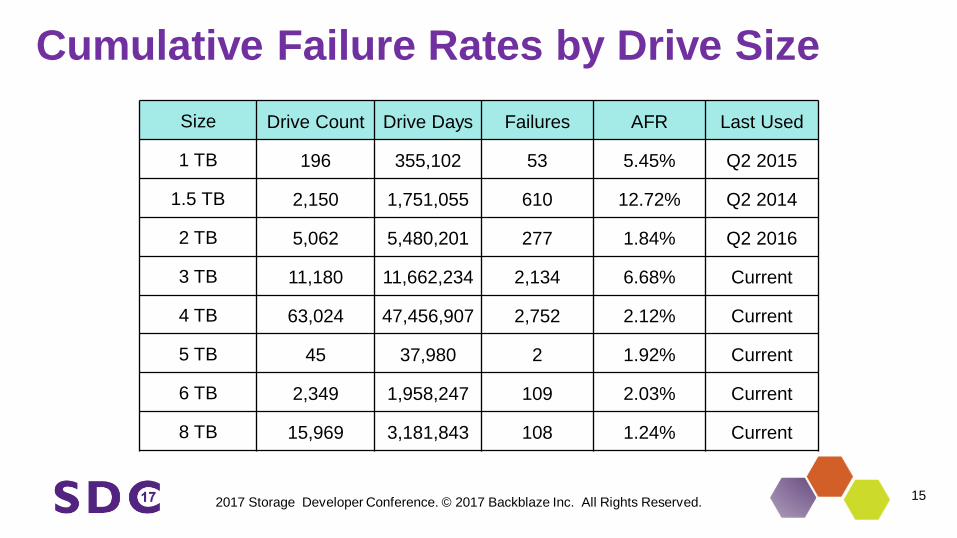
Size Drive Count Drive Days Failures AFR Last Used
1 TB 196 355,102 53 5.45% Q2 2015
1.5 TB 2,150 1,751,055 610 12.72% Q2 2014
2 TB 5,062 5,480,201 277 1.84% Q2 2016
3 TB 11,180 11,662,234 2,134 6.68% Current
4 TB 63,024 47,456,907 2,752 2.12% Current
5 TB 45 37,980 2 1.92% Current
6 TB 2,349 1,958,247 109 2.03% Current
8 TB 15,969 3,181,843 108 1.24% Current
Cumulative Failure Rates by Drive Size
2017 Storage Developer Conference. © 2017 Backblaze Inc. All Rights Reserved. 16
Consumer drives in a Data Center?
Yes.
2017 Storage Developer Conference. © 2017 Backblaze Inc. All Rights Reserved. 17
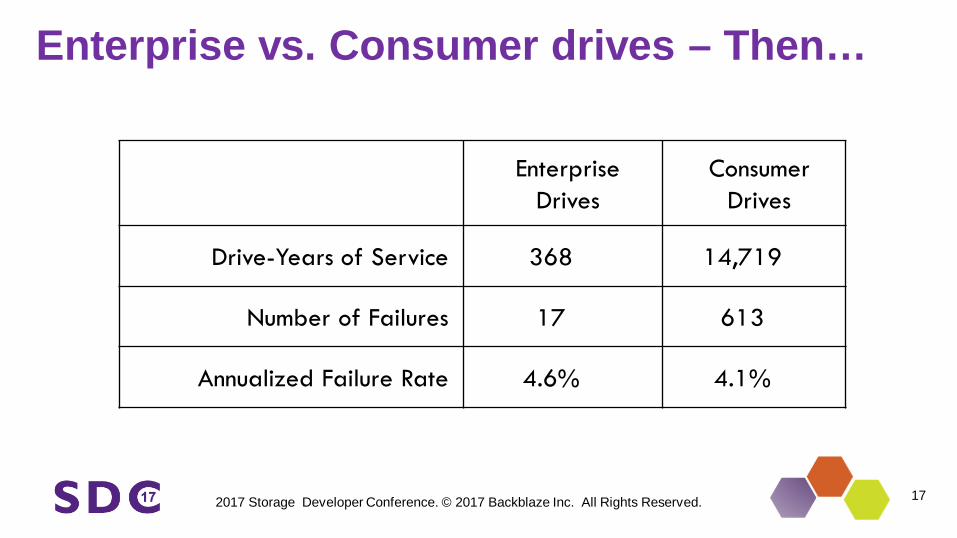
Enterprise Drives
Consumer Drives
Drive-Years of Service 368 14,719
Number of Failures 17 613
Annualized Failure Rate 4.6% 4.1%
Enterprise vs. Consumer drives – Then…
2017 Storage Developer Conference. © 2017 Backblaze Inc. All Rights Reserved. 18
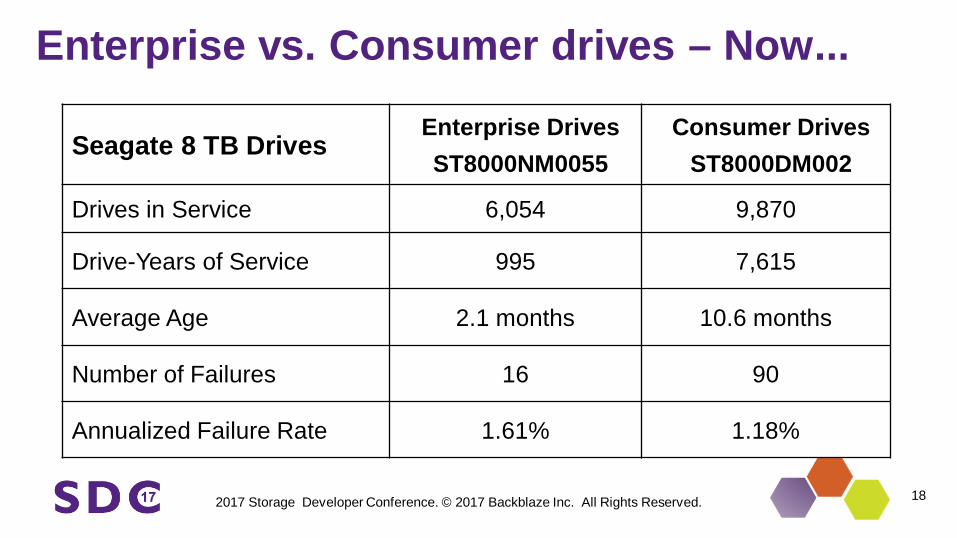
Seagate 8 TB DrivesEnterprise DrivesST8000NM0055
Consumer DrivesST8000DM002
Drives in Service 6,054 9,870
Drive-Years of Service 995 7,615
Average Age 2.1 months 10.6 months
Number of Failures 16 90
Annualized Failure Rate 1.61% 1.18%
Enterprise vs. Consumer drives – Now...
2017 Storage Developer Conference. © 2017 Backblaze Inc. All Rights Reserved. 19
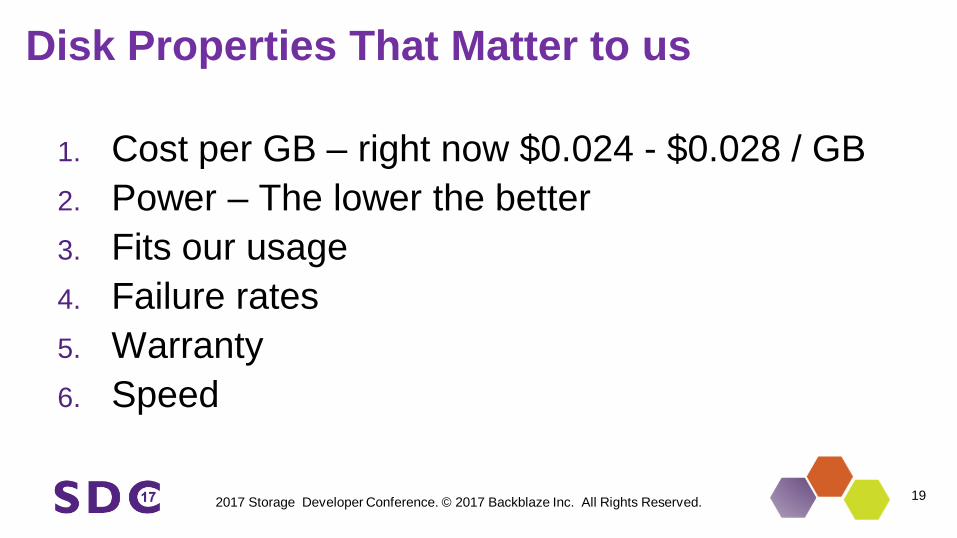
Disk Properties That Matter to us
1. Cost per GB – right now $0.024 - $0.028 / GB2. Power – The lower the better3. Fits our usage4. Failure rates5. Warranty6. Speed
2017 Storage Developer Conference. © 2017 Backblaze Inc. All Rights Reserved. 20
Can you diagnose a “sick” drive?
2017 Storage Developer Conference. © 2017 Backblaze Inc. All Rights Reserved. 21
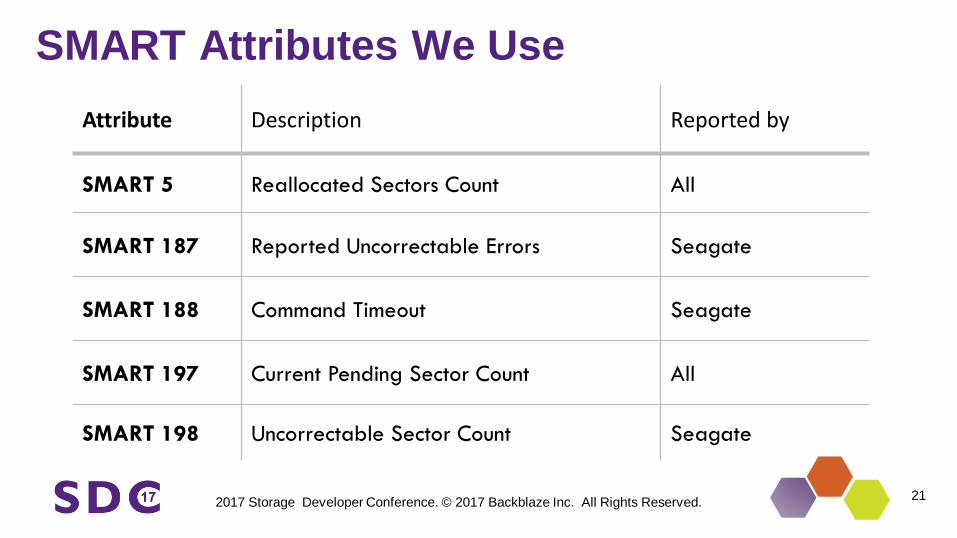
Attribute Description Reported by
SMART 5 Reallocated Sectors Count All
SMART 187 Reported Uncorrectable Errors Seagate
SMART 188 Command Timeout Seagate
SMART 197 Current Pending Sector Count All
SMART 198 Uncorrectable Sector Count Seagate
SMART Attributes We Use
2017 Storage Developer Conference. © 2017 Backblaze Inc. All Rights Reserved. 22
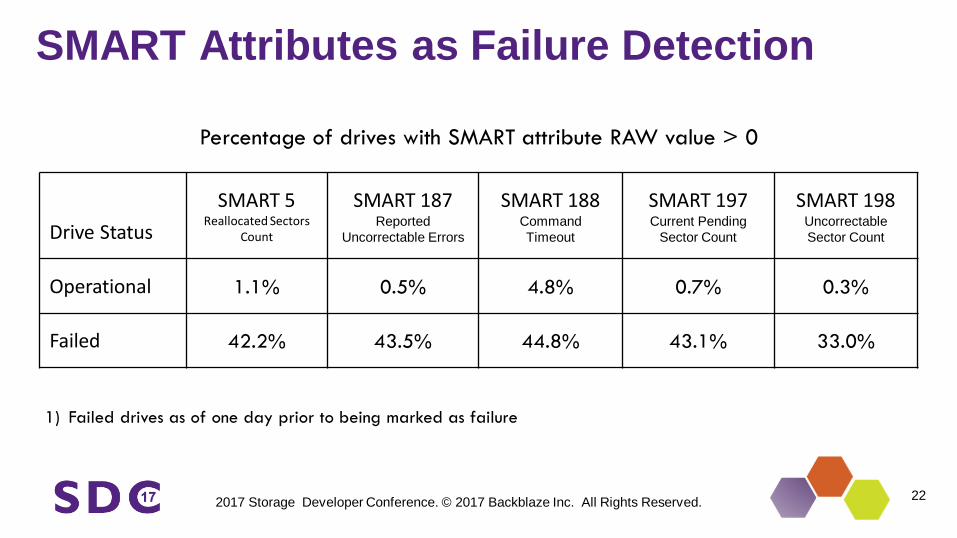
Drive StatusSMART 5
Reallocated Sectors Count
SMART 187Reported
Uncorrectable Errors
SMART 188Command Timeout
SMART 197Current Pending
Sector Count
SMART 198Uncorrectable Sector Count
Operational 1.1% 0.5% 4.8% 0.7% 0.3%
Failed 42.2% 43.5% 44.8% 43.1% 33.0%
Percentage of drives with SMART attribute RAW value > 0
1) Failed drives as of one day prior to being marked as failure
SMART Attributes as Failure Detection
2017 Storage Developer Conference. © 2017 Backblaze Inc. All Rights Reserved. 23
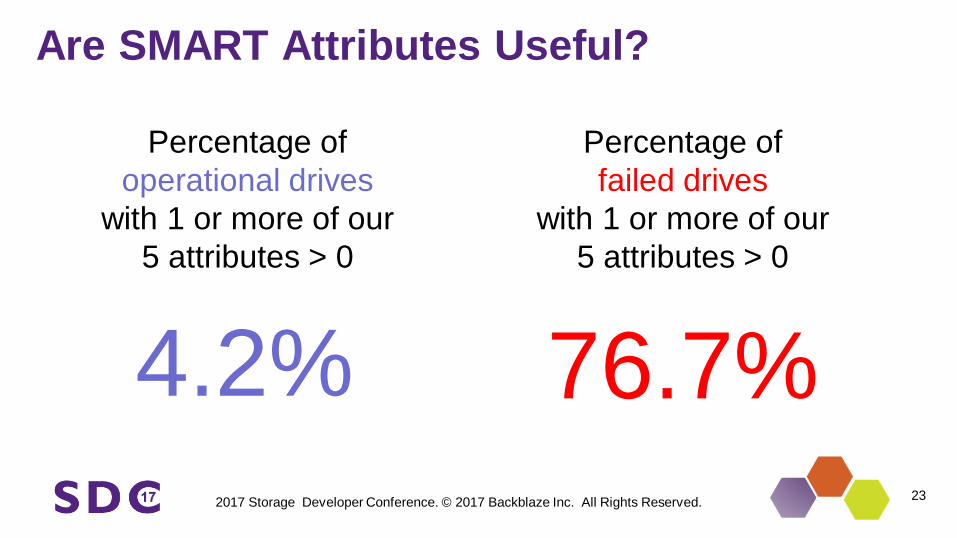
Percentage of operational drives
with 1 or more of our 5 attributes > 0
Percentage of failed drives
with 1 or more of our 5 attributes > 0
4.2% 76.7%
Are SMART Attributes Useful?
2017 Storage Developer Conference. © 2017 Backblaze Inc. All Rights Reserved. 24
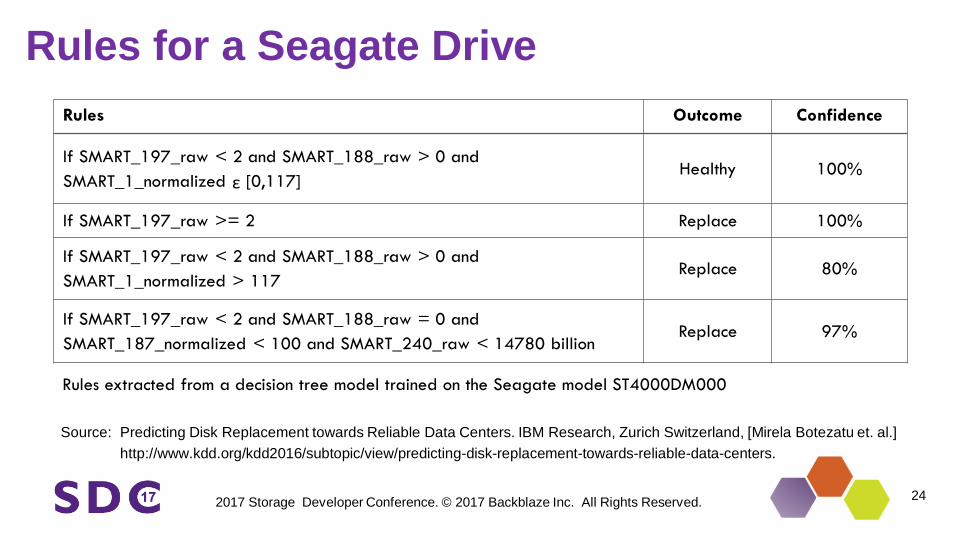
Rules for a Seagate Drive
Source: Predicting Disk Replacement towards Reliable Data Centers. IBM Research, Zurich Switzerland, [Mirela Botezatu et. al.] http://www.kdd.org/kdd2016/subtopic/view/predicting-disk-replacement-towards-reliable-data-centers.
Rules extracted from a decision tree model trained on the Seagate model ST4000DM000
Rules Outcome Confidence
If SMART_197_raw < 2 and SMART_188_raw > 0 and SMART_1_normalized ε [0,117]
Healthy 100%
If SMART_197_raw >= 2 Replace 100%
If SMART_197_raw < 2 and SMART_188_raw > 0 and SMART_1_normalized > 117
Replace 80%
If SMART_197_raw < 2 and SMART_188_raw = 0 and SMART_187_normalized < 100 and SMART_240_raw < 14780 billion
Replace 97%
2017 Storage Developer Conference. © 2017 Backblaze Inc. All Rights Reserved. 25
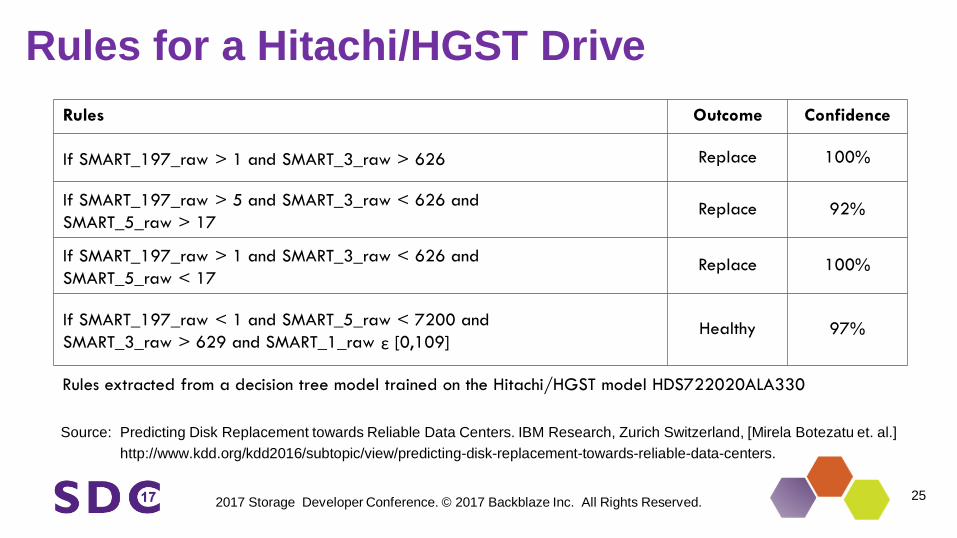
Rules for a Hitachi/HGST Drive
Source: Predicting Disk Replacement towards Reliable Data Centers. IBM Research, Zurich Switzerland, [Mirela Botezatu et. al.] http://www.kdd.org/kdd2016/subtopic/view/predicting-disk-replacement-towards-reliable-data-centers.
Rules extracted from a decision tree model trained on the Hitachi/HGST model HDS722020ALA330
Rules Outcome Confidence
If SMART_197_raw > 1 and SMART_3_raw > 626 Replace 100%
If SMART_197_raw > 5 and SMART_3_raw < 626 and SMART_5_raw > 17
Replace 92%
If SMART_197_raw > 1 and SMART_3_raw < 626 and SMART_5_raw < 17
Replace 100%
If SMART_197_raw < 1 and SMART_5_raw < 7200 and SMART_3_raw > 629 and SMART_1_raw ε [0,109]
Healthy 97%
2017 Storage Developer Conference. © 2017 Backblaze Inc. All Rights Reserved. 26
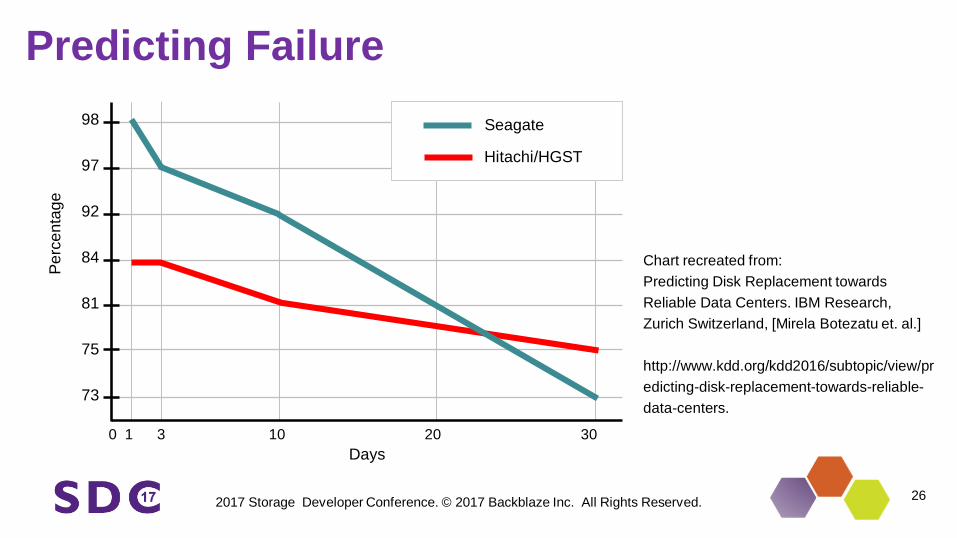
Predicting Failure98
97
92
84
81
75
73
Perc
enta
ge
Chart recreated from:Predicting Disk Replacement towards Reliable Data Centers. IBM Research, Zurich Switzerland, [Mirela Botezatu et. al.]
http://www.kdd.org/kdd2016/subtopic/view/predicting-disk-replacement-towards-reliable-data-centers.
0 1 3 10 20 30
Seagate
Hitachi/HGST
Days
2017 Storage Developer Conference. © 2017 Backblaze Inc. All Rights Reserved. 27
What other SMART stats have we looked at to see if they can help predict drive failure?
2017 Storage Developer Conference. © 2017 Backblaze Inc. All Rights Reserved. 28
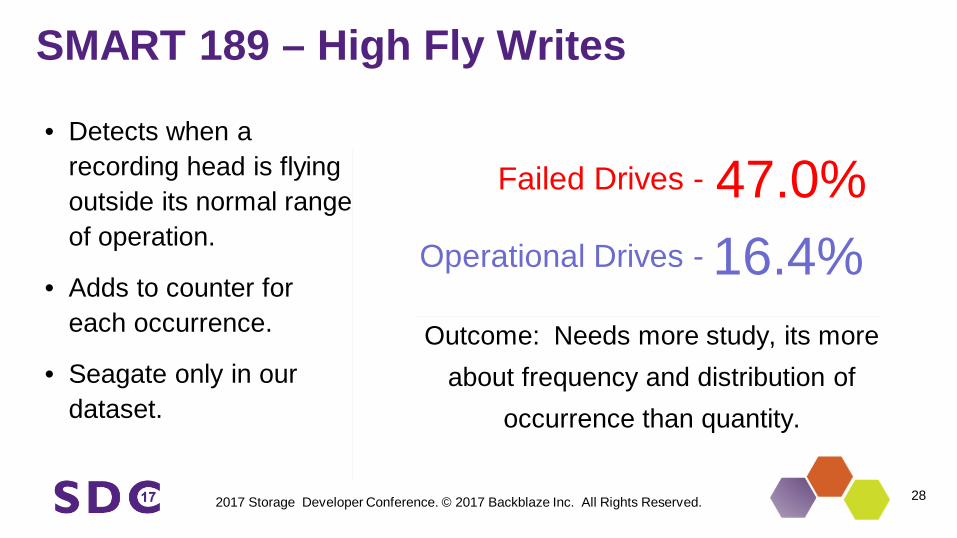
Outcome: Needs more study, its more about frequency and distribution of
occurrence than quantity.
• Detects when a recording head is flying outside its normal range of operation.
• Adds to counter for each occurrence.
• Seagate only in our dataset.
Failed Drives -
16.4%47.0%
Operational Drives -
SMART 189 – High Fly Writes
2017 Storage Developer Conference. © 2017 Backblaze Inc. All Rights Reserved. 29
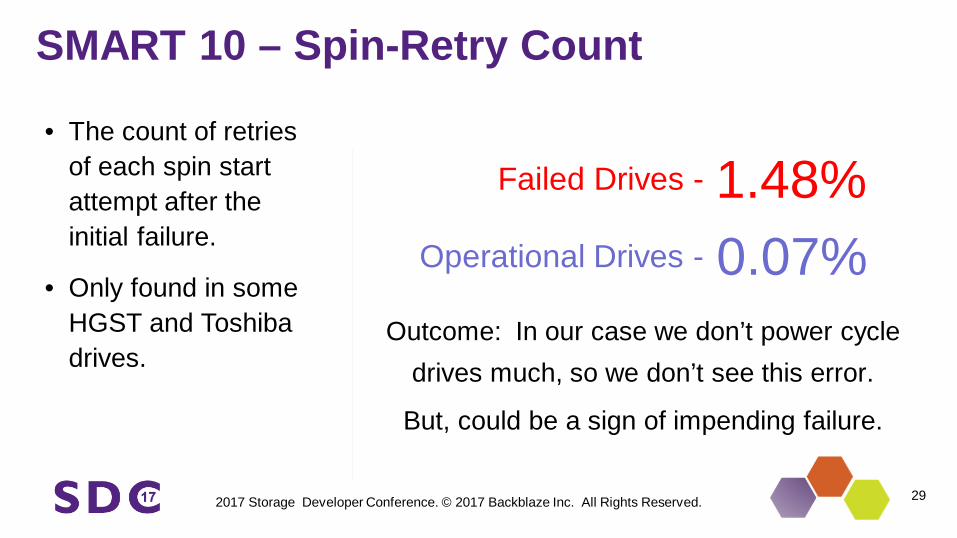
Outcome: In our case we don’t power cycle drives much, so we don’t see this error.
But, could be a sign of impending failure.
• The count of retries of each spin start attempt after the initial failure.
• Only found in some HGST and Toshiba drives.
Failed Drives -
0.07%1.48%
Operational Drives -
SMART 10 – Spin-Retry Count
2017 Storage Developer Conference. © 2017 Backblaze Inc. All Rights Reserved. 30
Is power cycling drives bad?
2017 Storage Developer Conference. © 2017 Backblaze Inc. All Rights Reserved. 31
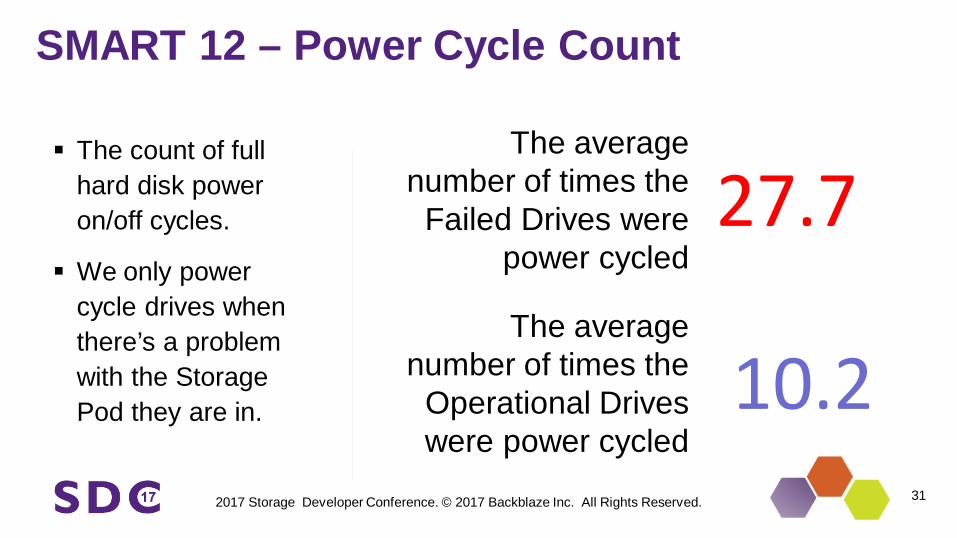
The count of full hard disk power on/off cycles.
We only power cycle drives when there’s a problem with the Storage Pod they are in.
The average number of times the
Failed Drives were power cycled
10.2
27.7The average
number of times the Operational Drives were power cycled
SMART 12 – Power Cycle Count
2017 Storage Developer Conference. © 2017 Backblaze Inc. All Rights Reserved. 32
Review
History Drive Stats
Reliability over time Enterprise vs. consumer drives
SMART Stats Is predicting drive failure possible? Other attributes to consider

2017 Storage Developer Conference. © 2017 Backblaze Inc. All Rights Reserved. 33
Questions
backblaze.com/b2/hard-drive-test-data.html