What kinds of assessments improve learning? Dylan Wiliam, ETS.
Upload
lynne-hinesCategory
view
232download
1
What assessment can—and cannot—do for teachers of reading
Dylan Wiliam (@dylanwiliam)
www.dylanwiliam.org
2
Don’t blame me: I’m Welsh
A very simple code: a b c ch d dd e f ff g ng h i j l ll m n o p ph r rh s t th u w y
Complications: vowels can be short or long “y” can be clear (unaccented) or obscure (accented), but the accent is (almost) always on the penultimate syllable
Simplifications: one letter—>one sound if you want a diphthong, use two vowels (wy, aw, ei,…)
Overview: Science and Design
We need to improve student achievement This requires improving teacher quality Improving the quality of entrants takes too long So we have to make the teachers we have better We can change teachers in a range of ways Some will benefit students, and some will not Those that do involve changes in teacher practice
Changing practice requires new kinds of teacher learning And new models of professional development
Design
Science
3
4
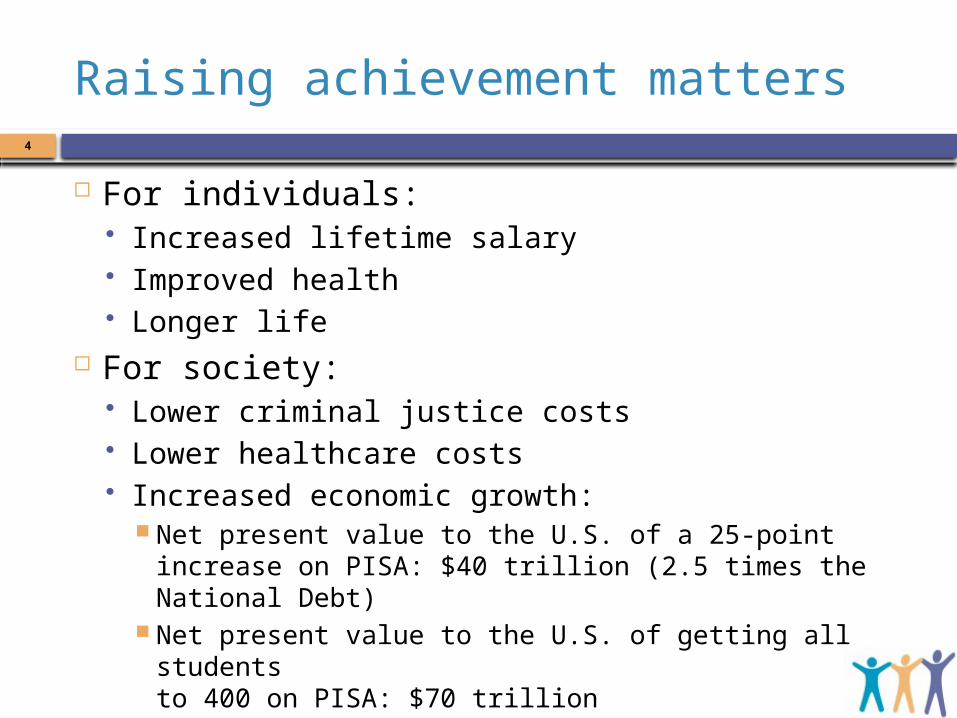
Raising achievement matters
For individuals: Increased lifetime salary Improved health Longer life
For society: Lower criminal justice costs Lower healthcare costs Increased economic growth:
Net present value to the U.S. of a 25-point increase on PISA: $40 trillion (2.5 times the National Debt)
Net present value to the U.S. of getting all students to 400 on PISA: $70 trillion
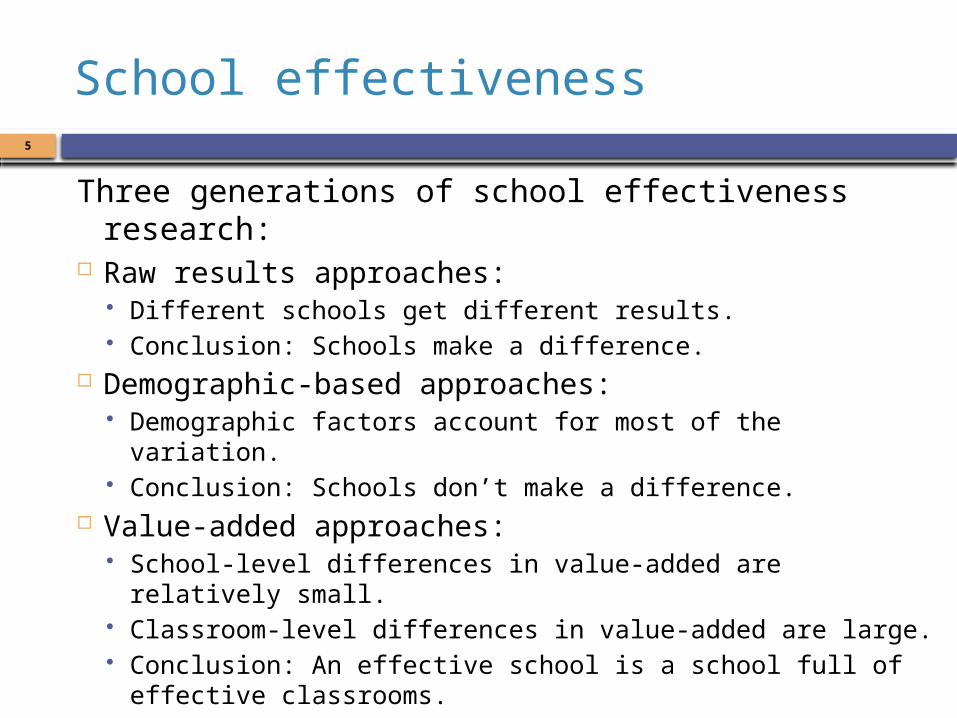
School effectiveness
Three generations of school effectiveness research: Raw results approaches:
Different schools get different results. Conclusion: Schools make a difference.
Demographic-based approaches: Demographic factors account for most of the variation. Conclusion: Schools don’t make a difference.
Value-added approaches: School-level differences in value-added are relatively small. Classroom-level differences in value-added are large. Conclusion: An effective school is a school full of effective
classrooms.
5
6
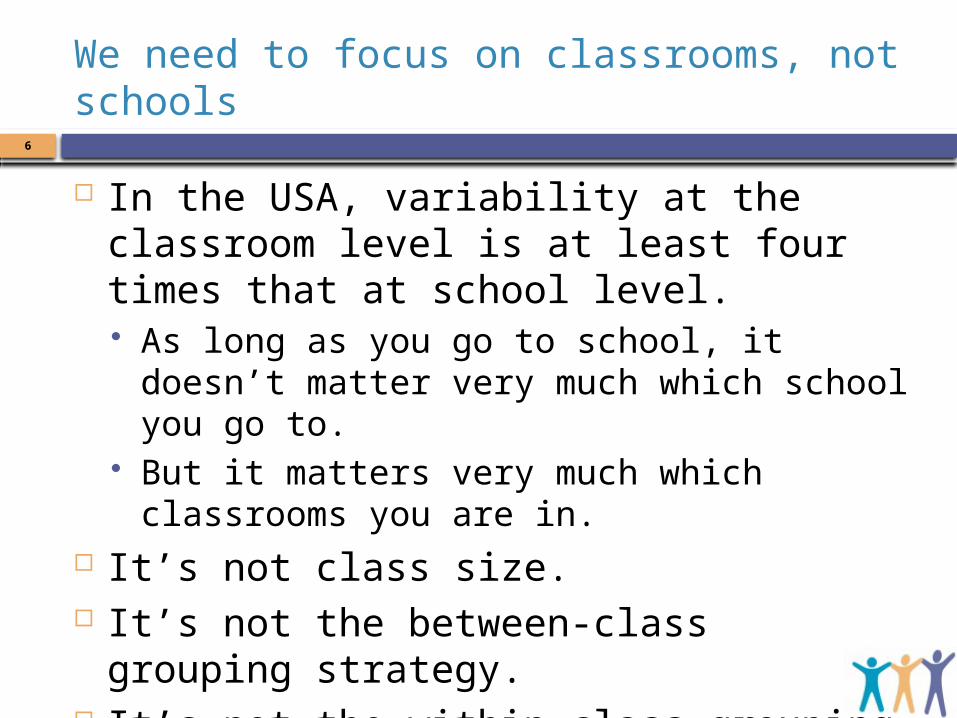
We need to focus on classrooms, not schools
In the USA, variability at the classroom level is at least four times that at school level. As long as you go to school, it doesn’t matter very
much which school you go to. But it matters very much which classrooms you are in.
It’s not class size. It’s not the between-class grouping strategy. It’s not the within-class grouping strategy.
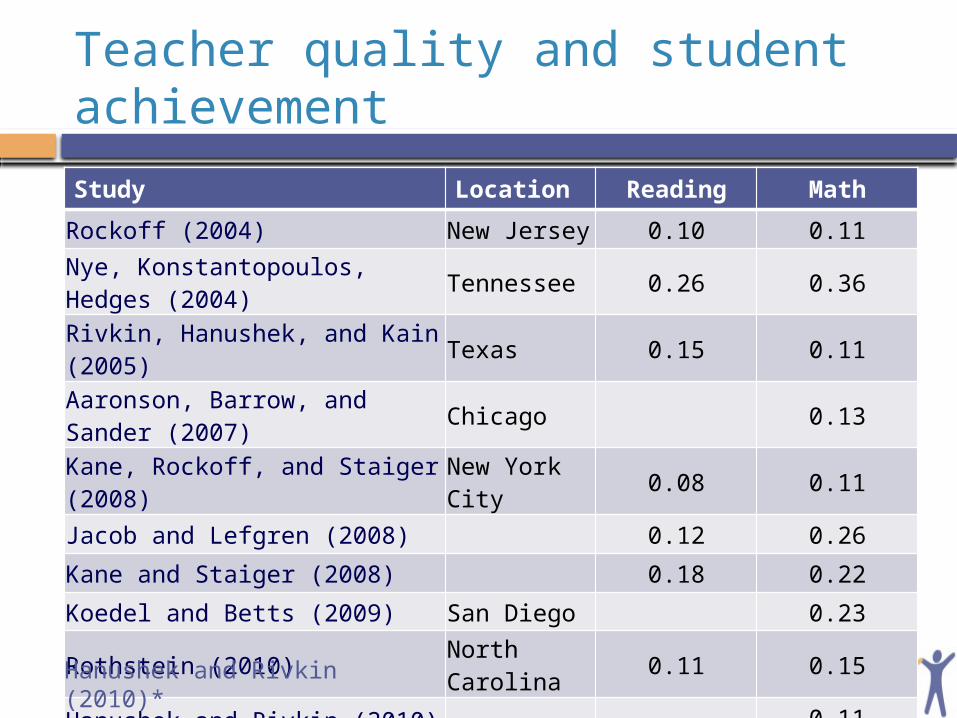
Teacher quality and student achievement
Study Location Reading Math
Rockoff (2004) New Jersey 0.10 0.11
Nye, Konstantopoulos, Hedges (2004) Tennessee 0.26 0.36
Rivkin, Hanushek, and Kain (2005) Texas 0.15 0.11
Aaronson, Barrow, and Sander (2007) Chicago 0.13
Kane, Rockoff, and Staiger (2008) New York City 0.08 0.11
Jacob and Lefgren (2008) 0.12 0.26
Kane and Staiger (2008) 0.18 0.22
Koedel and Betts (2009) San Diego 0.23
Rothstein (2010) North Carolina 0.11 0.15
Hanushek and Rivkin (2010) 0.11
Chetty et al. (2014) 0.12 0.16
Hanushek and Rivkin (2010)*
What this means8
Take a group of 50 teachers: Students taught by the most effective teacher in that group
of 50 teachers learn in six months what those taught by the average teacher learn in a year.
Students taught by the least effective teacher in that group of 50 teachers will take two years to achieve the same learning
(Hanushek & Rivkin, 2006) And furthermore:
In the classrooms of the most effective teachers, students from disadvantaged backgrounds learn at the same rate as those from advantaged backgrounds
(Hamre & Pianta, 2005).
Improving teacher quality takes time
A classic labor force issue with two (non-exclusive) solutions: Replace existing teachers with better ones:
Raising the bar for entry into the profession? De-select (i.e., fire) ineffective teachers?
Teacher observations? Value-added measurements? Student perception surveys?
Help existing teachers become even more effective.
9
Raise the bar for entry into teaching?

Teacher qualifications and student progress11
Mathematics Reading
Primary Middle High Primary Middle High
General theory of education coursesTeaching practice coursesPedagogical content coursesAdvanced university coursesAptitude test scores
Harris and Sass (2007)
Mathematics Reading
Primary Middle High Primary Middle High
General theory of education courses —Teaching practice courses — +Pedagogical content courses + +Advanced university courses — +Aptitude test scores —
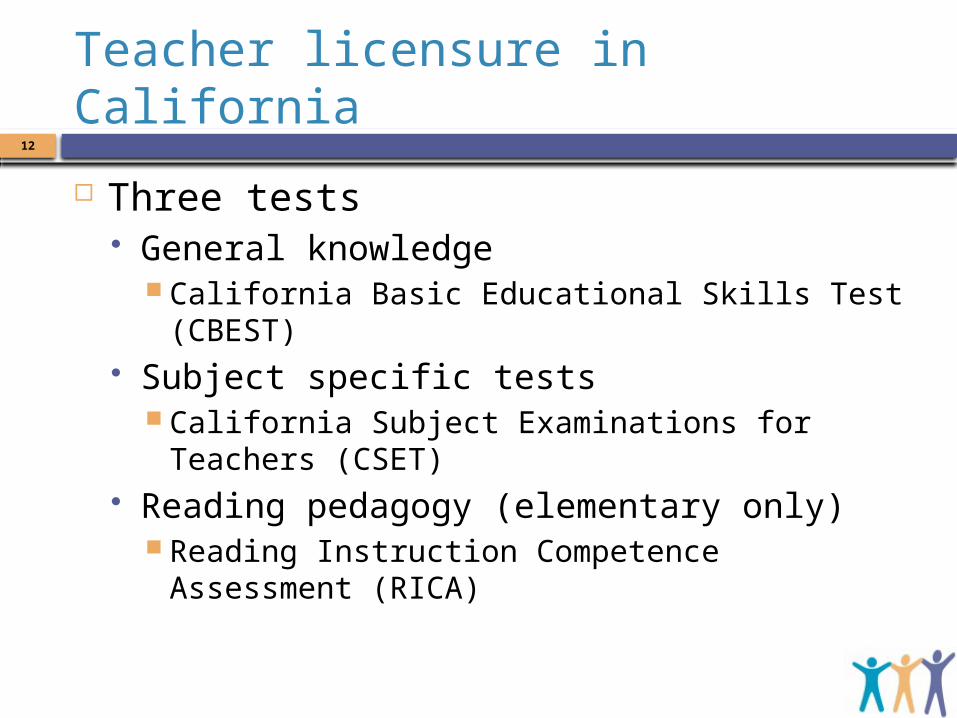
Teacher licensure in California12
Three tests General knowledge
California Basic Educational Skills Test (CBEST) Subject specific tests
California Subject Examinations for Teachers (CSET) Reading pedagogy (elementary only)
Reading Instruction Competence Assessment (RICA)
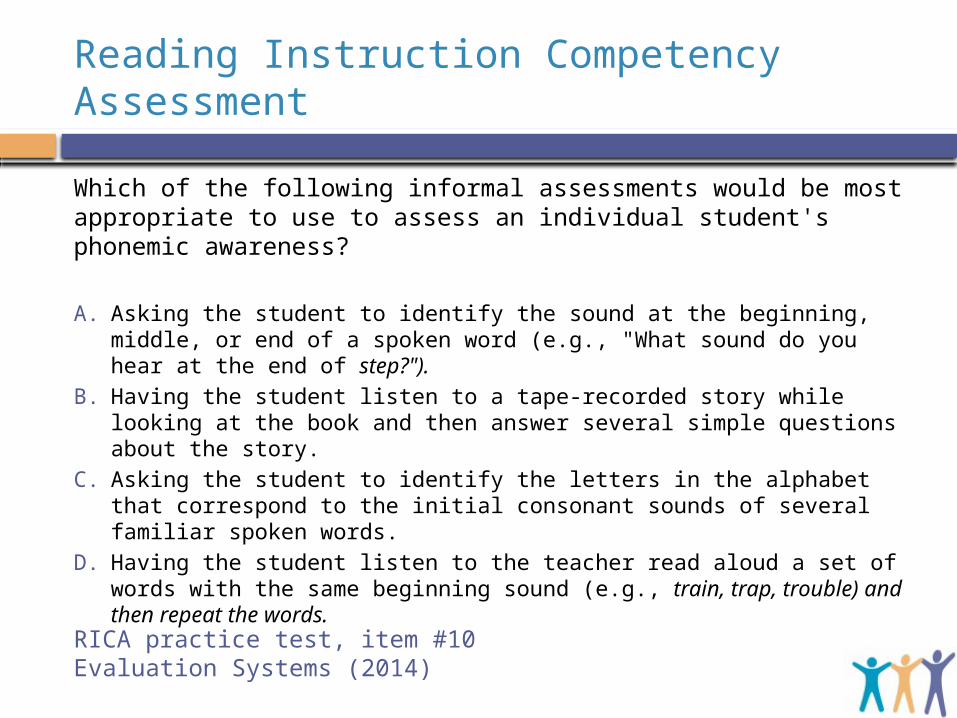
Reading Instruction Competency Assessment
Which of the following informal assessments would be most appropriate to use to assess an individual student's phonemic awareness?
A. Asking the student to identify the sound at the beginning, middle, or end of a spoken word (e.g., "What sound do you hear at the end of step?").
B. Having the student listen to a tape-recorded story while looking at the book and then answer several simple questions about the story.
C. Asking the student to identify the letters in the alphabet that correspond to the initial consonant sounds of several familiar spoken words.
D. Having the student listen to the teacher read aloud a set of words with the same beginning sound (e.g., train, trap, trouble) and then repeat the words.
RICA practice test, item #10Evaluation Systems (2014)
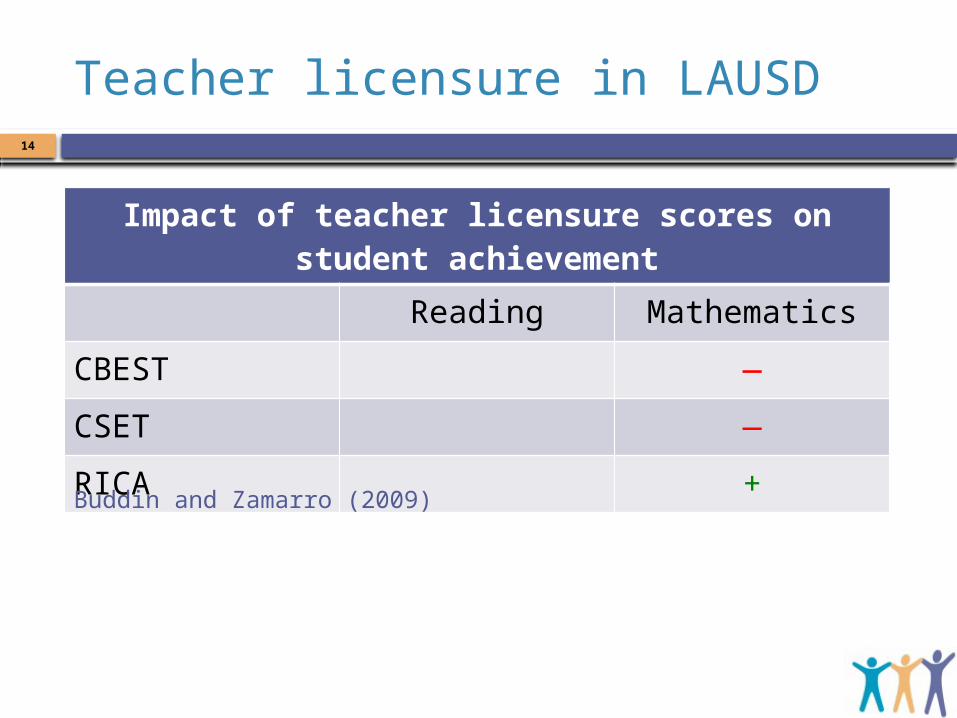
Teacher licensure in LAUSD14
Impact of teacher licensure scores on student achievement
Reading Mathematics
CBEST —
CSET —
RICA +
Buddin and Zamarro (2009)

Teacher observations
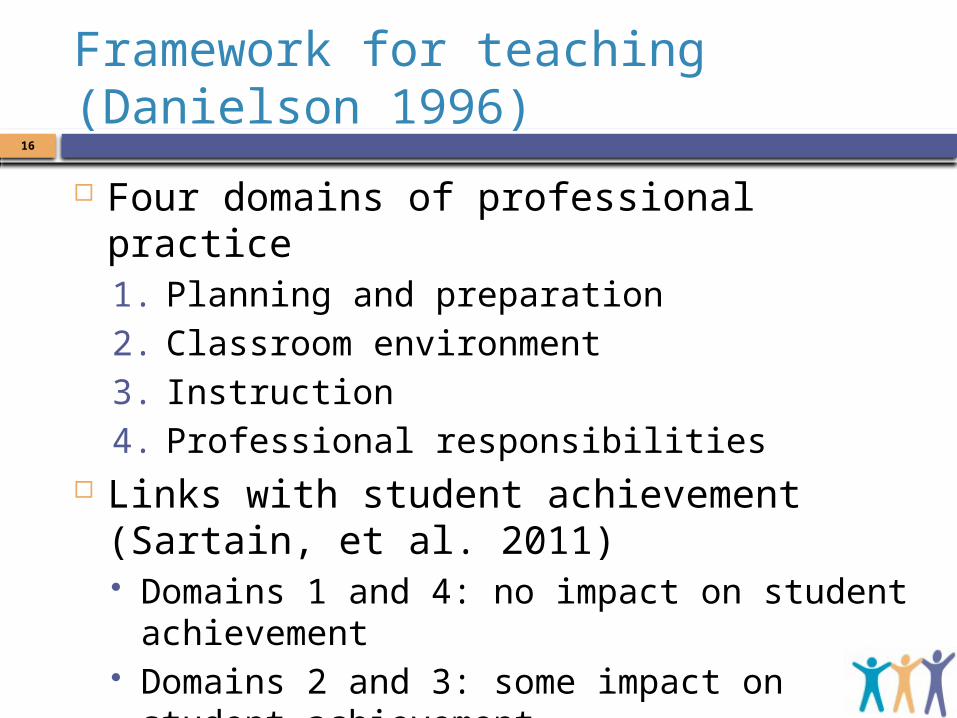
Framework for teaching (Danielson 1996)
Four domains of professional practice1. Planning and preparation2. Classroom environment3. Instruction4. Professional responsibilities
Links with student achievement (Sartain, et al. 2011) Domains 1 and 4: no impact on student achievement Domains 2 and 3: some impact on student achievement
16
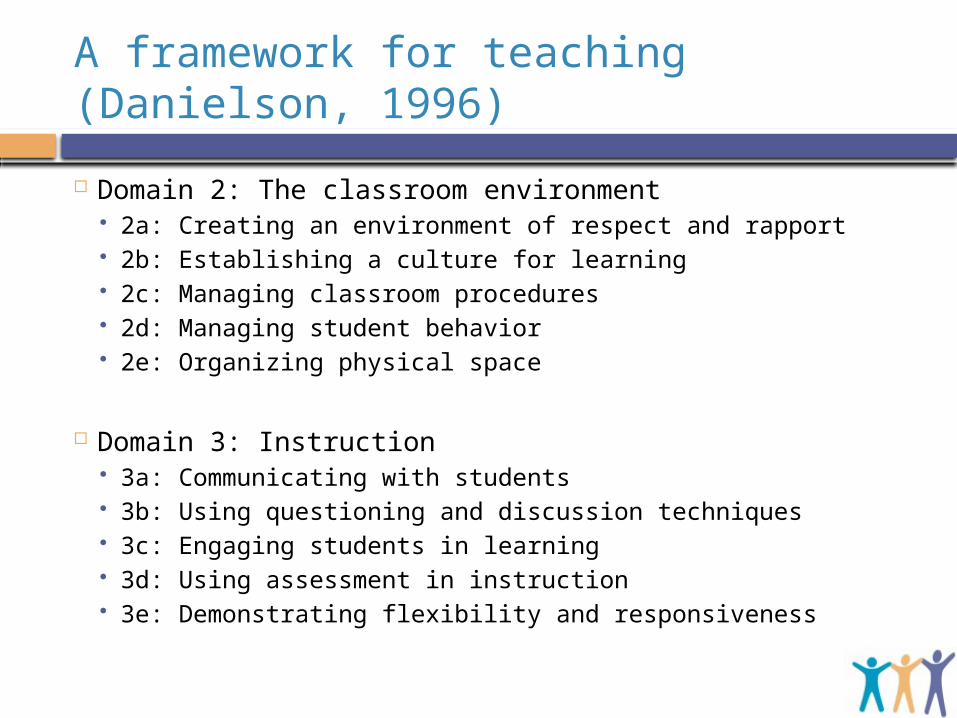
A framework for teaching (Danielson, 1996)
Domain 2: The classroom environment 2a: Creating an environment of respect and rapport 2b: Establishing a culture for learning 2c: Managing classroom procedures 2d: Managing student behavior 2e: Organizing physical space
Domain 3: Instruction 3a: Communicating with students 3b: Using questioning and discussion techniques 3c: Engaging students in learning 3d: Using assessment in instruction 3e: Demonstrating flexibility and responsiveness
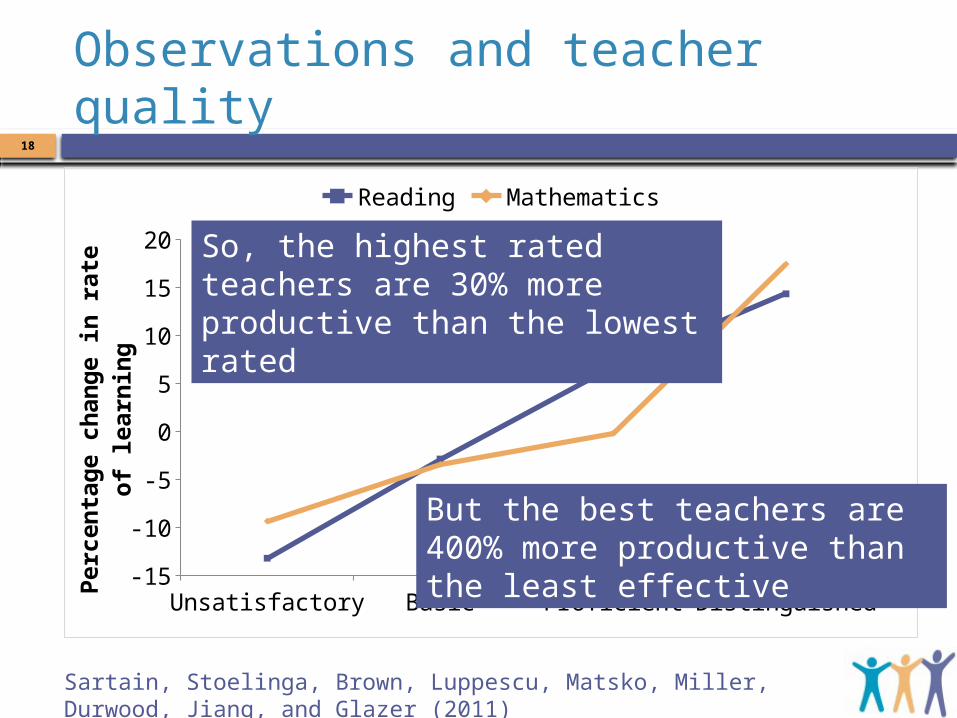
Observations and teacher quality18
Unsatisfactory Basic Proficient Distinguished-15
-10
-5
0
5
10
15
20
Reading Mathematics
Perc
enta
ge c
hang
e in
rate
of l
earn
-in
g
Sartain, Stoelinga, Brown, Luppescu, Matsko, Miller, Durwood, Jiang, and Glazer (2011)
So, the highest rated teachers are 30% more productive than the lowest rated
But the best teachers are 400% more productive than the least effective
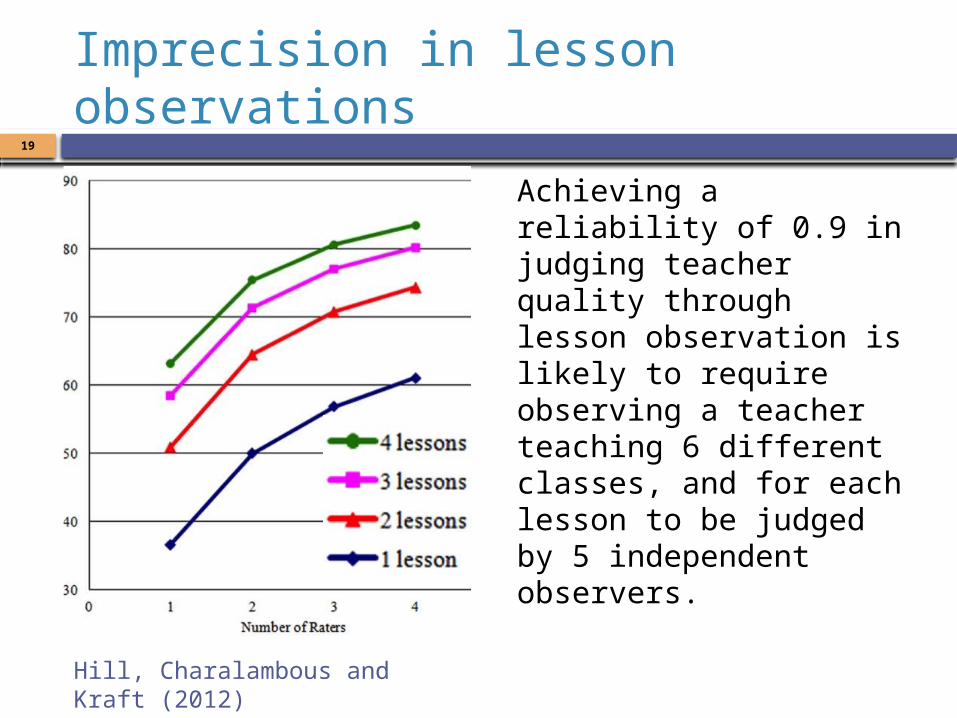
Imprecision in lesson observations19
Achieving a reliability of 0.9 in judging teacher quality through lesson observation is likely to require observing a teacher teaching 6 different classes, and for each lesson to be judged by 5 independent observers.
Hill, Charalambous and Kraft (2012)

Teacher value-added
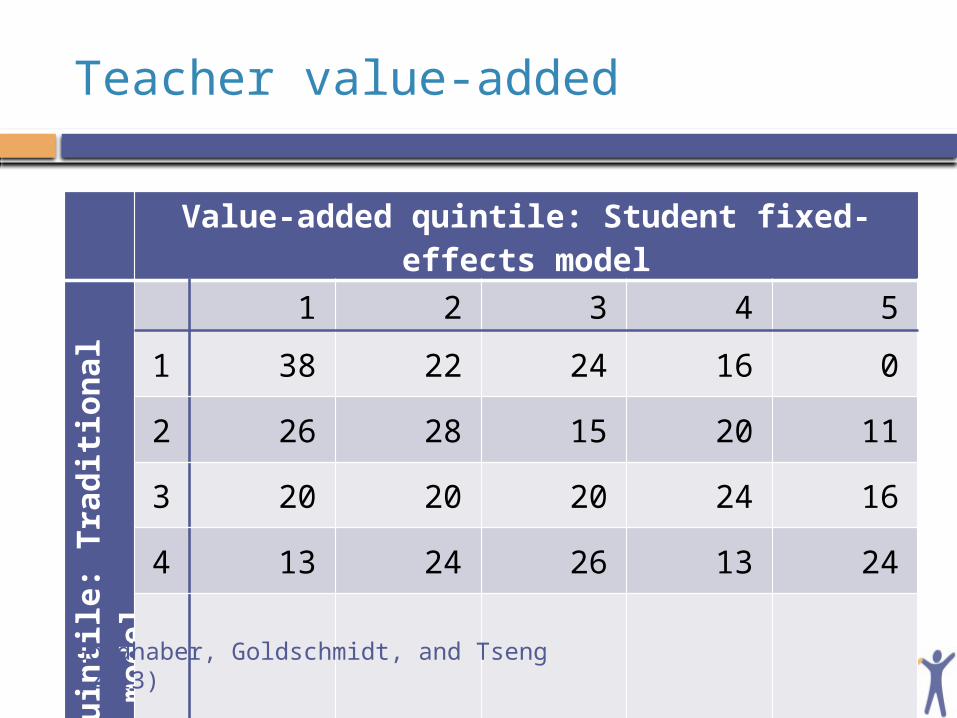
Teacher value-added
Value-added quintile: Student fixed-effects modelValu
e-adde
d quintile: Tradition
al mod
el
1 2 3 4 5
1 38 22 24 16 0
2 26 28 15 20 11
3 20 20 20 24 16
4 13 24 26 13 24
5 9 5 12 28 47
Goldhaber, Goldschmidt, and Tseng (2013)
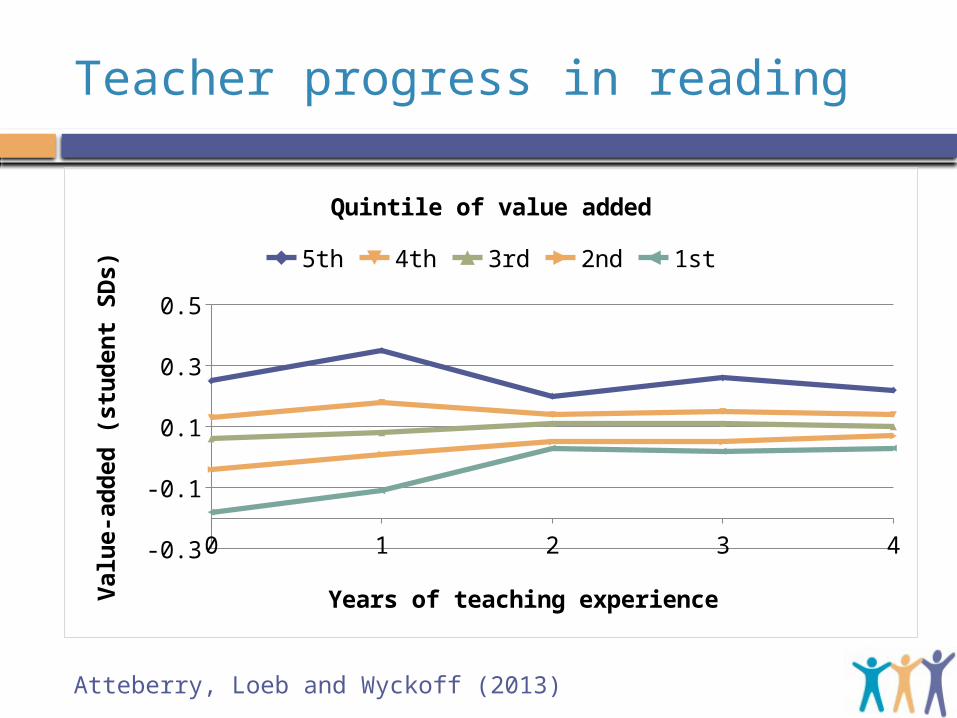
Teacher progress in reading
Atteberry, Loeb and Wyckoff (2013)
0 1 2 3 4-0.3
-0.2
-0.1
5.55111512312578E-17
0.1
0.2
0.3
0.4
Quintile of value added
5th 4th 3rd 2nd 1st
Years of teaching experience
Valu
e-ad
ded
(stu
dent
SD
s)
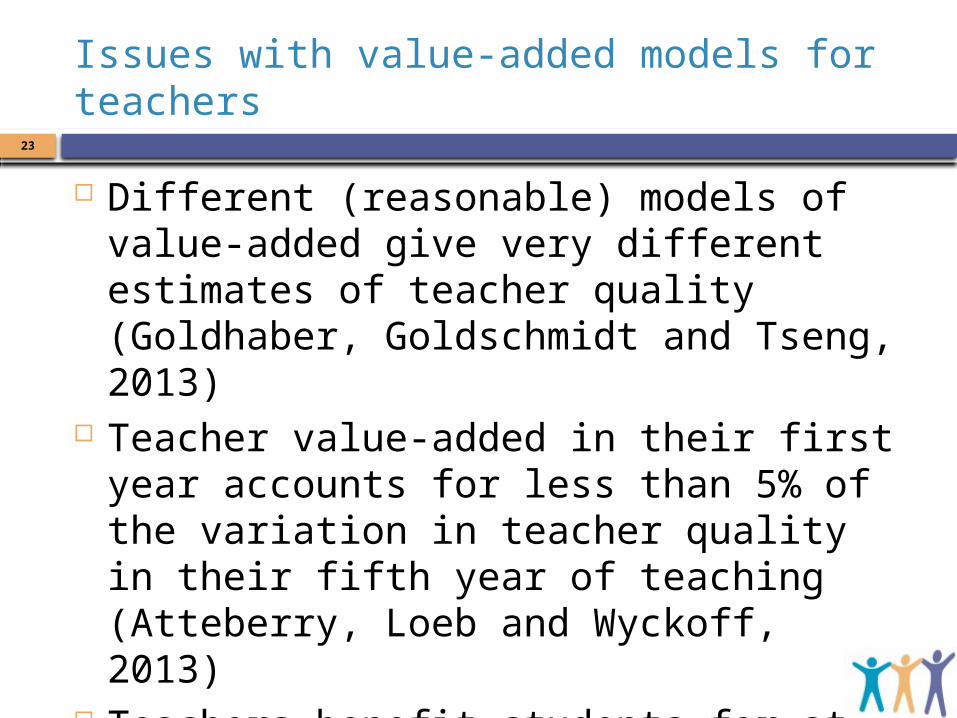
Issues with value-added models for teachers23
Different (reasonable) models of value-added give very different estimates of teacher quality (Goldhaber, Goldschmidt and Tseng, 2013)
Teacher value-added in their first year accounts for less than 5% of the variation in teacher quality in their fifth year of teaching (Atteberry, Loeb and Wyckoff, 2013)
Teachers benefit students for at least three years after they stop teaching them (Rothstein, 2010)
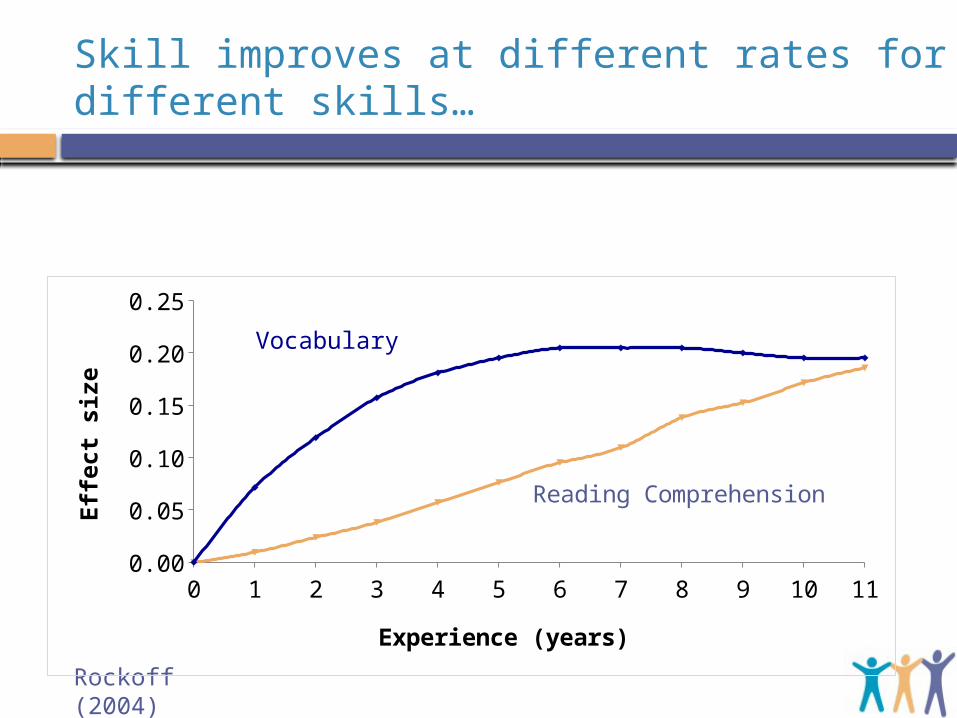
Skill improves at different rates for different skills…
Rockoff (2004)
0 1 2 3 4 5 6 7 8 9 10 110.00
0.05
0.10
0.15
0.20
0.25
Experience (years)
Effec
t siz
e
Reading Comprehension
Vocabulary
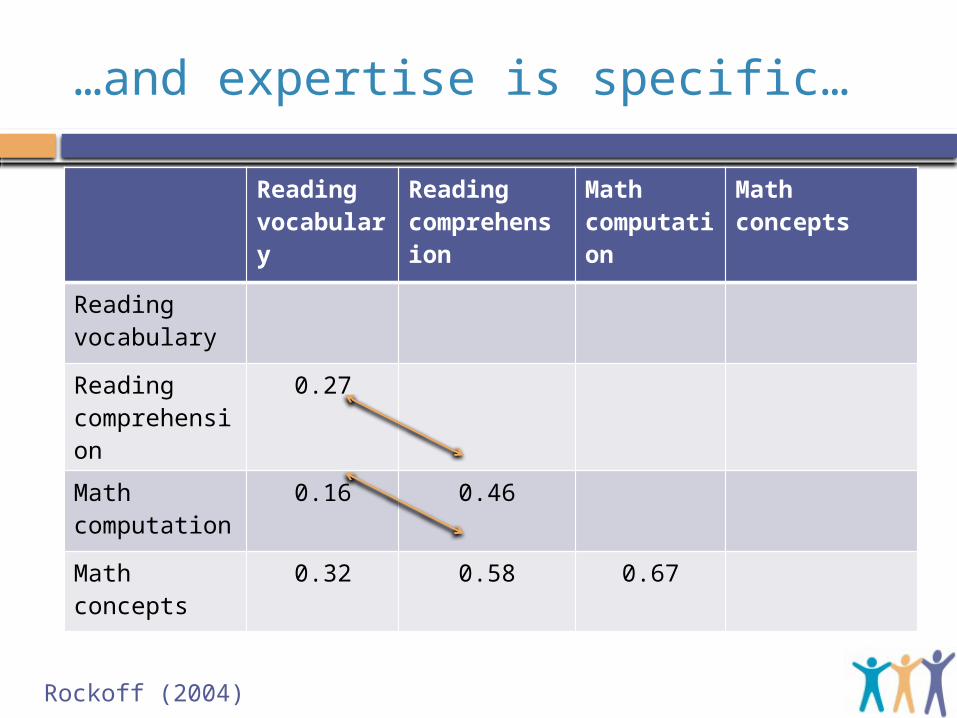
Reading vocabulary
Reading comprehension
Math computation
Mathconcepts
Reading vocabulary
Reading comprehension
0.27
Math computation
0.16 0.46
Mathconcepts
0.32 0.58 0.67
…and expertise is specific…
Rockoff (2004)

Putting it all together26
“Measures of Effective Teaching” project Weightings of different sources to maximize prediction
Teacher value-added ratings (65%) Classroom observations (9%) Student perception surveys (25%)
Reliability of teacher rating: 0.42 Proportion of variance explained in:
state test: 37% higher-order test: 12%
Bill and Melinda Gates Foundation (2012)

Assessment:good servant, bad master
28
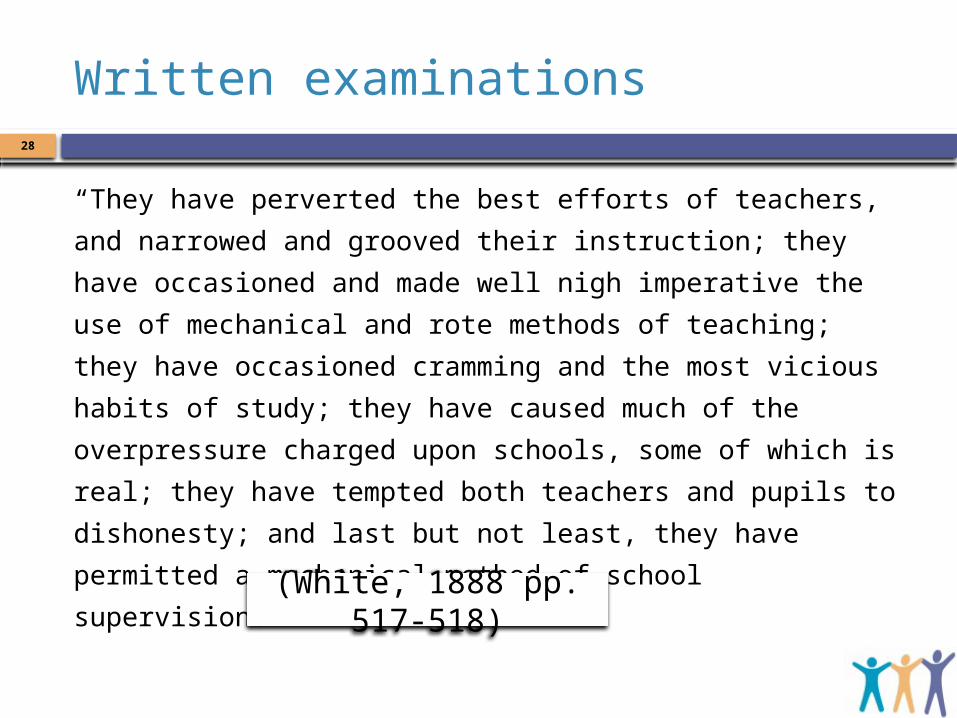
“They have perverted the best efforts of teachers, and narrowed
and grooved their instruction; they have occasioned and made
well nigh imperative the use of mechanical and rote methods of
teaching; they have occasioned cramming and the most vicious
habits of study; they have caused much of the overpressure
charged upon schools, some of which is real; they have tempted
both teachers and pupils to dishonesty; and last but not least,
they have permitted a mechanical method of school
supervision.”
Written examinations
(White, 1888 pp. 517-518)
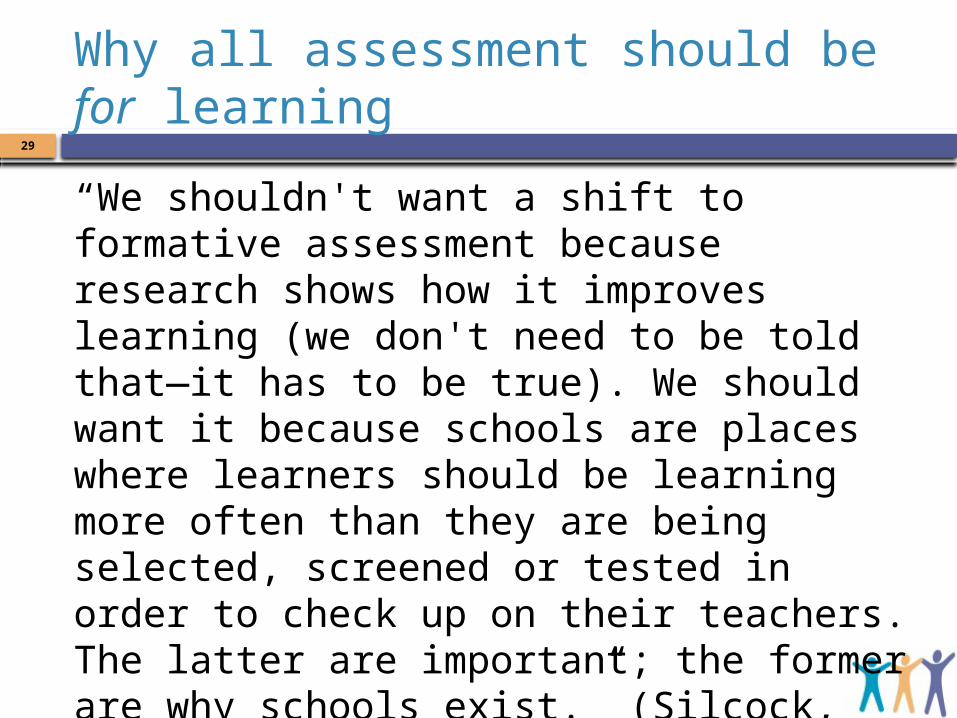
Why all assessment should be for learning29
“We shouldn't want a shift to formative assessment because research shows how it improves learning (we don't need to be told that—it has to be true). We should want it because schools are places where learners should be learning more often than they are being selected, screened or tested in order to check up on their teachers. The latter are important; the former are why schools exist.” (Silcock, 1998)
30
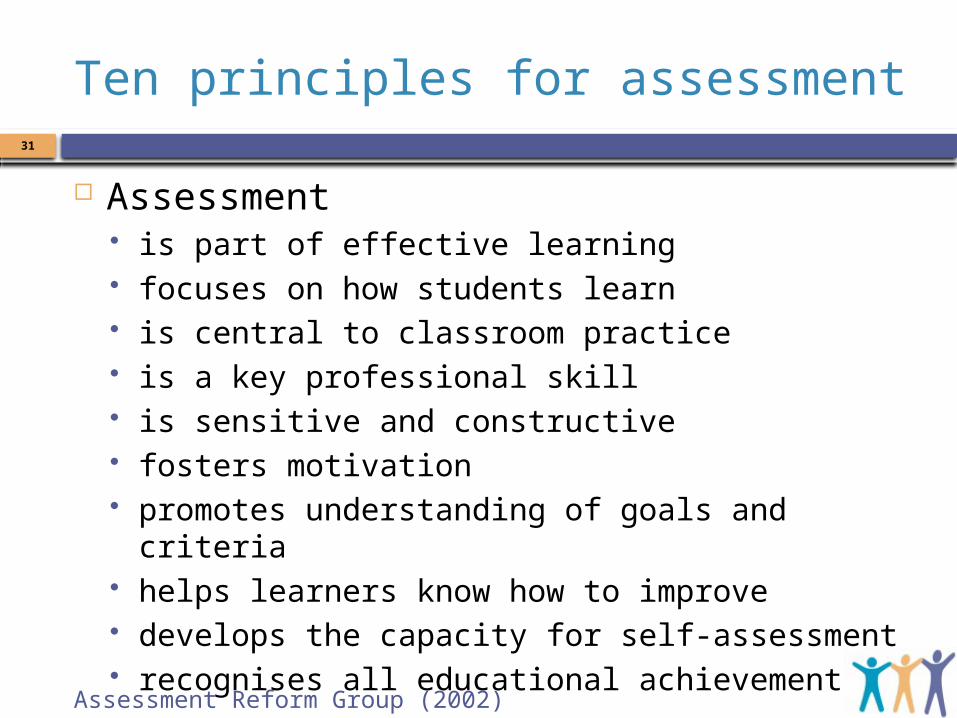
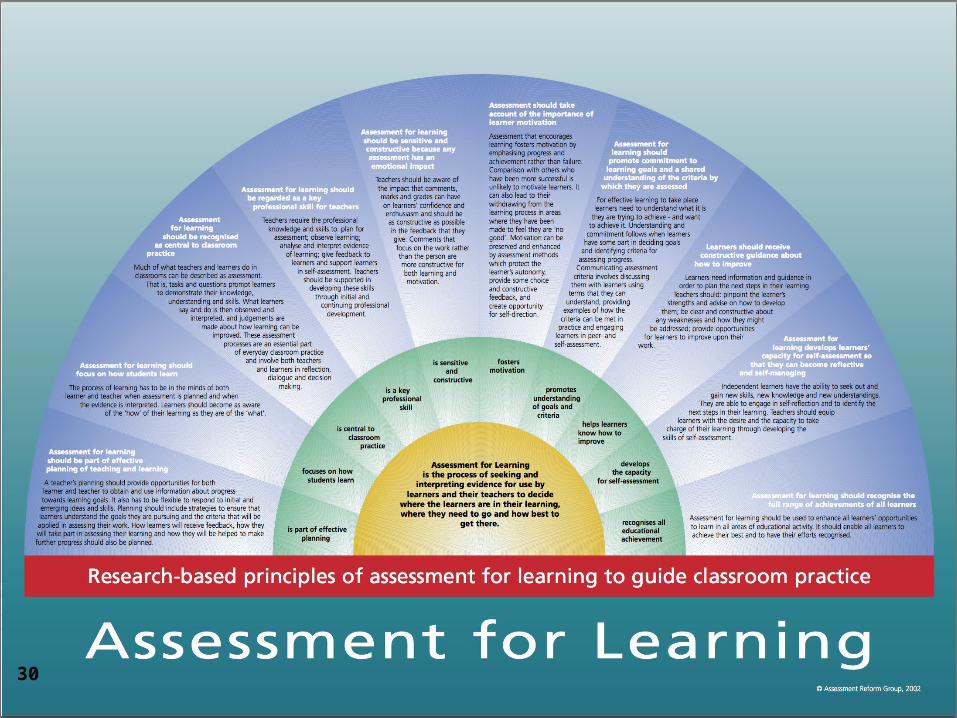
Ten principles for assessment
Assessment is part of effective learning focuses on how students learn is central to classroom practice is a key professional skill is sensitive and constructive fosters motivation promotes understanding of goals and criteria helps learners know how to improve develops the capacity for self-assessment recognises all educational achievement
Assessment Reform Group (2002)
31
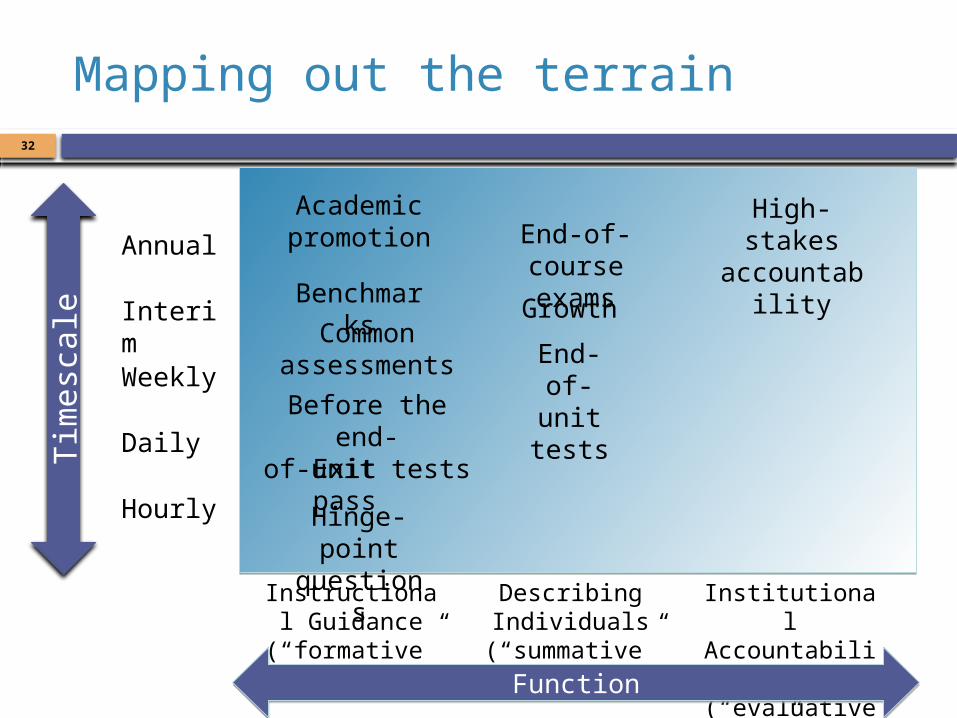
Mapping out the terrain
Annual
Interim
Weekly
Daily
Instructional Guidance
(“formative”)
Describing Individuals
(“summative”)
Institutional Accountability (“evaluative”)
FunctionFunction
Hourly
Tim
esca
le
High-stakes accountability
Academic promotion
Hinge-pointquestions
End-of-unit tests
Benchmarks
Exit pass
Common assessments
End-of-course exams
Before the end-of-unit tests
Growth
32
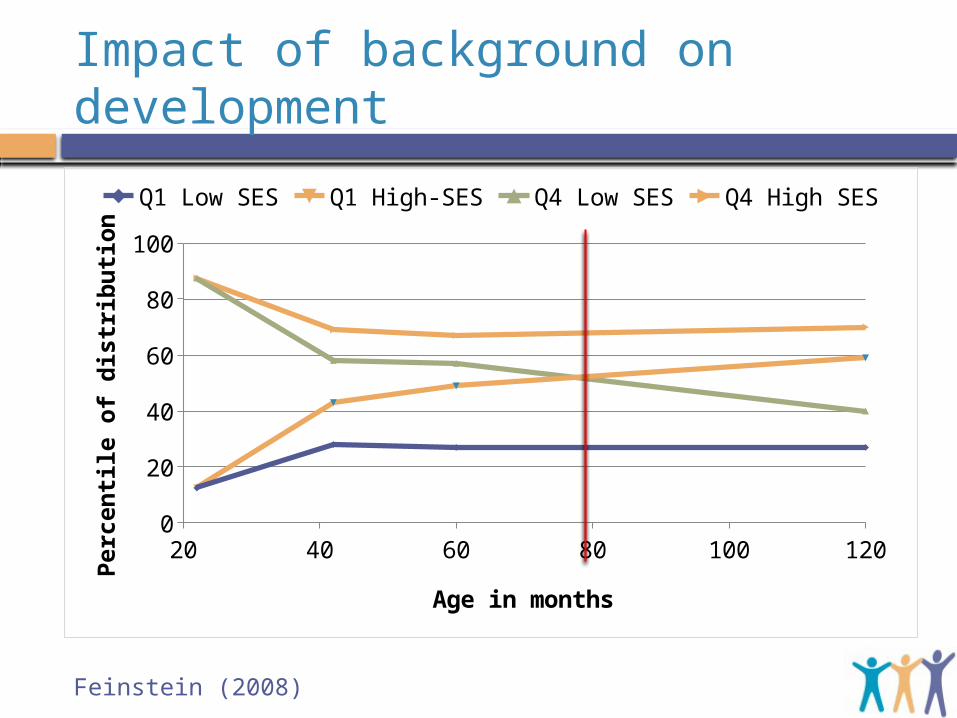
Impact of background on development
Feinstein (2008)
20 40 60 80 100 1200
102030405060708090
100
Q1 Low SES Q1 High-SES Q4 Low SES Q4 High SES
Age in months
Perc
entil
e of
dis
trib
ution

Meaningful differences
Hour-long samples of family talk in 42 American families Number of words spoken to children by adults by the age
of 36 months In professional families: 35 million In other working-class families: 20 million In families on welfare: 10 million
Kinds of reinforcements:positive negativeprofessional 500,000 50,000working-class200,000 100,000welfare 100,000 200,000
Hart and Risley (1995)

Trajectories of learning to read
Pianta, Belsky, Vandergrift, Houts, & Morrison (2008)
‘Fast’ readers
‘Normal’ readers
PK 1st 3rd 5th
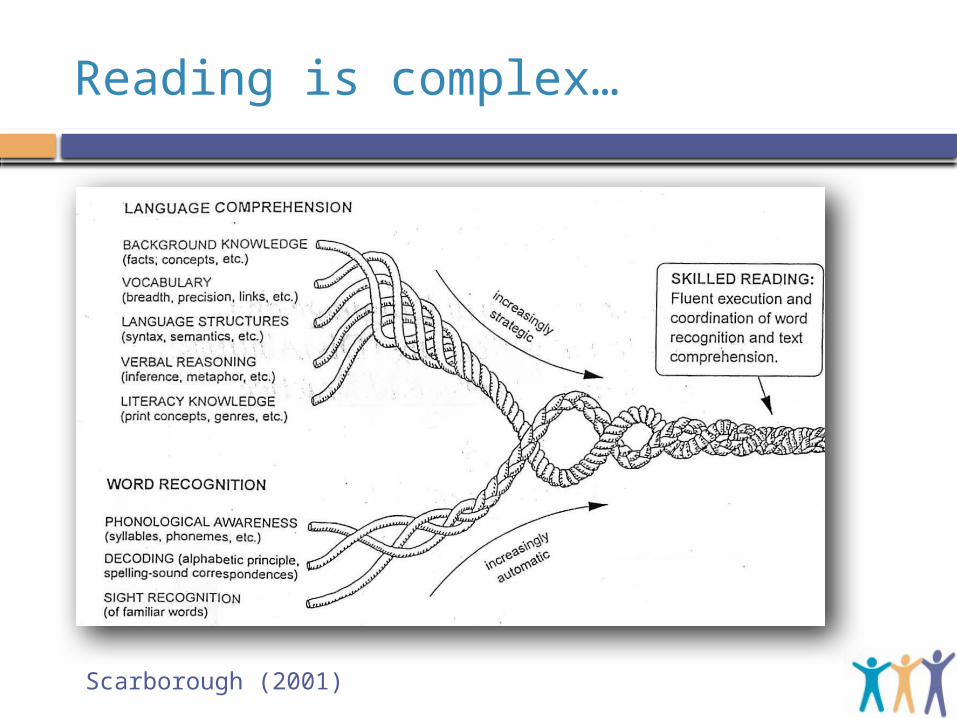
Reading is complex…
Scarborough (2001)
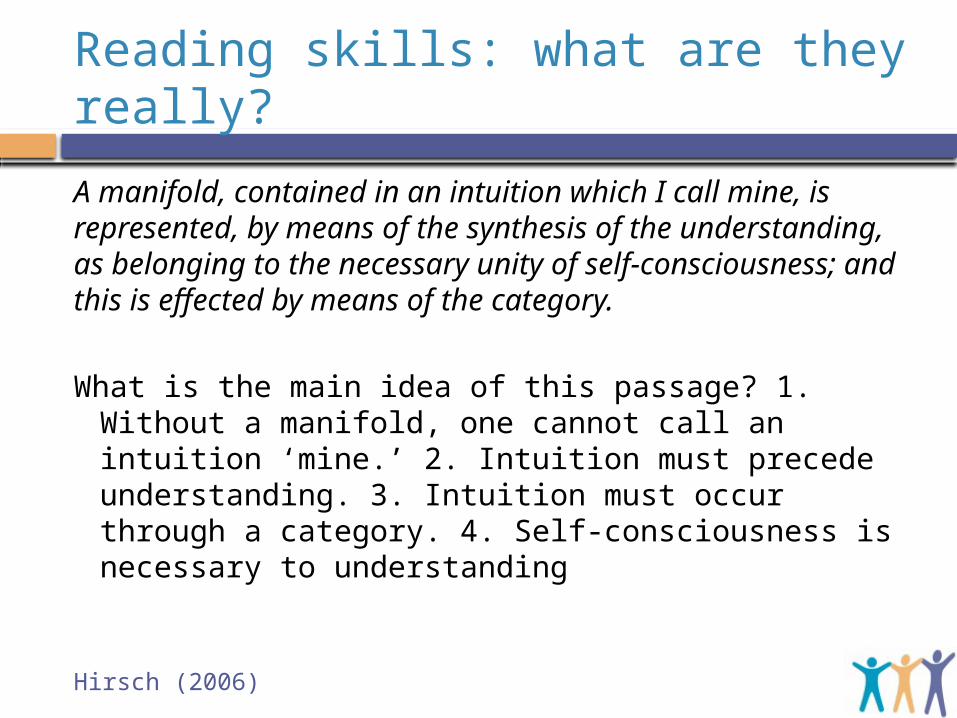
Reading skills: what are they really?
A manifold, contained in an intuition which I call mine, is represented, by means of the synthesis of the understanding, as belonging to the necessary unity of self-consciousness; and this is effected by means of the category.
What is the main idea of this passage? 1. Without a manifold, one cannot call an intuition ‘mine.’ 2. Intuition must precede understanding. 3. Intuition must occur through a category. 4. Self-consciousness is necessary to understanding
Hirsch (2006)
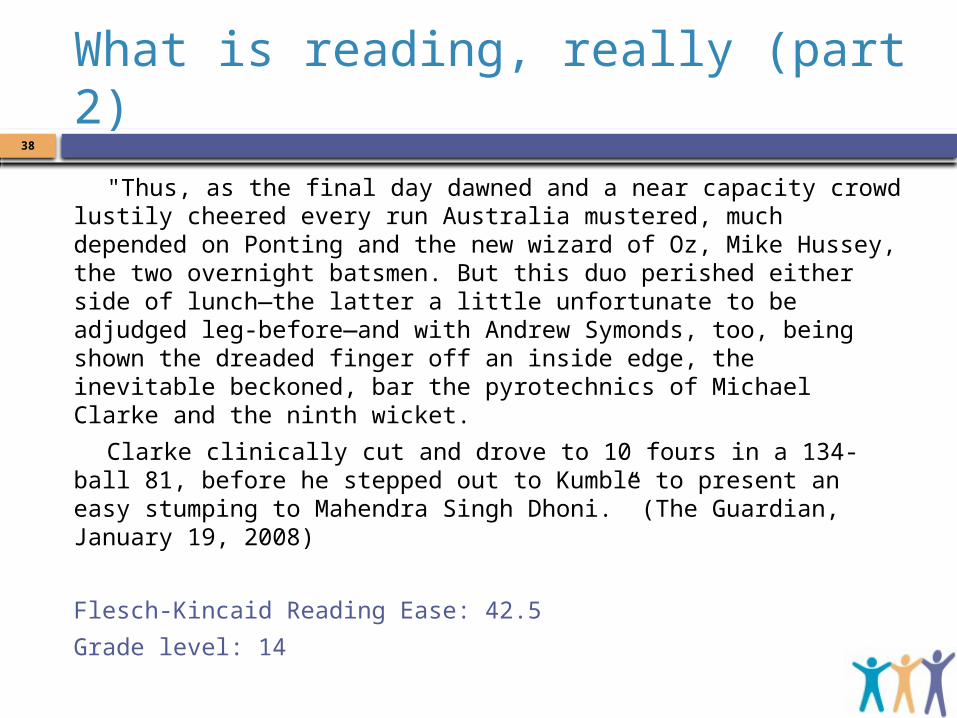
What is reading, really (part 2)38
"Thus, as the final day dawned and a near capacity crowd lustily cheered every run Australia mustered, much depended on Ponting and the new wizard of Oz, Mike Hussey, the two overnight batsmen. But this duo perished either side of lunch—the latter a little unfortunate to be adjudged leg-before—and with Andrew Symonds, too, being shown the dreaded finger off an inside edge, the inevitable beckoned, bar the pyrotechnics of Michael Clarke and the ninth wicket.
Clarke clinically cut and drove to 10 fours in a 134-ball 81, before he stepped out to Kumble to present an easy stumping to Mahendra Singh Dhoni.” (The Guardian, January 19, 2008)
Flesch-Kincaid Reading Ease: 42.5
Grade level: 14
Quality in assessment

What is an assessment?40
An assessment is a process for making inferences Key question: “Once you know the assessment
outcome, what do you know?” “One validates, not a test, but an interpretation of
data arising from a specified procedure” (Cronbach, 1971; emphasis in original)
Consequences No such thing as a valid (or indeed invalid) assessment No such thing as a biased assessment

Threats to validity41
Construct-irrelevant variance Systematic: good performance on the assessment
requires abilities not related to the construct of interest
Random: good performance is related to chance factors, such as luck (effectively poor reliability)
Construct under-representation Good performance on the assessment can be
achieved without demonstrating all aspects of the construct of interest
Understanding reliability

Understanding test scores
Consider a test with the following properties average score: 50 standard deviation of scores: 15
This means that on average: 68% of students score between 35 and 65 (±1 sd) 96% of students score between 20 and 80 (±2 sd)
But the score on any one occasion may not be a good guide to the score on another occasion
No measurement (either educational or other) is perfectly reliable
43
Reliability of test scores44
Basic assumption of classical test theory:X = T + E
In other words, the score a student gets on any occasion is their “true score” plus or minus some error
This does not mean assuming that ability is fixed The “true score” is just the long-run average score
over numerous testing occasions with similar tests, so The average error is zero For a reliable test, the errors are bunched closely For an unreliable test, the errors are spread out The more spread out the errors, the less reliable the test

Defining reliability45
To find out how spread out the errors are, we can’t use the average (because it’s zero!), so
We square the errors (to get rid of the minus signs) and then average (this is called the variance)
The reliability of a test is then defined as:
When the variance of the errors: is zero, the test is perfectly reliable (reliability = 1) equals that of the observed scores, the test score is
just noise (reliability = 0)
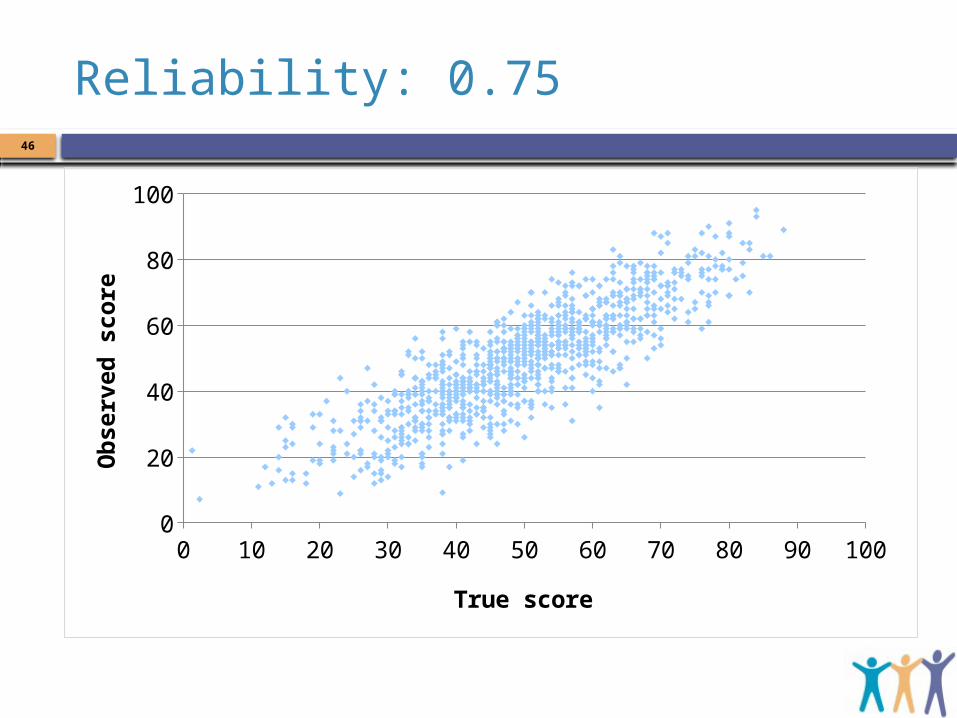
Reliability: 0.7546
0 10 20 30 40 50 60 70 80 90 1000
102030405060708090
100
True score
Obs
erve
d sc
ore

Reliability: 0.8047
0 10 20 30 40 50 60 70 80 90 1000
102030405060708090
100
True score
Obs
erve
d sc
ore

Reliability: 0.8548
0 10 20 30 40 50 60 70 80 90 1000
102030405060708090
100
True score
Obs
erve
d sc
ore

Reliability: 0.9049
0 10 20 30 40 50 60 70 80 90 1000
102030405060708090
100
True score
Obs
erve
d sc
ore
50
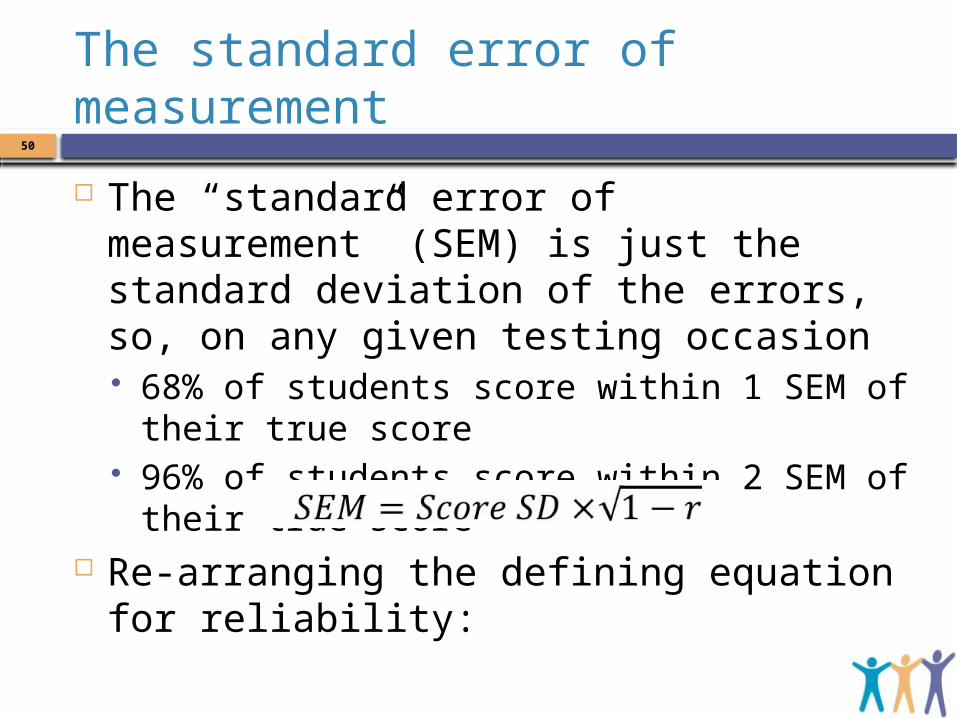
The standard error of measurement
The “standard error of measurement” (SEM) is just the standard deviation of the errors, so, on any given testing occasion 68% of students score within 1 SEM of their true score 96% of students score within 2 SEM of their true score
Re-arranging the defining equation for reliability:
51
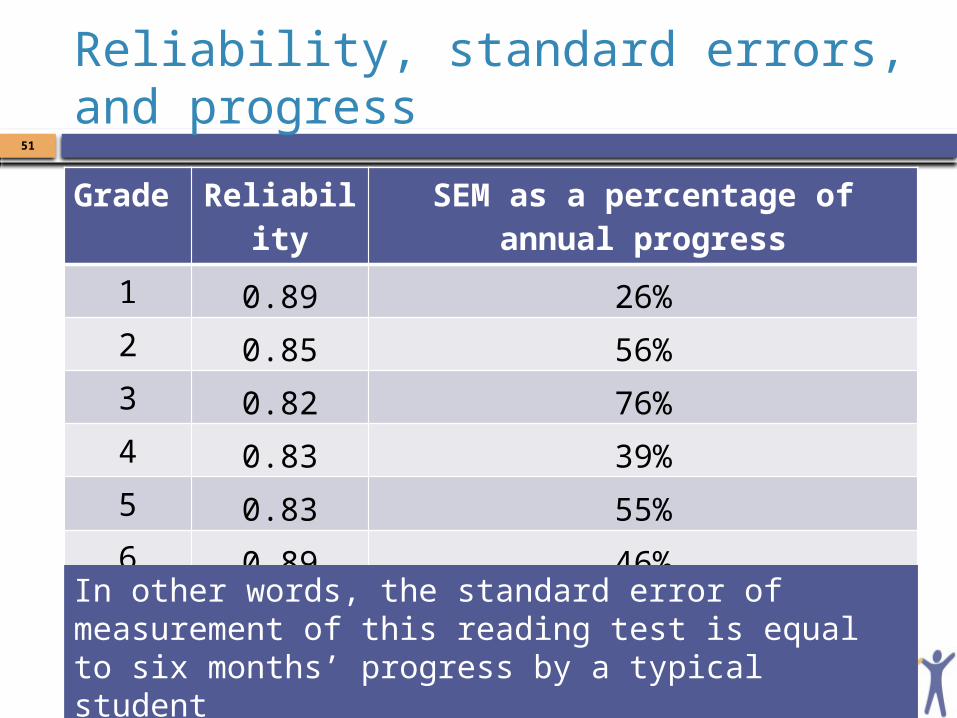
Reliability, standard errors, and progress
Grade Reliability SEM as a percentage of annual progress1 0.89 26%2 0.85 56%3 0.82 76%4 0.83 39%5 0.83 55%6 0.89 46%
Average 0.85 49%
In other words, the standard error of measurement of this reading test is equal to six months’ progress by a typical student

Implications: Testing ever semester52
If we test students every six months: 16% of students who have made normal progress will
appear to have made no progress at all, or appear to have gone backwards.
16% of the students who have made no progress will appear to be progressing faster than normal.
Implications: Bimonthly testing53
If we test students every two months: 37% of students who have made normal progress will
appear to have made no progress at all, or appear to have gone backwards.
37% of the students who have made no progress will appear to be progressing faster than average.
If you must measure progress…54
As rules of thumb: For individual students, progress measures are
meaningful only if the progress is more than twice the standard error of measurement of the test being used to measure progress.
For a class of 25 students, progress measures are meaningful if the progress is more than half the standard error of measurement of the test being used to measure progress.
Curriculum-based measurement
Curriculum-based measurement 56
Used for a variety of purposes including screening, benchmarking, and progress monitoring
Avoids the problems of measuring change scores because it focuses on multiple assessments of status.
Depends on a clear view of what will be learned by the end of the instructional sequence.
However, it is not a panacea
Review of studies of CBM-R57
“Such studies suggest that even under the best conditions (i.e., high-quality probe sets and tightly controlled conditions), (a) a minimum of 5 or 6 weeks of data with multiple data points collected per week are needed to inform routine instructional decisions and (b) a minimum of 12 weeks of data with multiple data points collected per week are needed to make special education eligibility decisions ” (p. 12)
Ardoin, Christ, Morena, Cormier, and Klingbeil (2013)
58
“… at this point, there are no studies to suggest that an individual student's progress can be accurately determined using CBM-R progress monitoring data” (p. 14)“Furthermore, trainers and publishers of CBM-R materials should neither suggest to school teachers and other educators that CBM-R progress monitoring data can be used as a primary outcome measure to evaluate individual student growth over short periods of time nor train them in current CBM-R decision rules.” (pp. 14-15)
Ardoin, Christ, Morena, Cormier, and Klingbeil (2013)
Diagnostic testing
The limits of diagnostic testing60
120-item multiple choice test for teacher licensure Four major subject areas
language arts/reading mathematics social studies science
30 items per subject area Sub-score reliabilities range from 0.71 to 0.83

How reliable are 10-item subtest scores?61
Items for each subject area ranked in order of difficulty (i.e., 1 to 30)
Three parallel 10-item forms created in each subject area: Form A: items 1, 4, 7, … 28 Form B: items 2, 5, 8, … 29 Form C: items 3, 6, 9, … 30
Sub-score reliabilities in the range 0.40 to 0.60 On form A, 271 examinees scored 7 in mathematics
and 3 in science
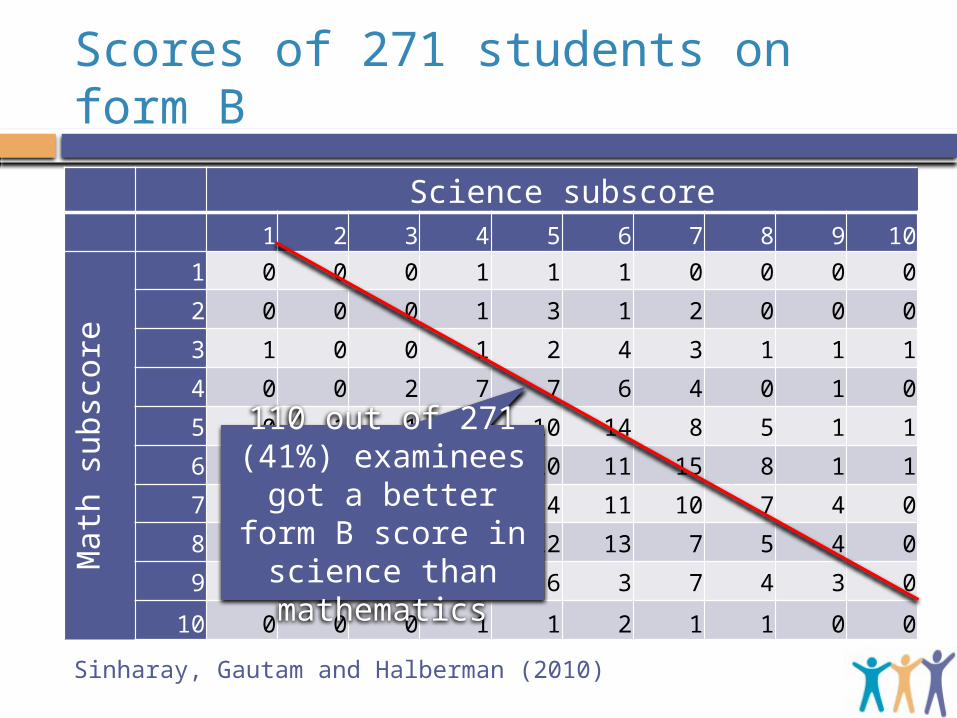
Scores of 271 students on form B
Science subscore1 2 3 4 5 6 7 8 9 10
Math
subscore
1 0 0 0 1 1 1 0 0 0 0
2 0 0 0 1 3 1 2 0 0 0
3 1 0 0 1 2 4 3 1 1 1
4 0 0 2 7 7 6 4 0 1 0
5 0 1 1 1 10 14 8 5 1 1
6 2 0 1 5 10 11 15 8 1 1
7 0 1 4 4 4 11 10 7 4 0
8 0 1 1 5 12 13 7 5 4 0
9 0 0 1 1 6 3 7 4 3 0
10 0 0 0 1 1 2 1 1 0 0
Sinharay, Gautam and Halberman (2010)
110 out of 271 (41%) examinees got a better form B score in science
than mathematics

63
A student scoring 7 on mathematics and 3 on science would probably want to improve the latter
But 110 of the 271 examinees got a better score in science than mathematics on Form B
Correlation of science subscores on Forms A and B is 0.48
Correlation of science subscore on Form A with total score on Form B is 0.63
In other words, the total score on a test is a better guide to the score on a sub-test than another score on the same sub-test
So what’s to be done?
65
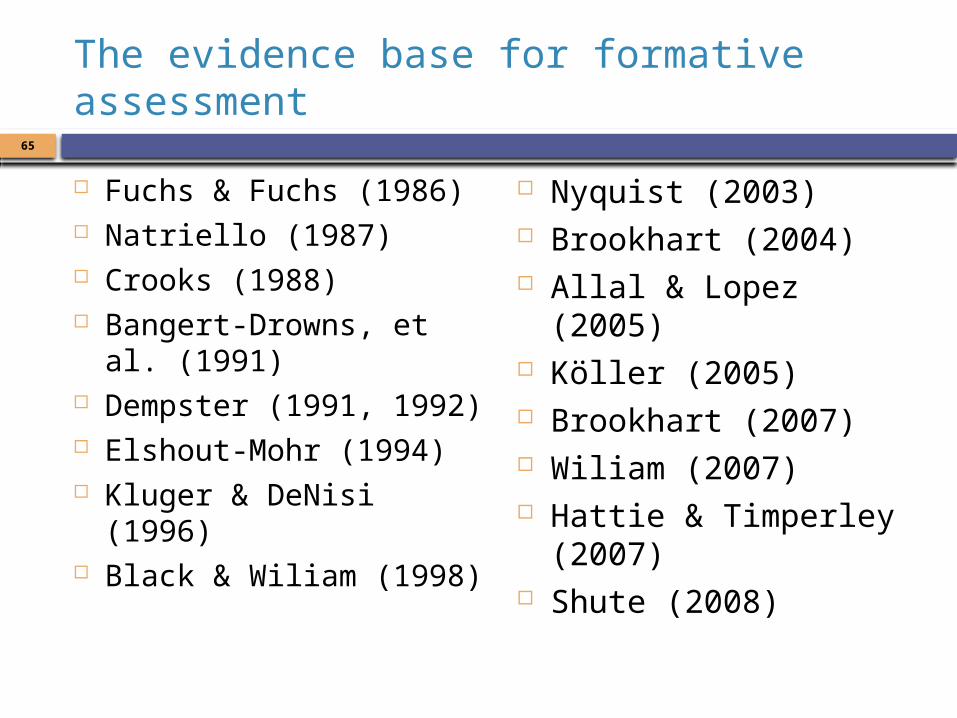
The evidence base for formative assessment
Fuchs & Fuchs (1986) Natriello (1987) Crooks (1988) Bangert-Drowns, et al. (1991) Dempster (1991, 1992) Elshout-Mohr (1994) Kluger & DeNisi (1996) Black & Wiliam (1998)
Nyquist (2003) Brookhart (2004) Allal & Lopez (2005) Köller (2005) Brookhart (2007) Wiliam (2007) Hattie & Timperley (2007) Shute (2008)
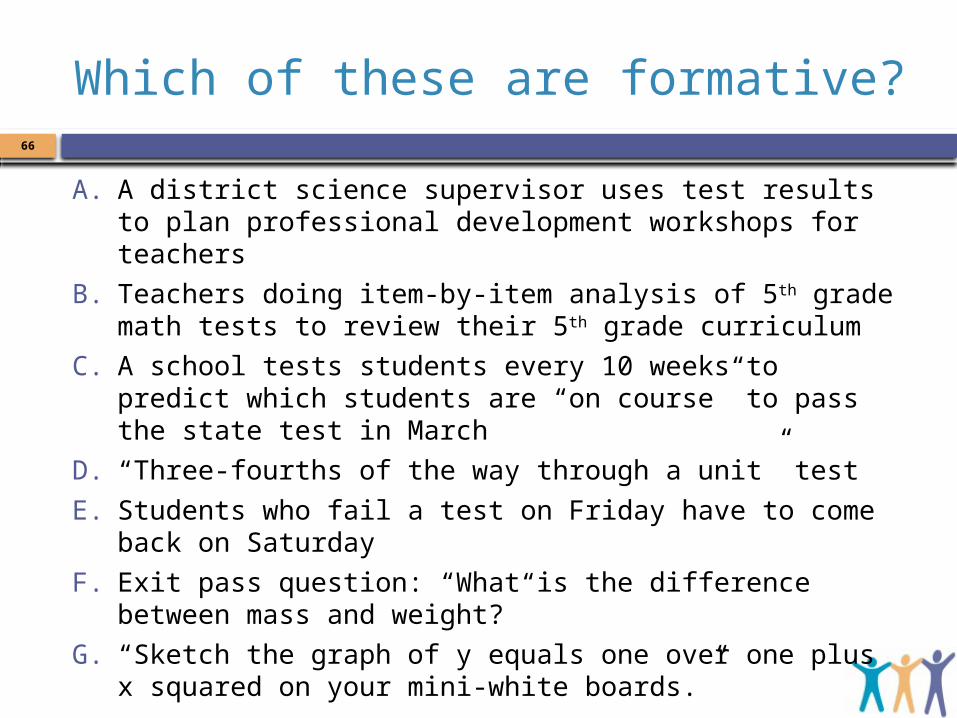
Which of these are formative?
A. A district science supervisor uses test results to plan professional development workshops for teachers
B. Teachers doing item-by-item analysis of 5th grade math tests to review their 5th grade curriculum
C. A school tests students every 10 weeks to predict which students are “on course” to pass the state test in March
D. “Three-fourths of the way through a unit” testE. Students who fail a test on Friday have to come back on
SaturdayF. Exit pass question: “What is the difference between mass
and weight?”G. “Sketch the graph of y equals one over one plus
x squared on your mini-white boards.”
66

The formative assessment hijack
Long-cycle: Span: across units, terms Length: four weeks to one year Impact: Student monitoring; curriculum alignment
Medium-cycle: Span: within and between teaching units Length: one to four weeks Impact: Improved, student-involved assessment; teacher cognition about
learning Short-cycle:
Span: within and between lessons Length:
day-by-day: 24 to 48 hours minute-by-minute: five seconds to two hours
Impact: classroom practice; student engagement
67

68
Main approaches to formative assessment
Professional Learning Communities “…an inclusive group of people, motivated by a shared learning vision, who support and work with each other, finding ways, inside and outside their immediate community, to enquire on their practice and together learn new and better approaches that will enhance all pupils’ learning.” (Stoll et al., 2006)
Two main approaches Focus on outcomes for students Focus on increased teacher capacity
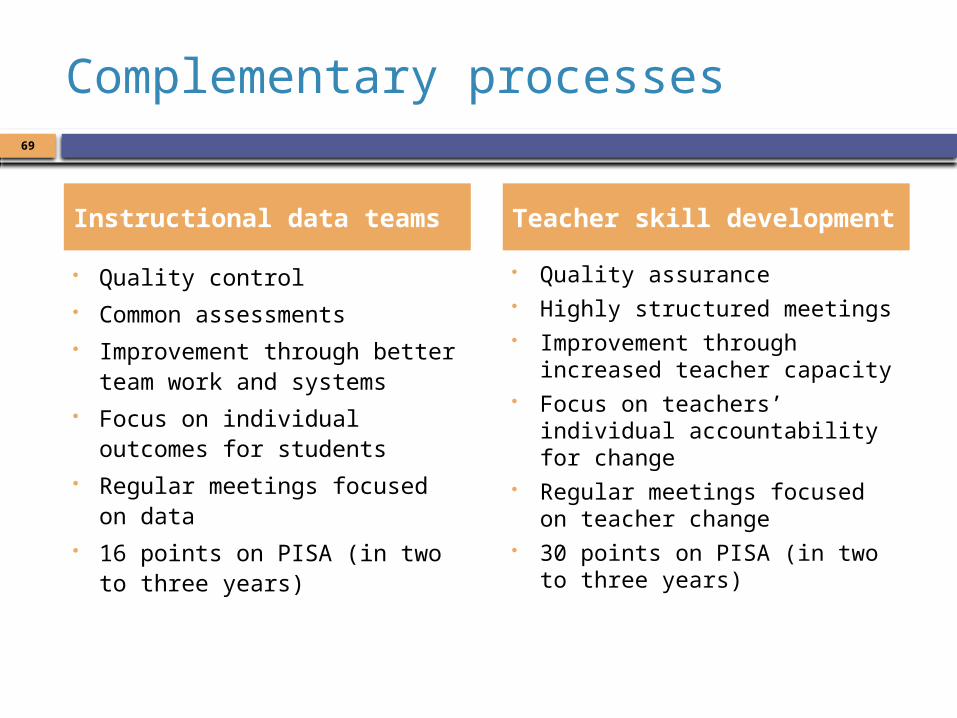
Complementary processes
Quality control Common assessments Improvement through better
team work and systems Focus on individual outcomes for
students Regular meetings focused on
data 16 points on PISA (in two to three
years)
Quality assurance Highly structured meetings Improvement through
increased teacher capacity Focus on teachers’ individual
accountability for change Regular meetings focused on
teacher change 30 points on PISA (in two to
three years)
69
Instructional data teams Teacher skill development
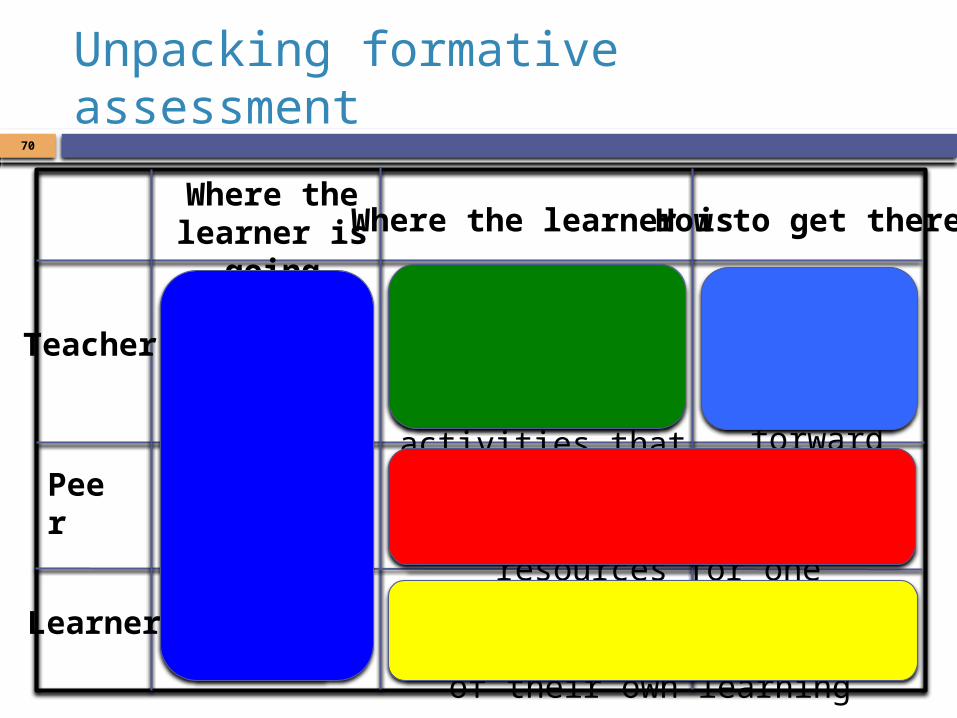
Unpacking formative assessment
Where the learner is going Where the learner is How to get there
Teacher
Peer
Learner
Clarifying, sharing and
understanding learning
intentions
Engineering effective discussions, tasks, and
activities that elicit evidence of learning
Providing feedback that
moves learners forward
Activating students as learningresources for one another
Activating students as ownersof their own learning
70

Formative assessment and other priorities
Formative assessment is an integral part of many current policy priorities: Framework for teaching (Danielson) Differentiated instruction (Tomlinson) Response to (instruction and) intervention
71

Framework for teaching (Danielson 1996)
Four domains of professional practice1. Planning and preparation2. Classroom environment3. Instruction4. Professional responsibilities
Links with student achievement (Sartain, et al. 2011) Domains 1 and 4: no impact on student achievement Domains 2 and 3: some impact on student achievement
72
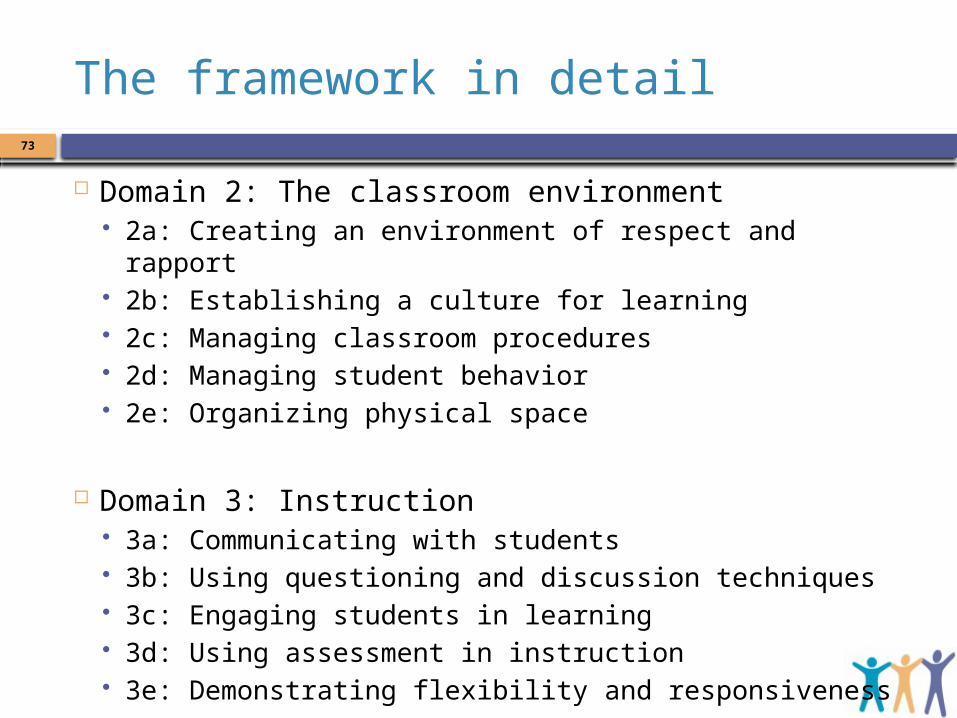
The framework in detail
Domain 2: The classroom environment 2a: Creating an environment of respect and rapport 2b: Establishing a culture for learning 2c: Managing classroom procedures 2d: Managing student behavior 2e: Organizing physical space
Domain 3: Instruction 3a: Communicating with students 3b: Using questioning and discussion techniques 3c: Engaging students in learning 3d: Using assessment in instruction 3e: Demonstrating flexibility and responsiveness
73
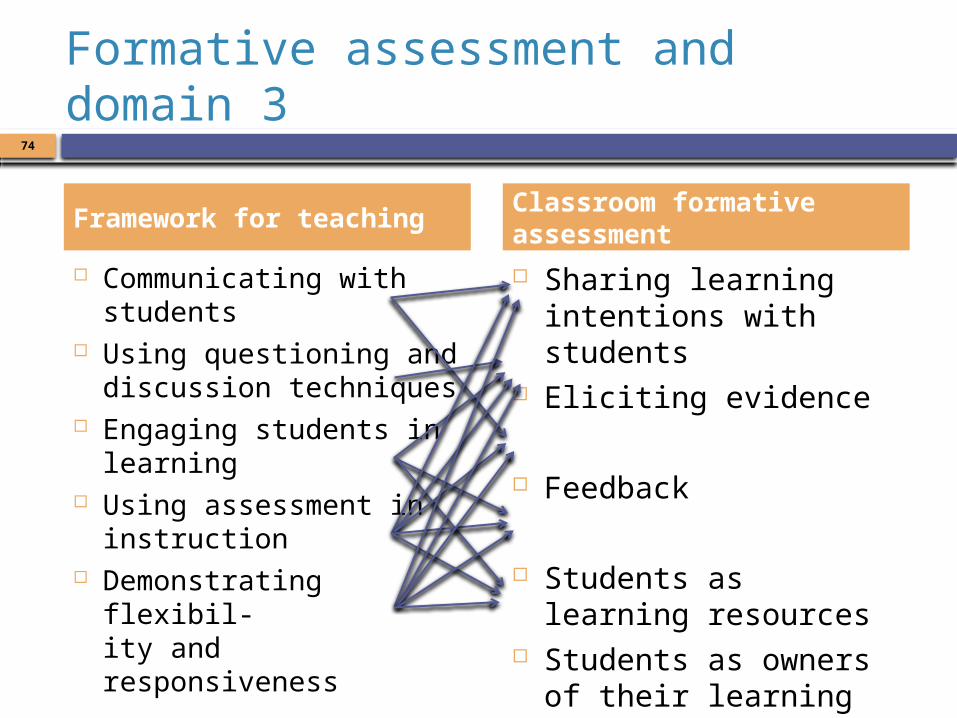
Formative assessment and domain 3
Communicating with students
Using questioning and discussion techniques
Engaging students in learning
Using assessment in instruction
Demonstrating flexibil-ity and responsiveness
Sharing learning intentions with students
Eliciting evidence
Feedback
Students as learning resources
Students as owners of their learning
Framework for teaching Classroom formative assessment
74
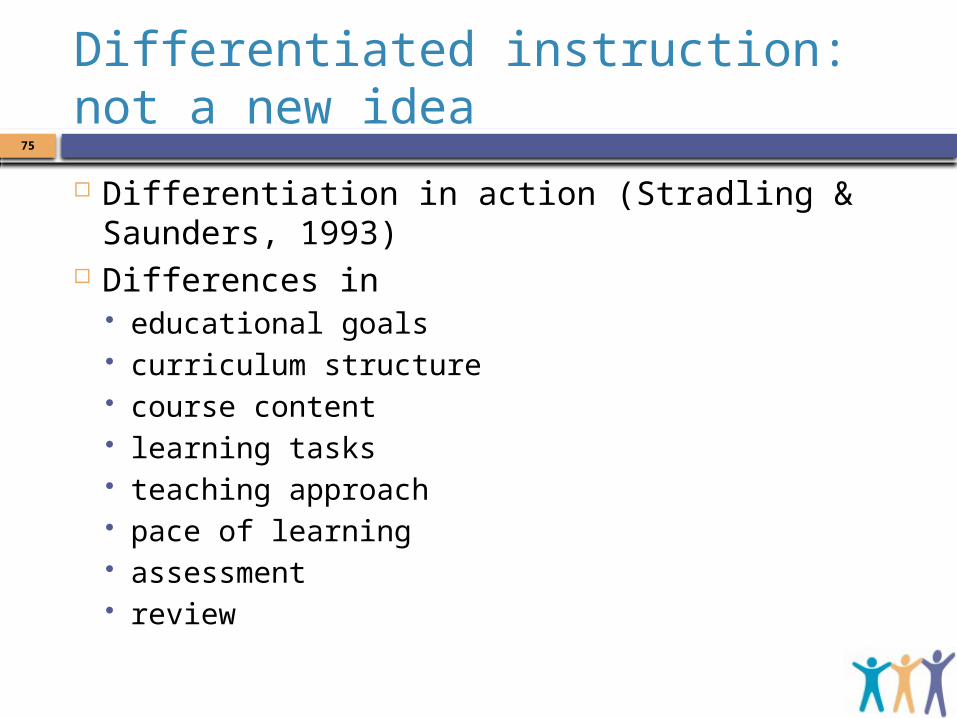
Differentiated instruction: not a new idea
Differentiation in action (Stradling & Saunders, 1993) Differences in
educational goals curriculum structure course content learning tasks teaching approach pace of learning assessment review
75
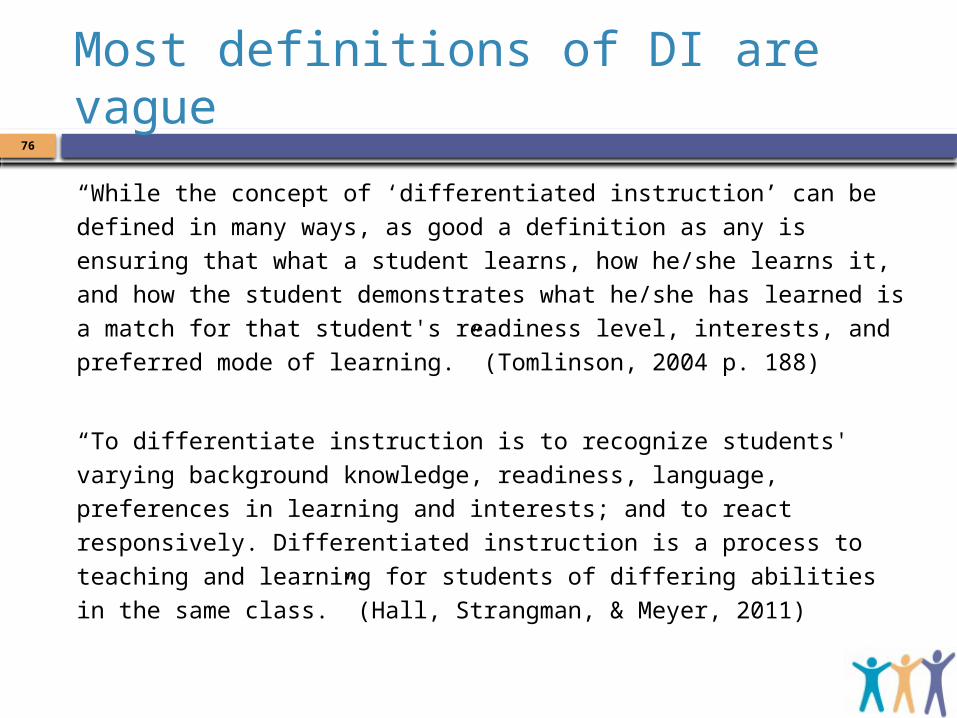
Most definitions of DI are vague
“While the concept of ‘differentiated instruction’ can be defined in many ways, as good a definition as any is ensuring that what a student learns, how he/she learns it, and how the student demonstrates what he/she has learned is a match for that student's readiness level, interests, and preferred mode of learning.” (Tomlinson, 2004 p. 188)
“To differentiate instruction is to recognize students' varying background knowledge, readiness, language, preferences in learning and interests; and to react responsively. Differentiated instruction is a process to teaching and learning for students of differing abilities in the same class.” (Hall, Strangman, & Meyer, 2011)
76
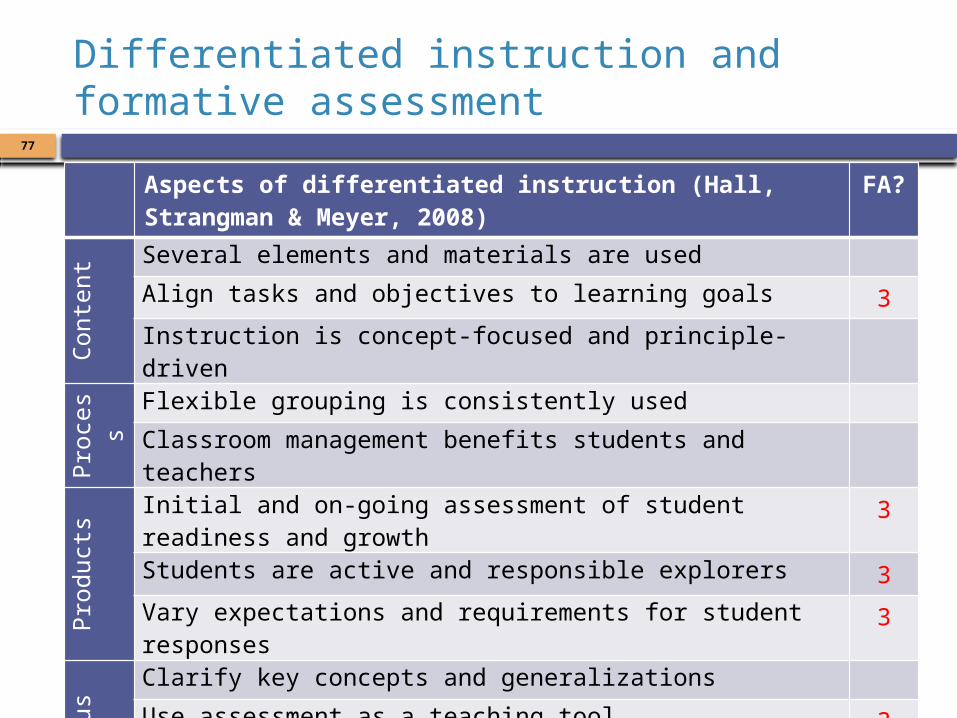
Differentiated instruction and formative assessment
77
Aspects of differentiated instruction (Hall, Strangman & Meyer, 2008) FA?
Content
Several elements and materials are used
Align tasks and objectives to learning goals 3Instruction is concept-focused and principle-driven
Process
Flexible grouping is consistently used
Classroom management benefits students and teachers
Products
Initial and on-going assessment of student readiness and growth 3Students are active and responsible explorers 3Vary expectations and requirements for student responses 3
Misccelaneous
Clarify key concepts and generalizations
Use assessment as a teaching tool 3Emphasize critical and creative thinking as a goal in lesson design
Engaging all learners is essential 3Balance between teacher-assigned and student-selected tasks
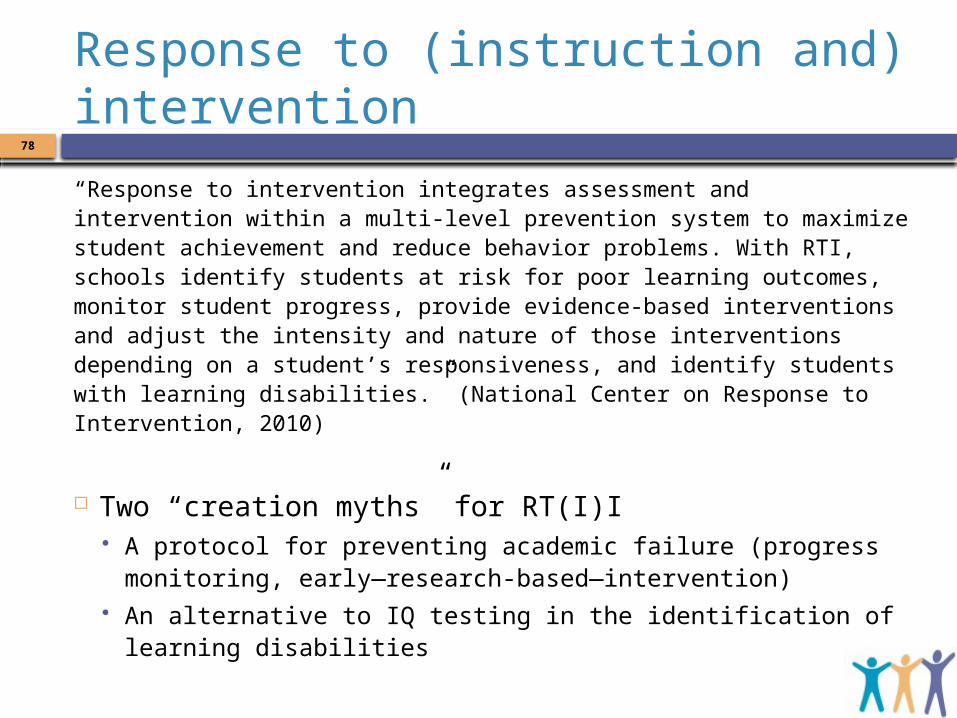
Response to (instruction and) intervention
“Response to intervention integrates assessment and intervention within a multi-level prevention system to maximize student achievement and reduce behavior problems. With RTI, schools identify students at risk for poor learning outcomes, monitor student progress, provide evidence-based interventions and adjust the intensity and nature of those interventions depending on a student’s responsiveness, and identify students with learning disabilities.” (National Center on Response to Intervention, 2010)
Two “creation myths” for RT(I)I A protocol for preventing academic failure (progress monitoring,
early—research-based—intervention) An alternative to IQ testing in the identification of
learning disabilities
78
Response to (instruction and) intervention
Key points Tier 1 must be high-quality, evidence-based
instruction Student progress must be monitored Failure to progress triggers additional support
Formative assessment Makes tier 1 instruction as effective as it can be Allows assessment of progress (for tier 2 assessment)
79
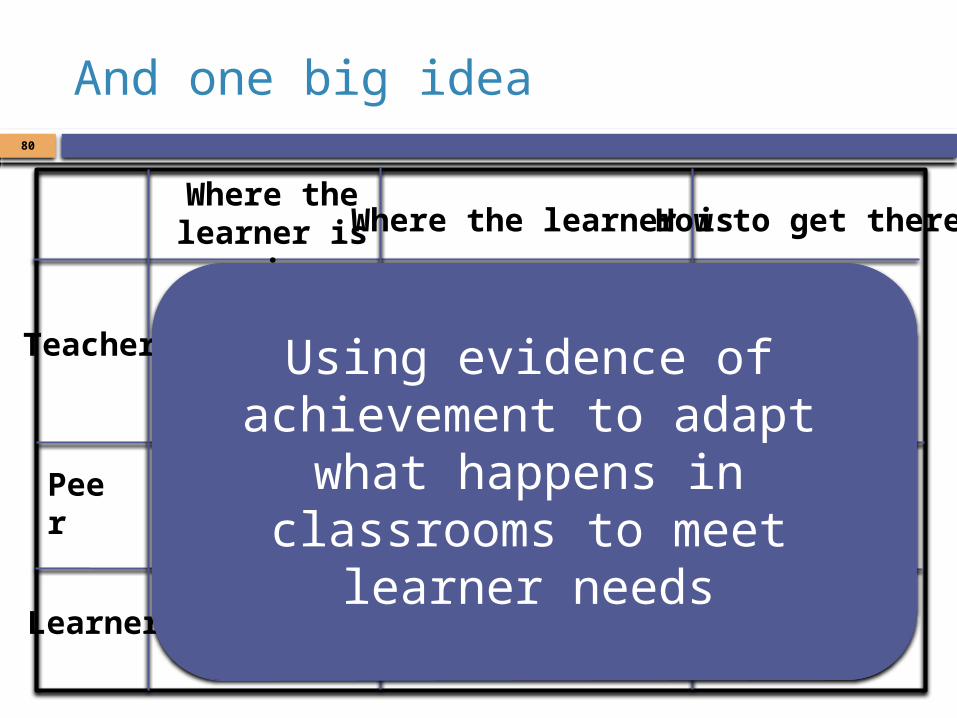
And one big idea
Where the learner is going Where the learner is How to get there
Teacher
Peer
Learner
80
Using evidence of achievement to adapt
what happens in classrooms to meet
learner needs
An educational positioning system
A good teacher: Establishes where the students are in their learning Identifies the learning destination Carefully plans a route Begins the learning journey Makes regular checks on progress on the way Makes adjustments to the course as conditions dictate
81