What are the organisational factors that influence waiting ... · What are the organisational...
190
What are the organisational factors that influence waiting times in Emergency Departments? Report for the National Co-ordinating Centre for NHS Service Delivery and Organisation R & D (NCCSDO) October 2006 prepared by Suzanne Mason* Thomas Locker* Angela Carter† Stephen Walters* Chris Stride† Joanne Casson* *Health Services Research Section, School of Health and Related Research, University of Sheffield, Sheffield †Institute of Work Psychology Address for correspondence Miss Suzanne Mason, Health Services Research Section, School of Health and Related Research, Regent Court, 30 Regent Street, Sheffield S1 4DA Tel: 0114 2220694; e-mail: [email protected]
Transcript of What are the organisational factors that influence waiting ... · What are the organisational...
What are the organisational factors that influence waiting times in Emergency Departments?
Report for the National Co-ordinating Centre for NHS Service Delivery and Organisation R & D (NCCSDO)
October 2006
prepared by
Suzanne Mason*
Thomas Locker*
Angela Carter†
Stephen Walters*
Chris Stride†
Joanne Casson*
*Health Services Research Section, School of Health and Related
Research, University of Sheffield, Sheffield
†Institute of Work Psychology Address for correspondence
Miss Suzanne Mason, Health Services Research Section, School of
Health and Related Research, Regent Court, 30 Regent Street,
Sheffield S1 4DA
Tel: 0114 2220694; e-mail: [email protected]

Factors influencing Emergency Department waiting times
©NCCSDO 2007 2
Contents
Acknowledgements 6
Glossary 7
Executive Summary 9
The Report 13
Section 1 Introduction and background to the study 13
Section 2 Policy context and literature review 15 2.1 Policy context 15
2.2 Literature review 16
2.2.1 Patient satisfaction 17
2.2.2 Socio-demographic factors 17
2.2.3 Case-mix 18
2.2.4 Hospital characteristics 19
2.2.5 Emergency Department facilities 20
2.2.6 Working practices 20
2.2.7 Staffing 22
2.2.8 Bonus payments 22
2.2.9 Emergency Department management 23
2.2.10 Change management 23
2.2.11 Work factors. 24
Section 3 National survey of Emergency Departments 26
3.1 Aims 26
3.2 Phase One methods 26
3.2.1 Ethics and Research Governance approval 26
3.2.2 Healthcare Commission data 26
3.2.3 Interviews with key Emergency Department staff 27
3.2.4 Abstraction of data from Emergency Department IT systems 28
3.2.5 Phase One recruitment 28
3.3 Phase One data analysis 29
3.3.1 Sample of new attenders in April 2004 29
3.3.2 Data from structured interviews 29
3.3.3 Data from the Healthcare Commission instrument 29
3.3.4 Development of the regression model 29
3.4 Results 30
3.4.1 National survey data: section 1 30
3.4.2 Routine data and Healthcare Commission data 32
3.4.3 National survey data: section 2 40
Factors influencing Emergency Department waiting times
©NCCSDO 2007 3
3.4.4 Summary 42
3.5 Developing a model of organisational factors predicting mean waiting time 42
3.6 Summary 45
Section 4 Phase Two: in-depth evaluation of Emergency Departments 47
4.1 Methods 47
4.1.1 Selection of sites 47
4.1.2 Recruitment 47
4.1.3 Structured staff interviews 48
4.1.4 Organisational factors interviews 48
4.2 Data analysis 51
4.2.1 Analyses of team-working interviews 52
4.2.2 Analyses of questionnaire data 52
4.2.3 Ethnographic residual analysis 52
4.3 Results of Phase Two: the in-depth study 53
4.3.1 Sites that perceived boundary issues to be important 53
4.3.2 Sites that did not perceive boundary-spanning issues to beimportant 55
4.3.3 Team-working interviews 56
4.3.4 Findings from the questionnaire study 57
4.4 Conclusion 60
4.5 ERA 60
4.6 Summary 61
Section 5 What mechanisms are available to improve waiting times? 62
5.1 Actions or activities to help reduce waiting times 62
5.1.1 Different ways of working 62
5.1.2 Reduction of inappropriate use of the Emergency Department 63
5.1.3 Training, development and maintaining staff skills 63
5.1.4 How the Emergency Department fits with other specialities 64
5.1.5 Proactive co-ordination with primary care services 64
5.1.6 Proactive co-ordination with secondary care services 64
5.1.7 Quicker access to information 65
5.1.8 Access to beds and an efficient referral process 65
5.1.9 Increase in staff and matching staffing to patient flow 66
5.1.10 Improved efficiency of working practices and processes within the Trust 66
5.1.11 Effective management 66
5.1.12 More physical resources 66
5.1.13 Discussion at an NHS level regarding funding between primary and secondary care providers 67
5.1.14 More staff-support services. 67
5.1.15 Summary 67
5.2 Initiatives or activities that are in place to reduce waiting times 67
5.2.1 Different ways of working 67
5.2.2 Reduction of inappropriate referral 68
Factors influencing Emergency Department waiting times
©NCCSDO 2007 4
5.2.3 Training, development and maintaining staff skills 68
5.2.4 How the Emergency Department fits with other specialities 69
5.2.5 Proactive co-ordination of the Emergency Department and primary care services. 69
5.2.6 Proactive co-ordination of the Emergency Department and secondary care services 69
5.2.7 Quicker access to information 70
5.2.8 Access to beds and an efficient referral process. 70
5.2.9 Increase in staff and matching staffing to patient flow 70
5.2.10 Improved efficiency of working practices and processes within the Trust 71
5.2.11 Effective management 71
5.2.12 More physical resources 71
5.2.13 Discussion at an NHS level regarding funding between primary and secondary care providers 71
5.2.14 More support services 71
5.3 Summary 71
Section 6 Discussion 73 6.1 Summary and introduction 73
6.2 Justification for mean waiting time as the dependent variable 74
6.3 Emergency Department data quality 75
6.3.1 Reasons unrelated to patient care and flows 75
6.3.2 Consistency of measuring waiting times 75
6.4 Factors influencing waiting times 76
6.4.1 Case-mix and size 76
6.4.2 Emergency Department Staff 77
6.4.3 Emergency Department facilities 78
6.4.4 Team working and working practices 79
6.4.5 Psychological strain and autonomy and control 80
6.4.6 Mechanisms available to improve waiting times 81
6.4.7 How to develop participative leadership 83
6.5 Recommendations for ways to reduce avoidable variation: future research 84
6.6 Limitations 85
6.7 Concluding remarks 86
References 87
Appendices
Appendix A Audit Commission data re-analysis 93
Appendix B Analysis of changes in performance and profile in a large urban Emergency Department, 1993–2003 99
Appendix C Strategic Health Authorities and participating departments 109

Factors influencing Emergency Department waiting times
©NCCSDO 2007 5
Appendix D Healthcare Commission Emergency Department services data-collection tool 111
Appendix E Surveys 114
Appendix F Figures and tables 129
Appendix G Research Governance delays 138
Appendix H A survey on working in the Accident and Emergency Department 141
Appendix I Eight Emergency Departments contributing to Phase Two data collection 155
Appendix J Phase Two interview, focus-group and team-working interview schedules 178
Appendix K Ethnographic residual analysis: the use of an innovative design from educational research for use in health services research 185
Appendix references 188

Factors influencing Emergency Department waiting times
©NCCSDO 2007 6
Acknowledgements
We would like to acknowledge and thank the individuals and organisations
listed below for their valuable contributions to data collection and analysis
in this study.
• Bill Alexander and the Healthcare Commission team.
• Steering-group members: Professor Jon Nicholl (Director MCRU Policy
Research Programme, ScHARR, University of Sheffield), Dr Steve
Goodacre (Senior Clinical Lecturer in Health Service Research &
Medicine, ScHARR, University of Sheffield), Jim Wardrope (Consultant
in Emergency Medicine, Sheffield Teaching Hospitals Trust), Alicia
O’Cathain (MRC Fellow, Health Services Research Section, ScHARR,
University of Sheffield), Professor Toby Wall (Director Institute of
Work Psychology, University of Sheffield), Professor Sue Read
(Professor in Nursing Research, University of Sheffield) and Enid Hirst
(patient representative).
• Phase One data collection: Paul Baines, Julian Kennedy, Rachel
Jenner, Lucy Bishop, Jacqui Munns, Ali Sanders, Rachael Boddy, Lisa
Munro-Davies, Matt Shepherd, Tom Burton, Thein Ohn, Kay Stenton,
Brigitte Colwell, Colin O’Keeffe, Jonathan Costello, Katherine Potier,
Darren Dewhurst, Rangarju Ragunathan, Victoria Henson and
Shammi Ramlakhan.
• Phase Two data collection and analysis: Ruth Ashby, Micky Kerr,
Sarah Blore, Derek Ross, Anna Brockhurst, Rachel Straw, Rachel Finn
and Dave Woods.
In addition to the individuals listed above we would like to thank all the
Emergency Departments and staff who agreed to participate in this study
and who gave up their valuable time to provide the information we
required.
Factors influencing Emergency Department waiting times
©NCCSDO 2007 7
Glossary
ancillary staff Non-health care staff working within the NHS; for example,
portering staff.
Audit Commission/Healthcare Commission An independent body, set up
to promote and drive improvement in the quality of health care and
public health. The Healthcare Commission undertake reviews of
Emergency Departments in England and Wales as part of the Acute
Hospitals Portfolio. The responsibility for this moved from the Audit
Commission to the Healthcare Commission in April 2004.
breach To exceed the national target for all patients attending the
Emergency Department to be seen and treated within 4 hours of
arrival.
DMC Decision-making clinician; a clinician who can assess and treat
patients autonomously. Usually a doctor or an Emergency Nurse
Practitioner.
ECG electrocardiograph
ENP Emergency Nurse Practitioner; a nurse in emergency medicine with
extended skills to assess and treat patients autonomously with
certain minor conditions according to protocols.
ERA ethnographic residual analysis
GP general practitioner
health care assistant An untrained member of staff providing nursing
care within the NHS.
IT information technology
NHS Direct the national NHS telephone helpline
P&T Professional and technical staff in the NHS; for example,
electrocardiograph technicians.
PAMs Professions allied to medicine within the NHS; for example,
physiotherapy, radiography and occupational therapy.
Rapid Assessment and Treatment A method using senior medical staff to
assess patients attending the Emergency Department with serious
conditions.
rapid-response team A multi-disciplinary team aimed at facilitating
patient discharge. May consist of social worker, physiotherapist,
occupational therapist, specialist nurse. Often targeted at older
people.
See and Treat A method used to rapidly assess and treat patients
attending the Emergency Department with minor conditions.
SHO Senior House Officer

Factors influencing Emergency Department waiting times
©NCCSDO 2007 8
staff grade non-career middle-grade doctor
triage Initial assessment and prioritisation of patients and their clinical
condition as they attend the Emergency Department. Usually
undertaken by a trained nurse.
TT Treatment time; the time from seeing a decision-making clinician until
the patient leaves the Emergency Department.
type 1 Emergency Department An Emergency Department providing a
consultant-led 24-hour service with full resuscitation facilities and
designated accommodation for the reception of emergency patients.
waiting time The time from booking in to being seen by a decision-
making clinician in an Emergency Department.
WTE whole-time equivalent
Factors influencing Emergency Department waiting times
©NCCSDO 2007 9
Executive Summary
Definition and measurement of waiting times varies considerably between
studies, making it difficult to identify developments or standards in this
area of research. The definition of waiting time used in this study is the
mean time from arrival to seeing a decision-making clinician. The
Glossary gives definitions of all terms in this report.
The aim of the study was to answer the question: what are the
organisational factors that influence waiting times in Emergency
Departments and what mechanisms are available to improve waiting
times?
A mixed-methods approach has been used to address this question. The
study has a number of different components: a review of policy and
published literature; a re-analysis of data from the Audit Commission
review of Emergency Departments in 2000; and an analysis of data
gathered from Emergency Departments in one large English city over an
11-year period. The main part of the study involved a national survey of
Emergency Departments. This was performed in two phases.
Phase One involved structured interviews with the lead clinician, head
nurse and business manager in each participating department; collection
of routine patient-level data in each participating department and an
analysis of Healthcare Commission data collected over the same time
period.
Phase Two involved an in-depth study of eight Emergency Departments to
identify additional organisational factors not accounted for in Phase One
of the study.
Re-analysis of the Audit Commission data (2000) identified two variables;
after correcting for department size and case-mix there are significant
independent predictors of the percentage of patients seen within 1 hour of
arrival. These are the percentage of senior nurses (Grade G+) and the
percentage of unqualified nurses (Grades A–C). Perhaps the most notable
finding is that the number of senior nurses has a negative impact upon
performance whereas the number of unqualified nurses has a positive
impact.
A detailed, 11-year study of attendance data of two adult Emergency
Departments in England revealed changes in attendances and case-mix
over the period. The average increase in attendances was 1.3% per
annum. The profile of patients attending had changed, with
proportionately more older people, more arrivals by ambulance, more
acute illness than trauma and more so-called major cases. Median

Factors influencing Emergency Department waiting times
©NCCSDO 2007 10
treatment time for patients categorised as ‘majors’ had increased
considerably whereas ‘minors’ had remained static. Further, the
proportion of patients subsequently admitted to hospital had also
increased. When compared to the Audit Commission data for a similar
period these data appear to mirror trends in departments elsewhere
indicating increasing waiting time for major cases.
Phase One of the study involved a national study that was undertaken to
identify further variables that may influence waiting time. Examination of
137 major Emergency Departments in England and Wales was
undertaken. The first phase of the study involved structured interviews
with the lead clinician, head nurse and business manager along with the
collection of routine patient-level data together with data collected by the
Healthcare Commission.
A stepwise regression technique was used to explore these variables.
Mean waiting time (Healthcare Commission source) was used as the
dependent variable. The first step was to regress case-mix and
department size. These two factors accounted for 14.1% of the variability
in mean waiting time. Each variable from the national data collected was
then regressed separately following the previous step. The potentially
predictive variables were then subsequently entered into a multivariable
linear-regression model. The final model (hours lost to nursing sickness,
amount of non-pay spend, management style of the lead clinician)
accounted for a further 35.5% of the variability in mean waiting times.
The finding that management style of the lead clinician was important
prompted a re-examination of the Phase One interview data, revealing
that a participative management style was associated with inclusivity of
staff at general team meetings, reduced role conflict of staff associated
with the department, increased information on work performance and
increased leader support and reduced autonomy and control for nurses,
doctors and managers. Further, a participative management style of the
lead clinician was associated with increased collaboration with other
departments in the Trust and a more positive view of morale in the
Emergency Department.
Phase Two of the study involved an in-depth analysis of eight Emergency
Departments and was undertaken using interviews, focus groups,
ethnographic observations and a staff questionnaire. While these
departments were selected on the basis of a range of performance and
situational variables, the research team undertaking this work were blind
to the performance information. Qualitative analyses revealed that better-
performing Emergency Departments were proactive in managing working
relationships with different parts of the hospital, Trust, primary care and
secondary care services. Poorly performing departments were reactive in
their approach to managing bed shortages, issues within the Emergency
Department and issues of presentation of patients to the department. In
Factors influencing Emergency Department waiting times
©NCCSDO 2007 11
addition, qualitative examination of team working indicated that higher-
performing departments are more proactive, prioritised work, described
specialist areas where doctors and nurses work together (e.g. See and
Treat) and demonstrated co-operative leadership strategies between the
head nurse and lead clinician. These leaders empower others to take
decisions at a local level in the department, facilitating effective working.
Developmental activities take place in high-performing departments to
increase staff skill and competence along with reflexive activities looking
back at waiting-time breaches with the aim of improving performance.
As part of the in-depth study, a questionnaire survey of seven of the eight
Emergency Departments revealed strong relationships between waiting
time and stress (psychological strain), and between autonomy and control
more specifically. This indicated that departments with longer waiting
times are more likely to report higher-than-average levels of strain and
higher-than-average levels of autonomy and control over work.
In summary, this study identifies that, after case-mix and department
size are taken into consideration, less time lost to nursing sickness, lower
non-pay spend within a department and a more participative
management style of the lead clinician will all improve waiting times.
Close examination of nursing sickness in relation to communication
between medical and nursing staff in the department and also
psychological strain on staff may help in understanding the importance of
this factor in the model.
Spending less on facilities and clinical practice in a department may
reflect the type of clinical behaviour if a department adheres strictly to
protocols then the number and types of investigations and treatments
provided may be limited, thereby reducing overall costs and speeding up
processes. A participative management style is a broad term suggesting
proactive leadership and boundary-spanning and developmental
behaviour that will reduce role conflict and increase co-operation and
collaboration within the department along with other agencies associated
with emergency medicine. These activities may reduce individuals’
autonomy and control, requiring people to work together in a co-
operative way to reduce waiting times. A holistic approach viewing
emergency medicine as an integral part of both primary and secondary
services will enable proactive behaviours to develop.
Many emergency departments already report mechanisms they believe
could reduce waiting times, or systems they have already put in place to
reduce waiting times. These are varied and the evidence that they are
effective is not available. None of the initiatives related to those found
through our modelling process. However, there was evidence in several
Emergency Departments of joined-up working and boundary-spanning
practices.
Factors influencing Emergency Department waiting times
©NCCSDO 2007 12
This study has mainly identified some important factors that require
further investigation. The direction of causality between waiting times and
the organisational factors identified is not clear. More work is needed in
the form of intervention studies to identify the effect of changing the
organisation or performance. Further recommendations include exploring
the issue of safety and quality of care so that performance and change
can be linked appropriately with patient outcome.
Factors influencing Emergency Department waiting times
©NCCSDO 2007 13
The Report
Section 1 Introduction and background to the study
The Audit Commission (2001) previously have shown that Emergency
Department waiting times in England and Wales vary substantially, but
their work was able to account for only a small proportion of this
variation. This, in conjunction with the findings of the SDO listening
exercise identified the need for this study (Fulop and Allen, 2000).
The aim of the study was to answer the question: what are the
organisational factors that influence waiting times in Emergency
Departments and what mechanisms are available to improve waiting
times?
A mixed-methods approach has been used to address this question. The
study has a number of different components:
• a review of policy and published literature;
• re-analysis of data from the Audit Commission review of Emergency
Departments in 2000;
• an analysis of data gathered from Emergency Departments in one
large English city over an 11-year period;
• a national survey of Emergency Departments.
The national survey of Emergency Departments took place in two phases.
Phase One consisted of the following:
• structured interviews with the lead clinician, head nurse and business
manager in each participating department;
• collection of routine patient-level data in each participating
department;
• analysis of Healthcare Commission data collected over the same time
period.
Data collected through Phase One of the national survey of Emergency
Departments was then used to identify important organisational factors
that predict waiting times. A linear regression approach was taken to
develop a model of factors from Phase One of the study.
Phase Two of the national survey consisted of an in-depth study of eight
Emergency Departments to identify additional organisational factors not

Factors influencing Emergency Department waiting times
©NCCSDO 2007 14
accounted for in Phase One of the study. Having identified organisational
factors, the study used the findings from Phase Two to examine what
mechanisms are available to improve waiting times.
Section 2 of this report contains the policy context and reviews the
literature relevant to this study. The aims, methods, results and
discussion regarding the findings from the re-analysis of the Audit
Commission data and the analysis of the urban Emergency Department
data are presented in Appendices A and B respectively. A national study
of Emergency Departments was conducted in two phases. The first phase
was undertaken by interviews with key staff in a large number of
departments in England and Wales (the national survey). In the second
phase a small number of departments were evaluated through further
detailed investigation of how the departments worked together. The
methods and results from Phase One of the study are outlined in Section
3. The methods and results of Phase Two of the study are outlined in
Section 4. The mechanisms available to improve waiting times are
outlined in Section 5. The discussion is presented in Section 6 and
incorporates findings from all components of the study.

Factors influencing Emergency Department waiting times
©NCCSDO 2007 15
Section 2 Policy context and literature review
2.1 Policy context
The Patient’s Charter in 1991 (Department of Health, 1991) established
two standards for waiting times in Emergency Departments in England.
These were the time from arrival until initial assessment (triage) and the
time from a ‘decision to admit’ being made to the actual admission time.
The Audit Commission (2001) have highlighted a number of problems
with these measures. The former gives no indication of the time patients
subsequently wait to see a doctor, the Audit Commission having
previously demonstrated that some departments with the shortest waits
for initial assessment had some of the longest waiting times to see a
doctor (Audit Commission, 1998). However, the second measure did not
indicate a period that was meaningful to patients.
Edhouse and Wardrope (1996) demonstrated that there was no
correlation between performance in relation to the former target and the
quality of the initial assessment performed. In its assessment of
Emergency Department performance the Audit Commission developed
two performance measures, the time from arrival to seeing a doctor or
nurse practitioner and the time from arrival to admission for patients
admitted to hospital (Audit Commission, 1998). These measures have
been used subsequently by the Audit Commission to collect waiting-time
data.
The Audit Commission (2001) have previously shown that waiting times
are a key determinant of patient satisfaction. As a result of the NHS Plan,
published by the Department of Health in 2000, which outlined a plan for
reform of the NHS, a new target was established for Emergency
Departments in England, such that:
By 2004 no-one should be waiting more than four hours in Accident and
Emergency from arrival to admission, transfer or discharge.
Department of Health (2000)
It was envisaged that as a result of meeting this target average waiting
times would fall to 75 minutes, although waiting time itself never formed
part of the target. Following establishment of this target, Emergency
Departments worked towards its achievement via a series of incentive-
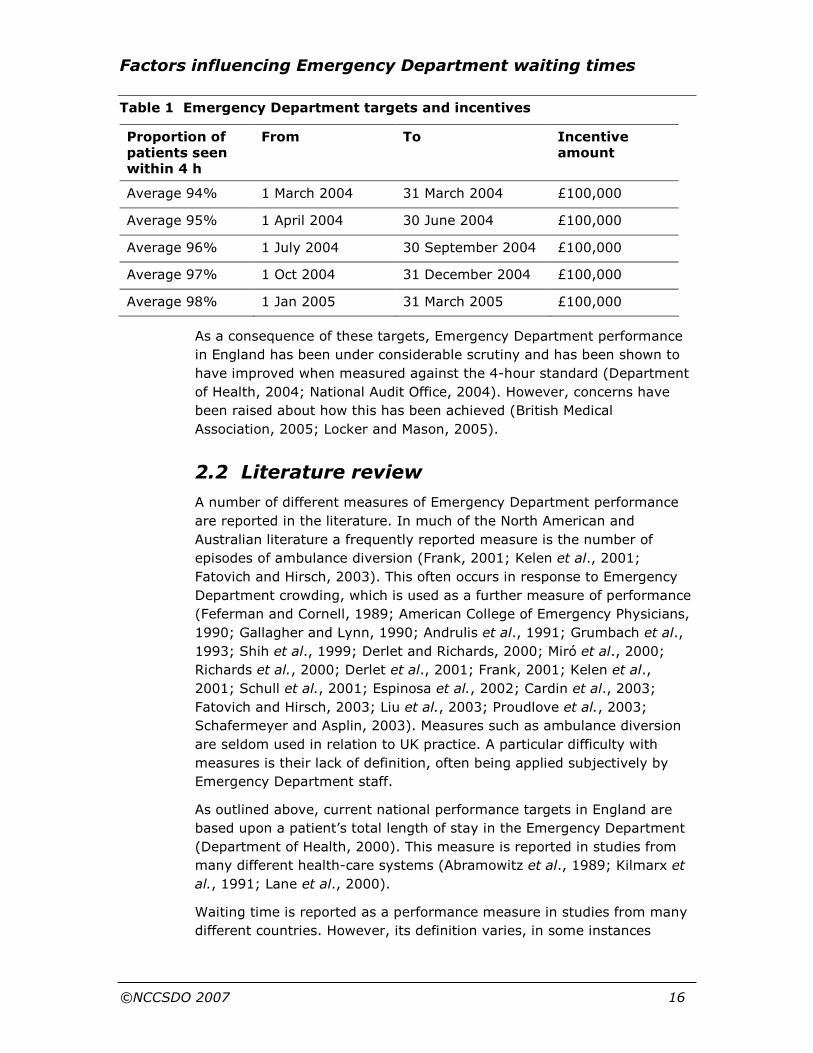
backed intermediate targets. These are shown in Table 1 (Bacon, 2004).
Factors influencing Emergency Department waiting times
©NCCSDO 2007 16
Table 1 Emergency Department targets and incentives
Proportion of patients seen within 4 h
From To Incentive amount
Average 94% 1 March 2004 31 March 2004 £100,000
Average 95% 1 April 2004 30 June 2004 £100,000
Average 96% 1 July 2004 30 September 2004 £100,000
Average 97% 1 Oct 2004 31 December 2004 £100,000
Average 98% 1 Jan 2005 31 March 2005 £100,000
As a consequence of these targets, Emergency Department performance
in England has been under considerable scrutiny and has been shown to
have improved when measured against the 4-hour standard (Department
of Health, 2004; National Audit Office, 2004). However, concerns have
been raised about how this has been achieved (British Medical
Association, 2005; Locker and Mason, 2005).
2.2 Literature review
A number of different measures of Emergency Department performance
are reported in the literature. In much of the North American and
Australian literature a frequently reported measure is the number of
episodes of ambulance diversion (Frank, 2001; Kelen et al., 2001;
Fatovich and Hirsch, 2003). This often occurs in response to Emergency
Department crowding, which is used as a further measure of performance
(Feferman and Cornell, 1989; American College of Emergency Physicians,
1990; Gallagher and Lynn, 1990; Andrulis et al., 1991; Grumbach et al.,
1993; Shih et al., 1999; Derlet and Richards, 2000; Miró et al., 2000;
Richards et al., 2000; Derlet et al., 2001; Frank, 2001; Kelen et al.,
2001; Schull et al., 2001; Espinosa et al., 2002; Cardin et al., 2003;
Fatovich and Hirsch, 2003; Liu et al., 2003; Proudlove et al., 2003;
Schafermeyer and Asplin, 2003). Measures such as ambulance diversion
are seldom used in relation to UK practice. A particular difficulty with
measures is their lack of definition, often being applied subjectively by
Emergency Department staff.
As outlined above, current national performance targets in England are
based upon a patient’s total length of stay in the Emergency Department
(Department of Health, 2000). This measure is reported in studies from
many different health-care systems (Abramowitz et al., 1989; Kilmarx et
al., 1991; Lane et al., 2000).
Waiting time is reported as a performance measure in studies from many
different countries. However, its definition varies, in some instances

Factors influencing Emergency Department waiting times
©NCCSDO 2007 17
describing a period whose endpoint is placement in an Emergency
Department room and not assessment by a clinician. A widely reported
measure of performance is the proportion of patients who leave the
Emergency Department prior to being seen by a clinician. The cause is
often multifunctional and has been shown to be related to other measures
of performance, such as waiting time (Mohsin et al., 1998; Kyriacou et
al., 1999).
The evidence relating to factors which affect waiting time is outlined
below. Where such evidence is lacking for a particular factor, other
appropriate evidence is presented. A systematic review of the literature in
this area has recently been undertaken by Cooke et al. (2005) and the
reader is directed to this for a more extensive appraisal of the literature.
2.2.1 Patient satisfaction
Waiting times have been shown to be important to patients, with those
who see a doctor more quickly increasingly likely to rate the care they
received as excellent or very good (Commission for Healthcare Audit and
Inspection, 2005). A review by Trout et al. (2000) found that perceived
waiting time, but not necessarily actual waiting time, was inversely
associated with satisfaction. However, the authors conclude that as the
reviewed studies were cross-sectional, causality could not be established.
A more recent review, by Taylor and Benger (2004), examined the factors
that influence patient satisfaction in the Emergency Department. They
comment that the most frequently assessed factors in the literature were
actual and perceived waiting time. Their review found that three 'service
factors' influence patient satisfaction. These were the interpersonal skills
and attitudes of staff, the provision of information or explanation to
patients, and waiting times. However, they were unable to determine the
relative importance of these factors.
2.2.2 Socio-demographic factors
A study of five Australian Emergency Departments examined the relation
between waiting time and socio-demographic characteristics of patients
(Mohsin et al., 1998). Waiting times were found to be significantly longer
for female patients, patients of lower socio-economic status and patients
with no health insurance. Waiting times were also significantly longer for
patients born in non-English speaking countries and varied according to
the age of the patient, being shortest for those aged less than 15 years
(51.7 minutes) and longest for those aged 15–44 years (55.3 minutes).
All of these factors were found to be significant, independent predictors of
waiting time when assessed in a multivariate, linear-regression model.
A retrospective study of two American Emergency Departments has
investigated the effect of race on total time spent in the department. The

Factors influencing Emergency Department waiting times
©NCCSDO 2007 18
authors studied patients presenting with small lacerations that required
suturing. They found no difference in total length of stay after differences
in time of presentation had been taken into account (Kilmarx et al.,
1991).
Lambe and colleagues (2003), in a study of waiting times in Californian
Emergency Departments, found that increased waiting time occurred in
hospitals serving poor neighbourhoods, demonstrating that, when
corrected for hospital and Emergency Department characteristics and
case-mix, each $10,000 decrease in per-capita income of the population
served was associated with an increase in waiting time of 10 minutes. No
studies were found that examined the relation between
socio-demographic factors and waiting times in UK Emergency
Departments.
2.2.3 Case-mix
Patients with the least-serious illnesses have been shown to wait longest
to see a doctor, but once seen spend only a short period of time
undergoing assessment and treatment (Saunders, 1987). The author of
this report concludes that waiting times are only important in relation to
patient acuity.
Graff et al. (1993) have studied the length of time Emergency
Department physicians were directly involved in providing care (the
physician service time) to different categories of patients in the
Emergency Department. The mean time was 9.8 minutes for walk-in
patients, 25 minutes for laceration repair, 55.6 minutes for patients
undergoing observation and 31.9 minutes for critical-care patients. The
intensity of service (defined as physician service time divided by total
length of stay in the Emergency Department) was greatest for patients
undergoing laceration repair (0.23), similar for critical care (0.18) and
walk-in patients (0.17), and lowest for patients undergoing observation
(0.07). Although the study did not examine the effect of case-mix upon
waiting time, it does provide evidence to support the hypothesis that
performance is dependent upon case-mix. An observational study by
Tham et al. (1995) provides further evidence. The authors observed the
activities of Senior House Officers (SHOs) in an Emergency Department in
the UK. The time spent with each patient was found to vary according to
the area of the department to which the patient had been directed, being
greater for patients in the ‘trolley area’ than the ‘walking wounded’ area.
Case-mix was not related to waiting time but the authors conclude in
general that case-mix should be considered in planning departmental
staffing needs.
Although case-mix may be important, it is difficult to separate its
influence from other department characteristics. This is illustrated in a
study Byrne et al. (2000), which compared the management of patients

Factors influencing Emergency Department waiting times
©NCCSDO 2007 19
with minor injuries in three settings: a traditional Emergency Department,
a minor-injury unit based in an Emergency Department staffed by
Emergency Nurse Practitioners (ENPs), and a nurse-led minor-injury unit
separate to an Emergency Department. Mean waiting time as found to be
highest in the traditional Emergency Department model (67 minutes) and
lowest in the separate minor-injury unit (23.1 minutes).
2.2.4 Hospital characteristics
In one study from the USA waiting times have been shown to be
significantly longer in teaching hospitals, public hospitals and trauma
centres (Lambe et al., 2003). In Emergency Departments in England and
Wales, the Audit Commission (2001) have shown waiting times to be
longer in departments with a greater number of attendances and in those
departments within London, whereas waiting times were shorter in
departments set in rural areas. Little other literature exists to support
these findings. The effect of reorganisation of emergency-care facilities in
a UK city has been reported in one study (Simpson et al., 2001). The
authors observed the effect of centralisation of two adult Emergency
Departments to one site, with the centralisation of paediatric Emergency
Department facilities to a separate site. In addition, a separate minor-
injury unit was established on the site of the adult Emergency
Department that closed. When the system was assessed as a whole,
performance had deteriorated following the reorganisation, with the
proportion of patients seeing a doctor within 1 hour decreasing from 76 to
71%. These studies suggest that the characteristics of the hospital in
which the Emergency Department is based and the organisation of health
services can impact upon Emergency Department performance.
Cooke et al. (2005) reviewed the literature regarding bed management
and Emergency Department waiting times and concluded that there was a
paucity of evidence. However, some evidence is provided from a study
simulating the activities of a hospital. Lane et al. (2000) used system-
dynamics modelling to examine the effect of alterations to the number of
inpatient hospital beds. They investigated changes in bed capacity from
700 to 900 beds. This was found to have little effect upon mean waiting
times, mean time until a decision to admit was made or the total time
spent in the Emergency Department. However, the rate of cancellation of
elective admissions was found to be highly sensitive to changes in bed
capacity, increasing markedly with reductions in the number of available
beds (Lane et al., 2000).
There is limited evidence that direct admission rights to wards by
Emergency Department teams, rather than having each admission
approved by the admitting specialty, can reduce waits in the Emergency
Department (Cooke et al., 2005).
Factors influencing Emergency Department waiting times
©NCCSDO 2007 20
2.2.5 Emergency Department facilities
Miró et al. (2003) studied the effect of reorganisation of staff and facilities
in an Emergency Department. They demonstrated that by increasing the
total number of cubicles from 38 to 57 and increasing the average
number of personnel working in the Emergency Department each day
from 22.5 to 30.2, mean waiting time was reduced from 87 to
24 minutes. This improvement occurred in spite of an increase in the
number of attendances at the department. Further evidence for the
benefits of increasing the number of available beds in an Emergency
Department is provided by Kyriacou et al. (1999). They undertook a
7-year study of patients presenting to one US Emergency Department
and found that the median time from arrival to initial medical assessment
was significantly less when an Emergency Department bed was
immediately available (1.9 compared with 2.8 hours; Kyriacou et al.,
1999).
Another way to provide increased beds in an Emergency Department is to
use an observation or clinical-decision unit to hold some patients. Cooke
et al. (2005) reviewed the evidence with regard to such units and found
that they can reduce admission and total length of stay in the Emergency
Department. However, none of the studies reviewed reported changes in
Emergency Department waiting time.
2.2.6 Working practices
There is limited evidence that bedside registration or only partial
registration prior to triage may decrease waiting time (Cooke et al.,
2005).
In recent years most Emergency Departments in the UK have performed
some form of triage, particularly following a target established by the
Patient’s Charter that all patients should undergo an assessment of the
severity of their complaint immediately upon arrival (Department of
Health, 1991). A study by Edhouse and Wardrope (1996) of 151 English
Emergency Departments found the process to be variable. In a review of
triage, Wilkinson (1999) asserts that although the process may have
some effect in reducing waiting times, for example by redirecting some
patients to other appropriate health-care providers such as general
practitioners (GPs), it may in fact extend the waiting time of patients who
present with the most urgent conditions. These findings are supported by
those of Cooke et al. (2005), who conclude that if the only purpose of
triage is to prioritise patients then it may introduce delays but that it may
also have the opposite effect if investigations or treatments are initiated.
Walley (2003) has reviewed the literature on manufacturing process
design and relates this to Emergency Department workload and flow.
Using data from two departments he concluded that triage beyond a

Factors influencing Emergency Department waiting times
©NCCSDO 2007 21
simple urgent/non-urgent categorisation introduces delays but adds no
value for non-urgent cases.
In a survey of 185 American Emergency Departments, Purnell (1991)
found that the absence of fast-track systems was associated with a 25%
increase in waiting times. However, neither waiting time nor what
constitutes a fast-track system is defined in this paper and it is therefore
difficult to relate this to UK practice. Cooke et al. (2005) have examined
the literature on fast-track systems for patients with minor conditions and
concludes that all the published studies showed improvement in waiting
times for this group of patients although there were methodological
weaknesses with many published studies. However, many of these
studies have not examined the effect that such systems have on other
patients in the Emergency Department; for those studies that did so, on
the other hand, did not demonstrate any deterioration in waiting times.
These findings are supported by Walley (2003), who concludes that ‘See
and Treat’ provides the best method for dealing with minor cases from a
manufacturing standpoint, providing a one-stage process that achieves
'quality and flexibility simultaneously'.
Lau and Leung (1997) investigated the effect of a 'small team
consultation system'. In this system available medical staff were divided
into two teams, each being assigned cases equally in terms of number
and complexity. Previously patients waiting to be seen formed a single
queue. Using this system the mean waiting time was reduced from 35.2
to 22.1 minutes, in spite of a 4% increase in attendances during the
intervention phase. The authors suggest that the improvements result
from improved staff motivation and clearer lines of responsibility.
However, it is interesting to note that nursing staff did not form part of
the teams, which were restricted to medical staff only (Lau and Leung,
1997). Hirshon et al. (1996) studied the effect of a similar system
whereby patients were assigned in turn to a separate queue for each
doctor working in an Emergency Department. When assessed 1 year later
waiting time had decreased significantly for both medical and surgical
patients. However, the period of time from being seen until disposition
had fallen for medical cases but increased for surgical cases. Tham et al.
(1995) observed the work of SHOs in a UK Emergency Department to
determine the periods of time they spent on particular tasks. They found
that on average 39.7% of their time was spent on patient contact and
18.7% on writing clinical notes. Some 18.5% of their time was classified
as being involved in 'non-doctor' tasks such as waiting on the telephone,
intravenous treatment and searching for notes.
Walley (2003) reported that manufacturing theory would suggest the
need to decentralise services such as radiology and pathology, with high-
volume processes being dealt with by dedicated small-scale technology.
Cooke et al. (2005) reviewed the literature on laboratory tests in relation

Factors influencing Emergency Department waiting times
©NCCSDO 2007 22
to the Emergency Department. The reported studies describe delays in
turnaround time, the effect of point-of-care testing and the use of satellite
laboratories. However, none of the studies reported examined the effect
on waiting time, describing instead the effect on turnaround time for the
test result or total length of stay in the Emergency Department. Cooke et
al. (2005) found similar results with regard to radiology, with
improvements in the total time spent in the department reported by
several studies, but none examining changes in waiting time.
2.2.7 Staffing
In their review of Emergency Departments in 2001 the Audit Commission
found that the level of nurse staffing varied considerably between
departments, ranging approximately from 1000 to 2000 attendances per
nurse per annum. However, they found that the level of nurse staffing
was not related to waiting times. Similarly, they showed that the level of
medical staffing ranged from 2000 to 6000 attendances per doctor per
annum but this too was unrelated to waiting times (Audit Commission,
2001). This would suggest that working practices must adapt to staffing
levels and case-mix to maintain performance.
The review by Cooke et al. (2005) reports a number of studies describing
the use of GPs working in Emergency Departments but none related this
to waiting times. This systematic review also found very limited evidence
with regard to staffing levels, skill-mix or the use of nurse practitioners in
the Emergency Department. However, there was some evidence that
increased use of senior medical staff may reduce delays (Cooke et al.,
2005). The role of other professional groups, such as paramedics and
physiotherapists, working within the Emergency Department has yet to be
adequately assessed.
2.2.8 Bonus payments
One study has examined the effect of bonus payments on Emergency
Department performance (Cameron et al., 1999). The payments made to
each hospital were reduced by episodes of ambulance diversion, failure to
meet waiting-time targets and episodes where patients waited more than
12 hours for an inpatient bed. The authors demonstrated that following
introduction of the bonus scheme performance against the targets
improved with regard to all except the wait for inpatient beds.
A system of bonus payments has recently been used in England to
improve Emergency Department performance against the ‘4-hour’ target
(Bacon, 2004). However, although performance has been shown to have
improved (Department of Health, 2004), the contribution of bonus
payments to this improvement has not been investigated.

Factors influencing Emergency Department waiting times
©NCCSDO 2007 23
2.2.9 Emergency Department management
Spaite et al. (2002) describe a rapid process redesign in a university
Emergency Department. A number of working practices were revised and
staffing increased in response to a detailed analysis of sources of delay in
the Emergency Department. These changes achieved a 90% reduction in
median Emergency Department waiting time, although it is not possible
from the data reported to assess the effect of individual components.
Similarly, the results are unlikely to be generalisable. The authors
subjectively ranked the changes implemented and suggested that the
most effective measure was to have an Emergency Department physician
appointed as administrative director of the department (Spaite et al.,
2002).
Browne et al. (2000) studied the effect of a 'seamless model' of
management in a paediatric Emergency Department. In this model
Emergency Department staff and facilities were reorganised to provide
smooth flow of patients through the department, moving away from the
traditional 'assembly line' model where patients waited to be seen until a
doctor was available. Doctors and nurses were assigned in teams, seeing
groups of patients of similar acuity. This alteration to working practices
reduced mean waiting time from 92.1 to 55.3 minutes.
2.2.10 Change management
Chinnis and White (1999) have applied concepts from chaos theory to
describe elements of Emergency Department function. They describe
Emergency Departments as complex adaptive systems and suggest that a
number of beliefs form the 'dominant logic' of the department, this being
a major influence upon the way in which the department adapts to
changes in circumstances. The beliefs forming the dominant logic are
that:
• waits are unavoidable and acceptable;
• the customer is captive;
• it is too expensive to deliver primary care;
• Emergency Departments are for life-threatening emergencies only
• providers must achieve proficiency in critical care only;
• pre-hospital emergency medical services are for emergencies only;
• more nurses and fewer ancillary providers means better care.
Chinnis and White (1999) state that these beliefs must be challenged for
the status quo to alter. Although this paper relates to North American
practice, many of the ideas are applicable internationally.
VanRooyen et al. (1999) undertook a survey of 100 US Emergency
Departments to investigate the perceived effectiveness of Total Quality
Factors influencing Emergency Department waiting times
©NCCSDO 2007 24
Management. Of the 60 Emergency Departments that responded, 60%
reported using Total Quality Management as part of their quality-
improvement initiatives. The authors found that the participation of
Emergency Department staff in Total Quality Management projects was
low. The study found that 61% of Emergency Department directors or
administrators rated their Total Quality Management programmes as
ineffective.
A study of Emergency Department staff involved in the Emergency
Services Enhancement Program in Victoria, Australia, identified a number
of factors thought by staff to be important in bringing about improvement
in Emergency Department services (Cobelas et al., 2001). The five factors
identified were changes in staff profile, managing patient flow in the
Emergency Department, changes in administrative policies, changes in
work practices and changes in staff numbers. The programme achieved a
20% improvement in waiting time as perceived by participants of the
study.
2.2.11 Work factors
Working in a health-care environment can be as difficult and stressful as
it can be rewarding and challenging depending on individual perception
and cognition (Lazarus and Folkman, 1984; Payne, 1999). The
Emergency Department is an area of complex and challenging work
where different health-care professionals are required to work together to
achieve effective patient outcomes. There is good evidence that working
in teams enables people to more effectively meet the challenges of this
type of work (Carter and West, 1999). A large-scale survey of stress in
health-care organisations in England (Wall et al., 1997; Borrill et al.,
1998a) identified that individuals who work together in well-defined
teams have clear, shared objectives, need to work with each other to
achieve those objectives, have different roles for team members and
recognise a team as performing a specific function. These individuals are
more likely to report lower levels of psychological stress and better job
satisfaction than those who work in less clearly defined teams (teams that
do not share the above criteria; Carter and West, 1999). However, in this
study, the number of teams working in an Emergency Department were
few, making the evaluation of effective work grouping in that context
limited.
Emergency working crosses both professional and organisational
boundaries involving various members of secondary and primary health
care teams, GPs, social workers, and mental health and ambulance
services. Structures and processes that enable people to work together
effectively across boundaries are not common. Studies show there is little
appreciation of roles and responsibilities of other professionals (Poulton,
1995) and role ambiguity and role conflict are common experiences

Factors influencing Emergency Department waiting times
©NCCSDO 2007 25
(Spaite et al., 2002). These difficulties were recognised in national reports
(Miró et al., 2003) identifying separate lines of control, payment systems,
diverse objectives, professional barriers and perceived inequalities in
status limiting efficient team working. In particular, the piecemeal
development of health care over its history has led to a lack of an agreed
model of leadership (West and Slater, 1996) that might lead to proactive
management strategies encouraging effective working in these complex
environments.
Managers have a critical role, and are central to organisational
effectiveness (Cameron et al., 1999), particularly as they create the
climate for working together. Key is the extent to which managers
encourage or discourage subordinates to become involved in, or take
responsibility for, decisions relevant to their own work activity. Research
examining the concept of participation is extensive, originating from the
Hawthorne studies (Roethlisberger and Dickson, 1939) and developed by
Argyris (1964), Likert (1967) and McGregor (1960). More recent studies
of health-care staff demonstrate that major causes of stress for staff are
high work demands, low influence on decisions, conflicting job demands,
poor feedback on work performance and lack of clarity about job roles
(Borrill et al., 1998a). Taken together, this literature provides key work
factors valuable for exploring the context of effective working in
Emergency Departments.
The next section presents the first phase of the study examining the
factors influencing Emergency Department waiting times. This phase is
the national survey of Emergency Departments where interviews with
lead clinicians, head nurses and business managers of participating
departments took place.
Factors influencing Emergency Department waiting times
©NCCSDO 2007 26
Section 3 National survey of Emergency Departments
3.1 Aims
This part of the study aimed to identify organisational factors that predict
waiting times in Emergency Departments in England and Wales. The first
phase aimed to examine these factors in a large number of departments
and develop a model to predict waiting times. The second phase aimed to
identify further factors, not identified in Phase One, by in-depth study of a
small number of departments.
3.2 Phase One methods
The Healthcare Commission was due to undertake a review of Emergency
Departments in England and Wales coincident with the data collection for
this part of the study. Following discussion with representatives from the
Healthcare Commission and with the project steering committee it was
decided to work in collaboration with the Healthcare Commission on this
phase of the study thus avoiding any duplication of data collection and
effort. Data collection for this phase of the study was therefore
undertaken by three methods; data collected by the Healthcare
Commission, structured interviews with key Emergency Department staff
and abstraction of data from Emergency Department information
technology (IT) systems. Each method is outlined below.
3.3.1 Ethics and Research Governance approval
Multi-centre research ethics committee approval was obtained prior to
commencement of the study (Eastern MREC reference 03/5/072).
Research Governance approval was obtained for the 137 Emergency
Departments consenting to participate in the study, which were from 112
NHS Trusts. Further detail is given in Appendix C.
3.2.2 Healthcare Commission data
The Healthcare Commission undertake reviews of Emergency
Departments in England and Wales as part of the Acute Hospital Portfolio.
The responsibility for this moved from the Audit Commission to the
Healthcare Commission in April 2004. It is mandatory for departments to
participate in these reviews.
The data-collection tool for this part of the study was developed jointly by
staff from the Healthcare Commission with input from the study team. It
Factors influencing Emergency Department waiting times
©NCCSDO 2007 27
was based upon those used previously by the Audit Commission, with a
number of questions added for the purpose of this study. Data collection
is undertaken in the following way.
Auditors from the Healthcare Commission met with key personnel from
each Trust to train them in the use of the data-collection tool. Each Trust
completed the electronic data-collection tool, which had inbuilt validation.
This was subsequently returned to the Healthcare Commission where the
results were extracted and reviewed. The data were then checked and
returned to the submitting department for final validation. Upon
completion of validation these data were passed to the study team for
analysis (see Appendix D for the data-collection tool).
3.2.3 Interviews with key Emergency Department
staff
Structured interviews were undertaken with the lead clinician, head nurse
and business manager of each department. The interviews each consisted
of two sections. Section 1 contained items related specifically to the
interviewee’s role within the Emergency Department. This section was
developed with input from the following sources:
• review of published literature;
• Audit Commission reports on Emergency Departments;
• key stakeholders: patient’s representatives, Emergency Department
clinicians, nurses and managers, and senior managerial staff from
acute NHS Trusts providing emergency care;
• academics with expertise in the field of emergency-care research.
Section 2 was common to all three interviews and sought information
regarding:
• management style1;
• inclusivity of various staff groups working in the Emergency
Department;
• work characteristics (such as autonomy and control, work demands,
role clarity, role conflict, professional compromise2 and leader
support3);
1 Work by Sadler (1970) suggests that there are four distinct management styles: telling, selling, consulting and joining,
indicating an increasing level of participation in decision-making.
2 The level of professional compromise refers to the extent to which individuals believe staff in the Trust have to
compromise professional standards in carrying out their work to meet conflicting objectives, such as reducing financial
costs or coping with inadequate staff levels.
3 Leader support is the extent to which staff can count on their immediate supervisor to listen when they need to talk
about problems at work.

Factors influencing Emergency Department waiting times
©NCCSDO 2007 28
• ratings comparing their Emergency Department with others in terms
of collaboration among staff groups, morale and effectiveness.
This section was developed from the literature review by occupational
psychologists in the research team (see Appendix E for the interview
schedules).
The interviews were undertaken by individuals recruited from a number of
geographical areas, all of whom were either Emergency Department
clinicians or academic staff with experience of emergency-care research.
Each interviewer underwent training in the data-collection methods prior
to undertaking the interviews.
The interviews were predominantly undertaken face to face in the
Emergency Department where the interviewees worked and at a time
convenient to them. However, in the later stages of the study a small
number of interviews were conducted by telephone to maximise the
number of departments in which all three interviews were completed.
Telephone interviews were only undertaken by experienced researchers
with prior experience of telephone-interview techniques.
3.2.4 Abstraction of data from Emergency Department
IT systems
Each participating department was asked to provide a sample of data
detailing all new attendances occurring during April 2004. For each
attendance the following patient information was collected:
• age,
• sex,
• mode of arrival,
• time of arrival, time seen by a clinician and time leaving the
Emergency Department,
• disposal from the Emergency Department.
3.2.5 Phase One recruitment
All 211 type 1 Emergency Departments in England and Wales were invited
to participate in this study. The lead clinician of each department and the
Chief Executive of each Trust containing an Emergency Department were
contacted by letter inviting them to participate. The letter contained
information about the study and a consent form. Where no response was
received, a follow-up letter was sent to them on two further occasions, at
1-month intervals, seeking consent to the study. Of the departments
approached, 137 (64.9%) consented to participate in the study and 16
(7.6%) refused. No response was received from the remaining 58
(27.5%) departments. Participating departments were recruited from 112

Factors influencing Emergency Department waiting times
©NCCSDO 2007 29
acute NHS Trusts in 31 Strategic Health Authorities in England and Wales.
Details of the Strategic Health Authorities are given in Appendix C.
3.3 Phase One data analysis
3.3.1 Sample of new attenders in April 2004
As previously mentioned the mean waiting time was calculated for each of
the departments submitting data. Agreement between the mean waiting
time from these data and that reported in the Healthcare Commission
data was examined using methods described by Bland and Altman
(1995). Where Healthcare Commission data on mean waiting time were
not available, the sample-data mean waiting time was used as a proxy in
the subsequent analyses.
3.3.2 Data from structured interviews
Interviews with the lead clinician, head nurse and business manager were
examined with descriptive statistics. For the second section of these
interviews, it was particularly important to look at the match of responses
from the three parties to see whether they agreed or disagreed on the
various aspects of departmental working. Intra-class correlation
coefficients were calculated for key variables. Following development of
the multivariate model, chi square (Χ2) analyses were used to examine
trends in relationships among variables identified by the model.
3.3.3 Data from the Healthcare Commission
instrument
The information collected and provided by the Healthcare Commission
were examined using descriptive statistics.
3.3.4 Development of the regression model
A stepwise linear-regression approach was taken to analysing all these
data. In the first step of the regression analysis the variation in mean
waiting time arising from differences in case-mix and department size
was controlled for. The variables used to reflect these in each department
were:
• percentage of patients aged 65 years or over,
• percentage of patient aged less than 16 years,
• percentage of patients arriving by ambulance,
• percentage of patients admitted,
• percentage of patients referred the Emergency Department by a GP,
• department size.
Factors influencing Emergency Department waiting times
©NCCSDO 2007 30
Each of the variables from the Healthcare Commission and section 1 of
the structured interview data were then regressed individually upon the
residual waiting time. Those showing potentially significant associations
(P<0.1) were subsequently entered into a multivariate linear-regression
model using a stepwise elimination algorithm.
Following development of the model in the preceding step potentially
predictive variables from section 2 of the structured interview data were
entered into the model to determine whether they could explain any of
the remaining variability.
3.4 Results
3.4.1 National survey data: section 1
Staff interviews
Interviews with lead clinician, head nurse and business manager were
undertaken from May 2004 to May 2005. A total of 351 interviews were
completed during this time. All three interviews were completed in 109
(79.6%) of the 137 participating departments. In a further 14 (10.2%)
departments at least one interview was completed. In the remaining
departments it was not possible to complete any of the interviews during
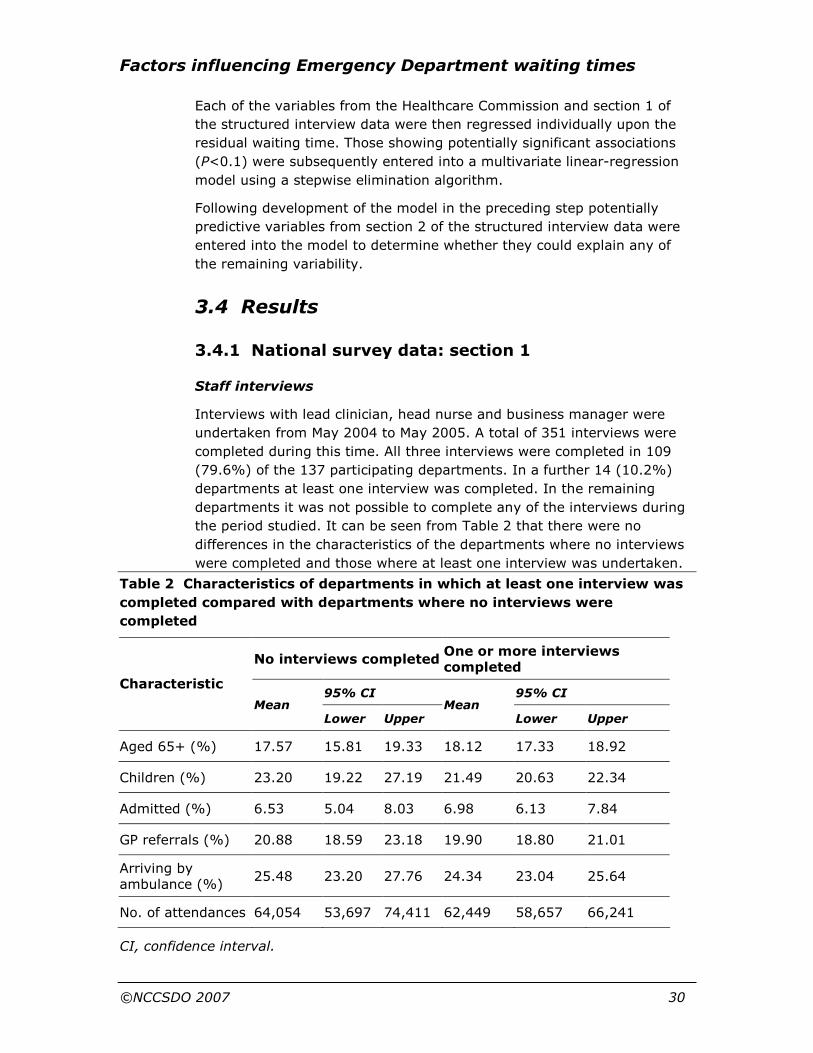
the period studied. It can be seen from Table 2 that there were no
differences in the characteristics of the departments where no interviews
were completed and those where at least one interview was undertaken.
Table 2 Characteristics of departments in which at least one interview was
completed compared with departments where no interviews were
completed
No interviews completed One or more interviews completed
95% CI 95% CI Characteristic
Mean Lower Upper
Mean Lower Upper
Aged 65+ (%) 17.57 15.81 19.33 18.12 17.33 18.92
Children (%) 23.20 19.22 27.19 21.49 20.63 22.34
Admitted (%) 6.53 5.04 8.03 6.98 6.13 7.84
GP referrals (%) 20.88 18.59 23.18 19.90 18.80 21.01
Arriving by ambulance (%)
25.48 23.20 27.76 24.34 23.04 25.64
No. of attendances 64,054 53,697 74,411 62,449 58,657 66,241
CI, confidence interval.

Factors influencing Emergency Department waiting times
©NCCSDO 2007 31
Healthcare Commission data
Of the participating departments, 136 (99.3%) submitted data to the
Healthcare Commission as part of the Acute Hospital Portfolio, which was
then also made available to the study for further analyses.
Emergency Department sample-month data
A total of 122 (89.1%) departments returned data as requested. Five
(3.6%) departments were unable to abstract the information from their IT
systems. The remaining departments did not return data.
Quality of waiting-time data
An assessment of the quality of waiting-time data collected by Emergency
Departments was made using the 1-month sample data obtained from the
participating sites. The proportion of episodes of missing or erroneous
data was determined. The recorded data were considered erroneous if the
time seen by a decision-making clinician (DMC) preceded the time of
arrival or if the calculated waiting time was greater than 24 hours.
Characteristics of those episodes with and those without valid waiting-
time data were compared.
A total of 122 sites returned the sample month’s routine data, detailing
648,203 patient episodes. Of these, the time of arrival was missing in 17
(0.003%) episodes and the time seen by a clinician was missing in
101,458 (15.7%) episodes. The recorded time seen was erroneous in
3116 (0.5%). In total, the data were missing or erroneous in 104,591
(16.1%) episodes. The most likely reason for missing or erroneous time
data was failure by the DMC to record accurately the time the patient was
seen in the Emergency Department. This amount of missing data is
comparable with that found during the profiling exercise of a large urban
Emergency Department undertaken earlier in this study (see Appendix A).
In this Emergency Department, we found that time data were missing in
15.2% of patient episodes.
Table 3 Comparison of episodes with and without valid waiting-time data
Characteristic Data valid (n=543,629) Data not valid (n=104,574)
Mean age (years) 37.7 (37.7–37.8) 38.6 (38.4–38.7)
Male (%) 52.5 (52.4–52.7) 43.2 (42.9–43.5)
Arriving by ambulance (%) 21.0 (20.9–21.1) 28.2 (27.9–28.5)
Admitted (%) 19.9 (19.8–20.0) 25.3 (25.0–25.6)
Note: 95% confidence intervals are shown in parentheses.
Factors influencing Emergency Department waiting times
©NCCSDO 2007 32
As can be seen from Table 3, the characteristics of episodes with and
without valid waiting-time data show considerable differences.
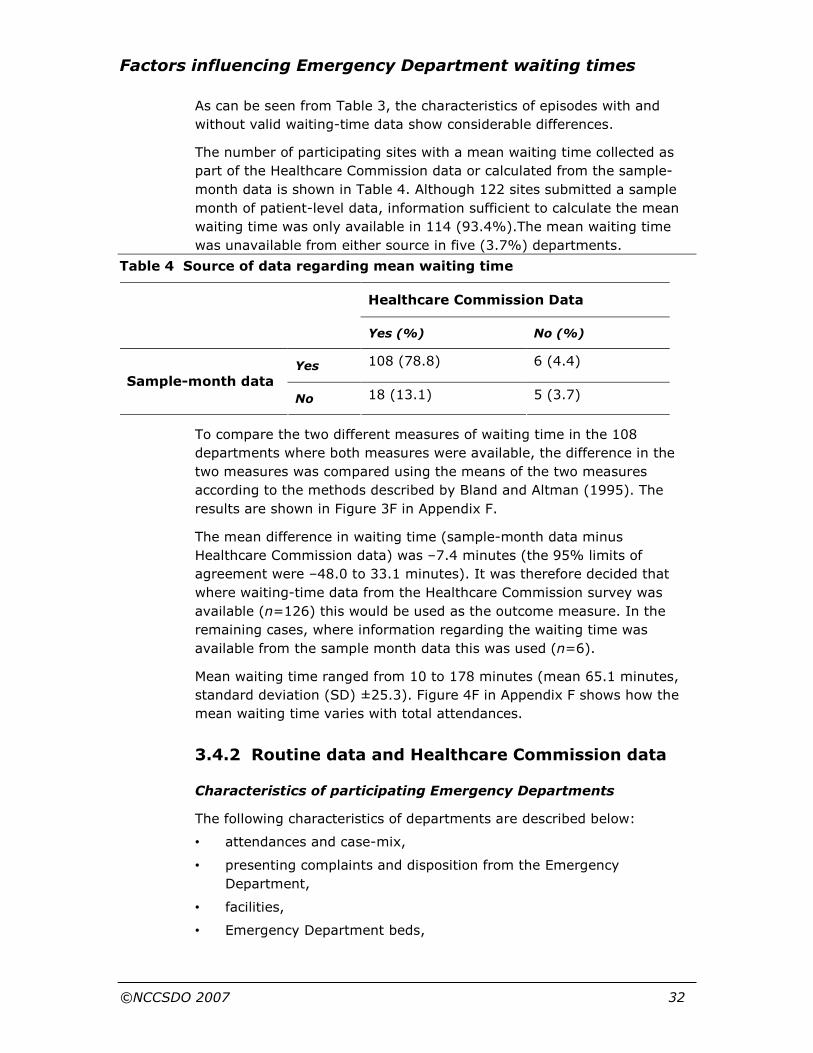
The number of participating sites with a mean waiting time collected as
part of the Healthcare Commission data or calculated from the sample-
month data is shown in Table 4. Although 122 sites submitted a sample
month of patient-level data, information sufficient to calculate the mean
waiting time was only available in 114 (93.4%).The mean waiting time
was unavailable from either source in five (3.7%) departments.
Table 4 Source of data regarding mean waiting time
Healthcare Commission Data
Yes (%) No (%)
Yes 108 (78.8) 6 (4.4)
Sample-month data
No 18 (13.1) 5 (3.7)
To compare the two different measures of waiting time in the 108
departments where both measures were available, the difference in the
two measures was compared using the means of the two measures
according to the methods described by Bland and Altman (1995). The
results are shown in Figure 3F in Appendix F.
The mean difference in waiting time (sample-month data minus
Healthcare Commission data) was –7.4 minutes (the 95% limits of
agreement were –48.0 to 33.1 minutes). It was therefore decided that
where waiting-time data from the Healthcare Commission survey was
available (n=126) this would be used as the outcome measure. In the
remaining cases, where information regarding the waiting time was
available from the sample month data this was used (n=6).
Mean waiting time ranged from 10 to 178 minutes (mean 65.1 minutes,
standard deviation (SD) ±25.3). Figure 4F in Appendix F shows how the
mean waiting time varies with total attendances.
3.4.2 Routine data and Healthcare Commission data
Characteristics of participating Emergency Departments
The following characteristics of departments are described below:
• attendances and case-mix,
• presenting complaints and disposition from the Emergency
Department,
• facilities,
• Emergency Department beds,
Factors influencing Emergency Department waiting times
©NCCSDO 2007 33
0
5
10
15
20
25
30
10-19
20-29
30-39
40-49
50-59
60-69
70-79
80-89
90-99
100-109
110-119
120-129
130-139
1000 attendances per annum
Number of departments
• minor-injury units/walk-in centres/minor-illness units,
• GP staffed primary care centres.
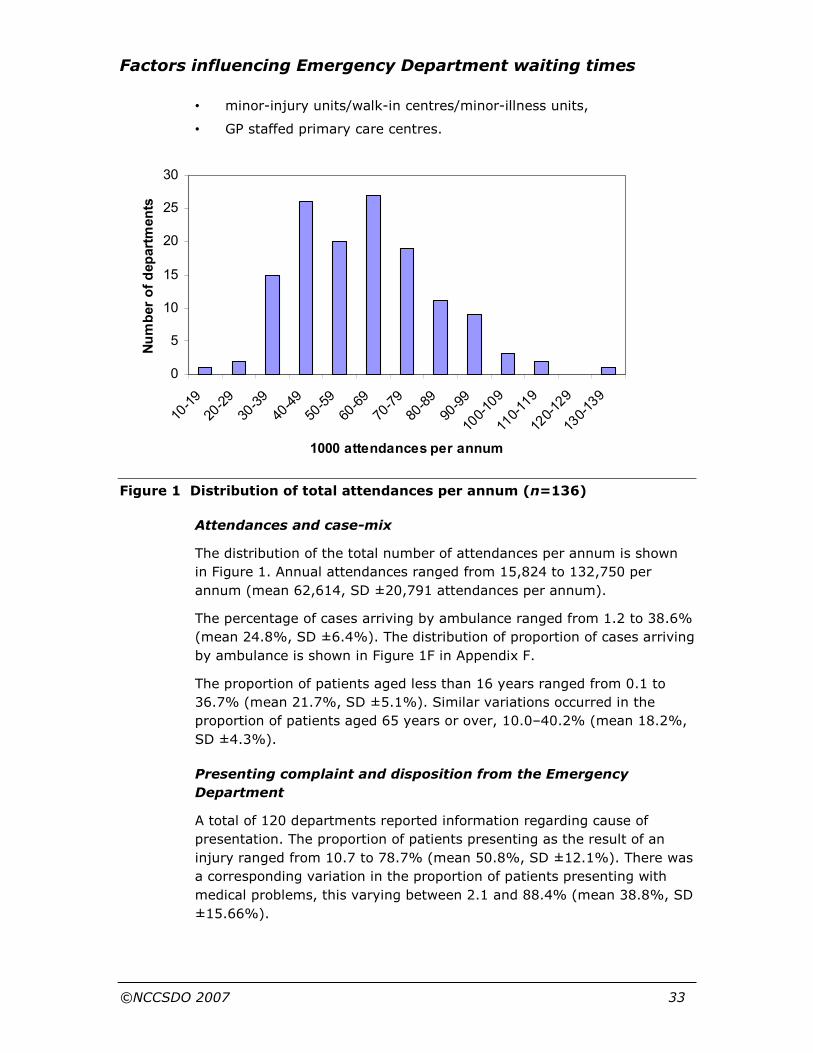
Figure 1 Distribution of total attendances per annum (n=136)
Attendances and case-mix
The distribution of the total number of attendances per annum is shown
in Figure 1. Annual attendances ranged from 15,824 to 132,750 per
annum (mean 62,614, SD ±20,791 attendances per annum).
The percentage of cases arriving by ambulance ranged from 1.2 to 38.6%
(mean 24.8%, SD ±6.4%). The distribution of proportion of cases arriving
by ambulance is shown in Figure 1F in Appendix F.
The proportion of patients aged less than 16 years ranged from 0.1 to
36.7% (mean 21.7%, SD ±5.1%). Similar variations occurred in the
proportion of patients aged 65 years or over, 10.0–40.2% (mean 18.2%,
SD ±4.3%).
Presenting complaint and disposition from the Emergency
Department
A total of 120 departments reported information regarding cause of
presentation. The proportion of patients presenting as the result of an
injury ranged from 10.7 to 78.7% (mean 50.8%, SD ±12.1%). There was
a corresponding variation in the proportion of patients presenting with
medical problems, this varying between 2.1 and 88.4% (mean 38.8%, SD
±15.66%).

Factors influencing Emergency Department waiting times
©NCCSDO 2007 34
0
10
20
30
40
50
60
70
80
30-39 40-49 50-59 60-69 70-79 80-89 90-99
1000 attendances per annum
number
Total space
Doctors
Nurses
One hundred and thirty-five departments reported the percentage of
patients admitted from the Emergency Department. This showed
considerably less variation than might be expected from the variations in
case-mix described above, ranging from 3.7 to 42.4% (mean 20.2%, SD
±7.7%). The distribution of percentage of cases admitted is shown in
Figure 2F in Appendix F.
Facilities
Of the 110 departments for which data were available, 64 (58.2%) were
managed in directorates in combination with other specialties.
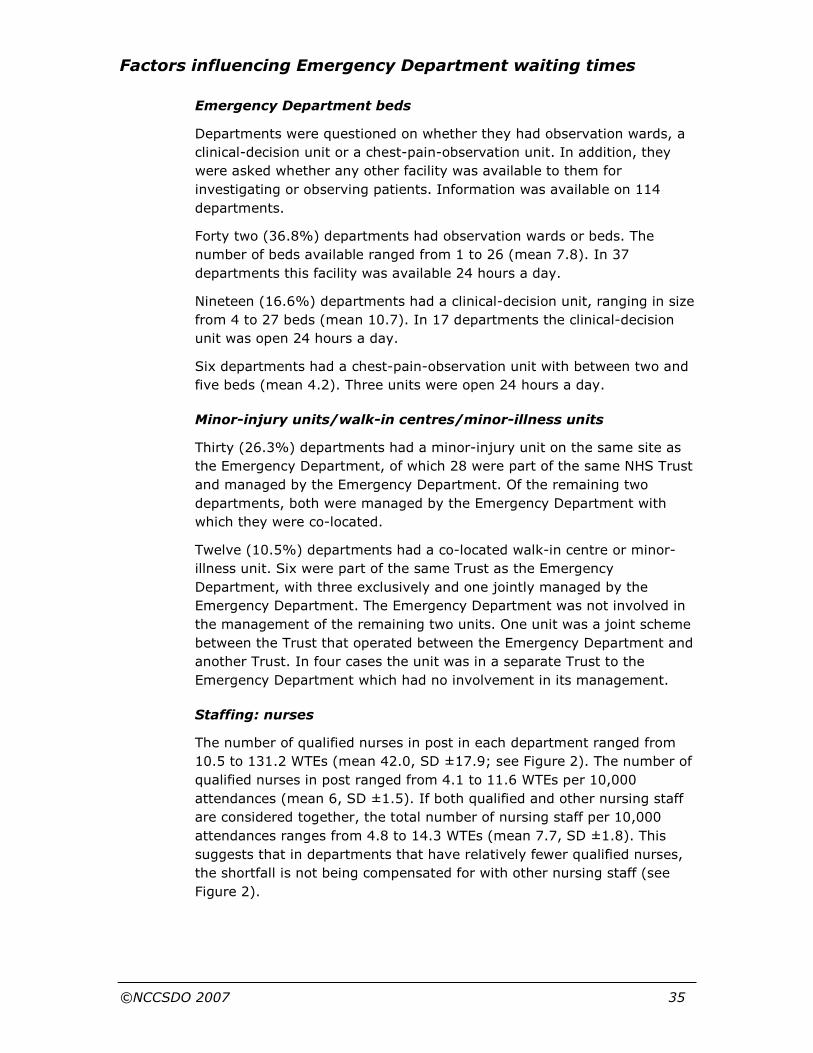
The total number of cubicles, including resuscitation bays and treatment
rooms, ranged from 9 to 70 (mean 24.9, SD ±10.0) per department.
Figure 2 demonstrates how the number of cubicles available varies with
the number of attendances.
Figure 2 Graph to demonstrate the median number of cubicles, doctors WTE
and nurses WTE per 1000 attendances per annum
The data shown are limited to departments seeing 30,000–99,999 attendances per
annum, n=127. Bars represent interquartile ranges. WTE, whole-time
equivalent.
Factors influencing Emergency Department waiting times
©NCCSDO 2007 35
Emergency Department beds
Departments were questioned on whether they had observation wards, a
clinical-decision unit or a chest-pain-observation unit. In addition, they
were asked whether any other facility was available to them for
investigating or observing patients. Information was available on 114
departments.
Forty two (36.8%) departments had observation wards or beds. The
number of beds available ranged from 1 to 26 (mean 7.8). In 37
departments this facility was available 24 hours a day.
Nineteen (16.6%) departments had a clinical-decision unit, ranging in size
from 4 to 27 beds (mean 10.7). In 17 departments the clinical-decision
unit was open 24 hours a day.
Six departments had a chest-pain-observation unit with between two and
five beds (mean 4.2). Three units were open 24 hours a day.
Minor-injury units/walk-in centres/minor-illness units
Thirty (26.3%) departments had a minor-injury unit on the same site as
the Emergency Department, of which 28 were part of the same NHS Trust
and managed by the Emergency Department. Of the remaining two
departments, both were managed by the Emergency Department with
which they were co-located.
Twelve (10.5%) departments had a co-located walk-in centre or minor-
illness unit. Six were part of the same Trust as the Emergency
Department, with three exclusively and one jointly managed by the
Emergency Department. The Emergency Department was not involved in
the management of the remaining two units. One unit was a joint scheme
between the Trust that operated between the Emergency Department and
another Trust. In four cases the unit was in a separate Trust to the
Emergency Department which had no involvement in its management.
Staffing: nurses
The number of qualified nurses in post in each department ranged from
10.5 to 131.2 WTEs (mean 42.0, SD ±17.9; see Figure 2). The number of
qualified nurses in post ranged from 4.1 to 11.6 WTEs per 10,000
attendances (mean 6, SD ±1.5). If both qualified and other nursing staff
are considered together, the total number of nursing staff per 10,000
attendances ranges from 4.8 to 14.3 WTEs (mean 7.7, SD ±1.8). This
suggests that in departments that have relatively fewer qualified nurses,
the shortfall is not being compensated for with other nursing staff (see
Figure 2).
Factors influencing Emergency Department waiting times
©NCCSDO 2007 36
Staffing: doctors
The total number of doctors in posts ranged from 4.0 to 54.0 WTEs
(mean 18.7, SD ±7.9). The number of doctors in post is shown in relation
to the total number of attendances in Figure 2 and ranges from 1.3 to 4.7
WTEs per 10,000 attendances (mean 2.9, SD ±0.7).
Staffing: ENPs
Of the departments for which data were available, 16 (11.8%) did not
employ ENPs. The remaining departments employed between 0.2 and 24
WTE ENPs, representing 0.6–44.1% (mean 15.6%) of the total number of
WTE qualified nurses. In the 102 departments reporting the proportion of
cases first seen by ENPs this ranged from 0.1 to 93.6% (mean 12.9%).
Availability of an experienced doctor
An experienced doctor was defined as someone with at least 6 months
prior experience of emergency medicine. Information was available for
114 departments. Of these, 53 (46.5%) had an experienced doctor who
was on site 24 hours a day and able to respond within 5 minutes. Of the
remaining departments, an experienced doctor was available on average
16 hours per day from Monday to Friday and 15 hours per day at
weekends.
Sickness absence
The percentage of nursing hours lost to sickness absence ranged from 0.2
to 15.6% (mean 5.6%, n=128). Of the 112 departments where
information was available, 24 (21.4%) reported having incentive schemes
in place to reduce sickness absence. These included prize draws for staff
with no absence, 1 day’s extra annual leave after 4 years without absence
and increased study leave. However, few of these incentives were
proactive in nature, with many requiring 100% attendance for long
periods.
Working practices
Triage
Of 120 departments where information was available, 56 (46.7%) triaged
all patients, 51 (42.5%) triaged some patients and 12 (10.0%) triaged
none. The interviewee in the remaining site did not know the current
triage policy. Of those sites undertaking triage, the patient could be
directed, following triage, to health-care services other than the
Emergency Department in 82 (76.3%) cases.
Queuing of patients prior to registration
A total of 49 (40.8%) departments reported deliberately queuing patients
prior to registration. The frequency with which deliberate queuing was

Factors influencing Emergency Department waiting times
©NCCSDO 2007 37
reported for minor and major cases is shown in Table 5. This table shows
that most departments never operative deliberate queuing of patients or
holding patients in ambulances. However, daily deliberate queuing
occurred in one-third of departments for minor cases and over 10% of
departments for major cases.
Table 5 Reported frequency of deliberate queuing of patients and holding in
ambulances prior to registration
Frequency Minor cases, n (%) Major cases, n (%)
Deliberate queuing
Never 67 (57.8) 98 (82.4)
Daily 39 (33.6) 14 (11.8)
Weekly 7 (6.0) 5 (4.2)
Monthly 2 (1.7) 2 (1.7)
Less then monthly 1 (0.9) 0
Total 116 119
Holding in ambulances
Never 107 (89.9) 100 (84.0)
Daily 2 (1.7) 3 (2.5)
Weekly 2 (1.7) 5 (4.2)
Monthly 5 (4.2) 5 (4.2)
Less then monthly 3 (2.5) 6 (5.0)
Total 119 119
Holding patients in ambulances
A total of 21 (17.5%) departments reported holding patients in
ambulances. The frequency with which this occurred is shown in Table 5.
See and Treat
Data were available regarding See and Treat (see Glossary) in 120 (5%)
departments; 105 (87.5%) departments performed See and Treat, of
which 89 (74.2%) did so daily, 12 (10%) weekly and the remaining
departments less frequently. The frequency with which different staff
groups were involved in See and Treat is shown in Table 6.
Rapid Assessment and Treatment
Data were available regarding Rapid Assessment and Treatment (see
Glossary) in 120 departments. Eighty-eight (73.3%) departments
undertook Rapid Assessment and Treatment or Executive Triage, of which
69 (57.5%) did so daily, 13 (10.8%) weekly and the remainder less

Factors influencing Emergency Department waiting times
©NCCSDO 2007 38
frequently. The frequency with which different staff groups undertook
Rapid Assessment and Treatment is shown in Table 6.
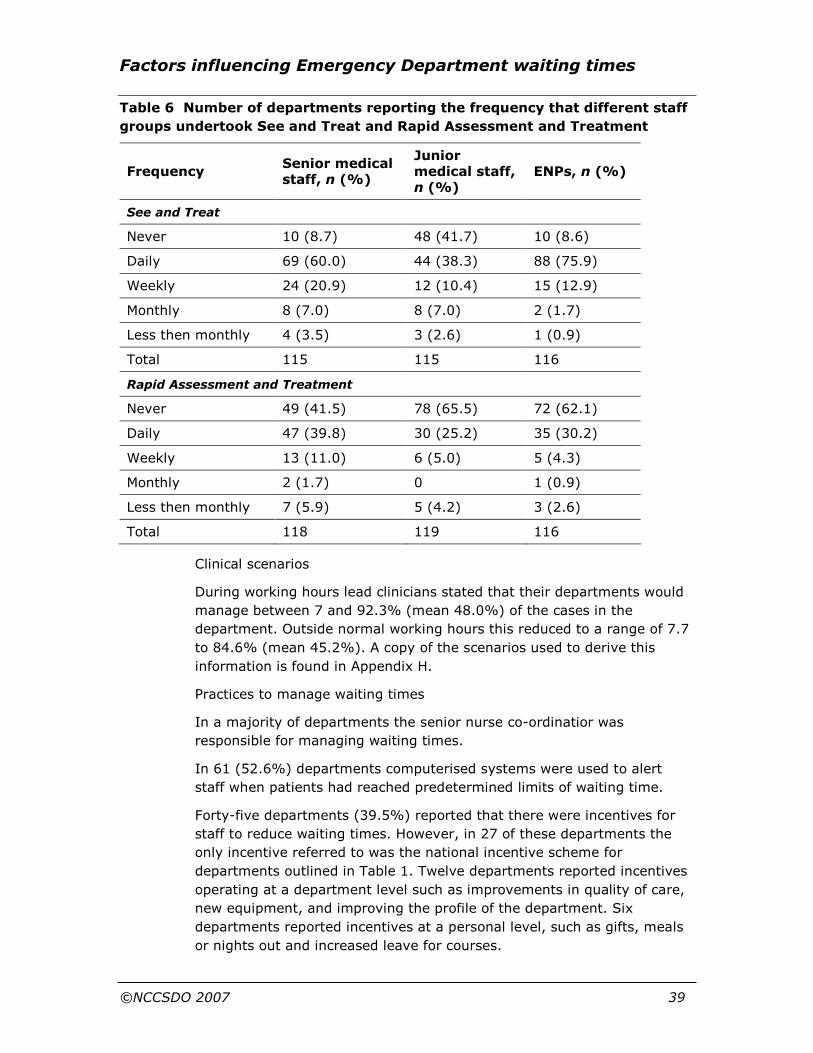
Factors influencing Emergency Department waiting times
©NCCSDO 2007 39
Table 6 Number of departments reporting the frequency that different staff
groups undertook See and Treat and Rapid Assessment and Treatment
Frequency Senior medical staff, n (%)
Junior medical staff, n (%)
ENPs, n (%)
See and Treat
Never 10 (8.7) 48 (41.7) 10 (8.6)
Daily 69 (60.0) 44 (38.3) 88 (75.9)
Weekly 24 (20.9) 12 (10.4) 15 (12.9)
Monthly 8 (7.0) 8 (7.0) 2 (1.7)
Less then monthly 4 (3.5) 3 (2.6) 1 (0.9)
Total 115 115 116
Rapid Assessment and Treatment
Never 49 (41.5) 78 (65.5) 72 (62.1)
Daily 47 (39.8) 30 (25.2) 35 (30.2)
Weekly 13 (11.0) 6 (5.0) 5 (4.3)
Monthly 2 (1.7) 0 1 (0.9)
Less then monthly 7 (5.9) 5 (4.2) 3 (2.6)
Total 118 119 116
Clinical scenarios
During working hours lead clinicians stated that their departments would
manage between 7 and 92.3% (mean 48.0%) of the cases in the
department. Outside normal working hours this reduced to a range of 7.7
to 84.6% (mean 45.2%). A copy of the scenarios used to derive this
information is found in Appendix H.
Practices to manage waiting times
In a majority of departments the senior nurse co-ordinatior was
responsible for managing waiting times.
In 61 (52.6%) departments computerised systems were used to alert
staff when patients had reached predetermined limits of waiting time.
Forty-five departments (39.5%) reported that there were incentives for
staff to reduce waiting times. However, in 27 of these departments the
only incentive referred to was the national incentive scheme for
departments outlined in Table 1. Twelve departments reported incentives
operating at a department level such as improvements in quality of care,
new equipment, and improving the profile of the department. Six
departments reported incentives at a personal level, such as gifts, meals
or nights out and increased leave for courses.

Factors influencing Emergency Department waiting times
©NCCSDO 2007 40
Seventy-nine departments had policies to deal with exceptionally long
waiting times; these included ambulance diversion (41 sites), calling in
extra medical staff (49 sites) and calling in extra nursing staff (51 sites).
3.4.3 National survey data: section 2
The second part of the interview focused on aspects of working in the
Emergency Department. The lead clinician, head nurse and business
manager were asked questions about working in their department (see
Appendix C).
There were 137 responses to these questions in total, but there were
several cases of missing variables. The data collected related to frequency
of staff meetings, contribution to general meetings, team working, work
characteristics and managements.
The areas of particular interest described below.
Frequency of general staff meetings
There were differing views on the frequency of staff meetings. Business
managers thought these occurred more frequently (approaching twice a
month, mean 1.84, SD 3.27; note that SD here is in the positive direction
only), than lead clinicians (once or twice a month, mean 1.58, SD 2.99)
or head nurses (a little over once a month, mean 1.24, SD 1.17).
Contribution to general meetings
Interviewees were asked which staff groups were able to contribute to
these meetings. Doctors and nurses were included by all parties but
overall head nurses and business managers were more inclusive of
administrative staff, managers, professions allied to medicines (PAMs),
professions and technical staff (P&T) and ancillary staff than lead
clinicians. Lead clinicians were less likely to include managers and
administrative staff in general meetings.
Several other groups of staff were included in certain departments, such
as domestics, mental health liaison staff, security, rapid-response teams,
porters and ambulance representatives.
Team working
Interviewees were asked whether there was team working in the
Emergency Department using a five-point response scale ranging from
‘none’ to ‘a great deal’. Eleven parties perceived that there was ‘a lot’ of
team working but responses varied with lead clinicians perceiving the
most team working (mean 4.11, SD ±0.89), compared to head nurses
(mean 4.04, SD ±1.05) and business managers (mean 3.93, SD ±0.93)
perceiving the least team working. All interviewees perceived that doctors

Factors influencing Emergency Department waiting times
©NCCSDO 2007 41
and nurses were included in the Emergency Department team.
Administrative staff were also included, but at least one in four required
prompting for this answer. Ancillary staff (e.g. cleaners) were more likely
to be included by the head nurse. P&T staff (e.g. electrocardiograph
(ECG) technicians) were less likely to be included by lead clinicians and
business managers, whereas the head nurse was least likely to include
managers.
Others, such as radiographers and health care assistants, were likely to
be included by lead clinicians; discharge co-ordinators, plaster technicians
and child-protection nurses were likely to be included by head nurses;
and support services, social workers and housekeeping were likely to be
included by business managers.
Interviewees were asked who makes decisions in the team. They
responded using a five-point response scale ranging from ‘none’ to ‘a very
great deal’. All agreed that doctors, nurses and managers were the most
likely to make decisions in the Emergency Department team. P&T and
ancillary staff were the least likely to make decisions.
Interviewees were asked to what extent staff groups contributed to the
team working. They responded using a five-point response scale ranging
from ‘none’ to ‘a very great deal’. All agreed that doctors and nurses
contributed ‘a lot’ to the Emergency Department team. However, head
nurses and business managers also felt that managers contributed ‘a lot’
to the team whereas lead clinicians felt managers contributed ‘a fair
amount’.
Work characteristics
A variety of work characteristics were examined (such as autonomy and
control, role conflict, leader support and feedback on performance). Only
autonomy and control was found to be related to waiting time in the
in-depth study.
Management style
Interviewees were asked to rate their own management style as either
‘tell’, ‘sell’, ‘consult’ or ‘join’ (Sadler, 1970). The findings are shown in
Figure 3.
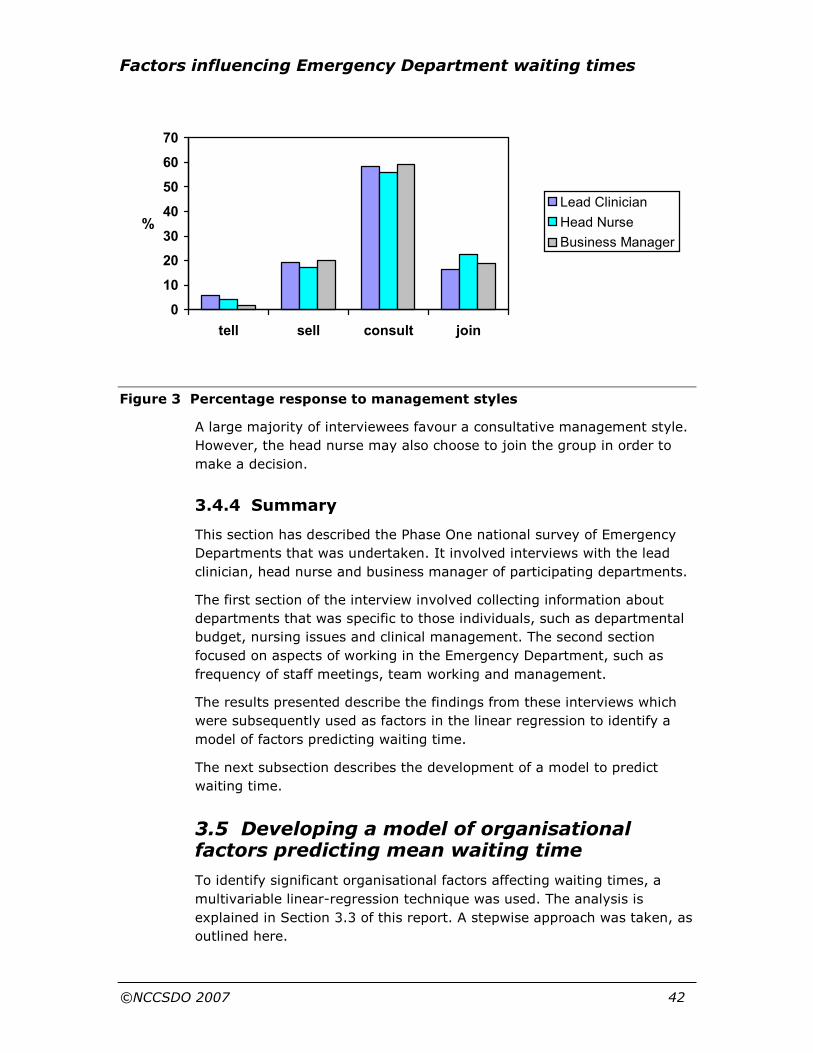
Factors influencing Emergency Department waiting times
©NCCSDO 2007 42
Figure 3 Percentage response to management styles
A large majority of interviewees favour a consultative management style.
However, the head nurse may also choose to join the group in order to
make a decision.
3.4.4 Summary
This section has described the Phase One national survey of Emergency
Departments that was undertaken. It involved interviews with the lead
clinician, head nurse and business manager of participating departments.
The first section of the interview involved collecting information about
departments that was specific to those individuals, such as departmental
budget, nursing issues and clinical management. The second section
focused on aspects of working in the Emergency Department, such as
frequency of staff meetings, team working and management.
The results presented describe the findings from these interviews which
were subsequently used as factors in the linear regression to identify a
model of factors predicting waiting time.
The next subsection describes the development of a model to predict
waiting time.
3.5 Developing a model of organisational factors predicting mean waiting time
To identify significant organisational factors affecting waiting times, a
multivariable linear-regression technique was used. The analysis is
explained in Section 3.3 of this report. A stepwise approach was taken, as
outlined here.
0
10
20
30
40
50
60
70
tell sell consult join
%
Lead Clinician
Head Nurse
Business Manager

Factors influencing Emergency Department waiting times
©NCCSDO 2007 43
Initially, variation in mean waiting time arising from differences in case-
mix was controlled for; these factors accounted for 14.1% of the
variability in mean waiting time.
Second, each variable from the Healthcare Commission data collection
and Phase One of the national survey was regressed separately upon the
residuals from the previous step. The potentially predictive variables
(P<0.1) are shown in Table 1F in Appendix F, and were subsequently
entered into a multivariate linear-regression model. Those variables found
to be significant independent predictors of the residual waiting time are
shown in Table 1F in Appendix F.
These factors were percentage of work hours non-pay spend per 10,000
patients, presence of See and Treat and percentage of nursing hours lost
through sickness. These factors explained a further 33.5% of the
remaining variability in mean waiting time.
Third, key variables from Phase Two of the national survey were then
examined to determine whether they made any further contribution to the
model.
The variables were:
• frequency of staff meetings,
• presence of team working,
• self-reported management style of the interviewee.
These were selected as they were thought to provide a summary
representing the notion of inclusion and participation, and co-operation.
This reflects the organisational ethos of the department and represents
the differences between directive and participative management style.
For the first two variables, responses were potentially available from
three interviewees (lead clinician, head nurse and business manager) in
each department. To determine whether these individuals were consistent
in their views, the intra-class correlation coefficient (ICC; James et al.,
1984) was used. Neither the responses on frequency of staff meetings
(ICC 0.121) nor the presence of team working (ICC 0.005) appeared
consistent across interviewees. Therefore, data from each of the
interviewees were considered separately for these variables. All were
examined for their relation to the mean waiting time (corrected for
department size and case-mix). No significant associations were found for
either variable in relation to waiting time.
Data regarding self-reported management style were collected with four
possible responses, tell, sell, consult or join, as described by Sadler
(1970), reflecting increasingly participative management styles (Figure
3). Few respondents described their management style as tell or sell.
These were therefore combined into one category for the purpose of
analysis. The management style of each group of respondents was then

Factors influencing Emergency Department waiting times
©NCCSDO 2007 44
examined separately for its ability to predict mean waiting time (corrected
for case-mix and department size). Management style was treated as a
categorical variable, with consult being the reference category. The
results are shown in Table 2F in Appendix F.
Management styles of both the lead clinician and head nurse were found
to be potentially predictive.
Finally, management-style variables were examined to determine whether
they could enhance the model described in Table 2F in Appendix F. The
head-nurse management style was not found to be predictive. The final
model is shown in Table 7. This model explains 35.3% of the variation in
mean waiting time. The presence of See and Treat was no longer a
significant contributory factor to the model but was replaced by the
management style of the lead clinician.
Table 7 Final model of factors predictive of mean waiting time
95% confidence interval for B
Unstandardized coefficient, B
Lower
bound
Upper
bound
Significance, P value
Nursing hours lost through sickness (%)
2.67 0.96 4.37 0.00
Non-pay spend per 10,000 patients
0.00 0.00 0.00 0.04
Tell or sell 12.56 2.03 23.09 0.02 Lead-clinician management style
Join −1.67 −14.98 11.63 0.80
The stepwise regression revealed that a substantial proportion of the
variance in waiting times can be explained by the management style of
the lead clinician. If the lead clinician’s style was participative (either
consultative or joining compared to telling or selling) then mean waiting
time was lower (with over 10 minutes’ reduction).
To explore the contribution that leadership style makes to waiting times
further interview data were examined again. Relationships were inspected
for agreement by all parties and congruence of direction of relationships.
Table 3F in Appendix F describes the relationships of the responses from

Factors influencing Emergency Department waiting times
©NCCSDO 2007 45
lead clinician, head nurse and business manager across the sites (n=137)
with study variables.
While the findings described in Table 3F in Appendix F are far from
conclusive, there are strong suggestions that a participative management
style (either consulting or joining) of the lead clinician is associated with:
• inclusivity of such groups as PAMs and ancillary staff in meetings in
the Emergency Department;
• reduced role conflict for doctors, nurses, managers and ancillary staff
in the Emergency Department;
• increased feedback on work performance for doctors, nurses,
administrative staff and managers;
• increased leader support for doctors, nurses, administrative staff and
managers;
• collaboration with other departments within the Trust;
• a more positive view of the morale of staff in the department.
These findings are particularly relevant as they represent the agreement
of the views of three parties (lead clinician, head nurse and business
manager) regarding leadership style and are not self-reported data.
In addition, there is a suggestion in the data that a participative
leadership style of the lead clinician is associated with reduced autonomy
and control for doctors, nurses, administrative staff and managers in the
department. This suggests that these individuals are reducing the level of
autonomy in their own work in the interest of co-operating with others to
reduce waiting times. The realtionship with autonomy and control was
examined in more detail in the in-depth survey in Phase Two of the study.
One-third of the variability in mean waiting time has been accounted for
by this phase of the study. The second phase moves on to look in more
depth at further factors that may not have been explored so far, but are
important when considering mechanisms available to improve
performance.
3.6 Summary
Phase One of this study involved a national survey of Emergency
Departments in England and Wales. One hundred and thirty seven
Emergency Departments consented to participate in this part of the
study.
Data were collected from interviews with the lead clinician, head nurse
and business manager of consenting departments. Altogether, 351
interviews out of a possible 411 (85.4%) were completed. In addition,
further data were collected by obtaining a sample month of routine data
of patient attendances from each Emergency Department. A total of 122
Factors influencing Emergency Department waiting times
©NCCSDO 2007 46
Emergency Departments (89.1%) returned data for analysis. Finally the
Healthcare Comission data (being collected at the same time for the
Acute Hospitals Portfolio) was also submitted for use by the research
team.
Mean waiting time was the dependent variable used. Organisational
factors from the data collected that contributed to mean waiting time
were identified using multivariable linear-regression techniques.
Initially departments’ case-mix and site were controlled for. These factors
were found to contribute to 14.1% of the variability in mean waiting time.
The further factors found to significantly contribute to mean waiting times
were percentage of nursing hours lost to sickness, non-pay spend per
10,000 patients and the management style of the lead clinician. When
taken together these factors contribute to a further 35.3% of the
variation in mean waiting time.
The next section describes the second phase of the national survey. This
in-depth evaulation was undertaken to identify additional factors that
were important in predicting waiting times.

Factors influencing Emergency Department waiting times
©NCCSDO 2007 47
Section 4 Phase Two: in-depth evaluation of Emergency Departments
4.1 Methods
To gain an in-depth understanding of work within Emergency
Departments and identify additional, as-yet-unexplored, factors that may
contribute to the variability in waiting times, an in-depth mixed-methods
study was undertaken.
4.1.1 Selection of sites
Originally, it was intended that sites invited to take part in the in-depth
study would be based upon the findings of the statistical modelling from
data collected. However, significant delays were experienced in obtaining
Research Governance approval. Selection of sites for Phase Two of the
study was therefore based on an interim analysis only utilising the data
collected by the Healthcare Commission up to December 2004. This is
outlined in Appendix G.
Following this analysis, departments were ranked according to their
unstandardised residual waiting time. Of departments that participated in
the Phase One survey, the 10 with the highest and lowest residuals and
the 10 with residuals closest to zero (reflecting departments with waiting
times that were predicted well, under-predicted and over-predicted by the
model) had their characteristics reviewed. From each group of 10
departments, five were invited to participate in the in-depth study. Those
invited were chosen to give a spread of geographical location, size and
case-mix. These 15 departments therefore represent those in which the
model under- or over-predicts waiting time or in which the model fits
well.
Throughout the interim analysis and selection of sites, those researchers
involved in the collection of data for this part of the study were blind to
the performance of each of the departments.
4.1.2 Recruitment
All 15 sites identified by the above process were invited by letter to
participate in further study. Research Governance was sought in all sites.
Eight sites were finally involved in Phase Two of the study. A full
description of the eight sites and a summary of the data collected are
given in Appendix I.

Factors influencing Emergency Department waiting times
©NCCSDO 2007 48
The survey methods used were developed following input from the
academic staff and key stakeholders. The initial data-collection model was
piloted and ran over a 4-day period covering weekdays and weekends
with observations being undertaken both during the day and at night. The
components of this model were as follows:
• interviews with Emergency Department staff and staff from other
areas of acute care;
• tracking of patients through their Emergency Department
attendance;
• structured observations within the Emergency Department;
• ethnographic observations;
• focus groups with Emergency Department staff and staff from
primary and secondary care.
This method was piloted in two sites. The results of the pilot studies
showed that the methods used provided a large amount of very
informative data, but that there was some duplication in the data
gathered. There was little additional information gathered by observation
at night-time and weekends and by patient tracking that was not
gathered by other methods during the weekday activities. The data-
collection methods were therefore revised and subsequently conducted
over a 2-day period. The individual components are discussed separately
below and are summarised in Table 8.
4.1.3 Structured staff interviews
Two different types of structured interview were conducted, focusing on
organisational factors and team working. The schedules used for the
interviews are reproduced in Appendix J.
4.1.4 Organisational-factors interviews
At each site six interviews were conducted, involving staff from within the
Emergency Department, the Trust and primary care services. In addition,
a GP was also interviewed if they were unable to attend a focus group.
The interviews and focus group looked at the specific factors that caused
individuals difficulty in performing their duties in relation to the
Emergency Department.
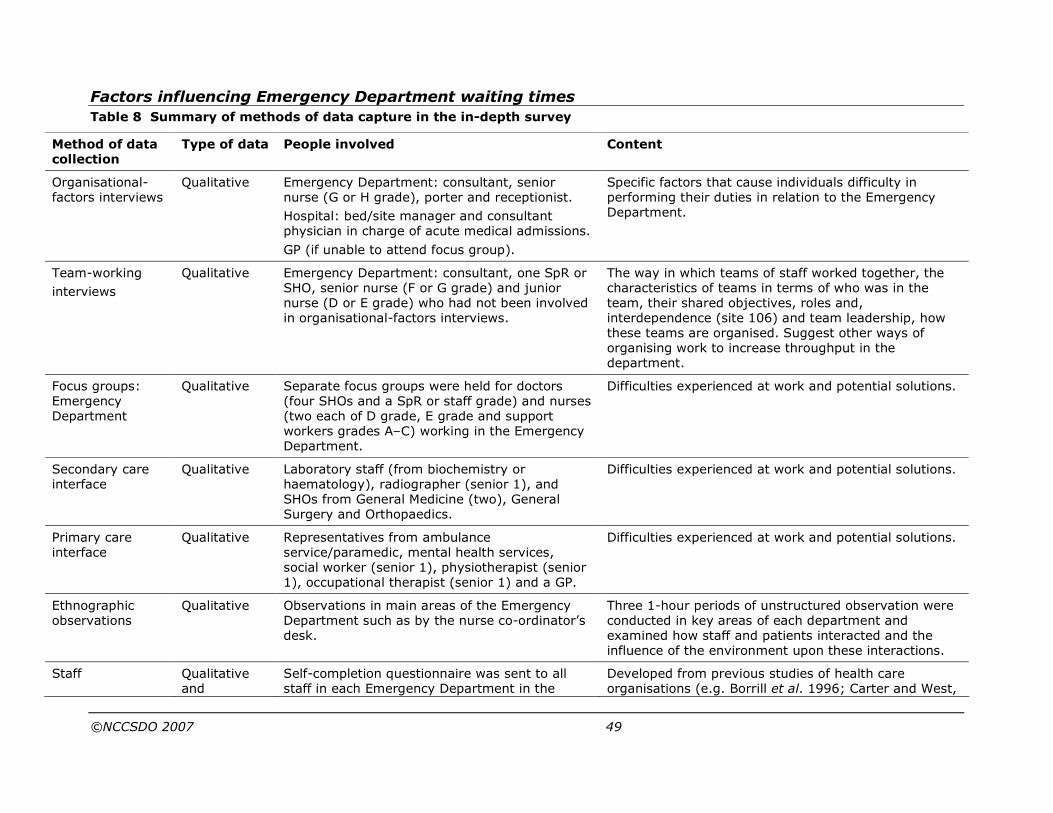
Factors influencing Emergency Department waiting times
©NCCSDO 2007 49
Table 8 Summary of methods of data capture in the in-depth survey
Method of data collection
Type of data People involved Content
Organisational-factors interviews
Qualitative Emergency Department: consultant, senior nurse (G or H grade), porter and receptionist.
Hospital: bed/site manager and consultant physician in charge of acute medical admissions.
GP (if unable to attend focus group).
Specific factors that cause individuals difficulty in performing their duties in relation to the Emergency Department.
Team-working
interviews
Qualitative Emergency Department: consultant, one SpR or SHO, senior nurse (F or G grade) and junior nurse (D or E grade) who had not been involved in organisational-factors interviews.
The way in which teams of staff worked together, the characteristics of teams in terms of who was in the team, their shared objectives, roles and, interdependence (site 106) and team leadership, how these teams are organised. Suggest other ways of organising work to increase throughput in the department.
Focus groups: Emergency Department
Qualitative Separate focus groups were held for doctors (four SHOs and a SpR or staff grade) and nurses (two each of D grade, E grade and support workers grades A–C) working in the Emergency Department.
Difficulties experienced at work and potential solutions.
Secondary care interface
Qualitative Laboratory staff (from biochemistry or haematology), radiographer (senior 1), and SHOs from General Medicine (two), General Surgery and Orthopaedics.
Difficulties experienced at work and potential solutions.
Primary care interface
Qualitative Representatives from ambulance service/paramedic, mental health services, social worker (senior 1), physiotherapist (senior 1), occupational therapist (senior 1) and a GP.
Difficulties experienced at work and potential solutions.
Ethnographic observations
Qualitative Observations in main areas of the Emergency Department such as by the nurse co-ordinator’s desk.
Three 1-hour periods of unstructured observation were conducted in key areas of each department and examined how staff and patients interacted and the influence of the environment upon these interactions.
Staff Qualitative and
Self-completion questionnaire was sent to all staff in each Emergency Department in the
Developed from previous studies of health care organisations (e.g. Borrill et al. 1996; Carter and West,

Factors influencing Emergency Department waiting times
©NCCSDO 2007 50
questionnaire quantitative in-depth study. This included doctors, nurses, receptionists, porters and, in some departments, staff such as play specialists and occupational therapists.
1999; Carter et al., 2001). The questionnaire (see Appendix H ) looked at work characteristics, dimensions of departmental climate, psychological strain, job satisfaction and work grouping, and explored which of these factors were associated with waiting time.
SHO, Senior House Officer; SpR, Specialist Registrar.
Factors influencing Emergency Department waiting times
©NCCSDO 2007 51
4.2 Data analysis
Both qualitative and quantitative data were available for sites
participating in the in-depth study. This rich mix of data provides a
more in-depth understanding of what it is like to work in an
Emergency Department and the everyday issues that staff face.
Qualitative data were collected from focus groups, organisational
factors and team-working interviews, and ethnographic observations.
Six of the eight sites from which data were collected included focus
groups or interviews with five different groups of participants: primary
care, secondary care, doctors, nurses and administrative staff. At the
remaining two sites (sites 207 and 208) it was not possible to collect
data from all groups; therefore, the data relate to a limited sample for
these sites.
Qualitative data were analysed using a template based on an initial
model of factors that prevent patients from leaving the Emergency
Department and those that encourage patients to attend the
Emergency Department (an so-called out and in boundary-spanning
model). Categories in the model were developed from subject-matter
experts and data from one of the sites which formed the basis of a
template. Data from all sites were coded using the template, and
themes that did not fit the model were examined and a final template
was derived (see Table 4F in Appendix F).
Following coding of data from eight sites against this template, themes
were ranked for each site according to the number of different
perspectives provided by the different participant groups that
highlighted that factor (if a factor was mentioned by more than one of
the staff groups this increased the salience of the theme). The themes
were inspected to see in which ways they were the same or different.
The top three themes reported from multiple perspectives were noted
for each site. Finally an independent rater coded data from three sites
using the template to examine inter-rater reliability. Eighty-six per
cent of comments were rated in exactly the same manner by the
independent coder, indicating a high level of inter-rater reliability.
Discrepant items were examined, looking at reasons for different
ratings and the descriptions of the themes were subsequently made
more explicit. Four per cent of comments were rated with minor
differences between sub-categories within a major theme. The other
items (10%) were discussed and a primary code agreed by the two
coders.
On the basis of the content of these themes, with no knowledge of
performance ratings for each department, the sites were ranked in
order of high, medium and low perceived performance. The findings
from these analyses are described in Section 4.3.
Factors influencing Emergency Department waiting times
©NCCSDO 2007 52
4.2.1 Analyses of team-working interviews
An initial template was drawn up using the main themes from the
questions as a guide. Information from four interviews per site was
aggregated using template headings and an overall summary was
produced which described the working methods on each site briefly.
Next the aggregated information was compared across the eight sites
to examine what themes were considered common and what were
considered different.
On the basis of the content and number of themes described by each
department (the more themes described implying greater inclusivity
and proactive behaviours) sites were ranked in order of high, medium
and low perceived performance.
4.2.2 Analyses of questionnaire data
Questionnaire responses were collected from various sites and data
were aggregated at the level of each Emergency Department. When
exploring phenomena at an aggregated level of analysis it is important
to see if there is intra-departmental agreement (suggesting that the
aggregated measure is a meaningful construct). To establish whether
team members share common perceptions the within-group coefficient
(rwg; James et al., 1984) was used. This is a widely used measure of
inter-rater agreement. This index ‘addresses the extent to which
raters make essentially the same ratings’ (Kozlowski and Hattrup,
1992) and a high score (in excess of 0.7) provides justification for
data aggregation.
Descriptive and correlation analyses were undertaken to explore
relationships between work characteristics, departmental climate,
psychological strain, job satisfaction and mean waiting time. Findings
from the questionnaire study will be described in Section 4.3.
4.2.3 Ethnographic residual analysis
To link the findings from the national survey of Emergency
Departments in Phase One of this study with the in-depth evaluation
in Phase Two, a technique called ethnographic residual analysis (ERA)
was employed. A detailed description of this technique is given in
Appendix K. ERA is a variation of extreme-case sampling which is a
well-known approach to combining qualitative and quantitative
methods. In extreme-case sampling, qualitative researchers identify
extreme cases of a phenomenon to explore in order to gain a better
understanding of the phenomenon, for example, using a survey to
highlight extreme cases for qualitative research. The unusual thing
about ERA is that cases with large residuals, rather than cases with
high or low values of an outcome variable, form a sampling base for
the qualitative research. Thus qualitative research is focused on
uncovering unexplained variance from quantitative research; that is,
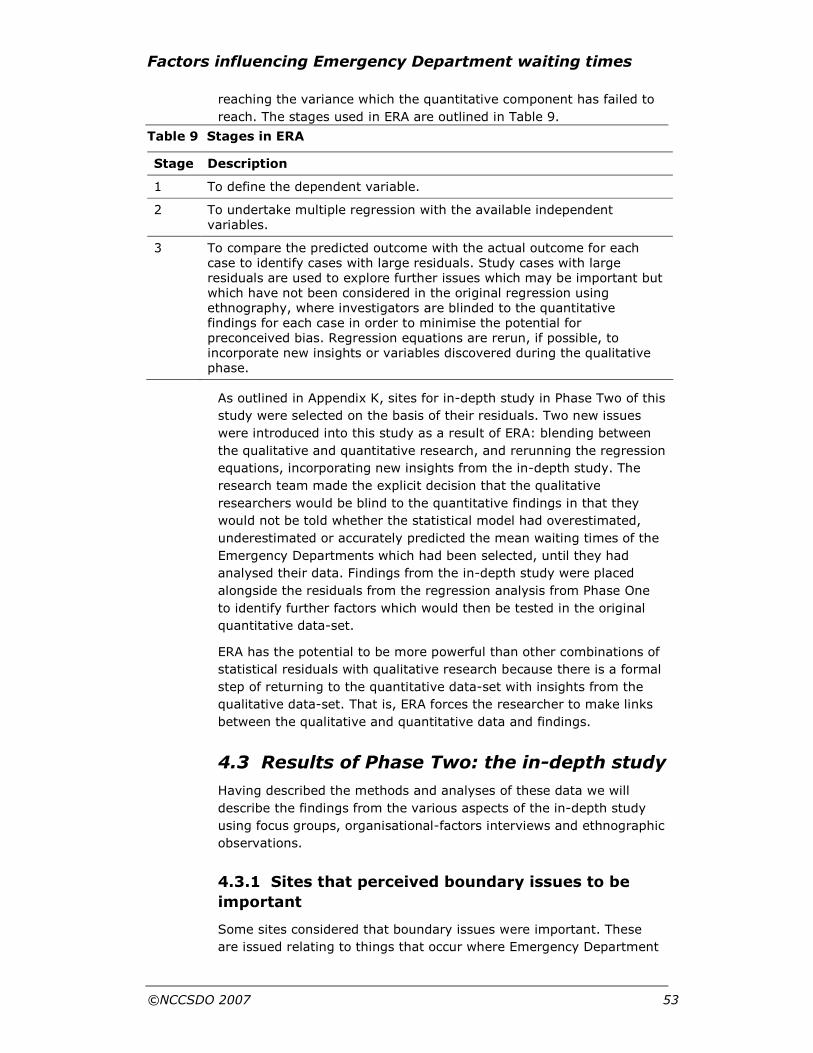
Factors influencing Emergency Department waiting times
©NCCSDO 2007 53
reaching the variance which the quantitative component has failed to
reach. The stages used in ERA are outlined in Table 9.
Table 9 Stages in ERA
Stage Description
1 To define the dependent variable.
2 To undertake multiple regression with the available independent variables.
3 To compare the predicted outcome with the actual outcome for each case to identify cases with large residuals. Study cases with large residuals are used to explore further issues which may be important but which have not been considered in the original regression using ethnography, where investigators are blinded to the quantitative findings for each case in order to minimise the potential for preconceived bias. Regression equations are rerun, if possible, to incorporate new insights or variables discovered during the qualitative phase.
As outlined in Appendix K, sites for in-depth study in Phase Two of this
study were selected on the basis of their residuals. Two new issues
were introduced into this study as a result of ERA: blending between
the qualitative and quantitative research, and rerunning the regression
equations, incorporating new insights from the in-depth study. The
research team made the explicit decision that the qualitative
researchers would be blind to the quantitative findings in that they
would not be told whether the statistical model had overestimated,
underestimated or accurately predicted the mean waiting times of the
Emergency Departments which had been selected, until they had
analysed their data. Findings from the in-depth study were placed
alongside the residuals from the regression analysis from Phase One
to identify further factors which would then be tested in the original
quantitative data-set.
ERA has the potential to be more powerful than other combinations of
statistical residuals with qualitative research because there is a formal
step of returning to the quantitative data-set with insights from the
qualitative data-set. That is, ERA forces the researcher to make links
between the qualitative and quantitative data and findings.
4.3 Results of Phase Two: the in-depth study
Having described the methods and analyses of these data we will
describe the findings from the various aspects of the in-depth study
using focus groups, organisational-factors interviews and ethnographic
observations.
4.3.1 Sites that perceived boundary issues to be
important
Some sites considered that boundary issues were important. These
are issued relating to things that occur where Emergency Department
Factors influencing Emergency Department waiting times
©NCCSDO 2007 54
activities abut those of the hospital or wider community. This subject
featured a combination of local Emergency Department issues with
wider hospital issues and issues related to the provision of other
primary and secondary care services. The presence of these three
major themes from multiple perspectives represents a holistic
approach that considers the management of boundaries between
different levels of service provision and is likely to result in a higher
level of performance. The content of these themes is summarised
here.
Management of Emergency Department
Every site except one mentioned Emergency Department management
in their top three themes. Emergency Department management is
seen as boundary management in the context of themes related to
hospital management, access to primary and secondary care and self-
presentation, and therefore how the department fits into the wider
health care picture.
Hospital management
Hospital Management represents a boundary between other
departments, the Trust and other Trusts or hospitals in the area. In
general, wider issues such as communication with other departments
and the Trust and the lack of a holistic approach to management of
Emergency Department within the Trust were raised, suggesting a
wider perspective considering how the Emergency Department fits into
the wider health community.
Access to primary and secondary care
Access to primary and secondary care was considered by several sites
as they formed a picture of the things that influenced the throughput
of patients seen and subsequently discharged by the Emergency
Department. An element of this theme was the activities of rapid-
response teams in the community that enabled elderly patients to
return to their homes supported by care or be admitted to community
care resources. Mental health support services were another example
of this interface between emergency care and the community. This
theme provides evidence of the consideration of issues as part of the
wider community of health care provision.
Self-presentation
This theme (examining why patients attend Emergency Departments)
can be considered from both the boundary-spanning and non-
boundary-spanning perspectives.
This theme was boundary-spanning when combined with hospital
management and Emergency Department management considering
the reasons why people attend the department unnecessarily.
However, if this theme replaced access to primary and secondary care
Factors influencing Emergency Department waiting times
©NCCSDO 2007 55
services in the top three themes the department was perceived to be
reactive rather than proactive and were placed in the non-boundary-
spanning group as they lacked the recognition that issues related to
primary and secondary care are likely to impact on the number of
people attending the Emergency Department.
4.3.2 Sites that did not perceive boundary-spanning
issues to be important
The non-boundary-spanning perspective was seen when there was a
focus on local issues (management of Emergency Department, bed
management and bed shortages) rather than consideration of wider
hospital issues and the management of margins between different
levels of service provision. This perspective is likely to result in a
poorer level of performance. These themes will now be described.
Emergency Department management
A focus on Emergency Department Management was seen to lack the
perspective of boundary spanning when combined with bed-
management issues. This suggests a focus on day-to-day issues rather
than more strategic consideration of how the Emergency Department
fits into the bigger picture of health care provision.
Bed management and bed shortages
Several sites focused on issues of bed management and shortages.
Commonly this was a key theme, along with Emergency Department
management, that indicates a strong focus on internal affairs rather
than a broader consideration of health care provision. Therefore, sites
where all participant groups mentioned bed management, placing it in
the top three issues reported, were perceived to have non-boundary-
spanning activities and were more likely to have a lower level of
performance.
Hospital management
Most sites, with the exception of one, mentioned hospital management
issues in their top three themes. Failing to mention this was perceived
as a narrow, unicentric approach showing less consideration of
boundaries between other departments, the Trust and other Trusts or
hospitals in areas such as communication.
Using the classification above, where researchers identified that a
boundary-spanning strategy seemed likely to indicate high
performance, and a more narrow non-boundary-spanning perspective
likely to indicate poor performance, departments were allocated into
rank order in three performance categories (poor, medium and high).
Table 10 demonstrates these findings and describes the major
themes. These analyses was undertaken blind to information about
various performance indicators for each Emergency Department.
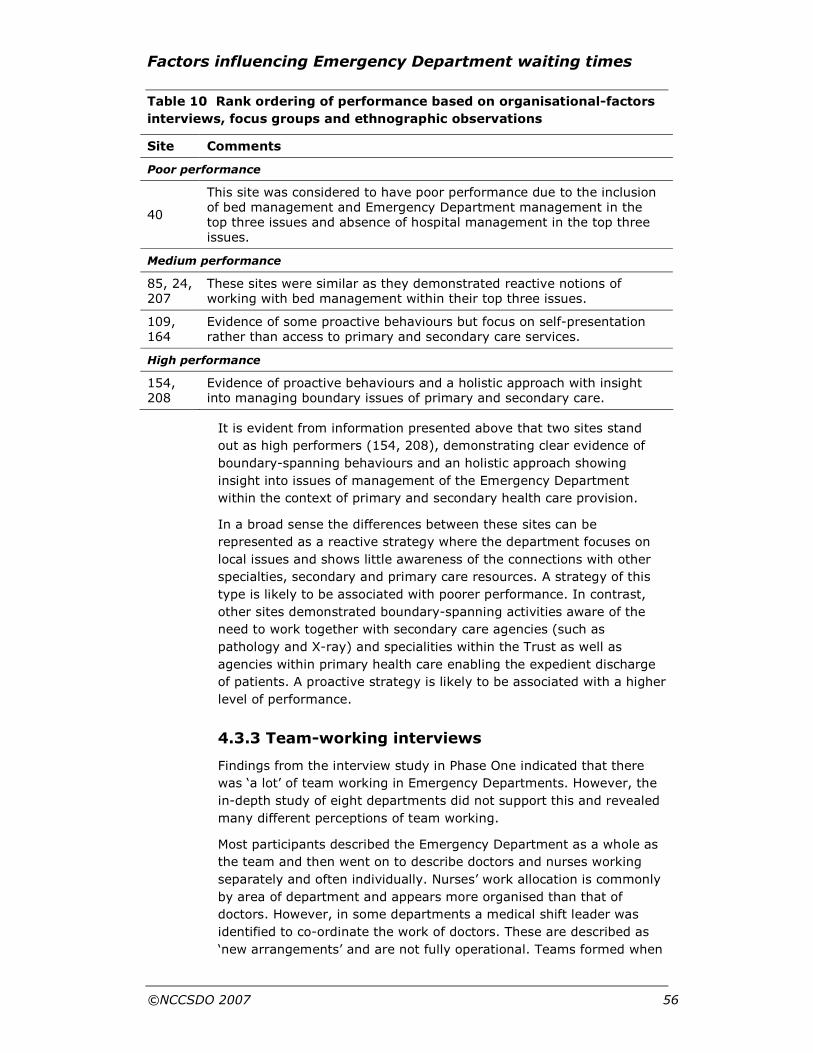
Factors influencing Emergency Department waiting times
©NCCSDO 2007 56
Table 10 Rank ordering of performance based on organisational-factors
interviews, focus groups and ethnographic observations
Site Comments
Poor performance
40
This site was considered to have poor performance due to the inclusion of bed management and Emergency Department management in the top three issues and absence of hospital management in the top three issues.
Medium performance
85, 24, 207
These sites were similar as they demonstrated reactive notions of working with bed management within their top three issues.
109, 164
Evidence of some proactive behaviours but focus on self-presentation rather than access to primary and secondary care services.
High performance
154, 208
Evidence of proactive behaviours and a holistic approach with insight into managing boundary issues of primary and secondary care.
It is evident from information presented above that two sites stand
out as high performers (154, 208), demonstrating clear evidence of
boundary-spanning behaviours and an holistic approach showing
insight into issues of management of the Emergency Department
within the context of primary and secondary health care provision.
In a broad sense the differences between these sites can be
represented as a reactive strategy where the department focuses on
local issues and shows little awareness of the connections with other
specialties, secondary and primary care resources. A strategy of this
type is likely to be associated with poorer performance. In contrast,
other sites demonstrated boundary-spanning activities aware of the
need to work together with secondary care agencies (such as
pathology and X-ray) and specialities within the Trust as well as
agencies within primary health care enabling the expedient discharge
of patients. A proactive strategy is likely to be associated with a higher
level of performance.
4.3.3 Team-working interviews
Findings from the interview study in Phase One indicated that there
was ‘a lot’ of team working in Emergency Departments. However, the
in-depth study of eight departments did not support this and revealed
many different perceptions of team working.
Most participants described the Emergency Department as a whole as
the team and then went on to describe doctors and nurses working
separately and often individually. Nurses’ work allocation is commonly
by area of department and appears more organised than that of
doctors. However, in some departments a medical shift leader was
identified to co-ordinate the work of doctors. These are described as
‘new arrangements’ and are not fully operational. Teams formed when

Factors influencing Emergency Department waiting times
©NCCSDO 2007 57
a major trauma presented in the department and then dispersed when
the episode ceased. Doctors and nurses described different leaders to
whom they are responsible (nurse co-ordinator and lead clinician).
Using the template described in the previous section themes from the
qualitative data analyses were ranked for each site in relation to a
proactive, inclusive style (the more themes indicating focused
working, inclusive and co-operative working strategies and
developmental behaviours are likely to be associated with higher
performance) in three performance categories (poor, medium and
high). Table 5F in Appendix F summarises these findings. The
evidence presented below is based on increasing numbers of themes
appearing in qualitative data ranking the Emergency Departments in
order of performance (the researchers were blind to performance
measures of these departments).
More proactive departments prioritise work, describe specialist areas
where doctors and nurses work together (e.g. See and Treat) and
co-operative leadership strategies between the head nurse and lead
clinician. These leaders empower others to take decisions at a local
level in the department, increasing speed of response. Developmental
activities take place in these departments to increase skill and
competence along with reflexive activities looking back at waiting-time
breaches with the aim of improving performance.
Three sites feature in the high performance category (208, 154 and
109). Two of these sites (208 and 154) had similar ratings from the
organisational-factors interviews, focus groups and ethnographic
observations. One site (109) moved from a previously rated ‘medium’
performance category into high performance as more team-working
themes were included in their coding. However, inspection of these
themes reveals that no leadership themes are included in these data,
raising doubt in their categorisation as a high-performing Emergency
Department.
Analyses of team-working interviews support two sites (154 and 208)
to be considered as high-performing Emergency Departments
confirming the findings from the organisational factors, focus groups
and ethnographic observations in terms of performance.
4.3.4 Findings from the questionnaire study
Responses were received from seven of the eight departments invited
to take part in the questionnaire study (only one response was
received from site 109). Response rates varied across the sites from
18 to 56% (see Table 11). Further details of descriptive data from
each department are given in Appendix H.
Departments described levels of psychological strain (or stress)
ranging from 20% (i.e. 20% of people in the department report levels
of strain over the threshold and likely to be of concern) to 28%
caseness. This case rate is similar for staff at other NHS Trusts (a

Factors influencing Emergency Department waiting times
©NCCSDO 2007 58
sample of over 22 000) where the mean rate was 26.7% (Mullarkey et
al., 1999).
Departments described levels of job satisfaction ranging from 3.8 to 5
measured with a seven-item response. This suggests a fairly wide
range of job satisfaction from slightly dissatisfied (3.5 being between
‘moderately dissatisfied’ and ‘not sure’ and 5 being ‘moderately
satisfied’). Aggregated levels of job satisfaction are described for each
site in Table 11.
Departments describe mean levels of autonomy and control ranging
from 2.90 to 3.37 (using a five-point scale where two represents ‘just
a little’, three a ‘moderate amount’ and four ‘quite a lot’). This value is
difficult to benchmark as other large-scale studies describe autonomy
and control for each staff group (e.g. nurses have a mean score of
3.54, n=3420, and doctors have a mean score of 3.47, n=1068).
These mean scores vary considerably with grade and job role (Haynes
et al., 1999).
Correlation analyses looked at mean waiting time per department
against individual variables aggregated to department level. Two
relationships stand out. Strong relationships were found between
waiting time and psychological strain (r=0.79) and autonomy and
control (r=0.54), indicating that departments with longer waiting
times are more likely to report higher average levels of strain and
higher average levels of autonomy and control over work.
The questionnaire asked participants about the way they worked with
others (in clearly defined teams, less clearly defined teams or alone).
Inspection of Table 11 reveals that a variety of work groupings are
described:
• clearly defined team working, 32–71%;
• less clearly defined team working, 19–54%;
• working alone, 6–27%.
This wide variation of work grouping combined with evidence of
independent working provided by the team-working interviews
describes a confused pattern of working arrangements with the
Emergency Departments studied.
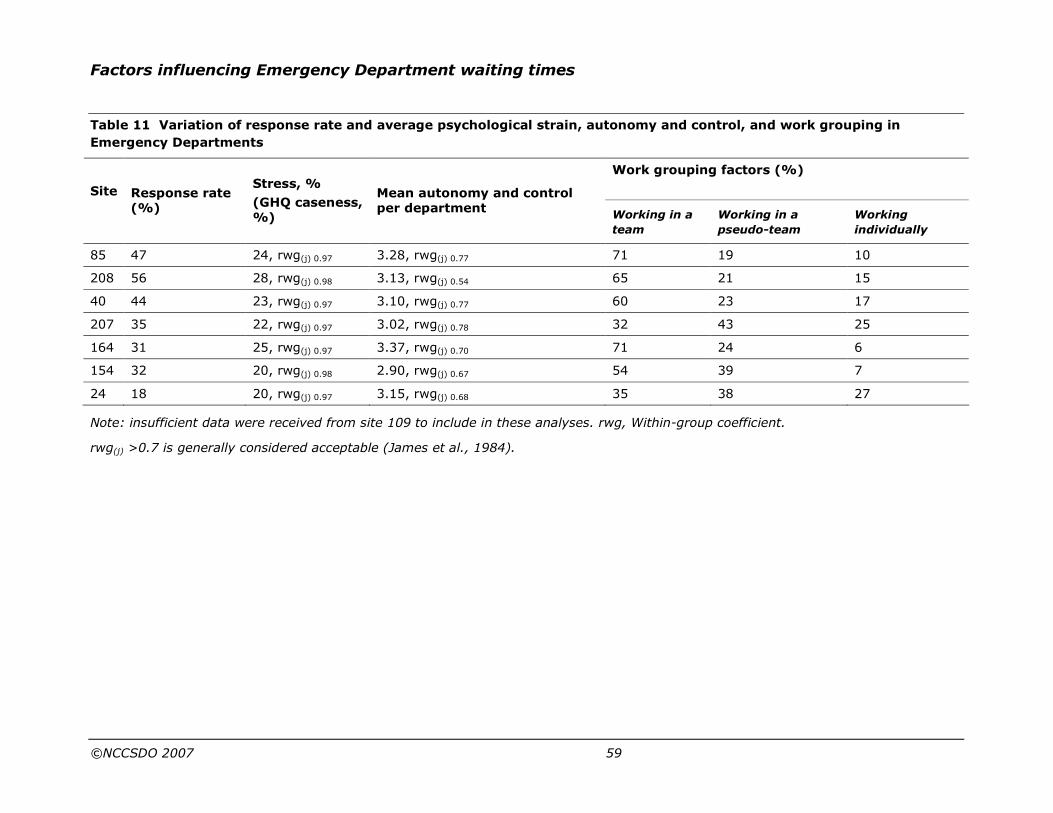
Factors influencing Emergency Department waiting times
©NCCSDO 2007 59
Table 11 Variation of response rate and average psychological strain, autonomy and control, and work grouping in
Emergency Departments
Work grouping factors (%)
Site
Response rate (%)
Stress, %
(GHQ caseness, %)
Mean autonomy and control per department
Working in a
team
Working in a
pseudo-team
Working
individually
85 47 24, rwg(j) 0.97 3.28, rwg(j) 0.77 71 19 10
208 56 28, rwg(j) 0.98 3.13, rwg(j) 0.54 65 21 15
40 44 23, rwg(j) 0.97 3.10, rwg(j) 0.77 60 23 17
207 35 22, rwg(j) 0.97 3.02, rwg(j) 0.78 32 43 25
164 31 25, rwg(j) 0.97 3.37, rwg(j) 0.70 71 24 6
154 32 20, rwg(j) 0.98 2.90, rwg(j) 0.67 54 39 7
24 18 20, rwg(j) 0.97 3.15, rwg(j) 0.68 35 38 27
Note: insufficient data were received from site 109 to include in these analyses. rwg, Within-group coefficient.
rwg(j) >0.7 is generally considered acceptable (James et al., 1984).
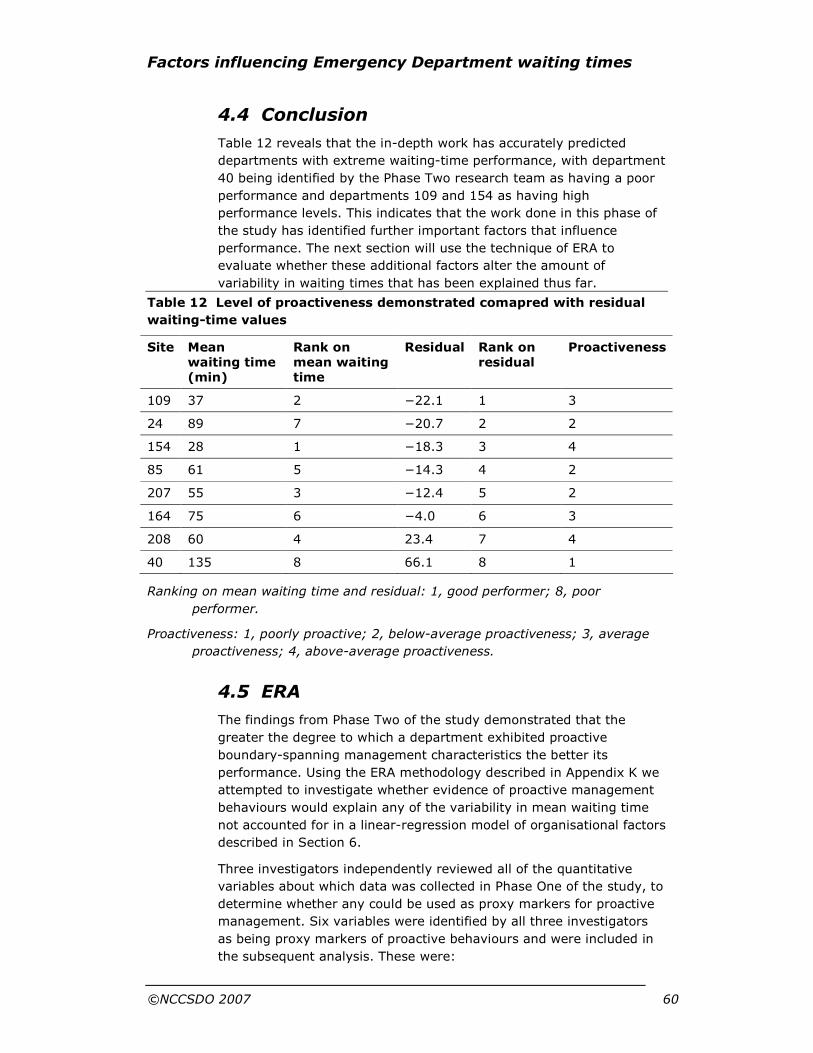
Factors influencing Emergency Department waiting times
©NCCSDO 2007 60
4.4 Conclusion
Table 12 reveals that the in-depth work has accurately predicted
departments with extreme waiting-time performance, with department
40 being identified by the Phase Two research team as having a poor
performance and departments 109 and 154 as having high
performance levels. This indicates that the work done in this phase of
the study has identified further important factors that influence
performance. The next section will use the technique of ERA to
evaluate whether these additional factors alter the amount of
variability in waiting times that has been explained thus far.
Table 12 Level of proactiveness demonstrated comapred with residual
waiting-time values
Site Mean waiting time (min)
Rank on mean waiting time
Residual Rank on residual
Proactiveness
109 37 2 −22.1 1 3
24 89 7 −20.7 2 2
154 28 1 −18.3 3 4
85 61 5 −14.3 4 2
207 55 3 −12.4 5 2
164 75 6 −4.0 6 3
208 60 4 23.4 7 4
40 135 8 66.1 8 1
Ranking on mean waiting time and residual: 1, good performer; 8, poor
performer.
Proactiveness: 1, poorly proactive; 2, below-average proactiveness; 3, average
proactiveness; 4, above-average proactiveness.
4.5 ERA
The findings from Phase Two of the study demonstrated that the
greater the degree to which a department exhibited proactive
boundary-spanning management characteristics the better its
performance. Using the ERA methodology described in Appendix K we
attempted to investigate whether evidence of proactive management
behaviours would explain any of the variability in mean waiting time
not accounted for in a linear-regression model of organisational factors
described in Section 6.
Three investigators independently reviewed all of the quantitative
variables about which data was collected in Phase One of the study, to
determine whether any could be used as proxy markers for proactive
management. Six variables were identified by all three investigators
as being proxy markers of proactive behaviours and were included in
the subsequent analysis. These were:

Factors influencing Emergency Department waiting times
©NCCSDO 2007 61
• the presence of a computer system capable of alerting staff when
patients reach acceptable limits of waiting time;
• contingencies for providing cover in the event of medical staff
sickness absence;
• contingencies for providing cover in the event of nursing staff
sickness absence;
• the presence of incentives for staff to reduce waiting times;
• the presence of an Emergency Department policy to deal with
shortages of inpatient beds;
• the presence of an Emergency Department policy to deal with
exceptionally long waiting times.
Each of these variables was regressed separately upon the
unstandardised residuals obtained from the final model of
organisational factors predicting waiting time described in Section 3.
However, the analysis failed to identify any variable that was
significantly associated with the residual values of the model shown in
Table 7. The analysis is shown in Table 3F in Appendix F.
4.6 Summary
The findings of the in-depth survey of eight Emergency Departments
suggests that high-performing departments are associated with
proactive behaviours that manage boundaries between different
departments within the hospital, other secondary care services and
with primary care services within the broader community.
Team-working interviews indicate a lesser degree of team working
than previously indicated from the Phase One interviews. Doctors and
nurses commonly work separately, only coming to work together at
times of major trauma or emergency. When these episodes cease
team working subsides and independent working resumes. High-
performing departments will tend to be more active when prioritising
work, allocating a doctor and nurse(s) to work together (e.g. See and
Treat). High-performing departments describe co-operative leadership
strategies between the lead clinician and the head nurse, empowering
others to take decisions at a local level. Developmental activities take
place to increase the skill and competence of staff and promote
reflexive practice.
Findings from the questionnaire survey suggest strong relationships
with waiting time and psychological strain and autonomy and control.
This indicates that departments with longer waiting times are more
likely to report higher average levels of strain and higher average
levels of autonomy and control over work. However, as this is a cross-
sectional survey the direction of causality is unclear.
As part of the in-depth analyses of eight departments we asked
participants what mechanisms would improve waiting times. The next
section explores these findings.

Factors influencing Emergency Department waiting times
©NCCSDO 2007 62
Section 5 What mechanisms are available to improve waiting times?
As part of the detailed examination of eight Emergency Departments
we asked participants in interviews and focus groups what activities
they thought would reduce waiting times in their department and what
initiatives were taking place in the Trust to reduce waiting times. The
following description is a summary of participants’ comments of what
activities/actions could reduce waiting times. This list is ordered by the
most common area of discussion.
Following this description and discussion there will be a second,
shorter list of activities taking place in these Trusts.
5.1 Actions or activities to help reduce waiting times
5.1.1 Different ways of working
This was a major area of discussion mentioned by participants from all
eight Emergency Departments.
Several themes were discussed in terms of how work was structured
and allocated, such as having a senior doctor and nurse working
together to increase patient flow (See and Treat, mentioned by three
Trusts); extend See and Treat to out-of-hours working; improve the
management of critically ill and injured patients so that the Emergency
Department continues to work effectively in other areas; and
streaming patients on arrival or use of triage to pick up urgent cases.
Several departments considered extended roles for nurses, such as to
requesting investigations against agreed protocols (three Trusts), and
assessing ambulant patients in waiting room. Several Emergency
Departments considered more structure in the way medical staff
worked, such as consultants to see all patients, and acute physician
working alongside Emergency Department doctors to avoid duplication
of effort. Further, these roles were extended to offering more support
to SHOs, and having a middle-grade doctor co-ordinate SHOs
according to workload. Key to these considerations of how people
worked was for staff to appreciate their own job role and to
understand the job roles of others. Leadership was an important issue.
Participants urged that only one person should have a co-ordinating
role over an Emergency Department, supported by a deputy. To be
effective, it was critical that the co-ordinating role was distinguished
from a caring role.
In terms of process, reflexive practice was advocated to deal with
issues and suggest improvements (two Trusts) along with improving
decision-making processes and developing the Emergency Department
team. In terms of targets a dedicated role to focus on targets or
Factors influencing Emergency Department waiting times
©NCCSDO 2007 63
patient flow was suggested. Staff were urged to be mindful in the use
of resources such as porters (three Trusts; e.g. to co-ordinate their
use across the department and have the patient ready for transfer
with their notes). Certain practices caused problems, such as only
having one designated key-holder for the drugs cupboard.
5.1.2 Reduction of inappropriate use of the
Emergency Department
This was a major area of discussion mentioned by participants from all
eight Emergency Departments.
Primarily discussion was about activities that would educate the public
in the appropriate use of Emergency Department, GP practices, and
emergency services and provide information about the primary care
facilities available in the local area (NHS Direct, walk-in centres and
other out-of-hours services). Constructing barriers to inappropriate
use were mentioned, such as screening calls to Emergency
Department by switchboard and fewer open doors for patients to
wander into the Emergency Department. Payments were suggested as
deterrents for inappropriate use and charges made for assessment of
patients for insurance and compensation claims.
Participants noted that inappropriate use would be reduced if GPs
provided more services in surgeries (such as minor-injury services)
and could refer directly to specialities or for investigations. It was
suggested that public confidence in GPs needs to be improved so that
patients don’t immediately present at an Emergency Department and
that this should be supported by training GPs to triage patients
effectively.
5.1.3 Training, development and maintaining staff
skills
This was a key area of discussion mentioned by participants from all
eight Emergency Departments.
A wide range of staff skills were described. For nurses it was important
to maintain basic nursing skills with regular training and auditing, to
gain a greater understanding of what investigations would be needed
for different conditions, to take blood, administer drugs and to
understand the issues of drug and alcohol abuse. Ward nurses should
be trained in Emergency Department practices to increase co-
operation between the departments.
Junior doctors were urged to appreciate the importance of the waiting
time targets and to have greater confidence to discharge patients or
request fewer investigations. Improvements in the training for junior
doctors were requested (five Trusts), along with a greater provision of
reference sources (one Trust).
Factors influencing Emergency Department waiting times
©NCCSDO 2007 64
More generally doctors and nurses require education and training of
the needs of elderly patients and diseases associated with the elderly,
mental health issues and aggressive patients.
Participants suggested that ambulance staff could be trained to take
blood and work to standard protocols of investigations to be
requested.
It was suggested that porters were upskilled to become generic health
care workers. Reception staff require training to prioritise and route
patients to appropriate areas of Emergency Department. All staff need
to understand how the Emergency Department tracking systems work.
5.1.4 How the Emergency Department fits with
other specialities
This was a major area of concern mentioned by all eight Emergency
Departments.
The aim of this strategic arrangement would be to facilitate so-called
joined-up working between Emergency Departments and medical and
surgical specialities so that the whole Trust owns the problem of
waiting-time targets. Juxtaposition and management of intensive care
units, Clinical Decision Unit and observation wards and Emergency
Department are key to the success of this type of initiative.
5.1.5 Proactive co-ordination with primary care
services
This was a popular area of discussion mentioned by participants from
all eight Emergency Departments.
Improved co-ordination would be achieved by the development and
alignment of out-of-hours services (e.g. with GPs, occupational health
services, dental services), provision of on-site assessment support
(e.g. by psychiatric services) and provision of inter-professional
services (e.g. walk-in centres for the public staffed by GPs and ENPs),
more integrated assessment services (e.g. elderly care, social
services) and development of services provided at home by ENPs.
5.1.6 Proactive co-ordination with secondary care
services
This was another popular area of discussion mentioned by participants
from all eight Emergency Departments.
The discussion mainly focused on increasing secondary care capacity
and flexibility of out-of-hours provision (particularly in radiology,
pharmacy, pathology, occupational therapy, stores), using single-
assessment processes and protocol-defined care, dedicated services
for the elderly, resource sharing across primary care boundaries (e.g.
ENPs working in the community), improved communication between
secondary care providers (e.g. radiology), electronic provision of

Factors influencing Emergency Department waiting times
©NCCSDO 2007 65
investigation results (e.g. pathology) and greater support from
speciality firms making themselves more readily available to see
referred patients. These processes would be assisted greatly by
greater understanding of the role of Emergency Department in the
Trust and increased co-operation with hospital wards. Many of these
activities are critical to the efficient discharge of patients.
5.1.7 Quicker access to information
This was a common theme mentioned by participants from all eight
Emergency Departments.
Quicker and more efficient access of patient information was required
in Emergency Department. Access was mainly to patients’ notes,
although systems that offered other services such as printing labels
for investigations and the provision of electronic X-ray images were
described. One site used electronic records extensively and it was
suggested that they develop a system to share this information more
effectively with other agencies (e.g. GPs and NHS Direct). One Trust
mentioned the need for more information to be provided to patients
about waiting times.
5.1.8 Access to beds and an efficient referral
process
This was a common theme mentioned by participants from all eight
Emergency Departments.
Increased provision of hospital beds, particularly of a short-stay
nature, or social admission supported by a more efficient discharge
process, was advocated. However, it was noted that to make effective
use of increased beds better communication must exist between
Emergency Department and other divisions of the Trust facilitating
more effective collaboration. Breaches due to a protracted time taken
before referral for hospital beds were frequently described and
participants called for the development of protocols to allow
Emergency Department consultants to be able to admit patients (or
develop direct access to an Admissions Unit in the Trust). However,
there were restrictions in several Trusts on medical admissions.
Bed capacity could be better utilised if more staff were available to
facilitate discharge at peak times (e.g. Monday morning), there were
more frequent ward rounds, greater collaboration with ward staff,
more active working with discharge planners, efficient provision of
drugs and easier discharge to community services (e.g. mental health
services) and increased transport provision (particularly out-of-hours
for elderly patients).
It was noted that several Trusts had discharge lounges where patients
waited for drugs and/or discharge letters; it was suggested that these
worked out of hours.
Factors influencing Emergency Department waiting times
©NCCSDO 2007 66
5.1.9 Increase in staff and matching staffing to
patient flow
This was mentioned by participants from all eight Emergency
Departments but was not a major area of discussion.
Most commonly additional staff mentioned were ancillary and
administrative staff. Extra staff required were porters (five Trusts),
reception staff to discharge patients (especially out-of-hours),
administrative staff to monitor breaches out-of-hours, good cleaners,
more pharmacy staff and radiographers, more health care assistants,
more nurses available between 9 pm and 4 am, ENPs out of hours or
in other areas of the Emergency Department (four Trusts), more
senior medical staff on the shop floor (especially out of hours; two
Trusts) and more speciality staff available to admit patients.
5.1.10 Improved efficiency of working practices and
processes within the Trust
These comments came from five Emergency Departments, of which
three were high-performing4 Emergency Departments.
It was suggested that a number of standard practices or protocols
were developed across the Trust regarding requesting a standard set
of investigations for particular conditions. A single point of entry for
pathology and radiology was suggested along with efficient tracking
systems allowing progress of investigations to be known. These
systems would be supported by better direction of information
between departments and standardised recording of clinical
information for investigations.
5.1.11 Effective management
This was mentioned by participants from four Emergency
Departments.
Effective management was considered in terms of staff performance,
control of levels of sickness absence and provision of staff
development. Particular management activities mentioned were the
active matching of staff resources with peak patient flow, clarifying the
roles of senior nurses and separating patient care and co-ordination
activities, and the presence of co-ordinators who worked with people
from outside Emergency Department. Reflexive activities of monitoring
4-hour targets and examining reasons for breaches were advocated.
5.1.12 More physical resources
This was mentioned by participants from four Emergency
Departments.
4 Three trusts were classed as high performers: 109,154 and 208.
Factors influencing Emergency Department waiting times
©NCCSDO 2007 67
Surprisingly little was mentioned under this category. Resources
described were equipment to test alcohol and drug levels, provision of
more space (particularly in the area of the department dealing with
more major cases; one Trust), and better refreshment facilities for
patients.
5.1.13 Discussion at an NHS level regarding funding
between primary and secondary care providers
Mentioned by participants from three Emergency Departments.
Participants urged for activities to promote co-operative, quality-based
ways of working across funding boundaries (e.g. develop protocol-
based care where blood is taken for investigations in the ambulance).
5.1.14 More staff-support services
Only one Trust mentioned the need for Emergency Department nurses
to have stress counselling.
5.1.15 Summary
Thirteen areas of improvement were described by participants of the
study. Principally these covered different ways of working in the
Emergency Department, training and development of staff,
consideration of where the Emergency Department fits in the structure
of the Trust, proactive co-ordination of primary and secondary care
services, quicker access to patient information, increased access to
hospital beds and a more efficient referral process supported by an
increase in Emergency Department staff matched with patient flow.
Participants were also asked to described initiatives that were in place
(or being actively discussed) within their Trusts which aimed to reduce
waiting time. This list is ordered in the same way as the previous one
to allow matching of suggestions to activities.
5.2 Initiatives or activities that are in place to reduce waiting times
5.2.1 Different ways of working
This was the most popular area of comment and several changes in
working practices were noted.
Principally, Emergency Departments had considered who greeted
patients on their arrival and how they were streamed for treatment.
Five Emergency Departments described using a See and Treat service
that is consultant-led, staffed by a nurse and a health care assistant.
In one Emergency Department the receptionist decides who goes to
See and Treat, another used ‘meet and greet’ nurses as patients
entered the department, another used a triage system and another
gave children priority out of hours.

Factors influencing Emergency Department waiting times
©NCCSDO 2007 68
A high-performing Emergency Department described priority
streaming of patients at a ’pit stop‘ facility where patients are seen on
arrival by a senior doctor. Another Trust has a registrar seeing all
patients and a further Emergency Department noted that a consultant
was on the shop floor between 8 am and 9 pm. One Emergency
Department described the practice of having a staff-grade doctor co-
ordinate SHOs according to the department workload. Two Emergency
Departments described having a GP working in the department.
Four Emergency Departments described having ENPs treating minor
injuries. ENPs were also taking histories, examining and requesting
investigations in three Emergency Departments. Two Emergency
Departments described having co-ordinators track patient progress
through the department. A further Emergency Department described a
’nurse navigator‘ role to track patients through the department
effectively (however, this is not a popular role with nurses).
One Emergency Department described the use of protocols to fast-
track cardiac patients and another had developed a walk-in centre that
was co-located with the Emergency Department.
It was noted that such activities (particularly See and Treat) allowed
the minor-injury side of the Emergency Department to continue to run
when there are also a number of sick cases to manage. Further,
reducing waiting time was described as having reduced patient
aggression. However, the downside of these developments is that
there is a greater uptake of Emergency Department services as they
are seen as more efficient than the local GP services. It was also noted
that many of these developments were not available out of hours.
Two Emergency Departments described the process of reflection as to
why breaches occur and taking steps to stop this happening again.
5.2.2 Reduction of inappropriate referral
One high-performing Trust had developed a video playing on
Emergency Department screens showing the type of condition that
should or should not be seen in the Emergency Department. Another
Emergency Department reschedules primary care patients attending at
night by giving them return appointments for the morning.
5.2.3 Training, development and maintaining staff
skills
One Trust described increasing the length of SHO secondment to the
Emergency Department to train junior doctors more effectively and
training staff in Emergency Department in the use of ultrasound. More
support for junior doctors was noted by another Trust with the
employment of more middle-grade staff to supervise. A further Trust
had trained nurses to assess and refer mental health patients.

Factors influencing Emergency Department waiting times
©NCCSDO 2007 69
5.2.4 How the Emergency Department fits with
other specialities
One high-performing Emergency Department was joined with the
medical directorate and acute medical admissions of the Trust. This
means that patients can be referred directly to wards from the
Emergency Department and to out-patients’ clinics. Four other Trusts
have established a Medical Admissions Unit where patients are
transferred after a 3-hour waiting period or a Clinical Decision-making
Unit to stop the 4-hour clock. A further Trust moves patients to wards
to avoid a breach of the 4-hour target.
5.2.5 Proactive co-ordination with primary care
services
High-performing Emergency Departments were associated with the
appointment of a mental health co-ordinator based in the Emergency
Department to improve access to mental health services (out of hours
a named psychiatrist takes calls from the Emergency Department), GP
referrals straight to speciality, on-site assessments by occupational
therapists and physiotherapists, a rapid-response team to assess
elderly patients and facilitate discharge to community beds, provision
of intermediate elderly care in the community, and provision of ENPs
working in the community. Another Trust has a psychiatric liaison post
working with Emergency Department and a further Trust has
developed an intermediate discharge team to speed up hospital
discharge.
Three Trusts have developed a doctors’ drop-in centre (one provides
ambulance transport to the centre) and in another GP care was
provided by a co-operative out of hours. One Trust has developed a
service located next to the Emergency Department where patients are
diverted after 6 pm to see a GP and primary care nurses. Further co-
operation has been achieved with GPs seeing minor-injury patients at
the weekends, GPs having direct access to admission on wards, and a
rapid-response team seeing patients at home reducing the need for
admission (two Trusts). Whereas it was noted these services have
limited capacity they successfully free up the Emergency Department
for major patients.
One Trust had plans for paramedics to work in the community
providing services like NHS Direct and another had employed an
Emergency Care Practitioner to work in the community to reduce the
need for Emergency Department attendance (in association with the
ambulance service).
5.2.6 Proactive co-ordination with secondary care
services
One Emergency Department noted improved relationships with the
local X-ray department. Another described how the Emergency
Department doctor is released quickly from the hospital trauma team.

Factors influencing Emergency Department waiting times
©NCCSDO 2007 70
5.2.7 Quicker access to information
Three Emergency Departments have made progress in this area. Two
high-performing Trusts have removed written records; all notes were
audio-typed and added to the electronic patient record. This provision
enables a database of patient information to be available at See and
Treat and admissions can be highlighted and prioritised. Another Trust
has a plan to integrate a shared IT service between Emergency
Department and X-ray, offering online images in the next 2 years.
Most Trusts provided information to patients about waiting times.
5.2.8 Access to beds and an efficient referral
process
Several Trusts have made strategic plans or appointments to improve
bed congestion and plan effective discharge. One high-performing
Trust has gained funding from the local Primary Care Trust for more
acute beds and short-stay beds. Another Trust has increased its
medical beds. Two other Trusts have developed a short-stay ward, or
a receiving ward where Emergency Department patients are
transferred (another is in discussion about this provision). One Trust
has appointed a bed manager within their directorate (another Trust is
in discussion) who liaises with wards to free up beds. Another Trust
has increased inter-ward and inter-hospital transfers to free up beds.
A further Trust has appointed a consultant acute physician to improve
medical-assessment-unit throughput to ease congestion.
In terms of referral only one Trust mentioned implementing a direct
admission policy from the Emergency Department to medicine and a
second had developed protocols enabling Emergency Department
doctors to admit to surgery and orthopaedic beds.
In order to increase the speed of discharge one Trust has a private
ambulance available (between 12.30 and 7.30 pm) to discharge
patients home, supported by the use of a taxi service for those who do
not need an escort. Discharge lounges were available in three Trusts.
5.2.9 Increase in staff and matching staffing to
patient flow
Two Trusts reported more portering services. Three Trusts reported
employing more doctors (specifically a surgical registrar, and middle-
grade doctors working out of hours), with more doctors available at
weekends. One Trust had a GP mentor available in the Emergency
Department to assist junior doctors in their decision-making.
Two Trusts are planning to employ two new consultants in the
Emergency Department.
One Trust had appointed more physiotherapists and a flow co-
ordinator to track patients. With regard to nursing appointments one
Emergency Department had a cardiac chest-pain nurse to assess
patients with chest pain and another had appointed more ENPs.
Factors influencing Emergency Department waiting times
©NCCSDO 2007 71
5.2.10 Improved efficiency of working practices and
processes within the Trust
No direct comments were made in this area.
5.2.11 Effective management
Two Trusts described active discussion of patient breaches and
planning of solutions (one Trust has a weekly meeting with the Trust’s
Chief Executive to review performance). One Trust described the use
of discharge lounges where patients waited for drugs on discharge;
however this was not available out of hours.
5.2.12 More physical resources
Only one Trust mentioned increasing the number of cubicles available
in the area of the department dealing with more major cases. Other
Emergency Departments described different uses of existing
resources, such as having colour-coded Emergency chairs (and
cubicles) kept only for emergencies, and removing seats from the
nurses’ station, thus reducing staff time in that location.
5.2.13 Discussion at an NHS level regarding funding
between primary and secondary care providers
No direct comments were made in this area.
5.2.14 More support services
No direct comments were made in this area.
5.3 Summary
It has been instructive to examine participants’ suggestions to
improve waiting times and compare these with action within the
Emergency Departments and participating Trusts. The establishment
of waiting-time targets has been associated with changed ways of
working in most Emergency Departments and the greater efficiencies
in bed management, the development of short-stay beds or holding
areas within Trusts where patients await the outcome of examinations
or investigations. Our comparison would suggest that high-performing
Emergency Departments owe their success to improved strategic
positioning of the Emergency Department within the Trust structure,
improved access to patient information and greater co-ordination of
services with primary care providers easing discharge.
Our comparison shows that with the limited examples of developments
in medical training there has been little or no investment in the
development of leadership, effective management and training and
development of staff in Emergency Departments. These are important
areas that should be addressed and a role of this report is to highlight
this situation.

Factors influencing Emergency Department waiting times
©NCCSDO 2007 72
Given that lower waiting times (and high performance of Emergency
Departments) are associated with a participative management style of
the lead clinician it is unsurprising that improvements in strategic
positioning within the Trust and strategic alliances within primary care
have been demonstrated. A participative leader including a wide group
of staff within these discussions, viewing the service of the Emergency
Department proactively and broadly, within the community context
and an appreciation of others’ roles will have helped these
developments. Clearly these are key areas of management
development to be considered along with the effective co-ordination of
the Emergency Department.
It is clear that a number of initiatives are being tried. What is not
clear, is the persistence with which these initiatives are pursued, or
whether they are tried and dropped rapidly if no immediate gain is
made. Many of the initiatives suggested and tried were not shown
from our modelling process to be significant contributory factors to the
variance in waiting times. However, some of them may reflect
proactive leadership styles that we have endorsed. Further research is
required in many of these areas to identify causal relationships with
waiting times.
The next section will discuss the findings from the study.

Factors influencing Emergency Department waiting times
©NCCSDO 2007 73
Section 6 Discussion
6.1 Summary and introduction
This study is concerned with Emergency Departments and the factors
that influence the time patients wait to be seen by an appropriate
decision-maker. It is not surprising to see the wide variation in
demographics of the Emergency Departments in the study. One
hundred and thirty seven departments from 112 Acute Trusts,
representing 65% of the major Emergency Departments in England
and Wales, participated in the first phase of the study. The
participating departments covered a wide geographical area, from
large teaching-hospital Emergency Departments in urban settings to
smaller departments in more rural district general hospitals. It is
therefore likely that the participating departments are representative
of all Emergency Departments in England and Wales.
Even though only Type I departments were included in this study, it is
clear that there are no standard components of a major Emergency
Department in England and Wales, beyond those stated. In our study
we found that attendances varied between 15,824 to 132,750 per
annum (mean 62,614 attendances per annum, SD ±20,791). The
percentage of cases arriving by ambulance ranged from 1.2 to 38.6%
(mean 24.8%, SD ±6.4). These variations have implications both for
trying to standardise performance, and also in predicting performance.
Given the wide variation, perhaps a standard measure of performance
is inappropriate as the variability between Emergency Departments
should be adjusted for prior to making any comparison. Equally, the
development of a model of factors that predicts performance may be
difficult without making certain adjustments. With this in mind, the
approach taken to analysing the data we collected was a stepwise one
to enable factors such as case-mix and size to be accounted for prior
to examining the contribution that other organisational factors make.
A quantity of data has been collected from the Healthcare
Commission, an 11-year study of changes in waiting times at a major
teaching hospital and a large-scale interview study of lead clinicians,
head nurses and business managers in 137 departments in England
and Wales. The findings of these studies tell us that after accounting
for case-mix and size variables the amount of time lost to nursing
sickness, along with the non-pay spend of the department and the
management style of the lead clinician account for over a third of the
variability in mean waiting time between departments.
In addition to this, in-depth study of eight Emergency Departments
further identified boundary-spanning proactive management
behaviours, psychological strain, staff autonomy and control issues to
be important in influencing performance. However, with all these
factors, the direction of causality is unclear. Our findings will be
Factors influencing Emergency Department waiting times
©NCCSDO 2007 74
discussed in more depth in this section. We will then go on to discuss
what mechanisms are available to reduce waiting times.
6.2 Justification for mean waiting time as the dependent variable
The measure of waiting time under investigation was the interval from
the first recorded time of arrival in the Emergency Department to the
time recorded when the patient sees a DMC. While being aware that
there are many different measures of waiting time referred to, such as
‘total department time’, ‘trolley time’ and ‘time to admission’, it was
felt that the time most under the influence of organisational factors
within the Emergency Department is the time taken to see a DMC.
Other times measured are heavily influenced by the wider hospital and
community setting, such as number and availability of acute beds,
discharge rates from acute beds and response of other specialties to
Emergency Department patients. Investigation of these additional
factors in addition to ‘time to see a DMC’ was beyond the time and
resources allocated for this study. Waiting times, defined as the time
from arrival to being seen by a DMC, have never formed a
performance target for Emergency Departments in England and Wales
(unlike the present 4-hour imposed target). They do however have a
number of characteristics that make them useful in this respect.
Waiting times in Emergency Departments have been shown to be a
key determinant of patient satisfaction (Trout et al., 2000; Taylor and
Benger, 2004). As stated in the Audit Commission report patients
would most like to change the length of time they wait in Emergency
Departments. The measure chosen for the study therefore was
thought to be the most patient-focused one. In addition, the report
also stated that there was a tendency for departments with long
waiting times to see a DMC also to have long times for admission to a
hospital bed (Audit Commission, 2001).
Waiting time is also a useful measure of the process of care within the
Emergency Department, although measuring only part of the patient
journey. Waiting time has also been shown to be related to other
measures of performance, such as the proportion of patients who
leave prior to seeing a DMC (Mohsin et al., 1998; Kyriacou et al.,
1999).
Recording waiting time is relatively simple, requiring only the
recording of time of arrival and time seen by a DMC, the former being
done routinely on arrival of patients. Waiting time therefore appears to
be a useful measure of Emergency Department performance, being
meaningful to both patients and clinicians.
The Healthcare Commission had not previously collected waiting time
as a measure of performance, preferring to collect data on the
‘proportion of patients seen within 1 hour’. However, negotiations prior
to the 2004 data collection enabled this additional information to be

Factors influencing Emergency Department waiting times
©NCCSDO 2007 75
collected for both the Healthcare Commission and the purposes of this
study.
6.3 Emergency Department data quality
6.3.1 Reasons unrelated to patient care and flows
No Emergency Department measures true waiting time (the time
when the patient walks through the door to the time of being seen by
a DMC). The commonest measure will be the time of arrival (as
measured by registration) and time seen by a DMC. Obviously if triage
takes place before registration then the triage waiting time and triage
time will not be counted in the waiting time. Previous studies
(Edhouse and Wardrope, 1996) show that triage after registration
added an average of 15 minutes to waiting times. Problems may also
depend on how a department treats ‘time not known’ and ‘did not
wait’. There is evidence from the data abstracted from Emergency
Department IT systems that waiting time cannot be calculated for up
to 16% of patient episodes. It would appear that patients whose
waiting time cannot be calculated are older and more likely to be
female, arrive by ambulance and be admitted to hospital. A possible
explanation might be that in those patients who are more unwell,
requiring immediate treatment upon arrival in the Emergency
Department, priority is given to their clinical care and errors or
omissions therefore arise in the recording of administrative data.
Alternatively, the episodes with missing waiting-time data may
represent patients who have been referred directly to an inpatient
speciality and thus do not have the time seen recorded by the doctor
who assesses them. These explanations are purely speculative as
there is no evidence from the data collected to support any particular
explanation.
Data quality must be a central concern. It is impossible that an
Emergency Department can see 100% of patients in 1 hour. Equally it
is almost impossible that an Emergency Department is taking longer
than 1 hour to see all its patients (or it would be breaking all the rules
of dealing with resuscitation cases). Figures reporting data in this way
are obviously errors. Any study of variation in Emergency Department
waits must take data quality into account.
6.3.2 Consistency of measuring waiting times
As previously noted, whether patients are seen in triage first or
booked in by reception first could have a major effect on reported
waiting times. This may also be an important factor in quality of care.
Extending triage time to include giving analgesia and ordering
investigations, as well as carrying out triage assessment, was, until
most recently, considered good practice. However, if booking in occurs
before triage, the good practice will apparently lead to longer waiting
times.

Factors influencing Emergency Department waiting times
©NCCSDO 2007 76
For this study, we decided to use the data collected by the Healthcare
Commission on mean waiting times. We validated this data with our
own sample month’s data collected independently in 122 of the
Emergency Departments participating in the study. When compared,
we found little difference between the Healthcare Commission data
and the data submitted for the study, indicating that Emergency
Departments were not manipulating data prior to submission to the
Healthcare Commission, and that this measure was probably robust
enough to be used as our main outcome variable. In six cases,
Healthcare Commission waiting-time data was not available for use,
and here we substituted our waiting-time measure from the sample
data collected for the study.
The reliability in the times recorded due to missing or invalid data, but
also due to the points in the patient journey times, make
interpretation of waiting time and other time data difficult. Research
findings should therefore be treated with some caution. A standard
approach to recording times nationally would be ideal, but probably
unrealistic. In addition, making international comparisons would be
even more fraught with complications. Perhaps the most we can hope
for is awareness of the possible effects that the quality of routinely
collected data can have on this type of study. In the longer term, data
quality may be improved as IT systems improve and staff become
more familiar and aware of the importance of good-quality data.
6.4 Factors influencing waiting times
6.4.1 Case-mix and size
Previously published literature highlights a number of factors that
have been shown to be related to waiting time, although in many
studies these have been assessed in isolation and must therefore be
interpreted with some caution. This study has identified case-mix and
department size as primary factors associated with waiting times. This
supports the work and recommendations of Graff et al. (1993) and
Tham et al. (1995). However, what these studies were unable to do is
to differentiate whether these factors are more or less important than
the way individuals work together or manage across health care
boundaries. By using a stepwise analytical technique we were able to
explain that a significant amount of the variance in waiting time across
departments is accounted for by factors of non-pay spend, time lost to
nursing sickness and management style of the lead clinician. This
contributes new knowledge to the field of emergency medicine.
A number of characteristics of the Emergency Department and the
hospital in which it is based, such as increasing department size (Audit
Commission, 2001), being a teaching hospital (Lambe et al., 2003)
and geographical location (Audit Commission, 2001), have previously
been shown to be associated with increased waiting times. These
studies provide important evidence that Emergency Department
performance is influenced by a number of external factors and that

Factors influencing Emergency Department waiting times
©NCCSDO 2007 77
such influences should be taken into account when comparing the
effect of factors within the department upon performance. Waiting
times have also been shown to be longer for certain socio-economic
groups (Mohsin et al., 1998) and in Emergency Departments serving
poorer neighbourhoods (Lambe et al., 2003). It has been
demonstrated that patients with the least-serious illnesses wait
longest to be seen (Saunders, 1987). Two studies have demonstrated
that different clinical presentations require differing durations of input
from clinicians (sites 289 and 206). Although neither study examined
the impact of case-mix upon waiting time, they offer support to the
logical assumption that waiting time must in part be determined by
case-mix.
Analysis of changes in performance of a large urban Emergency
Department described in Appendix B showed a progressive increase in
waiting time over time. The factors most adversely affecting this
include time, with a year on year deterioration experienced. This is
likely to be because of changes seen in relation to case-mix of patients
seen. Proportionately more older people and major cases present to
the Emergency Department. These cases are more resource-intensive.
Finding ways of dealing with these cases more effectively using the
whole urgent-care system may provide some answers. There are
examples of where this is happening with the introduction of more
community-based services aimed at taking urgent care to the patient.
Emergency Care Practitioners now provide emergency responses for
patients with more minor conditions and community-support teams for
chronic conditions try to prevent the need for hospital attendance
among certain groups of patients.
6.4.2 Emergency Department Staff
Re-analysis of data collected by the Audit Commission in 2000 has
given some insight into factors that might be responsible for variations
in Emergency Department performance. When differences in
department size and case-mix are taken into account, the number of
nurses on grades A–C and the percentage of qualified nurses who are
grade G or above were found to be predictive of the percentage of
patients seen within 1 hour of arrival. However, this analysis should be
interpreted cautiously as over 15% of the departments included did
not report data for this particular performance measure. Chinnis and
White (1999) examined the dominant beliefs within Emergency
Departments, concluding that more nurses and fewer ancillary
providers is believed to equate to better care. Interestingly, the data
created from Phase One of our study did not support this finding as
being a significant contributor to performance.
Our own study identified the amount of time lost to nursing sickness
to be an issue adversely affecting waiting times. Departments with a
higher proportion of nursing time lost to sickness had a higher mean
waiting time. When investigating the issue of staff sickness, it is
important to look at the broader picture of both nursing and medical

Factors influencing Emergency Department waiting times
©NCCSDO 2007 78
staff, how they work together, and the context of management and
leadership styles within the department. It may be obvious that losing
staff to sickness means that departments operate on inadequate
numbers of staff, inappropriate staff ratios or staff who may be
drafted in from agencies or other areas of the hospital who are
therefore unfamiliar with working practices. Inevitably this may lead to
performance deteriorating. Several studies have looked at staff
sickness absence in the NHS (e.g. McKevitt et al., 1997; Hardy et al.,
2003), finding anomalies in sickness absence data recording (Hardy et
al., 2003) and inconsistent findings in relation to medical staff
(McKevitt et al., 1997). Clear relationships were found between
psychological health (using the GHQ-12; Goldberg, 1972) and sickness
absence of nurses and other health care staff with the exception of
doctors. The authors conclude that doctors may avoid absence by
‘working through’ illness, but that this behaviour many have a
detrimental effect on their performance at work.
Hardy and her colleagues (2003) carried out three studies in the NHS
looking at psychological health and performance. Two out of three
studies demonstrated a relationship between psychological health and
performance, suggesting that staff with poorer psychological health
report worse performance (self- and externally rated) than staff with
good psychological health. This relationship held true in all the studies
for nurses but not for managers. Doctors were not included in these
studies.
6.4.3 Emergency Department facilities
Whereas one might assume that the facilities available in an
Emergency Department might influence its performance, only a limited
number of studies have examined this. The availability of beds in an
Emergency Department has been shown to be associated with reduced
waiting time (Kyriacou et al., 1999; Liu et al., 2003). Our study
provides evidence that the non-pay spend of a department is
negatively associated with waiting times. In short, spending less
money on department facilities is associated with reduced waiting
times. This supports the work of Miró and colleagues (2003). It may
be that our findings reflect the culture of a department. They may
either spend less because they have planned their practice to apply
managed care protocols which are more prescriptive in the number
and types of investigations and treatments ordered for certain
presenting clinical conditions. Alternatively, they may have a general
philosophy that does not encourage ‘staying and playing’ with
patients, rather, ‘triage and refer’ to the appropriate facility. With
either of these scenarios, it is possible to see how using fewer facilities
and thereby performing fewer investigations and interventions within
the department could lead to shorter waiting times overall. However,
further work here is required to investigate this relationship and its
impact on clinical outcome.
Factors influencing Emergency Department waiting times
©NCCSDO 2007 79
6.4.4 Team working and working practices
To examine the way people work together specialist team-working
interviews revealed less team working than had been expected from
the Phase One interview survey when ‘a lot’ of team working was
described. The predominant theme was of individual working that was
separate for doctors and nurses punctuated with a number of people
coming together to form a team to cope with a specific emergency
event (such as a patient having a cardiac arrest). Once the event was
completed, staff returned to individual working. This describes a high
level of autonomy and control in the way individuals work that may be
associated with longer waiting times. In addition, differing lines of
leadership and control are described for doctors and nurses,
suggesting difficulties in co-ordination of staff.
Qualitative examination of team working indicated that higher-
performing departments are more proactive in that they prioritise
work and describe specialist areas where doctors and nurses work
together (e.g. See and Treat). It may be that dyadic working between
a doctor and nurse may be more beneficial to complete a patient
episode. If we take, for example, the patient who has a fracture and
abdominal pains on presentation. An ENP can only manage the
fracture and must wait for a doctor to decide on the management or
investigation of the abdominal pain. If these two individuals worked
together and saw this patient simultaneously the patient episode is
likely to be much shorter and more effective. See and Treat and so-
called Greet and Treat services that are offered by a doctor and nurse
in order to prioritise a patient’s path though the Emergency
Department are likely to be more effective than doctors and nurses
working separately. This finding is supported by a previous study of
Browne and colleagues (2000) who describe a model of doctors and
nurses working in small teams that reduced waiting times. Given the
nature of independent working in Emergency Departments a pairing
arrangement of a doctor and nurse would seem more practical than a
team.
Higher-performing Emergency Departments not only describe
incidences of doctors and nurses working together but illustrate co-
operative leadership strategies between the head nurse and lead
consultant. These strategies are likely to increase the number of joint-
working practices and these leaders empower others to take decisions
at a local level in the department, increasing speed of response and
local accountability. Our study demonstrates that in association with
co-operative leadership strategies developmental activities also take
place in these departments to increase skill and competence along
with reflexive activities looking back at waiting-time breaches with the
aim to improve performance.

Factors influencing Emergency Department waiting times
©NCCSDO 2007 80
6.4.5 Psychological strain and autonomy and
control
A questionnaire survey of seven Emergency Departments as part of
the in-depth study revealed strong relationships between waiting time
and stress (or more correctly described as psychological strain
measured by the GHQ-12; Goldberg, 1972) and autonomy and
control, indicating that departments with longer waiting times are
more likely to report higher-than-average levels of strain and higher-
than-average levels of autonomy and control over work.
The GHQ is a valid (Bacon, 2004) and reliable (Browne et al., 2000)
measure of psychological strain supported by a large amount of
normative data from health care populations (Chinnis and White,
1999). The GHQ examines the ability of individuals to carry out their
‘healthy’ functioning as well as cope with new distressing phenomena
(VanRooyen et al., 1999). The relationship between psychological
strain and waiting time is logical and understandable. Individuals who
are experiencing high levels of strain are less able to make decisions
and prioritise their work. Interestingly, lead clinicians with a
participative management style are more positive about the morale in
their departments, suggesting that they may be aware that their style
and subsequent activities are likely to influence levels of strain.
Activities such as providing feedback on performance, offering leader
support and guidance, clarifying roles and reducing role conflict in the
workplace are all activities likely to reduce levels of strain (Lazarus
and Folkman, 1984; Borrill et al. 1996, 1998b).
Initially, the finding that autonomy and control is associated with
longer waiting times is puzzling. Freedom, independence and
discretion in the scheduling and determining of procedures used in
carrying out work are associated with decreased mental strain (Payne,
1999). The measure of autonomy and control is based on that of
Method Control (Carter and West, 1999) and has been used with
manufacturing, administrative, managerial (Borrill et al., 1998a) and
health care samples (e.g. Borrill et al. 1996, 1998b). This work
suggests that the greater autonomy and control an individual
experiences the better they can cope with work demands. However,
working with one’s immediate superior can be a medium through
which employees experience autonomy and gain advice and support to
clarify roles and determine appropriate behaviour (Carter and West,
1999). The finding that a participative management style is associated
with reduced autonomy and control with some staff groups (and
increased autonomy and control for others) suggests that a
participative manager is able to encourage autonomous individuals to
reduce their autonomy (and enable others increase their autonomy)
while working together with others to achieve broader performance
goals.

Factors influencing Emergency Department waiting times
©NCCSDO 2007 81
6.4.6 Mechanisms available to improve waiting
times
Comparing the ‘wish list‘ of activities that could reduce waiting times
with those activities that have been implemented is useful. Many
Emergency Departments have changed the way they greet and assess
patients with senior medical staff leading this process. Extended roles
for nurses have been developed and junior doctors have a greater
degree of supervision and instruction in some Trusts. However, there
were no comments on developments regarding overall leadership in
Emergency Department. Our modelling found that changing working
practices had no effect on improving waiting times, but previous
studies have shown some effect on waiting times for higher-acuity
patients seen by an experienced Emergency Department doctor
usually as part of a team (Subash et al., 2004; Choi et al., 2006).
However, further research is needed in this area to identify the most
appropriate way to deploy staff, especially experienced staff, who are
a valuable resource.
Whereas inappropriate referral to the Emergency Department was a
large source of comment, few activities had addressed this situation.
It may be the case that alternative methods of service delivery had
not been tested because there are few viable alternatives currently to
Emergency Departments. At present, the Department of Health
discussion document Direction of Travel for Urgent Care (Department
of Health, 2006) states that people want more responsive services
that avoid duplication of information. The drive is to develop more
community-based services that are faster and more convenient than
the Emergency Department. However, as yet, these services are
patchy. Further research is needed to evaluate the effectiveness of
such services before widespread development. It is interesting to note
that there have been considerable efforts to co-ordinate the activities
of Emergency Department and primary care and community services.
Much of this activity is associated with high-performing Emergency
Departments, suggesting that these are valuable activities to reduce
waiting times. Principally these activities provide rapid assessment of
elderly and mental health patients in the Emergency Department,
facilitating more immediate discharge or move to intermediate
facilities in the community.
Several activities had taken place at a strategic level to reposition
Emergency Departments within Trusts, with one high-performing
department joining the medical directorate facilitating medical
admissions. Several other Trusts had developed holding areas for
patients while they are being assessed (e.g. Medical Admissions Units,
Clinical Decision Units). However, little activity has reflected the co-
ordination of Emergency Department and secondary care services. The
lack of joined-up working may reflect the conflicts of interest that
other specialties have in addressing the emergency-medicine waiting-
time target at the expense of their own specialty target. It seems hard
therefore to achieve a corporate ownership of waiting times. Although,
Factors influencing Emergency Department waiting times
©NCCSDO 2007 82
during Phase One of our national survey, 58.2% of departments
(n=64) reported being in directorates with other specialties, the type
of specialty that emergency medicine is paired with may be the key.
Simply including the Emergency Department within a directorate
without careful thought as to which specialties already exist there may
be insufficient. It seems clear that to develop a corporate ownership of
waiting times, meaningful inter-specialty relationships need to
develop; so, for example, a directorate containing emergency
medicine and acute medicine may be more fruitful in tackling some of
the boundary issues that exist than a directorate containing
emergency medicine and orthopaedics.
In terms of quicker and more efficient access to patient information
the development of electronic services may be effective in reducing
waiting times, with two high-performing Emergency Departments
having removed written records. Many departments cited the need for
improved access to diagnostic facilities 24 hours a day and 7 days a
week. It must be realised that emergency medicine is not a 9 am–5
pm specialty and support services need to be configured to meet the
demand out of hours. However, this is more expensive and requires
staff prepared to work such unsociable hours.
There have been considerable developments in access to beds, bed
management, efficiencies in referral processes and discharge, either
gaining funding internally to the Trust, or, as in the case of one high-
performing Emergency Department, gaining funds from the Primary
Care Trust. However, only two Trusts mentioned implementing a direct
referral process.
In terms of increasing staff to match patient flows there was little
evidence of a matching process. In several Trusts, more senior
medical staff had been employed and in one Trust more ENPs had
been employed. Two Trusts reported an increase in portering services.
Our re-analysis of the Audit Commission data indicated that the
proportion of nurses at a lower grade improved waiting times. Our
own modelling process did not find this, but did find that nursing
sickness is an important factor. It seems clear that attention needs to
be given to addressing what is the most appropriate mix of staff and
maintaining a healthy workforce.
In terms of improving efficiency of working practices within the Trust
there were some examples of protocol-led practice but these were
few. However, our model indicated that non-pay spend may be a
factor in improving waiting times. The less spent, the better for
waiting times. It may be the case that a more protocol-led service is
more cost-effective and time-efficient. Further research is required to
explore this hypothesis.
An active area of discussion had been more effective management of
Emergency Department. While reflexive practices with regard to
waiting-time targets were described there were no initiatives
describing management development, or the effective management of
sickness absence or leadership.

Factors influencing Emergency Department waiting times
©NCCSDO 2007 83
Finally, there were few activities regarding increasing physical
resources although more effective use of current resources was
described. There were no activities with regard to initiating funding
discussion or developing support services for staff.
6.4.7 How to develop participative leadership
An obvious recommendation from this study is to develop proactive
and participative leadership skills with emergency-medicine lead
clinicians, or another nominated manager in this field. It is apparent
from this study that some lead clinicians are ably operating in this
style already. However, it is clear that many are not. Management and
leadership are often not the most common areas of development for
specialists in emergency medicine. Many years of clinical training are
unlikely to equip emergency-medicine specialists with these skills.
Initially, dissemination of this report will be helpful to raise the profile
of these skills and abilities and new lead clinicians can be recruited on
this basis. Some clinicians may want to develop their skills further and
mentoring by another manager who models proactively and boundary-
spanning abilities would be good ways forward to develop and shape
these styles. The NHS undertakes a wide variety of development
strategies for leaders and a programme specifically for emergency-
medicine practitioners may be an obvious choice. However, such a
programme runs of risk of another ‘one-off’ programme that further
isolates groups of managers. Our suggestion would be that a broader
programme that focused on the management of primary and
secondary care services would be a valuable vehicle to foster and
develop co-operative and proactive behaviours.
It is apparent from this study that the management style of the head
nurse and business manager were not related to waiting time. Further,
it is clear that doctors and nurses identify and are led by different
people in an Emergency Department. This finding is not unique to
Emergency Departments but prevalent throughout the NHS. This
differentiation is not helpful and is likely to lead to role conflict and
confusion. High-performing departments demonstrated co-operative
leadership strategies where head nurse and lead clinician worked
together. This will be an important development and one that would
foster more dyadic working between doctors and nurses at the point of
patient contact. Clearly, teams of staff that come together at times of
emergencies have proven their effectiveness. The suggestion to
develop dedicated pairs of doctors and nurses to work at other points
of patient contact develops this notion further. In addition, further
work is needed into how leadership translates into improving
performance of specialties and departments.

Factors influencing Emergency Department waiting times
©NCCSDO 2007 84
6.5 Recommendations for ways to reduce avoidable variation: future research
It is recommended that all Emergency Departments examine the
important factors found by this study to influence mean waiting time.
This should be done in the context of their own working practice with a
view to identifying areas that would be amenable to change. We
recommend exploring how changing these organisational factors may
affect waiting times and develop hypotheses for empirical testing.
Following this, recommendations for future empirical research that will
address waiting time issues will be made along with the rationale for
their selection. Conducting primary research into the findings
suggested by this study will be key in determining a causal
relationship between factors identified and their ability to influence
waiting times. There is no doubt that any intervention study will be
challenging and costly to set up and execute given that the
intervention will mean changing the way that departments operate
and deliver their service. However, this should not deter future
research in this area from being undertaken and encouraged.
A number of measures of waiting time have been introduced in recent
years. This study’s use of the mean waiting time to see a DMC has
been useful and successful in examining some relationships hitherto
not explored in relation to emergency medicine. This large-scale study
has placed emergency medicine firmly on the interface of primary and
secondary care and has probably achieved its usefulness. Other
measures, such as the 4-hour waiting-times target are now being
achieved by a majority of departments. While some on-going measure
of performance is useful to provide feedback to departments, little
further development of services is likely to take place. It may be the
case that any further improvement in relation to one standard is not
possible due to the marked heterogeneity of departments to which it is
being applied. One of the next areas of effectiveness to explore is that
of cross-boundary working between primary and secondary care
services and improving service quality. Work that is commencing
looking at pathways of care in relation to individual conditions is likely
to be useful in this area (Goldberg, 1972). It must be remembered
that for the patient, the journey does not begin on arrival at the
Emergency Department, but at the point when they decide to seek
help for a health problem. Therefore taking a patient-centred
perspective will not only include the experience of the Emergency
Department, but that of contact with local health services in general.
Finally, the Healthcare Commission have started to examine quality of
care more recently in conjunction with the British Association for
Emergency Medicine. A number of clinical standards were audited in
the recent round of data collection to try and compare departments
not only in relation to the environment, but also to the service
provided. It will remain to be seen how useful these measures are, but
they are an important step in acknowledging quality as a key measure
of service to patients. However, it is clear that other quality issues
Factors influencing Emergency Department waiting times
©NCCSDO 2007 85
require study, not least how quality is measured effectively and then
linked with performance and patient outcomes. This is a major piece
of work that should be recommended for future research.
This study also found that proactive, participative leadership style is
important. The ability of a leader to work inclusively across a number
of boundaries has been described. Developmental activities should be
examined to support the development of proactive and participative
leadership styles. It is also important to be able to identify these
behaviours and measure them. This would suggest a fruitful area of
research developing from this work, examining the transfer of
leadership within health care and specifically examining leadership
across primary and secondary care boundaries.
6.6 Limitations
Although this study has examined a large number of Emergency
Departments across England and Wales along with an in-depth study
of eight departments, it has several limitations. Chiefly, it is a cross-
sectional study that has identified several factors associated with
waiting times. However, the direction of causality of these factors is
unknown. For example, high-performing departments exhibit proactive
behaviours that manage the relationships across the Trust and
primary care. This suggests that proactive behaviours result in
subsequent high performance. A cross-sectional study cannot
distinguish this level of causality as it may be that, because these
Trusts are high performers, proactive behaviours will develop.
Therefore we must be careful to talk about an association between
proactive behaviour and high performance and urge for longitudinal
studies to determine the direction of causality.
Whereas a model of factors that predicted waiting times was
identified, the mechanisms available to reduce avoidable variation in
waiting times are less clear. It is apparent from our in-depth work that
departments have a number of mechanisms in place, but few of them
relate to those found to be important from our modelling. Therefore,
the mechanisms to reduce variation in waiting times are as yet to be
defined. Further work will be required to identify effective mechanisms
that can be transferred to the broad, different configurations of
Emergency Departments that exist throughout the country. However,
some have been suggested and warrant further investigation.
This study only examined factors influencing waiting times within
Emergency Departments themselves. The time and funding available
did not allow the scope of the study to extend to the wider Trust or
community. Further work should focus on this, given that in-flow and
exit block are acknowledged as being key challenges when tackling
waiting times. In addition, a proactive and participative management
approach should incorporate the wider health community as well as
the Emergency Department itself.

Factors influencing Emergency Department waiting times
©NCCSDO 2007 86
6.7 Concluding remarks
This study provides strong evidence from multiple perspectives that,
after controlling for case-mix and size of department, time lost to
nursing sickness, non-pay spend and lead clinician management style
are factors likely to affect waiting times. In addition, proactive,
participative leadership style is important. Further work needs to focus
on designing appropriate interventions to test this model, examine
different ways of evaluating Emergency Department performance, and
evaluating the effect that the wider health community has on
Emergency Department performance.

Factors influencing Emergency Department waiting times
©NCCSDO 2007 87
References
Abramowitz, S., Joy, S.A. and Yurt, R.W. 1989. Emergency room visit
time: changes over a 16-year period. New York State Journal of
Medicine 89(8): 446–9
American College of Emergency Physicians. 1990. Measures to deal
with emergency department overcrowding. Annals of Emergency
Medicine 19: 944–5
Andrulis, D.P., Kellermann, A., Hintz, E.A., Hackman, B.B. and
Weslowski, V.B. 1991. Emergency departments and crowding in
United States teaching hospitals. Annals of Emergency Medicine
20(9): 980–6
Argyris, C. 1964. Integrating the Individual and the Organization. New
York: Wiley
Audit Commission. 1998. By Accident or Design - Executive Summary.
http://www.audit-commission.gov.uk/reports/NATIONAL-
REPORT.asp?CategoryID=&ProdID=D39CD7ED-C5E6-4DC3-9F02-
B5CA701756C4
Audit Commission. 2001. Accident and Emergency. Review of National
Findings. London: Audit Commission
Bacon, J. 2004. Letter from John Bacon, Group Director, Health and
Social Care Services Delivery to SHA Chief Executives.
http://www.dh.gov.uk/PublicationsAndStatistics/LettersAndCircula
rs/DearColleagueLetters/DearColleagueLettersArticle/fs/en?CONT
ENT_ID=4069650&chk=emYxyD
Bland, J.M. and Altman, D.G. 1995. Comparing methods of
measurement: why plotting difference against standard method is
misleading. Lancet 346: 1085–7
Borrill, C.S., Wall, T.D., West, M.A., Hardy, G.E., Shapiro, D.A.,
Carter, A.J. et al. 1996. Mental Health of the Workforce in NHS
Trusts: Phase 1 final report. London: Department of Health
Borrill, C.S., West, M.A., Wall, T.D., Shapiro, D.A., Haynes, C.E.,
Stride, C. et al. 1998a. Stress among staff in NHS Trusts.
Sheffield: Institute of Work Psychology, University of Sheffield
Borrill, C.S., Wall, T.D., West, M.A., Hardy, G.E., Shapiro, D.A.,
Haynes, C.E. et al. 1998b. Stress among staff in NHS Trusts: Final
report. London: Department of Health
British Medical Association. 2005. Survey of A&E Waiting Times.
London: British Medical Association
Browne, G., Lam, L., Giles, H., McCaskill, M., Exley, B. and Fasher, B.
2000. The effects of a seamless model of management on the
quality of care for emergency department patients. Journal of
Quality in Clinical Practice 20(4): 120–6
Byrne, G., Richardson, M., Brunsdon, J. and Patel, A. 2000. An
evaluation of the care of patients with minor injuries in
Factors influencing Emergency Department waiting times
©NCCSDO 2007 88
emergency settings. Accident and Emergency Nursing 8(2): 101–
9
Cameron, P.A., Kennedy, M.P. and McNeil, J.J. 1999. The effects of
bonus payments on emergency service performance in Victoria.
The Medical Journal of Australia 171(5): 243–6
Cardin, S., Afilalo, M., Lang, E., Collet, J.P.L., Colacone, A., Tselios, C.
et al. 2003. Intervention to decrease emergency department
crowding: does it have an effect on return visits and hospital
readmissions? Annals of Emergency Medicine 41(2): 173–85
Carter, A.J. and West, M.A. 1999. Sharing the burden - teamwork in
health care settings. In Stress in Health Professionals:
Psychological and organisational causes and interventions (R.
Payne and J. Firth-Cozens, eds), pp. 191- 202. Chichester: Wiley
Carter, A.J., Stride, C.B., Turner, N. and Wall, T.D. 2001. Staff
Attitude Survey 2001: Feedback report to an NHS Trust.
University of Sheffield, Sheffield: UK Institute of Work Psychology
Chinnis, A. and White, K.R. 1999. Challenging the dominant logic of
Emergency Departments: guidelines from chaos theory. Journal of
Emergency Medicine 17(6): 1049–54
Choi, Y.F., Wong, T.W. and Lau, C.C. 2006. Triage rapid initial
assessment by doctor (TRIAD) improves waiting time and
processing time of the emergency department. Journal of
Emergency Medicine 23: 262–5
Cobelas, C., Cooper, C., Ell, M., Hawthorne, G., Kennedy, M. and
Leach, D. 2001. Quality management and the Emergency Services
Enhancement Program. Journal of Quality in Clinical Practice
21(3): 80–5
Commission for Healthcare Audit and Inspection. 2005. Acute Hospital
Portfolio Review. Accident and Emergency. London: Commission
for Healthcare Audit and Inspection
Cooke, M., Fisher, J., Dale, J., McLeod, E., Szczepura, A., Walley, P.
and Wilson, S. 2005. Reducing Attendances and Waits in
Emergency Departments: A systematic review of present
innovations. London: SDO
Department of Health. 1991. The Patient's Charter. London: HMSO
Department of Health. 2000. The NHS Plan. London: Department of
Health
Department of Health. 2004. Transforming Emergency Care in
England. London: Department of Health
Department of Health. 2006. Direction of Travel for Urgent Care: a
discussion document. London: Department of Health
Derlet, R.W. and Richards, J.R. 2000. Overcrowding in the nation’s
emergency departments: complex causes and disturbing effects.
Annals of Emergency Medicine 35: 63–8

Factors influencing Emergency Department waiting times
©NCCSDO 2007 89
Derlet, R.W., Richards, J.R. and Kravitz, R.L. 2001. Frequent
overcrowding in U.S. emergency departments. Academic
Emergency Medicine 8(2): 151–5
Edhouse, J.A. and Wardrope, J. 1996. Do the national performance
tables really indicate the performance of accident and emergency
departments? Journal of Accident and Emergency Medicine 13(2):
123–6
Espinosa, G., Miró, O., Sanchez, M., Coll-vinent, B. and Milla, J. 2002.
Effects of external and internal factors on emergency department
overcrowding. Annals of Emergency Medicine 39(6): 693–5
Fatovich, D.M. and Hirsch, R.L. 2003. Entry overload, emergency
department overcrowding, and ambulance bypass. Emergency
Medicine Journal 20(5): 406–9
Feferman, I. and Cornell, C. 1989. Emergency Services, Scarborough
General Hospital, Ont. How we solved the overcrowding problem
in our emergency department. Canadian Medical Association
Journal 140(3): 273–6
Frank, I.C. 2001. ED crowding and diversion: strategies and concerns
from across the United States. Journal of Emergency Nursing
27(6): 559–65
Fulop, N. and Allen, P. 2000. National Listening Exercise: Report of the
findings. London: SDO
Gallagher, E.J. and Lynn, S.G. 1990. The etiology of medical gridlock:
causes of emergency department overcrowding in New York City.
Journal of Emergency Medicine 8: 785–90
Goldberg, D.P. 1972. The Detection of Psychiatric Illness by
Questionnaire. Oxford: Oxford University Press
Graff, L.G., Wolf, S., Dinwoodie, R., Buono, D. and Mucci, D. 1993.
Emergency physician workload: a time study. Annals of
Emergency Medicine 22(7): 1156–63
Grumbach, K., Keane, D. and Bindman, A. 1993. Primary care and
public emergency department overcrowding. American Journal of
Public Health 83(3): 372–8
Hardy, G.E., Woods, D. and Wall, T.D. 2003. The impact of
psychological distress on absence from work. Journal of Applied
Psychology 88: 306–14
Hirshon, J.M., Kirsch, T.D., Mysko, W.K. and Kelen, G.D. 1996. Effect
of rotational patient assignment on emergency department length
of stay. Journal of Emergency Medicine 14(6): 763–8
James, L.R., Demaree, R.G. and Wolf, G. 1984. Estimating within-
group interrater reliability with and without response bias. Journal
of Applied Psychology 69: 85–98
Kelen, G.D., Scheulen, J.J. and Hill, P.M. 2001. Effect of an emergency
department (ED) managed acute care unit on ED overcrowding
and emergency medical services diversion. Academic Emergency
Medicine 8(11): 1095–1100
Factors influencing Emergency Department waiting times
©NCCSDO 2007 90
Kilmarx, P., Chen, Y.F., McGrath, C., Porro, J., Ross, A., Wagner, K.
and Wachtel, T. 1991. The effect of race on waiting time in two
urban emergency departments. Rhode Island Medical Journal
74(9): 415–9
Kozlowski, S.W.J. and Hattrup, K. 1992. A disagreement about within-
group agreement: disentangling issues of consistency versus
consensus. Journal of Applied Psychology 77: 161–7
Kyriacou, D.N., Ricketts, V., Dyne, P.L., McCollough, M.D. and Talan,
D.A. 1999. A 5-year time study analysis of emergency
department patient care efficiency. Annals of Emergency Medicine
34(3): 326–35
Lambe, S., Washington, D.L., Fink, A., Laouri, M., Liu, H., Scura-
Fosse, J., Brook, R.H. and Asch, S.M. 2003. Waiting times in
California's emergency departments. Annals of Emergency
Medicine 41(1): 35–44
Lane, D.C., Monefeldt, C. and Rosenhead, J.V. 2000. Looking in the
wrong place for healthcare improvements: a system dynamics
study of an accident and emergency department. Journal of the
Operational Research Society 51: 518–31
Lau, F.L. and Leung, K.P. 1997. Waiting time in an urban accident and
emergency department-a way to improve it. Journal of Accident
and Emergency Medicine 14(5): 299–301
Lazarus, R. and Folkman, S. 1984. Stress Appraisal and Coping. New
York: Springer-Verlag
Likert, R. 1967. The Human Organization. New York: McGraw-Hill
Liu, S., Hobgood, C. and Brice, J.H. 2003. Impact of critical bed status
on emergency department patient flow and overcrowding.
Academic Emergency Medicine 10(4): 382–5
Locker, T.E. and Mason, S.M. 2005. Analysis of the distribution of time
that patients spend in emergency departments. British Medical
Journal 330: 1188–9
McGregor, D. 1960. The Human Side of Enterprise. New York:
McGraw-Hill
McKevitt, C., Morgan, M., Dundas, R. and Holland, W.W. 1997.
Sickness absence and ‘working through’ illness: a comparison of
two professional groups. Journal of Public Health Medicine 16:
295–300
Miró, O., Antonio, M.T. and Jiménez, S., DeDios, A., Sanchez, M.,
Borras, A. and Milla, J. 2000. Decreased health care quality
associated with emergency department overcrowding. European
Journal of Emergency Medicine 7: 79–80
Miró, O., Sánchez, M., Espinosa, G., Coll-Vinent, B., Bragulat, E. and
Millá, J. 2003. Analysis of patient flow in the emergency
department and the effect of an extensive reorganisation.
Emergency Medicine Journal 20(2): 143–8
Mohsin, M., Bauman, A. and Ieraci, S. 1998. Is there equity in
emergency medical care? Waiting times and walk-outs in South

Factors influencing Emergency Department waiting times
©NCCSDO 2007 91
Western Sydney hospital emergency departments. Australian
Health Review 21(3): 133–49
Mullarkey, S., Wall, T.D., Warr, P.B., Clegg, C.W. and Stride, C.B.
1999. Measures of Job Satisfaction, Mental Health and Job-
Related Well-Being: A bench-marking manual. Sheffield: Sheffield
Academic Press
National Audit Office. 2004. Improving Emergency Care in England.
London: The Stationery Office
Payne, R.L. 1999. Stress at work: a conceptual framework. In Stress
in Health Professionals: Psychological and organisational causes
and Interventions (J. Firth-Cozens and R.L. Payne, eds), pp. 3–
16. Chichester: Wiley
Poulton, B.C. 1995. Effective Multi-Disciplinary Teamwork in Primary
Health Care. PhD Thesis, Institute of Work Psychology, University
of Sheffield
Proudlove, N.C. Gordon, K. and Boaden, R. 2003. Can good bed
management solve the overcrowding in accident and emergency
departments? Emergency Medicine Journal 20(2): 149–55
Purnell, L.D. 1991. A survey of emergency department triage in 185
hospitals: physical facilities, fast-track systems, patient-
classification systems, waiting times, and qualification, training,
and skills of triage personnel. Journal of Emergency Medicine
17(6): 402–7
Richards, J.R., Navarro, M.L. and Derlet, R.W. 2000. Survey of
directors of emergency departments in California on
overcrowding. Western Journal of Medicine 172: 385–8
Roethlisberger, F.J. and Dickson, W.J. 1939. Management and the
Worker. Cambridge, MA: Harvard University Press
Sadler, P.J. 1970. Leadership style, confidence in management and
job satisfaction. Journal of Applied Behavioural Science 6: 3–19
Saunders, C.E. 1987. Time study of patient movement through the
emergency department: sources of delay in relation to patient
acuity. Annals of Emergency Medicine 16(11): 1244–8
Schafermeyer, R.W. and Asplin, B.R. 2003. Hospital and emergency
department crowding in the United States. Emergency Medicine
(Fremantle) 15(1): 22–7
Schull, M.J., Szalai, J.P., Schwartz, B. and Redelmeier, D.A. 2001.
Emergency department overcrowding following systematic
hospital restructuring: trends at twenty hospitals over ten years.
Academic Emergency Medicine 8(11): 1037–43
Shih, F.Y., Ma, M.H., Chen, S.C., Wang, H.P., Fang, C.C., Shyu, R.S.
et al. 1999. ED overcrowding in Taiwan: facts and strategies.
American Journal of Emergency Medicine 17(2): 198–202
Simpson, A.N., Wardrope, J. and Burke, D. 2001. The Sheffield
experiment: the effects of centralising accident and emergency
services in a large urban setting. Emergency Medicine Journal
18(3): 193–7

Factors influencing Emergency Department waiting times
©NCCSDO 2007 92
Spaite, D.W., Bartholomeaux, F., Guisto, J., Lindberg, E., Hull, B.,
Eyherabide, A. et al. 2002. Rapid process redesign in a university-
based emergency department: decreasing waiting time intervals
and improving patient satisfaction. Annals of Emergency Medicine
39(2): 168–77
Subash, F., Dunn, F., McNicholl, B. and Marlow, J. 2004. Team triage
improves emergency department efficiency. Journal of Emergency
Medicine 21: 542–4
Taylor, C. and Benger, J.R. 2004. Patient satisfaction in emergency
medicine. Emergency Medicine Journal 21: 528–32
Tham, K.Y., Richmond, P.W. and Evans, R.J. 1995. Senior house
officers' work activities in an accident and emergency department.
Journal of Accident and Emergency Medicine 12(4): 266–9
Trout, A., Magnusson, A.R. and Hedges, J.R. 2000. Patient satisfaction
investigations and the emergency department: what does the
literature say? Academic Emergency Medicine 7(6): 695–709
VanRooyen, M.J., Grabowski, J.G., Ghidorzi, A.J., Dey, C. and Strange,
G.R. 1999. The perceived effectiveness of total quality
management as a tool for quality improvement in emergency
medicine. Academic Emergency Medicine 6(8): 811–16
Wall T.D., Bolden, R.I., Borrill C.S., Carter A.J., Golya D.A., Hardy G.E.
et al. 1997. Minor psychiatric disorder in NHS Trust staff:
occupational and gender differences. British Journal of Psychiatry
171: 519–23
Walley, P. 2003. Designing the accident and emergency system:
lessons from manufacturing. Emergency Medicine Journal 20(2):
126–30
West, M.A. and Slater, J.A. 1996. The Effectiveness of Teamworking
on Primary Health Care. Oxford: Oxford Health Education
Authority
Wilkinson, R.A. 1999. Triage in accident and emergency 1: an
overview of the literature. British Journal of Nursing 8(2): 86–8
Factors influencing Emergency Department waiting times
©NCCSDO 2007 93
Appendices
Appendix A Audit Commission data re-analysis
Aims
This part of the study aimed to re-examine the findings of the Audit
Commission’s review of Emergency Departments undertaken in 2000
and explore whether any further conclusions can be drawn from the
data collected at that time (Audit Commission, 2001). An investigation
of factors that affect waiting times was undertaken.
Methods
Analysis was undertaken using data from the Microsoft Excel file
named ‘ae database 2000 v1_38’ taken from the Acute Hospital
Portfolio CD. The Audit Commission have confirmed that this is the
data-set upon which their original analysis was based. The waiting-
time measure collected by the Audit Commission was the proportion of
patients seen by a doctor or nurse practitioner within 1 hour of arrival.
Data analysis
For the purposes of the analysis only those departments in England
and Wales identified by the Audit Commission as general Accident and
Emergency Departments were included. Linear-regression analysis of
waiting times data was undertaken. The percentage of patients seen
by a doctor or Emergency Nurse Practitioner (ENP) within 1 hour of
arrival was used as the dependent variable as this is the closest
approximation to waiting time available in this data-set.
To correct for variations in the percentage of patients seen within
1 hour, arising from differences in case-mix between departments, the
following variables were regressed upon the dependent variable:
• percentage of new attendances admitted in a year,
• percentage of new patients referred by GP,
• percentage of patients arriving by ambulance,
• percentage of patients under 16 years old.
To control for variations in department size, the total number of
attendances per annum was regressed on the unstandardised
residuals from the preceding step.
It was considered appropriate to control for variations in case-mix and
department size as these factors reflect differences in local health care

Factors influencing Emergency Department waiting times
©NCCSDO 2007 94
services and would be difficult for an individual Emergency
Department to influence.
Each of the remaining variables was then examined in turn for its
ability to predict the residual percentage of patients seen within 1
hour. Variables found to be potentially significant (P<0.1) were
subsequently entered into a multivariate linear-regression model to
identify those variables that were independently predictive.
Results
Data were reported from 209 Emergency Departments, of which 15
(7.2%) were located in Wales. The included departments showed
considerable variation in both case-mix and the total number of
attendances per year. The key characteristics of the included
departments are summarised in Table 1A.
Thirty-two (15.3%) departments did not report data regarding the
percentage of patients seen in 1 hour. Of the remaining departments
the mean percentage of patients seen within 1 hour of arrival was
56.1% (range, 3.2–100%). The distribution is shown in Figure 1A.
To control for variations in case-mix and department size, the
variables outlined in Table 1A were regressed upon the percentage of
patients seen within 1 hour. Doing so accounted for 30.4% of the
variability in the percentage of patients seen in 1 hour.
Each remaining variable was then regressed in turn upon the
unstandardised residuals from the preceding step. Those variables
found to be potentially predictive of the percentage of patients seen
within 1 hour (P<0.1) are shown in Table 2A.

Factors influencing Emergency Department waiting times
©NCCSDO 2007 95
0
5
10
15
20
25
30
35
1-10
11-20
21-30
31-40
41-50
51-60
61-70
71-80
81-90
91-100
Percentage of patients seen within one hour
Number of departments
Table 1A Characteristics of included departments
Variable Minimum Maximum Mean SD
Percentage of new attendances admitted (year)
4.1 34.2 18.5 5.2
Percentage of new patients referred by GP
0 85.7 9.8 8.3
Percentage of patients arriving by ambulance
5.9 37.7 23.4 6.1
Percentage of patients under 16 years old
0 38.9 22.3 9.1
Total attendances per year 17,749 139,921 59,220 20,328
Figure 1A Distribution of the percentage of patients seen within 1 hour
(n=177)
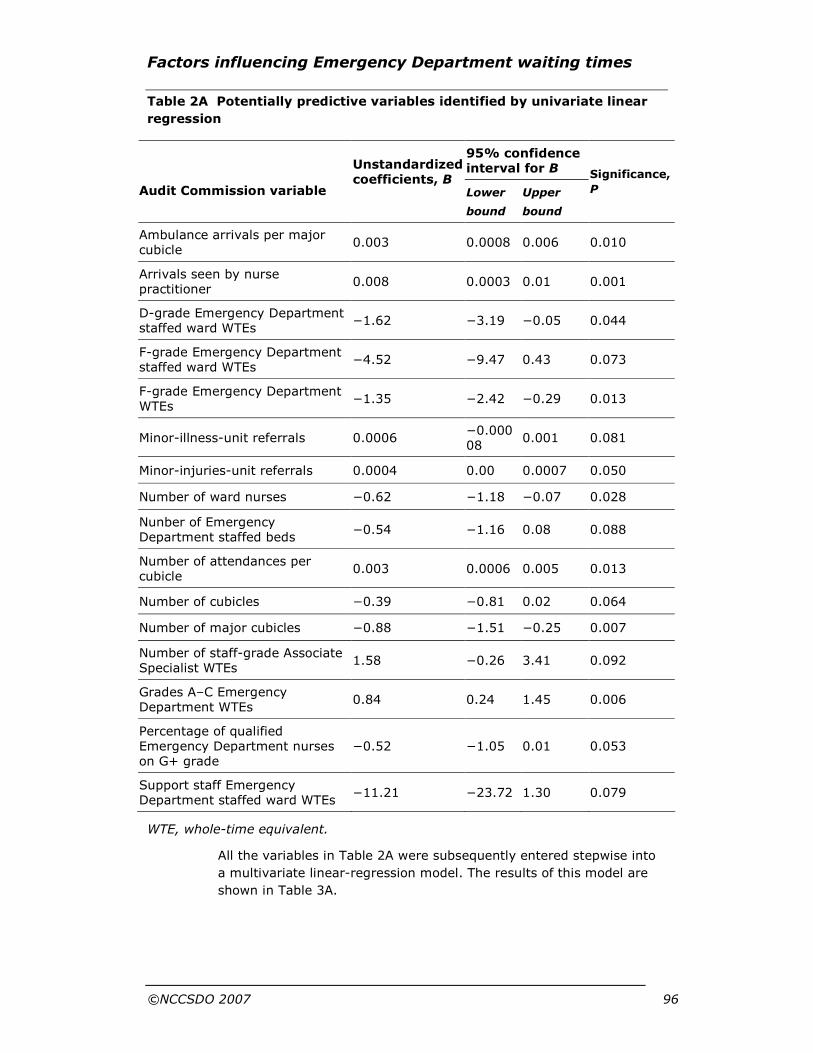
Factors influencing Emergency Department waiting times
©NCCSDO 2007 96
Table 2A Potentially predictive variables identified by univariate linear
regression
WTE, whole-time equivalent.
All the variables in Table 2A were subsequently entered stepwise into
a multivariate linear-regression model. The results of this model are
shown in Table 3A.
95% confidence interval for B
Audit Commission variable
Unstandardized coefficients, B
Lower
bound
Upper
bound
Significance,
P
Ambulance arrivals per major cubicle
0.003 0.0008 0.006 0.010
Arrivals seen by nurse practitioner
0.008 0.0003 0.01 0.001
D-grade Emergency Department staffed ward WTEs
−1.62 −3.19 −0.05 0.044
F-grade Emergency Department staffed ward WTEs
−4.52 −9.47 0.43 0.073
F-grade Emergency Department WTEs
−1.35 −2.42 −0.29 0.013
Minor-illness-unit referrals 0.0006 −0.00008
0.001 0.081
Minor-injuries-unit referrals 0.0004 0.00 0.0007 0.050
Number of ward nurses −0.62 −1.18 −0.07 0.028
Nunber of Emergency Department staffed beds
−0.54 −1.16 0.08 0.088
Number of attendances per cubicle
0.003 0.0006 0.005 0.013
Number of cubicles −0.39 −0.81 0.02 0.064
Number of major cubicles −0.88 −1.51 −0.25 0.007
Number of staff-grade Associate Specialist WTEs
1.58 −0.26 3.41 0.092
Grades A–C Emergency Department WTEs
0.84 0.24 1.45 0.006
Percentage of qualified Emergency Department nurses on G+ grade
−0.52 −1.05 0.01 0.053
Support staff Emergency Department staffed ward WTEs
−11.21 −23.72 1.30 0.079

Factors influencing Emergency Department waiting times
©NCCSDO 2007 97
Table 3A Results of the multivariate linear-regression model
95% Confidence interval for B Audit Commission
variable
Unstandardized coefficients, B
Lower
bound
Upper
bound
Significance, P
Percentage of qualified Emergency Department nurses on G+ grade
−1.75 −3.14 −0.37 0.016
Grades A–C Emergency Department WTEs
2.16 0.38 3.93 0.020
WTE, whole-time equivalent.
This model explained 48.4% of the remaining variability in the
percentage of patients seen within 1 hour.
Discussion
Two variables have been identified which, after correcting for
department size and case-mix, are significant independent predictors
of the percentage of patients seen within 1 hour of arrival. These are
the percentage of senior nurses (Grade G+) and unqualified nurses
(Grade A-C). Perhaps the most notable finding is that the number of
senior nurses has a negative impact upon performance whereas the
number of unqualified nurses has a positive effect. Although this may
seem counterintuitive, there are a number of possible explanations.
It is likely that a proportion of senior nurses’ time will be spent on
managerial and administrative tasks. Although these are important for
the functioning of a department, such tasks may do little to influence
waiting time directly. It is conceivable therefore that those
departments with relatively high numbers of G+ grade nurses have a
greater amount of time devoted to such activities and hence
performance is adversely affected. A further possible explanation is
that in departments with a high proportion of senior nurses some may
be undertaking extended or nurse-specialist roles and that the adverse
effect on performance derives from this role.
The proportion of nurses on grades A to C has a positive impact upon
performance. It may be the case that through supporting the work of
other staff members and contributing to the general running of the
department, waiting times are improved. Additionally, if such nurses
were trained to undertake tasks such as phlebotomy or to perform
ECGs then this would potentially expedite the patient’s journey time
through the department. However, such explanations are speculative
as none of the collected data relate to such activity.
In their report, the Audit Commission (2001) found no relation
between the nursing workload (the number of attendances per nurse
per annum) and waiting times.

Factors influencing Emergency Department waiting times
©NCCSDO 2007 98
Taken together with the above findings, this would suggest that
nursing skill mix and not the total number of nursing staff is a key
determinant of performance. Similarly, the Audit Commission found no
relation between doctors’ workload and waiting time and this is
confirmed by this analysis. The Audit Commission demonstrated that
department size was related to waiting time. Consequently,
differences in department size were controlled for in this analysis. This
approach was taken as the number of attendances is not under the
direct control of the department. Differences in case-mix were also
controlled for, as these again are beyond the control of the
department itself. This approach allows examination of the effect of
department characteristics, such as staffing and facilities, beyond that
which would be explained by differing size and case-mix. It can be
seen from Table 1A that such an approach is necessary, as the
departments studied vary considerably in their characteristics.
Summary
• Audit Commission data were re-examined to identify factors that
affect waiting times.
• Linear-regression analysis was used, first controlling for the case-
mix and size of each emergency department.
• Once controlled for, the nursing skill mix of an Emergency
Department seems to be important. Senior nurses (G grade and
above) having a detrimental effect on performance and
unqualified support staff (grades A–C) having a positive effect.
This explained 48.4% of the remaining variability in waiting times.

Factors influencing Emergency Department waiting times
©NCCSDO 2007 99
Appendix B Analysis of changes in performance and profile in a large urban Emergency Department, 1993–2003
Aims
This section of the study aims to describe changes in the case-mix,
demographics and waiting times of patients over the age of 16 years
presenting to Emergency Departments in one city in England over an
11-year period from 1993 to 2003.
This study was undertaken to provide further information for the
survey to be undertaken in Phase One of this study. The information
analysed was from a large city in the north of England and could be
viewed as a microcosm of the problems faced by Emergency
Department services nationally. Factors identified from its more
detailed evaluation were therefore fed into the development of the
national survey for the next stage of the study.
Methods
The adult Emergency Departments have collected data on attendances
since 1993. Data collected from 1993 to 2003 were analysed. At the
start of the period studied there were two Emergency Departments
treating adults, one of which also treated children. In addition, there
existed a separate paediatric Emergency Department. These services
were reconfigured in 1997 to leave one ‘major’ adult Emergency
Department, a nurse-led minor-injuries unit and a paediatric
Emergency Department. This reconfiguration has been described in
detail elsewhere and has not been shown to have caused any
deterioration in Emergency Department performance (Simpson et al.,
2001).
For the period 6 April to 5 July of each year from 1993 to 2003,
information regarding all Emergency Department episodes was
abstracted from the Emergency Department database. This time
period was chosen to avoid changeover times of junior medical staff.
All new Emergency Department episodes were included if the
participant was either aged over 16 years at the time of presentation
or no age was recorded and the patient presented to one of the adult
Emergency Departments. All episodes that were neither planned nor
unplanned follow-up episodes from a previous attendance at the
Emergency Departments under investigation were considered to be
new episodes. Data retrieved included the following:
• Emergency Department booking-in time,
• time seen by a decision-making clinician (DMC),
• time leaving the Emergency Department,

Factors influencing Emergency Department waiting times
©NCCSDO 2007 100
• date of birth,
• method of arrival,
• presenting complaint,
• disposal.
The DMC was seeing patients independently at the time within each of
the departments. The Emergency Department booking-in time is
recorded automatically when a patient registers in the Emergency
Department. The time seen by DMC and the time leaving the
Emergency Department are recorded in the patient’s Emergency
Department notes and these times are then routinely entered into the
Emergency Department database once the episode is concluded.
Outcome measures
Waiting time (WT) The time from arrival in the Emergency
Department until a patient is seen by a DMC5.
Treatment time (TT) The time from seeing a DMC until a patient
leaves the Emergency Department.
Case-mix
To identify differences in the WT and TT for patients with different
urgencies of presenting complaint, two groups of patient were defined,
‘minor’ cases and ‘major’ cases. A ‘minor’ case did not arrive by
emergency ambulance and was subsequently discharged from the
Emergency Department. A ‘major’ case arrived by emergency
ambulance and was admitted to hospital from the Emergency
Department. These definitions were chosen as it was thought that they
would provide the greatest consistency year on year.
Data analysis
Median and 90th percentile values were calculated for the WT and TT
for each year. Linear regression was used to analyse differences in the
rate of increase of Emergency Department attendances in the city
being studied compared with changes occurring throughout England.
Changes in demographics and case-mix over time were analysed using
linear regression to determine their significance. Changes in the
median WT and TT were examined using linear regression to
determine whether these were related to year of presentation or
clinical group (major or minor). For patients with complete and
incomplete WT and TT data the difference in mean age between these
5 Where the WT exceeded 12 hours a null value was recorded as WTs of this length had never occurred
in the Emergency Department and were therefore most likely to represent errors in the recording of such
information at the time of the episode. Similarly, null values were recorded where the TT exceeded 24
hours.

Factors influencing Emergency Department waiting times
©NCCSDO 2007 101
groups was assessed using Student’s t test. Differences in the
proportion of males, proportion of major cases and proportion
presenting as a result of trauma were assessed using chi square (Χ2)
tests.
Episodes with missing variables were excluded from each linear-
regression model where the missing data referred to the variable
being tested. Patients were not completely removed from the analysis
due to missing data and no attempt was made to extrapolate values
for missing variables.
To investigate the trends in median waiting times over the 11-year
data period and to correct for differences in age, gender and the
proportions presenting with trauma in each year we used a two-stage
linear-regression procedure. In the first stage, the individual patient's
age, sex and whether or not they were presenting with trauma were
regressed on the patient's original WT (or TT) and the median
unstandardised residuals for each year were then calculated. The
second stage used the median residual as the dependent variable, and
linear regression was again used to assess whether WT (or TT) was
related to year of attendance. This two-stage procedure has the effect
of adjusting the median waiting time for any differences in case-mix
over the study period, and still allows us to use the more appropriate
median WT (rather than the mean) as our outcome measure. The
regression coefficient b referred to below represents the rate of
change in the parameter estimate (i.e. median waiting time) over the
11-year period.
To allow comparison with figures published by the Audit Commission
(2001), the percentage of patients waiting less than 1 hour to see a
DMC and the percentage of admitted patients spending less than 4
hours in the Emergency Department were calculated for each year.
Results
During the period studied there were 252,156 new patient episodes.
The average increase in total attendances in the city during the period
studied was 1.3% per annum (95% confidence interval (CI), –4.2 to
6.8%). This is less than the average national increase of 1.7% per
annum (Sadler, 1970).
Considering the annual percentage change in the city under
investigation and across England, linear regression demonstrates that
the percentage change each year is related to neither year of
attendance (b, −0.6%; 95% CI, –0.91 to 0.79%; P=0.88) nor site
(city under investigation or England; b, 0.86%; 95% CI, −4.03 to
5.74%; P=0.72), showing that there has been no significant alteration
in the percentage change in attendances each year and no difference
between the rate of increase in the city being studied and England.

Factors influencing Emergency Department waiting times
©NCCSDO 2007 102
Missing WT and TT data
Patients with complete data for WT and TT accounted for 84.8%
(n=213,911) of the sample studied. The mean age of patients with
complete data was 44.4 years compared to 41.5 years for patients
with incomplete data (WT or TT missing) and this difference was
statistically significant (t=25.09; df=53,911.8; P<0.001). The
differences in the proportions of males, cases resulting from trauma
and proportion of major cases between these groups are shown in
Table 1B for patients with complete and incomplete WT and TT data.
These findings may reflect the way young males use Emergency
Departments. They are more likely to leave without being seen, or
leave prior to formal discharge. It was not felt that these differences
would adversely affect analysis of the remaining data.
Table 1B Characteristics of cases with complete and incomplete data
Complete, % Incomplete, % Χ2 P
Males 55.3 58.0 103.1 <0.001
Major cases 13.3 8.6 649.0 <0.001
Cases due to trauma 59.6 39.8 5181.2 <0.001
Patient age
The age profile has changed with the proportion of attendees aged
16–29 years, falling from 38.7% in 1993 to 28.8% in 2003 (b,
−1.10%; 95% CI, –1.20 to –0.82%; P<0.001). There has been a
corresponding increase in the proportion of patients in older age
groups, most notably in those aged 80–99 years of age, this age
group accounting for 6.2% of attendances in 1993 and 10.4% in 2003
(b, 0.37%; 95% CI, 0.29–0.45%; P<0.001). These changes are
illustrated in Figure 1B. For clarity, only the years 1993, 1998 and
2003 are shown.

Factors influencing Emergency Department waiting times
©NCCSDO 2007 103
0.0
5.0
10.0
15.0
20.0
25.0
30.0
35.0
40.0
45.0
16-29 30-39 40-49 50-59 60-69 70-79 80-89 90-99
Age (years)
Percentage of total attendees
1993
1998
2003
Figure 1B Age distribution of attendees, 1993–2003
Mode of arrival
The proportion of new patients arriving by emergency ambulance has
increased significantly from 22.7% in 1993 to a peak of 31.6% in
2002 (b, 0.93%; 95% CI, 0.62–1.24%; P<0.001).
Presenting complaint
The reasons why patients attend an Emergency Department can be
divided broadly into problems arising due to trauma and those due to
other causes. Trauma is responsible for the majority of attendances,
accounting for a maximum of 59.4% of episodes in 1997 and falling to
52.9% in 2003 (b, −0.46%; 95% CI, −8.7 to –0.04%; P=0.04). This
pattern of a reduction in the proportion presenting due to injuries is
apparent in all age groups but most marked among older patients.
The proportion of cases defined as minor has fallen from 71.1% in
1993 to 60.8% in 2003 (b, −1.04%; 95% CI, –1.36 to –0.73%;
P<0.001). Correspondingly, major cases accounted for 9.2% of
episodes in 1993, increasing to 14.0% in 2003 (b, 0.53%; 95% CI,
0.3 to 0.76%; P=0.01).
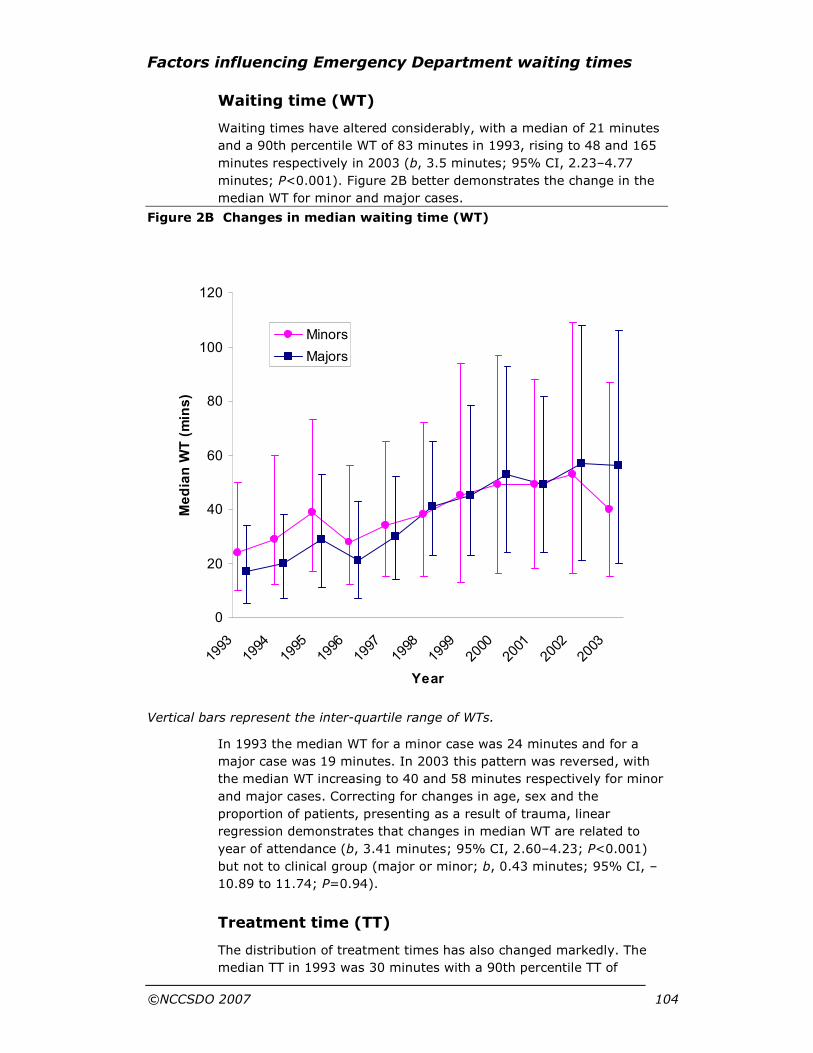
Factors influencing Emergency Department waiting times
©NCCSDO 2007 104
0
20
40
60
80
100
120
19931994
19951996
19971998
19992000
20012002
2003
Year
Median W
T (mins)
Minors
Majors
Waiting time (WT)
Waiting times have altered considerably, with a median of 21 minutes
and a 90th percentile WT of 83 minutes in 1993, rising to 48 and 165
minutes respectively in 2003 (b, 3.5 minutes; 95% CI, 2.23–4.77
minutes; P<0.001). Figure 2B better demonstrates the change in the
median WT for minor and major cases.
Figure 2B Changes in median waiting time (WT)
Vertical bars represent the inter-quartile range of WTs.
In 1993 the median WT for a minor case was 24 minutes and for a
major case was 19 minutes. In 2003 this pattern was reversed, with
the median WT increasing to 40 and 58 minutes respectively for minor
and major cases. Correcting for changes in age, sex and the
proportion of patients, presenting as a result of trauma, linear
regression demonstrates that changes in median WT are related to
year of attendance (b, 3.41 minutes; 95% CI, 2.60–4.23; P<0.001)
but not to clinical group (major or minor; b, 0.43 minutes; 95% CI, –
10.89 to 11.74; P=0.94).
Treatment time (TT)
The distribution of treatment times has also changed markedly. The
median TT in 1993 was 30 minutes with a 90th percentile TT of

Factors influencing Emergency Department waiting times
©NCCSDO 2007 105
0
50
100
150
200
250
300
350
19931994
19951996
19971998
19992000
20012002
2003
Year
Median TT (mins)
Minors
Majors
90 minutes. In 2003 these parameters had both increased, with a
median TT of 45 minutes but most notably a 90th percentile TT of 242
minutes (b, 0.96 minutes; 95% CI, 0.33–1.60 minutes; P=0.007). The
median TT for major and minor cases differs. Figure 3B demonstrates
that the median TT for minor cases has changed little from 1993 to
2003, varying between 25 and 34 minutes. In contrast, the median TT
for major cases has almost quadrupled, from 55 minutes in 1993 to
205 minutes in 2003.
Figure 3B Changes in median treatment time (TT)
Vertical bars represent the inter-quartile range of TTs.
Correcting for changes in age, sex and the proportion of patients
presenting as a result of trauma, linear regression shows that for
minor cases median TT is not related to year of attendance (b, 0.13
minutes; 95% CI, –0.38 to 0.65; P=0.58) but a relationship between
median TT and year does exist for major cases (b, 11.46 minutes;
95% CI, 6.68–16.24 minutes; P<0.001).
Outcome
The disposal of patients from the Emergency Department is shown in
Table 2B. The number of patients admitted to hospital during the
3-month period studied increased from 3358 (15.0%) in 1993 to 5629
(22.7%) in 2003 (b, 0.64%; 95% CI, 0.38–0.89%; P<0.001).
Table 2B Disposal from the Emergency Department
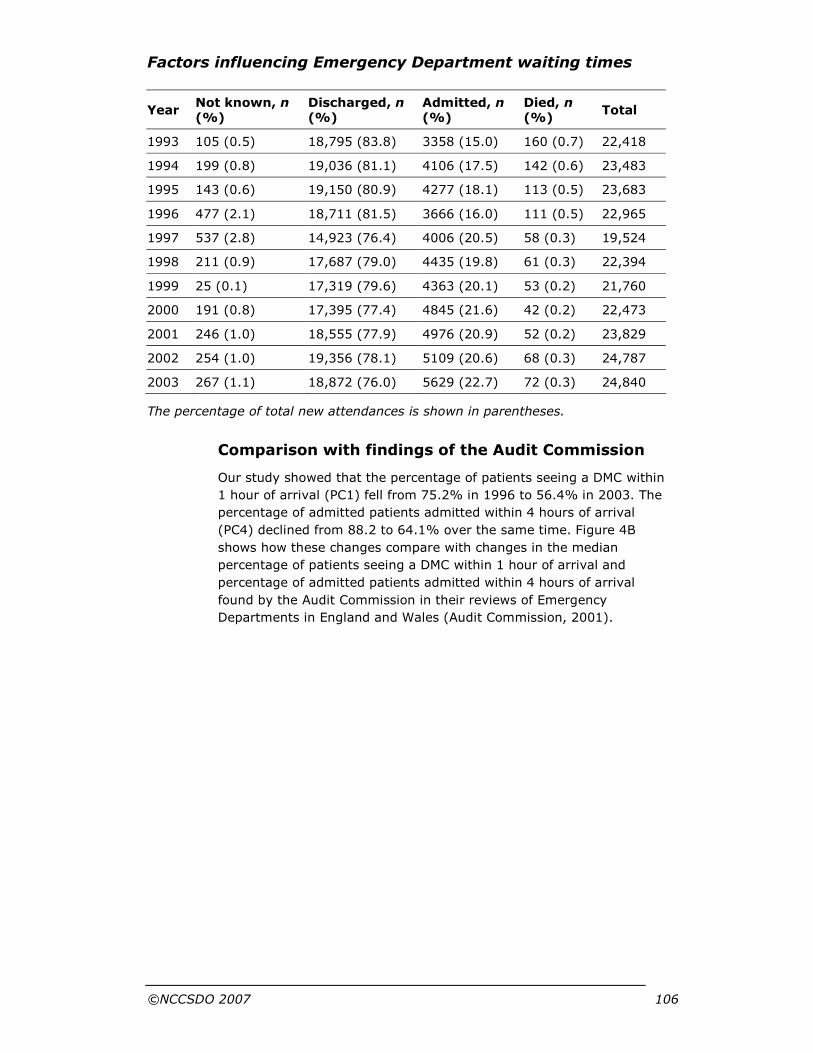
Factors influencing Emergency Department waiting times
©NCCSDO 2007 106
Year Not known, n (%)
Discharged, n (%)
Admitted, n (%)
Died, n (%)
Total
1993 105 (0.5) 18,795 (83.8) 3358 (15.0) 160 (0.7) 22,418
1994 199 (0.8) 19,036 (81.1) 4106 (17.5) 142 (0.6) 23,483
1995 143 (0.6) 19,150 (80.9) 4277 (18.1) 113 (0.5) 23,683
1996 477 (2.1) 18,711 (81.5) 3666 (16.0) 111 (0.5) 22,965
1997 537 (2.8) 14,923 (76.4) 4006 (20.5) 58 (0.3) 19,524
1998 211 (0.9) 17,687 (79.0) 4435 (19.8) 61 (0.3) 22,394
1999 25 (0.1) 17,319 (79.6) 4363 (20.1) 53 (0.2) 21,760
2000 191 (0.8) 17,395 (77.4) 4845 (21.6) 42 (0.2) 22,473
2001 246 (1.0) 18,555 (77.9) 4976 (20.9) 52 (0.2) 23,829
2002 254 (1.0) 19,356 (78.1) 5109 (20.6) 68 (0.3) 24,787
2003 267 (1.1) 18,872 (76.0) 5629 (22.7) 72 (0.3) 24,840
The percentage of total new attendances is shown in parentheses.
Comparison with findings of the Audit Commission
Our study showed that the percentage of patients seeing a DMC within
1 hour of arrival (PC1) fell from 75.2% in 1996 to 56.4% in 2003. The
percentage of admitted patients admitted within 4 hours of arrival
(PC4) declined from 88.2 to 64.1% over the same time. Figure 4B
shows how these changes compare with changes in the median
percentage of patients seeing a DMC within 1 hour of arrival and
percentage of admitted patients admitted within 4 hours of arrival
found by the Audit Commission in their reviews of Emergency
Departments in England and Wales (Audit Commission, 2001).
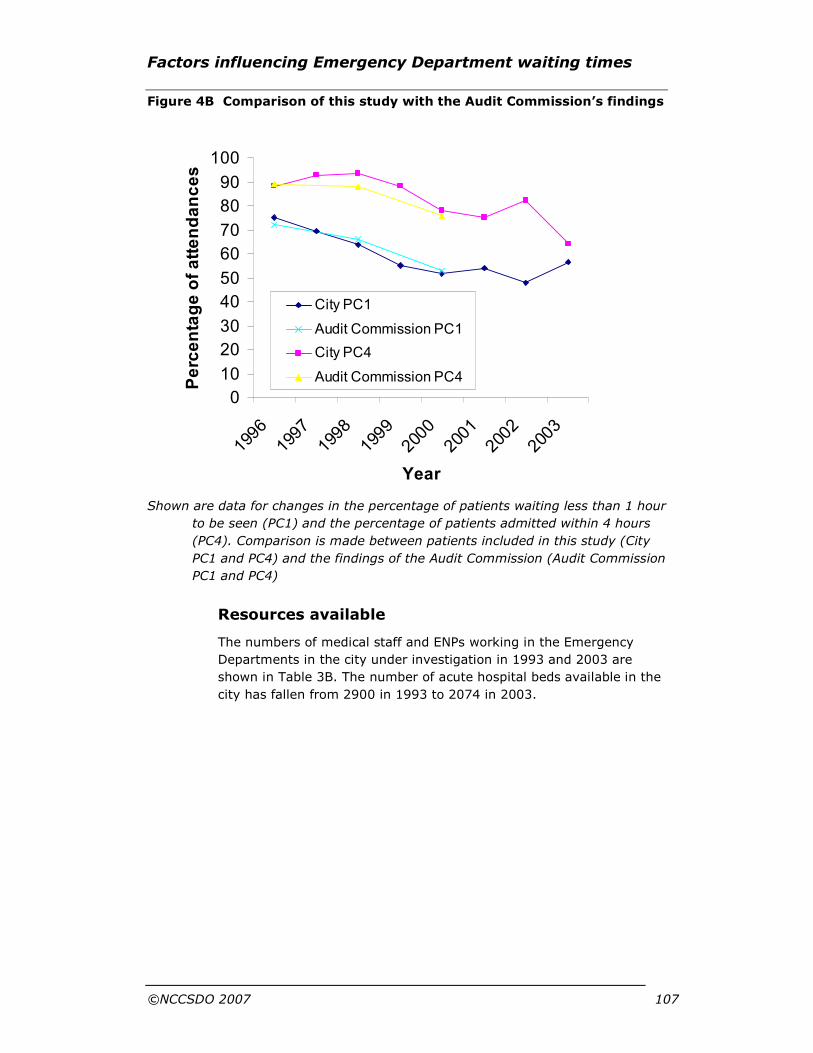
Factors influencing Emergency Department waiting times
©NCCSDO 2007 107
0
10
20
30
40
50
60
70
80
90
100
1996
1997
1998
1999
2000
2001
2002
2003
Year
Percentage of attendances
City PC1
Audit Commission PC1
City PC4
Audit Commission PC4
Figure 4B Comparison of this study with the Audit Commission’s findings
Shown are data for changes in the percentage of patients waiting less than 1 hour
to be seen (PC1) and the percentage of patients admitted within 4 hours
(PC4). Comparison is made between patients included in this study (City
PC1 and PC4) and the findings of the Audit Commission (Audit Commission
PC1 and PC4)
Resources available
The numbers of medical staff and ENPs working in the Emergency
Departments in the city under investigation in 1993 and 2003 are
shown in Table 3B. The number of acute hospital beds available in the
city has fallen from 2900 in 1993 to 2074 in 2003.
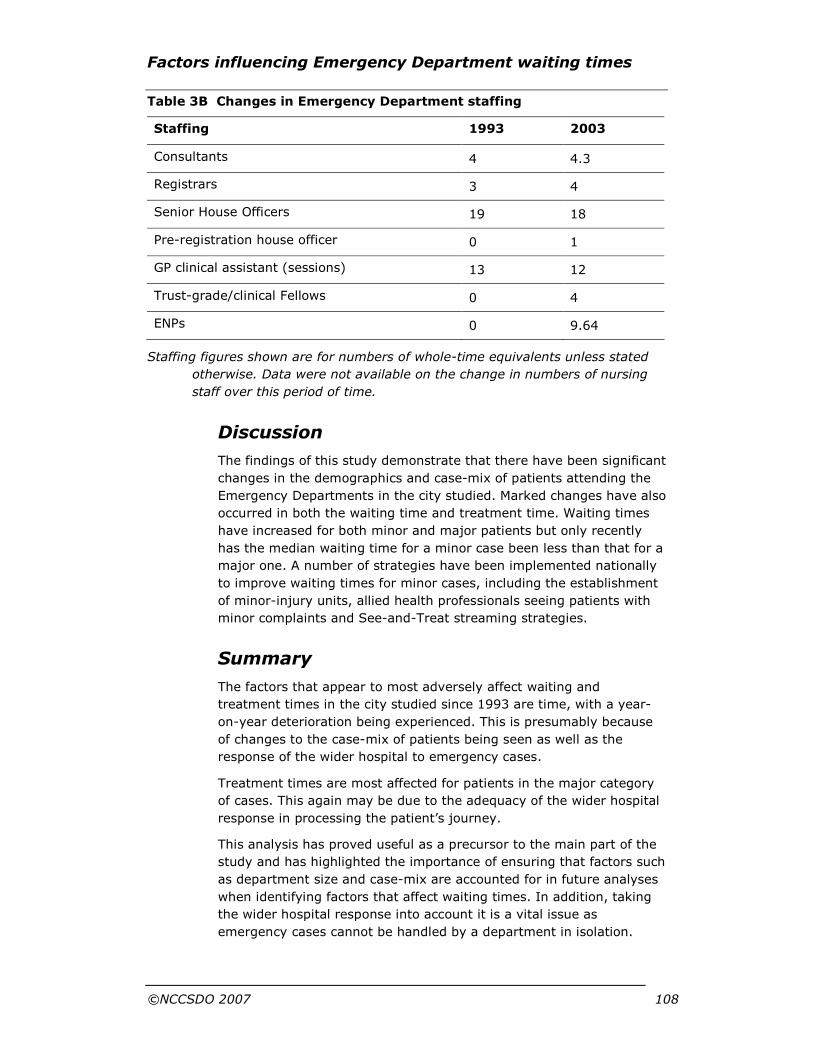
Factors influencing Emergency Department waiting times
©NCCSDO 2007 108
Table 3B Changes in Emergency Department staffing
Staffing 1993 2003
Consultants 4 4.3
Registrars 3 4
Senior House Officers 19 18
Pre-registration house officer 0 1
GP clinical assistant (sessions) 13 12
Trust-grade/clinical Fellows 0 4
ENPs 0 9.64
Staffing figures shown are for numbers of whole-time equivalents unless stated
otherwise. Data were not available on the change in numbers of nursing
staff over this period of time.
Discussion
The findings of this study demonstrate that there have been significant
changes in the demographics and case-mix of patients attending the
Emergency Departments in the city studied. Marked changes have also
occurred in both the waiting time and treatment time. Waiting times
have increased for both minor and major patients but only recently
has the median waiting time for a minor case been less than that for a
major one. A number of strategies have been implemented nationally
to improve waiting times for minor cases, including the establishment
of minor-injury units, allied health professionals seeing patients with
minor complaints and See-and-Treat streaming strategies.
Summary
The factors that appear to most adversely affect waiting and
treatment times in the city studied since 1993 are time, with a year-
on-year deterioration being experienced. This is presumably because
of changes to the case-mix of patients being seen as well as the
response of the wider hospital to emergency cases.
Treatment times are most affected for patients in the major category
of cases. This again may be due to the adequacy of the wider hospital
response in processing the patient’s journey.
This analysis has proved useful as a precursor to the main part of the
study and has highlighted the importance of ensuring that factors such
as department size and case-mix are accounted for in future analyses
when identifying factors that affect waiting times. In addition, taking
the wider hospital response into account it is a vital issue as
emergency cases cannot be handled by a department in isolation.
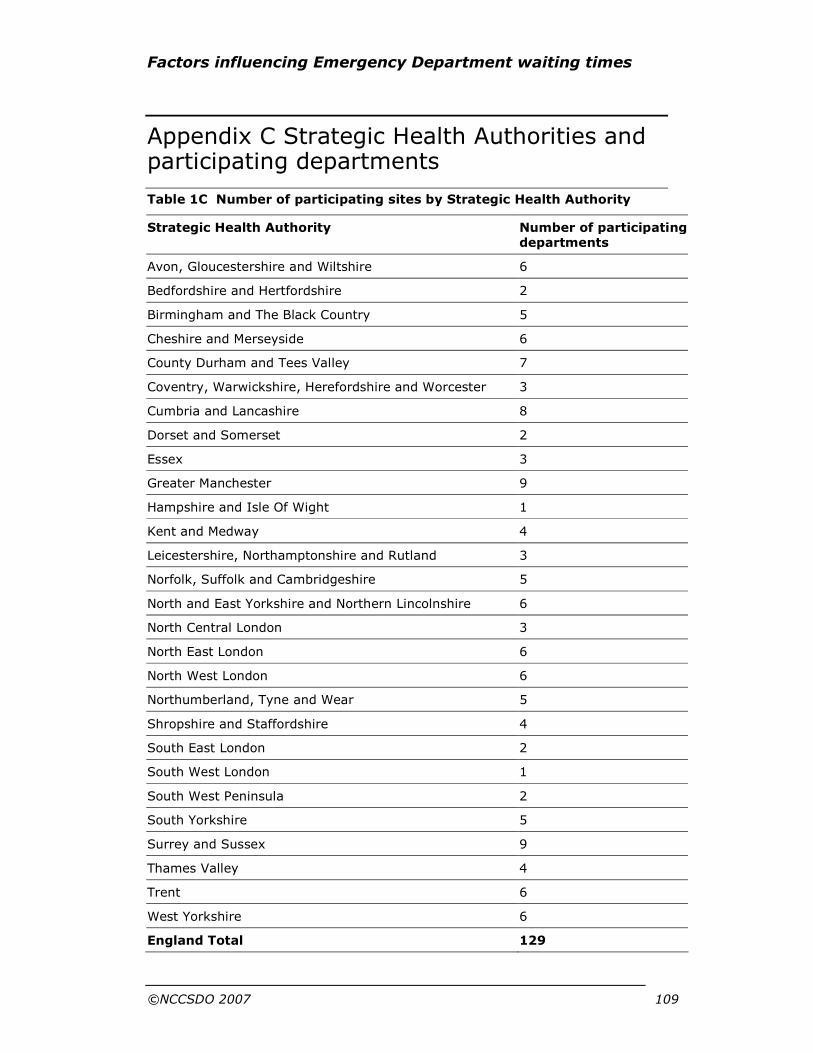
Factors influencing Emergency Department waiting times
©NCCSDO 2007 109
Appendix C Strategic Health Authorities and participating departments
Table 1C Number of participating sites by Strategic Health Authority
Strategic Health Authority Number of participating departments
Avon, Gloucestershire and Wiltshire 6
Bedfordshire and Hertfordshire 2
Birmingham and The Black Country 5
Cheshire and Merseyside 6
County Durham and Tees Valley 7
Coventry, Warwickshire, Herefordshire and Worcester 3
Cumbria and Lancashire 8
Dorset and Somerset 2
Essex 3
Greater Manchester 9
Hampshire and Isle Of Wight 1
Kent and Medway 4
Leicestershire, Northamptonshire and Rutland 3
Norfolk, Suffolk and Cambridgeshire 5
North and East Yorkshire and Northern Lincolnshire 6
North Central London 3
North East London 6
North West London 6
Northumberland, Tyne and Wear 5
Shropshire and Staffordshire 4
South East London 2
South West London 1
South West Peninsula 2
South Yorkshire 5
Surrey and Sussex 9
Thames Valley 4
Trent 6
West Yorkshire 6
England Total 129

Factors influencing Emergency Department waiting times
©NCCSDO 2007 110
Mid and West Wales 4
North Wales 3
South East Wales 1
Wales Total 8
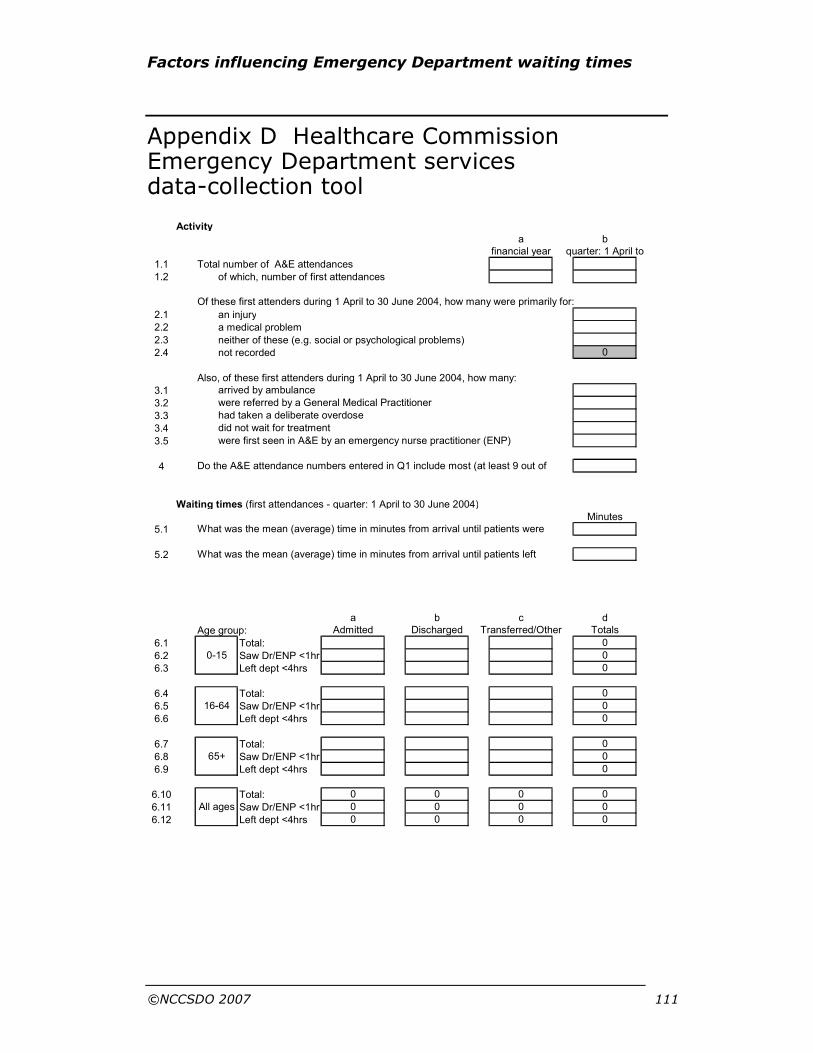
Factors influencing Emergency Department waiting times
©NCCSDO 2007 111
Appendix D Healthcare Commission Emergency Department services data-collection tool
Activity
a b
1.1 Total number of A&E attendances
1.2 of which, number of first attendances
2.1 an injury
2.2 a medical problem
2.3 neither of these (e.g. social or psychological problems)
2.4 not recorded
Also, of these first attenders during 1 April to 30 June 2004, how many:
3.1
3.2
3.3
3.4
3.5
4
Waiting times (first attendances - quarter: 1 April to 30 June 2004)
Minutes
5.1
5.2
a b c d
Age group:
6.1 Total:
6.2 Saw Dr/ENP <1hr
6.3 Left dept <4hrs
6.4 Total:
6.5 Saw Dr/ENP <1hr
6.6 Left dept <4hrs
6.7 Total:
6.8 Saw Dr/ENP <1hr
6.9 Left dept <4hrs
6.10 Total:
6.11 Saw Dr/ENP <1hr
6.12 Left dept <4hrs 0 0 0 0
0
All ages
0 0 0 0
0 0 0 0
0
065+
0
0
16-64
0
0
0
00-15
Admitted Discharged Transferred/Other Totals
What was the mean (average) time in minutes from arrival until patients were
What was the mean (average) time in minutes from arrival until patients left
were first seen in A&E by an emergency nurse practitioner (ENP)
Do the A&E attendance numbers entered in Q1 include most (at least 9 out of
had taken a deliberate overdose
did not wait for treatment
0
arrived by ambulance
were referred by a General Medical Practitioner
Of these first attenders during 1 April to 30 June 2004, how many were primarily for:
financial year quarter: 1 April to
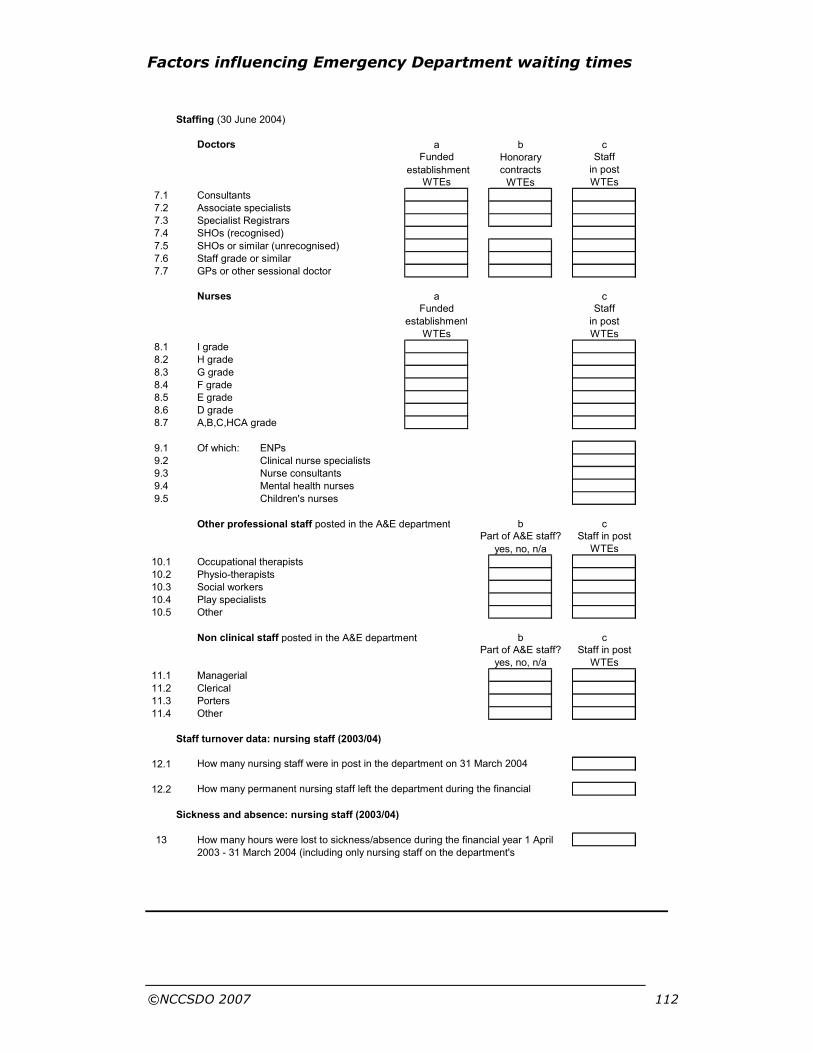
Factors influencing Emergency Department waiting times
©NCCSDO 2007 112
Staffing (30 June 2004)
Doctors a b c
Honorary
establishment contracts
WTEs
7.1 Consultants
7.2 Associate specialists
7.3 Specialist Registrars
7.4 SHOs (recognised)
7.5 SHOs or similar (unrecognised)
7.6 Staff grade or similar
7.7 GPs or other sessional doctor
Nurses a c
8.1 I grade
8.2 H grade
8.3 G grade
8.4 F grade
8.5 E grade
8.6 D grade
8.7 A,B,C,HCA grade
9.1 Of which: ENPs
9.2 Clinical nurse specialists
9.3 Nurse consultants
9.4 Mental health nurses
9.5 Children's nurses
Other professional staff posted in the A&E department b c
10.1 Occupational therapists
10.2 Physio-therapists
10.3 Social workers
10.4 Play specialists
10.5 Other
Non clinical staff posted in the A&E department b c
11.1 Managerial
11.2 Clerical
11.3 Porters
11.4 Other
Staff turnover data: nursing staff (2003/04)
12.1
12.2
Sickness and absence: nursing staff (2003/04)
13 How many hours were lost to sickness/absence during the financial year 1 April
2003 - 31 March 2004 (including only nursing staff on the department's
How many nursing staff were in post in the department on 31 March 2004
How many permanent nursing staff left the department during the financial
Part of A&E staff? Staff in post
yes, no, n/a WTEs
yes, no, n/a WTEs
Part of A&E staff? Staff in post
establishment in post
WTEs WTEs
Funded Staff
Funded Staff
in post
WTEs WTEs

Factors influencing Emergency Department waiting times
©NCCSDO 2007 113
Budgets
Financial year 2003/04 - provisional outturn
14.1 Trust (total)
14.2 A&E department total
Quarter: 1 April to 39 June 2004 - budget and provisional outturn
a b
15.1 A&E department total
15.2 of which: Medical pay
15.3 Nursing Pay
15.4 Other Pay
15.5 Non pay
Facilities (as at 30 June 2004)
Cubicles
16.1 Number of cubicles
16.2 of which majors
16.3 Number of resuscitation bays
16.4 Treatment or consulting rooms
Children's facilities
17.1 Do you have dedicated facilities for examining and treating children?
If yes:
for how many hours a day on average are these dedicated facilities staffed and open?
a b c
Monday to Friday Saturday Sunday
17.2
A&E wards
18.1 Do you have a ward under A&E management and staffed by A&E nurses?
If yes:
18.2
18.3 Do these beds meet SITREP standards? (
18.4 (
18.5
18.6 How many of these patients stayed on this ward for less than 2 nights?
18.7 How many were transferred from the A&E ward to another in the hospital?
Computer systems in A&E
19.1
19.2 Can it track patients in real time through stages in A&E?
19.3 Is it used for this purpose?
19.4
If question 6 was fully completed (times in department/to doctor by age),
19.5 did this require specialist help from outside the A&E department?
19.6 Can it import patient information from your PAS system?
19.7 Can it export patient information to your PAS system?
20.1
20.2
Does your department have access to electronic reporting of pathology results?
Does your department have PACS (for electronic access to radiology images)?
Can it produce routine reports on numbers waiting less than 4
hours in the department?
Please select the make of your A&E computer system
(or 'no system' or 'in-house') from the drop down list
How many patients were admitted to this ward during April-June 2004?
How many beds does it have?
[Please use
drop-down lists]Are A&E ward patients formally admitted (on PAS)?
Quarterly Quarterly
Outturn (£000s)

Factors influencing Emergency Department waiting times
©NCCSDO 2007 114
Appendix E Surveys
Lead clinician survey
Section 1
If a computer system is present in A&E:
1.1 Does your department routinely collect additional data to the emergency department minimum data-set?
1.2 What are the purposes for collecting additional data?
1.3 If other please specify purpose.
1.4 Is time seen/discharged etc. recorded manually or automatically by computer?
1.5 Does the computer system alert staff when patients are approaching acceptable limits of waiting time?
1.6 Is the computer system used for ordering investigations?
1.7 Are results of investigations available by computer?
1.8 If results of investigations are available by computer, does the computer alert staff when the results are ready?
X-ray
2.1 Does A&E have its own X-ray room?
2.2 If yes - number of rooms?
2.3 Is the X-ray facility used by A&E adjacent to/part of the department?
Availability of experienced A&E doctor
Record the hours a doctor with at least 6 months previous A&E experience is available. Use 24 hour clock.
3.1 Monday On site: From To On call: From To
3.2 Tuesday
3.3 Wednesday
3.4 Thursday
3.5 Friday
3.6 Saturday
3.7 Sunday
4.1 Does the department have any contingencies for covering medical staff sickness?
4.2 If yes please give details:
For each of the following clinical scenarios please indicate whether you
would investigate and treat the patient entirely in A&E, with the
intention of discharging them where appropriate (with follow-up if
necessary) or whether you would refer the patient for further inpatient
investigation. Assume results of any investigations undertaken are
normal.

Factors influencing Emergency Department waiting times
©NCCSDO 2007 115
Your answers should reflect the usual clinical practice within your
department during and outside of normal working hours.
For example, a 19-year-old woman presents having taken a witnessed
overdose of paracetamol 3 hours ago. She is alert and orientated and
haemodynamically normal.
If during normal working hours all investigations and mental health
assessment would be undertaken in A&E and the patient discharged,
tick ’A&E’.
If outside working hours paracetamol levels were below that which
required treatment, but the patient was admitted overnight to await
mental health assessment the next day tick ’Refer’.
35-year-old man who experienced a 1-hour episode of cardiac-sounding chest
pain immediately prior to presentation but who is now pain free. ECG normal.
5.1 During ‘normal working hours’
5.2 Outside of ‘normal working hours’ □
27-year-old women with pleuritic chest pain and normal observations who is
suspected of having a pulmonary embolism.
6.1 During ‘normal working hours’ □
6.2 Outside of ‘normal working hours’ □
40-year-old man with suspected renal colic.
7.1 During ‘normal working hours’ □
7.2 Outside of ‘normal working hours’ □
54-year-old man with unilateral swollen leg suspected of having a deep-vein
thrombosis.
8.1 During ‘normal working hours’ □
8.2 Outside of ‘normal working hours’ □
39-year-old woman with sudden onset of severe headache.
9.1 During ‘normal working hours’ □
9.2 Outside of ‘normal working hours’ □
73-year-old man who collapsed while shopping, losing consciousness for
2 minutes.
10.1 During ‘normal working hours’ □
10.2 Outside of ‘normal working hours’ □
26-year-old male with frank haematuria after being kicked in the flank.
Heamodynamically normal. No other injuries.
11.1 During ‘normal working hours’ □
11.2 Outside of ‘normal working hours’ □
64-year-old man with known ischaemic heart disease who had a 6-hour episode
of chest pain 8 hours ago.
12.1 During ‘normal working hours’ □
12.2 Outside of ‘normal working hours’ □

Factors influencing Emergency Department waiting times
©NCCSDO 2007 116
32-year-old woman with a spontaneous pneumothorax, <20%. No underlying
respiratory problems.
13.1 During ‘normal working hours’ □
13.2 Outside of ‘normal working hours’ □
73-year-old women with a closed, displaced distal radial fracture that requires
manipulation.
14.1 During ‘normal working hours’ □
14.2 Outside of ‘normal working hours’ □
If the department treats children as well as adults please complete the
following three scenarios, otherwise go to question 15.1
A four-year-old child presenting with a painful hip and limping
P1.1 During ‘normal working hours’ □
P1.2 Outside of ‘normal working hours’ □
A 12-year-old child with a moderately severe exacerbation of asthma. PEFR
60% of predicted.
P2.1 During ‘normal working hours’ □
P2.2 Outside of ‘normal working hours’ □
A 2-year-old child who is systemically unwell and has a temperature of 39.60.
P3.1 During ‘normal working hours’ □
P3.2 Outside of ‘normal working hours’ □
Section 2
15.1 How often do general staff meetings occur?
Are all staff able to contribute to these meetings?
Please tick yes or no on the items below:
Yes No
15.2 Doctors
15.3 Nurses
15.4 Admin staff
15.5 Managers
15.6 PAMS
15.7 P&T
15.8 Ancillary staff
Other; please specify 15.9
Specify other
16.1 Do you have teamworking in the A&E department? (circle appropriate answer)
1=None 2=Little 3=A fair amount
4=A lot 5=A very great deal

Factors influencing Emergency Department waiting times
©NCCSDO 2007 117
Who is included in the A&E team?
Generated Prompted
17.1 Doctors [1] [2] Yes [0] No
17.2 Nurses
17.3 Admin Staff
17.4 Managers
17.5 PAMS
17.6 P&T
17.7 Ancillary Staff
17.8
Others (please specify)
Specify
Instructions to interviewer: If the interviewee answers spontaneously
tick the box marked generated. If you have to prompt tick the box in
the ‘Prompted’ column appropriate to the interviewee’s answer
To what extent does each of the following make decisions in
the A&E team?
None Little A fair
amount
A lot A very
great
deal
18.1 Doctors
18.2 Nurses
18.3 Admin Staff
18.4 Managers
18.5 PAMS
18.6 P&T
18.7 Ancillary Staff
18.8 Others
Specify others
To what extent are staff able to contribute to team working in
the A&E team?
None Little A fair
amount
A lot A very
great
deal
19.1 Doctors
19.2 Nurses
19.3 Admin Staff
19.4 Managers
19.5 PAMS
19.6 P&T
19.7 Ancillary

Factors influencing Emergency Department waiting times
©NCCSDO 2007 118
Staff
19.8 Others
Specify others

Factors influencing Emergency Department waiting times
©NCCSDO 2007 119
Answer the following questions for each of the staff groups listed using a number from the following scale.
1=not at all
2=just a little
3=moderate amount
4=quite a lot
5=a great deal
Doctors Nurses Admin
staff
Managers PAMS P&T Ancillary
staff
20.1 To what extent can these staff carry out their work in the way they think best?
20.2 How often do these staff have enough time to carry out their work?
20.3 Do these staff have clear, planned goals and objectives for their jobs?
20.4 How often do these staff receive conflicting instructions from two or more people?
20.5 How often do these staff have to do an acceptable minimum of work rather than doing the best-quality work possible?
20.6 To what extent do these staff have a good idea of how well they are performing in their work?
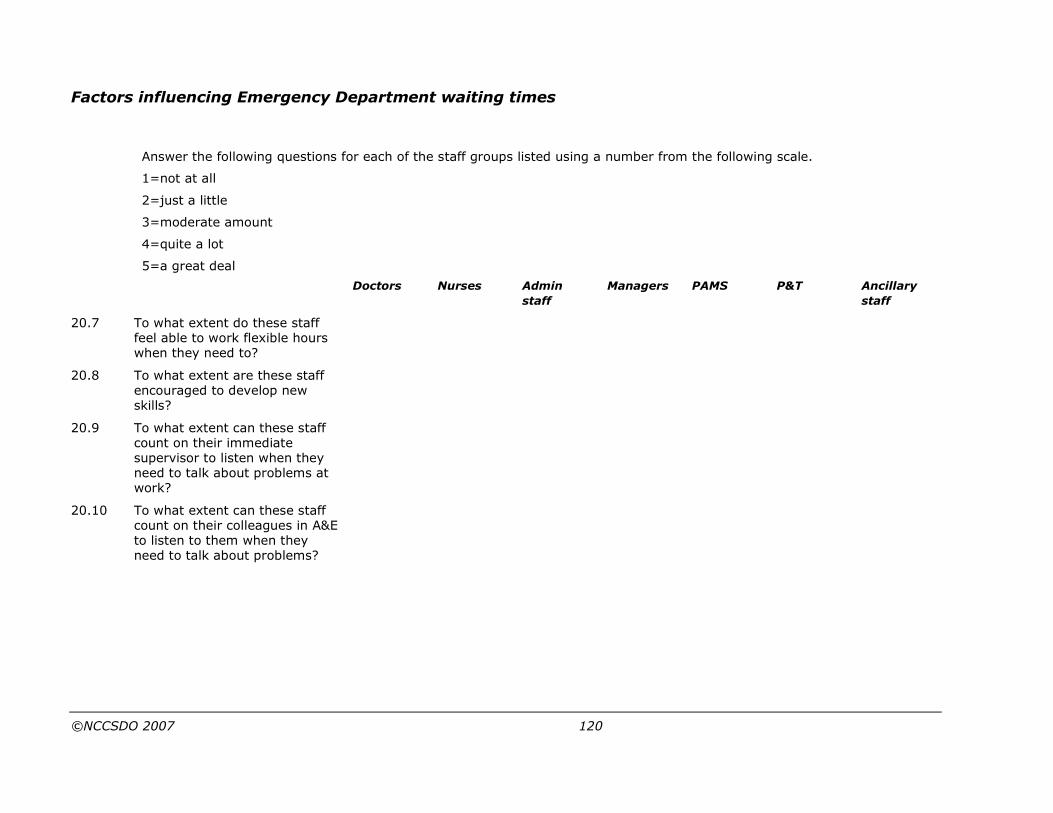
Factors influencing Emergency Department waiting times
©NCCSDO 2007 120
Answer the following questions for each of the staff groups listed using a number from the following scale.
1=not at all
2=just a little
3=moderate amount
4=quite a lot
5=a great deal
Doctors Nurses Admin
staff
Managers PAMS P&T Ancillary
staff
20.7 To what extent do these staff feel able to work flexible hours when they need to?
20.8 To what extent are these staff encouraged to develop new skills?
20.9 To what extent can these staff count on their immediate supervisor to listen when they need to talk about problems at work?
20.10 To what extent can these staff count on their colleagues in A&E to listen to them when they need to talk about problems?

Factors influencing Emergency Department waiting times
©NCCSDO 2007 121
Please rate your A&E department using the scale relative to other A&E
departments on the following.
1=most worse
2=worse
3=same
4=better
5=much better
Your view Trust view
21.1 Confidence and trust in colleagues
21.2 Collaboration amongst staff groups in A&E
21.3 Collaboration with other departments in the Trust
21.4 Morale
21.5 Effectiveness
Using the scale, how does the Trust view the A&E department with
regard to the following?
1=very poor
2=poor
3=adequate
4=good
5=very good
Rating
22.1 Confidence and trust in colleagues
22.2 Collaboration amongst staff groups in A&E
22.3 Collaboration with other departments in the Trust
22.4 Morale
22.5 Effectiveness
23.1 Which of the following best describes your management style? Tick one response, �.
Tell
Sell
Consult
Join
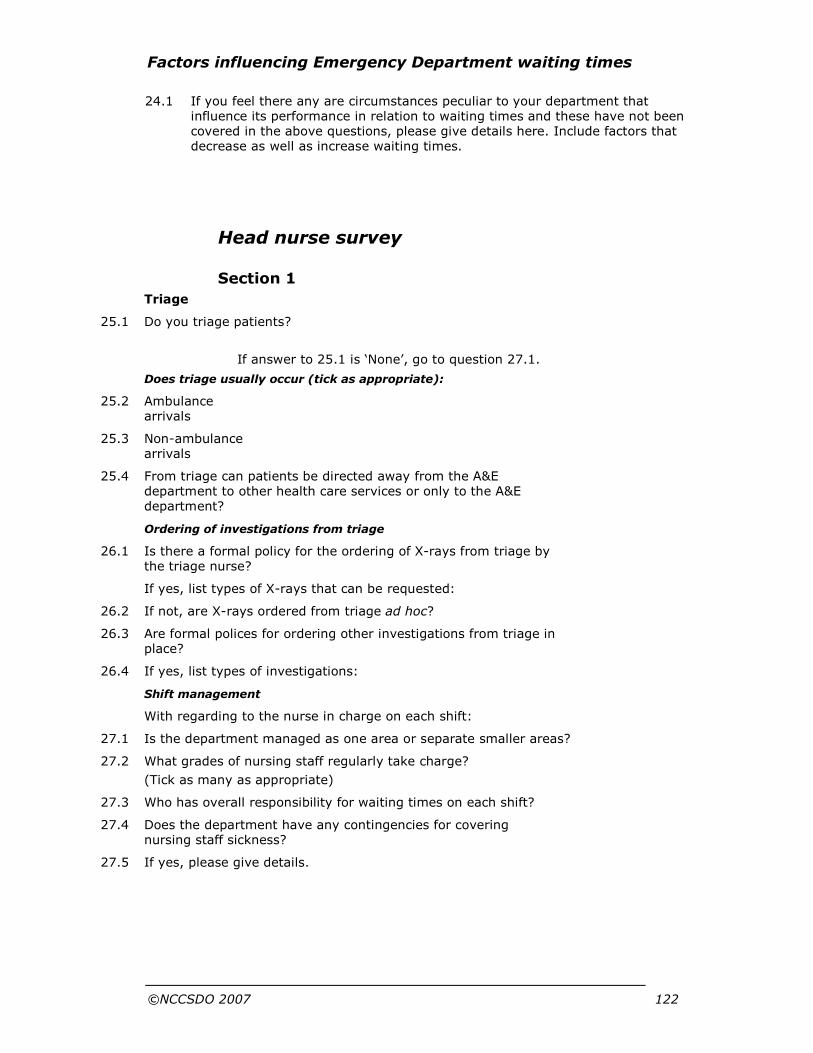
Factors influencing Emergency Department waiting times
©NCCSDO 2007 122
24.1
If you feel there any are circumstances peculiar to your department that influence its performance in relation to waiting times and these have not been covered in the above questions, please give details here. Include factors that decrease as well as increase waiting times.
Head nurse survey
Section 1
Triage
25.1 Do you triage patients?
If answer to 25.1 is ‘None’, go to question 27.1.
Does triage usually occur (tick as appropriate):
25.2 Ambulance arrivals
25.3 Non-ambulance arrivals
25.4 From triage can patients be directed away from the A&E department to other health care services or only to the A&E department?
Ordering of investigations from triage
26.1 Is there a formal policy for the ordering of X-rays from triage by the triage nurse?
If yes, list types of X-rays that can be requested:
26.2 If not, are X-rays ordered from triage ad hoc?
26.3 Are formal polices for ordering other investigations from triage in place?
26.4 If yes, list types of investigations:
Shift management
With regarding to the nurse in charge on each shift:
27.1 Is the department managed as one area or separate smaller areas?
27.2 What grades of nursing staff regularly take charge?
(Tick as many as appropriate)
27.3 Who has overall responsibility for waiting times on each shift?
27.4 Does the department have any contingencies for covering nursing staff sickness?
27.5 If yes, please give details.
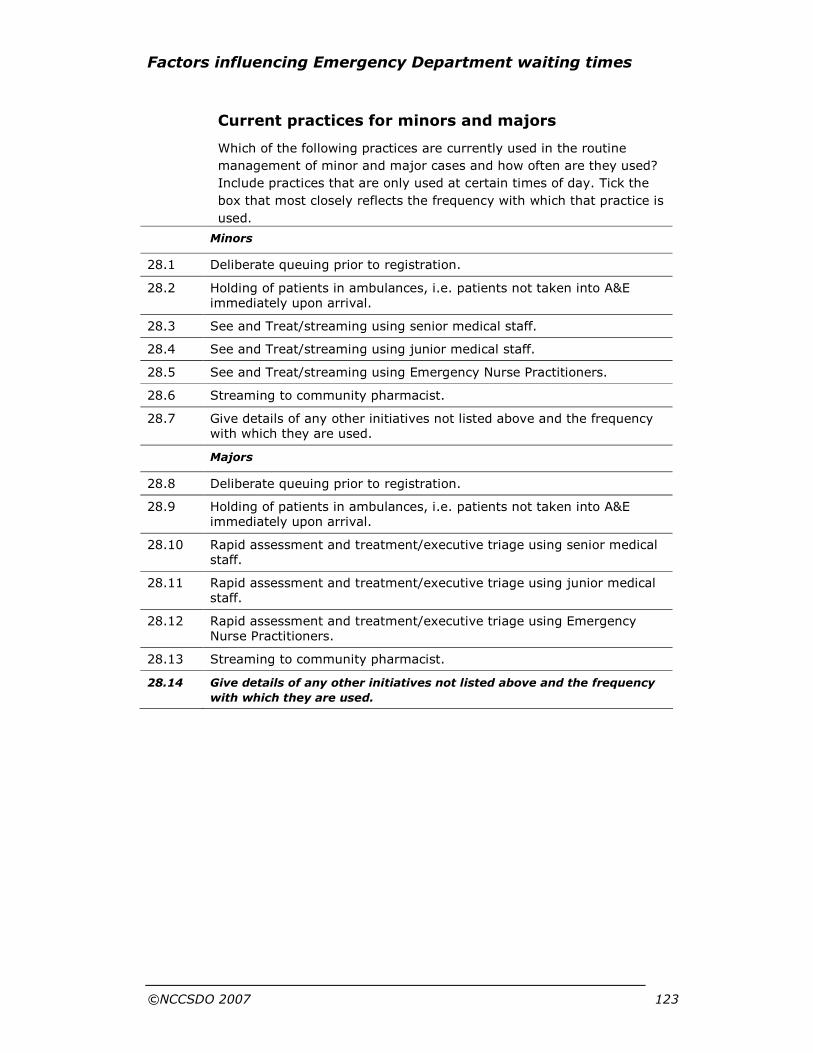
Factors influencing Emergency Department waiting times
©NCCSDO 2007 123
Current practices for minors and majors
Which of the following practices are currently used in the routine
management of minor and major cases and how often are they used?
Include practices that are only used at certain times of day. Tick the
box that most closely reflects the frequency with which that practice is
used.
Minors
28.1 Deliberate queuing prior to registration.
28.2 Holding of patients in ambulances, i.e. patients not taken into A&E immediately upon arrival.
28.3 See and Treat/streaming using senior medical staff.
28.4 See and Treat/streaming using junior medical staff.
28.5 See and Treat/streaming using Emergency Nurse Practitioners.
28.6 Streaming to community pharmacist.
28.7 Give details of any other initiatives not listed above and the frequency with which they are used.
Majors
28.8 Deliberate queuing prior to registration.
28.9 Holding of patients in ambulances, i.e. patients not taken into A&E immediately upon arrival.
28.10 Rapid assessment and treatment/executive triage using senior medical staff.
28.11 Rapid assessment and treatment/executive triage using junior medical staff.
28.12 Rapid assessment and treatment/executive triage using Emergency Nurse Practitioners.
28.13 Streaming to community pharmacist.
28.14 Give details of any other initiatives not listed above and the frequency
with which they are used.

Factors influencing Emergency Department waiting times
©NCCSDO 2007 124
Business manager survey
Department reference: «Index»
Trust: «Site_Name»
Hospital: «Address1»
Date completed____________________________
Interviewee’s name_________________________
Researcher________________________________
Section 1
39.1 Total Trust budget per annum (2003/04). £
For each of the following questions please give figures for all facilities
on the main A&E site but do not include budget/expenditure for
facilities that are on separate sites.
39.2 Total A&E budget per annum (2003/04). £
39.3 Total A&E expenditure per annum (2003/04). £
39.4 Total expenditure on staff in A&E per annum (2003/04). £
39.5 Total expenditure on medical staff locums per annum (2003/04). £
39.6 Total expenditure on bank/agency nurses per annum (2003/04). £
39.7 Total number of staff in the Trust.
Staff turnover/sickness
For questions 41.1 to 41.3 enter N/C if this data is not collected.
For turnover figures do not include staff employed on fixed
term/rotational contracts who would be expected to leave.
% Turnover of staff in A&E per annum (2003/04)
% Turnover of staff in the Trust per annum (2003/04)
Total days lost to sickness in A&E (2003/04)
Total days lost to sickness in the Trust (2003/04)
40.1 Medical
40.2 Nursing
40.3 Admin/support staff
41.1 Is the trust on one site? [1] Yes
[2] No
[99] Don’t know
41.2 Is A&E in its own directorate? [1] Yes
[2] No

Factors influencing Emergency Department waiting times
©NCCSDO 2007 125
[99] Don’t know
41.3 How long has the department existed in its current physical form?
41.4 How long has the department existed in its current management structure?
41.5 Are there any incentives for staff to reduce sickness absence? [1] Yes
[2] No
[99] Don’t know
41.6 If yes, please give details
41.7 Are there any incentives for staff to reduce waiting times? [1] Yes
[2] No
[99] Don’t know
41.8 If yes, please give details

Factors influencing Emergency Department waiting times
©NCCSDO 2007 126
A&E beds
Include only those facilities that form part of, or are staffed by, A&E.
Hours of opening
No.
of
beds
Counted as
admitted?
Conforms to Sitrep
guidelines?
Mon Tues Wed Thu Fri Sat Sun
[1] Yes [1] Yes From From From From From From From
[2] No [2] No
42.1 Observation ward
[99] Don’t know [99] Don’t know
To To To To To To To
[1] Yes [1] Yes From From From From From From From
[2] No [2] No
42.2 Clinical Decision Unit
[99] Don’t know [99] Don’t know
To To To To To To To
[1] Yes [1] Yes
[2] No [2] No
From From From From From From From 42.3 Chest pain observation unit
[99] Don’t know [99] Don’t know To To To To To To To
[1] Yes [1] Yes
[2] No [2] No
From From From From From From From 42.4 Other beds (please specify)
[99] Don’t know [99] Don’t know To To To To To To To
Specify other beds

Factors influencing Emergency Department waiting times
©NCCSDO 2007 127
Other on-site facilities
Answer joint if a facility is part of more than one Trust or managed only in part by
A&E.
Present on same
site as A&E
Is this facility part
of the same Trust as
A&E?
Is this facility
managed by A&E?
[1] Yes [1] Yes [1] Yes
[2] No [2] Joint [2] Joint
[3] No [3] No
43.1 Minor-injury unit
[99] Don’t know [99] Don’t know
[1] Yes [1] Yes [1] Yes
[2] No [2] Joint [2] Joint
[3] No [3] No
43.2 Minor-illness unit/walk-in centre
[99] Don’t know [99] Don’t know
[1] Yes [1] Yes [1] Yes
[2] No [2] Joint [2] Joint
[3] No [3] No
43.3 GP-staffed primary care unit
[99] Don’t know [99] Don’t know
Bed shortages
44.1 Does the A&E department have any policies for dealing with shortages of in-patient beds? (Do not include Trust policies)
[1] Yes
[2] No
[99] Don’t know
44.2 If yes, please give details:
44.3 Does the Trust have any policy for dealing with shortages of in-patient beds?
[1] Yes
[2] No
[99] Don’t know
44.4 If yes, please give details
Prolonged waits
45.1 [1] Yes
Does the department have any policy for dealing with exceptionally long waiting times in A&E?
[2] No
[99] Don’t know
45.2 If yes does this included:
(tick as many as apply) [1] Diversion of ambulances
[2] Calling in extra medical staff
[3] Calling in extra nursing staff
[4] Other measures
45.3 Patients who leave without being seen
46.1 Is an estimated time leaving recorded? [1] Yes

Factors influencing Emergency Department waiting times
©NCCSDO 2007 128
[2] No
[99] Don’t know
46.2 [1] Yes
Are these patients removed routinely from data analysis when submitting waiting times figures?
[2] No
[99] Don’t know
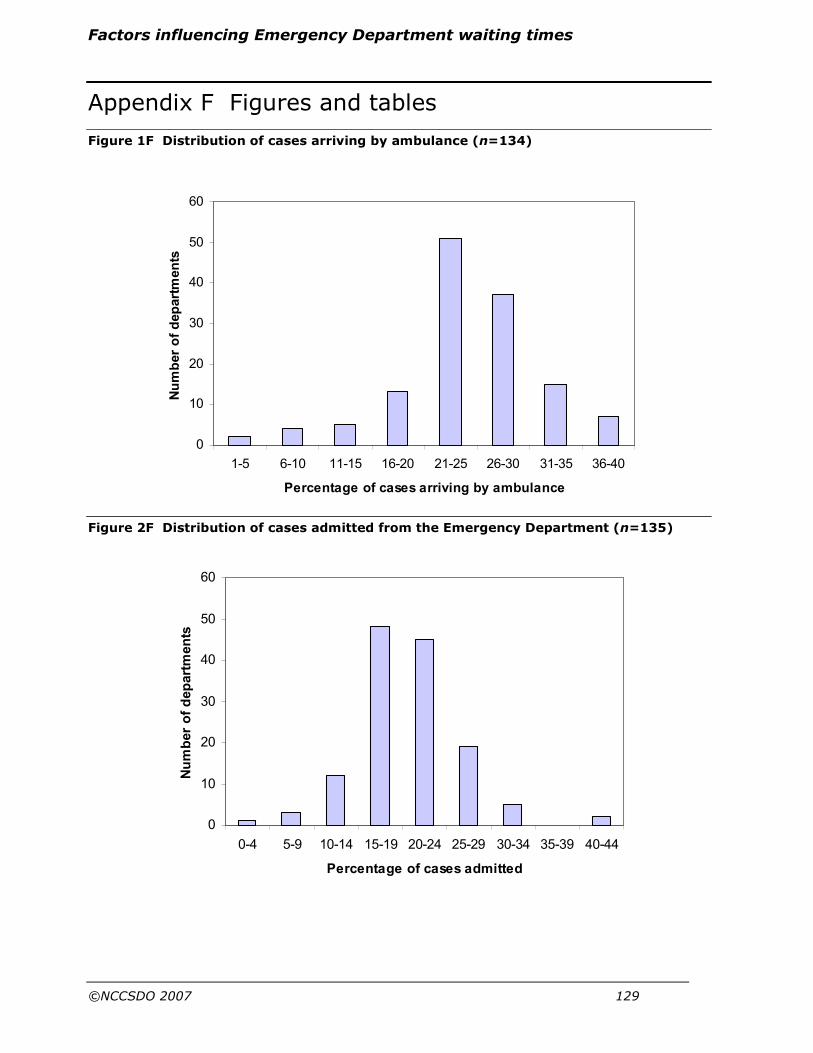
Factors influencing Emergency Department waiting times
©NCCSDO 2007 129
0
10
20
30
40
50
60
1-5 6-10 11-15 16-20 21-25 26-30 31-35 36-40
Percentage of cases arriving by ambulance
Number of departments
0
10
20
30
40
50
60
0-4 5-9 10-14 15-19 20-24 25-29 30-34 35-39 40-44
Percentage of cases admitted
Number of departments
Appendix F Figures and tables
Figure 1F Distribution of cases arriving by ambulance (n=134)
Figure 2F Distribution of cases admitted from the Emergency Department (n=135)

Factors influencing Emergency Department waiting times
©NCCSDO 2007 130
Figure 3F Comparison of waiting-time measures from the Healthcare Commission (HC)
and sample-month data (SM)
Dashed line, 95% limits of agreement; solid line, regression line.
Mean of HC and SM waiting time (minutes)
14012010080604020
SM
-HC
wa
itin
g t
ime
(m
inu
tes
)
40
20
0
-20
-40
-60
-80
-100
-120
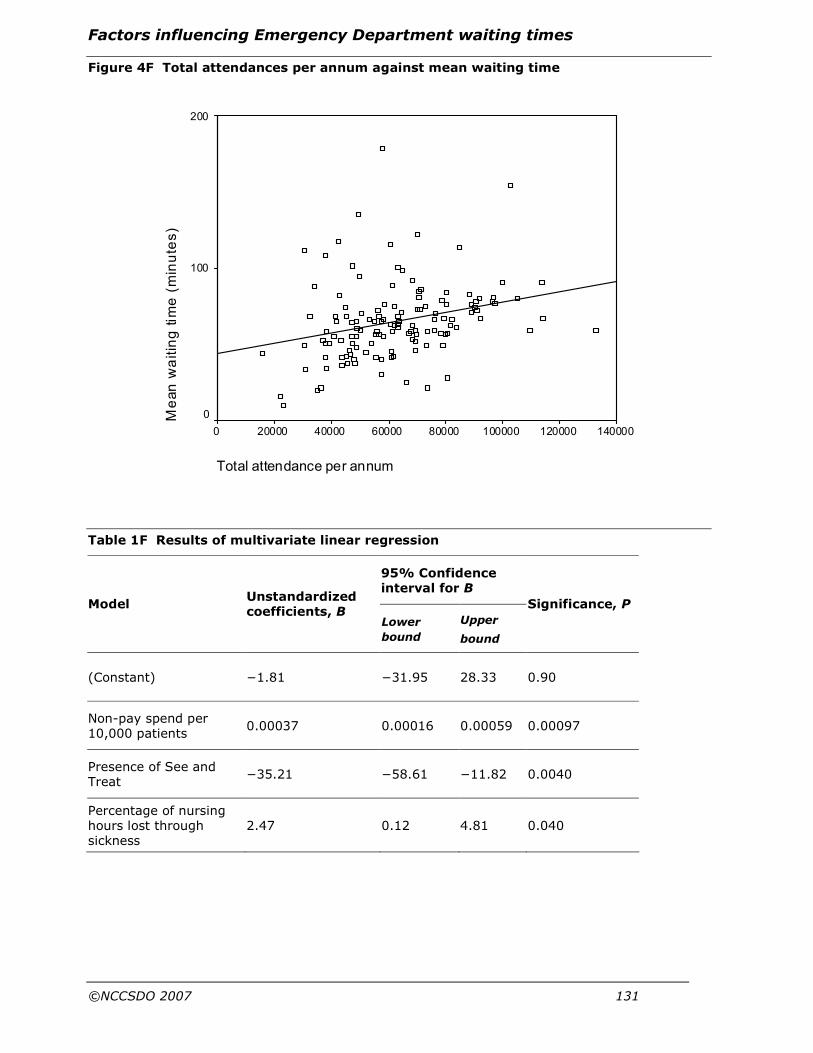
Factors influencing Emergency Department waiting times
©NCCSDO 2007 131
Figure 4F Total attendances per annum against mean waiting time
Table 1F Results of multivariate linear regression
95% Confidence interval for B
Model Unstandardized coefficients, B
Lower
bound
Upper
bound
Significance, P
(Constant) −1.81 −31.95 28.33 0.90
Non-pay spend per 10,000 patients
0.00037 0.00016 0.00059 0.00097
Presence of See and Treat
−35.21 −58.61 −11.82 0.0040
Percentage of nursing hours lost through sickness
2.47 0.12 4.81 0.040
Total attendance per annum
140000120000100000800006000040000200000
Me
an
wa
itin
g t
ime
(m
inu
tes
)
200
100
0

Factors influencing Emergency Department waiting times
©NCCSDO 2007 132
Table 2F Results of regression of management style on corrected waiting time
95% Confidence interval for B
Management style
Unstandardized coefficients, B Lower
bound
Upper
bound
Significance, P
Tell or sell 10.44 0.68 20.21 0.04 Lead clinician
Join −4.68 −16.97 7.61 0.45
Tell or sell 11.47 0.20 22.73 0.05 Head nurse
Join −10.04 −21.15 1.06 0.08
Tell or sell 8.18 −4.10 20.46 0.19 Business manager Join 4.58 −8.41 17.58 0.49

Factors influencing Emergency Department waiting times
©NCCSDO 2007 133
Table 3F Relationships seen where the lead clinician is described as having a participative management style
Relationship Lead clinician
Head nurse
Business manager
Overall
Inclusivity of
PAMs in meetings X2=0.014
+ve slope
X2=0
+ve slope
X2=3.287*
+ve slope
Ancillary staff in meetings X2=11.34¶
+ve slope
X2=0.075
+ve slope
X2=5.674 †
+ve slope
Out of 24 possible relationships between variables 18 match the trend of inclusivity being positively associated with a participative management style.
Reduced role conflict for
Doctors X2=0.705
-ve slope
X2=6.149‡
-ve slope
X2=1.859
-ve slope
Nurses X2=0.917
-ve slope
X2=4.779†
-ve slope
X2=0.747
-ve slope
Administrative staff X2=1.164
-ve slope
X2=1.924
-ve slope
X2=0.012
-ve slope
Managers X2=3.993†
-ve slope
X2=2.435
-ve slope
X2=0.233
-ve slope
PAMs X2=0.386
-ve slope
X2=6.335†
-ve slope
X2=2.674
+ve slope
Ancillary staff X2=0.053
-ve slope
X2=7.371‡
-ve slope
X2=0.173
-ve slope
Out of 21 possible relationships between variables 19 match the trend of participative management style being associated with less role conflict for various staff groups.
Increased feedback on work performance for
Doctors X2=0.007
+ve slope
X2=1.894
+ve slope
X2=2.649
+ve slope
Nurses X2=0.237
+ve slope
X2=0.004
+ve slope
X2=2.33
+ve slope
Administrative staff X2=0.577
+ve slope
X2=0.08
+ve slope
X2=2.024
+ve slope
Managers X2=2.365
+ve slope
X2=0.575
+ve slope
X2=7.743
+ve slope
Out of 21 possible relationships between variables 17 match the trend of participative management style being associated with increased feedback on performance for various staff groups.

Factors influencing Emergency Department waiting times
©NCCSDO 2007 134
Ancillary staff X2=2.206
+ve slope
X2=1.047
-ve slope
X2=3.95*
+ve slope
Increased leader support for
Doctors X2=0.939
+ve slope
X2=0.327
+ve slope
X2=1.451
+ve slope
Nurses X2=0.134
+ve slope
X2=1.106
+ve slope
X2=3.529*
+ve slope
Administrative staff X2=0.287
+ve slope
X2=0.476
+ve slope
X2=3.742†
+ve slope
Managers
Ancillary staff
X2=0.214
+ve slope
X2=0.102
+ve slope
X2=0.655
+ve slope
X2=0.357
+ve slope
X2=3.829†
+ve slope
X2=5.85‡
+ve slope
Out of 21 possible relationships between variables 18 match the trend of participative management style being associated with increased leader support for various staff groups.
Reduced autonomy and control for
Doctors X2=1.441
-ve slope
X2=0.244
+ve slope
X2=0.025
+ve slope
Nurses X2=5.003†
-ve slope
X2=0.224
-ve slope
X2=0.203
-ve slope
Administrative staff X2=0.756
-ve slope
X2=1.717
-ve slope
X2=0.39
+ve slope
Managers X2=0.016
-ve slope
X2=6.303‡
-ve slope
X2=0.216
-ve slope
Out of 21 possible relationships between variables 11 match the trend of participative management style being associated with decreased autonomy and control for various staff groups.
In 10 of the possible relationships, 21 describe the reverse trend with management style being associated with increased autonomy and control for various staff groups.
Collaboration outside the department
Collaboration with other departments in the Trust
X2=9.076¶
+ve slope
X2=4.825‡
+ve slope
X2=1.468
+ve slope
A participative management style is associated with increased collaboration with other departments in the Trust.
Morale in department
View of morale in department compared to other emergency departments
X2=4.179‡
+ve slope
X2=9.23¶
+ve slope
X2=1.878
+ve slope
A participative management style is associated with a more positive view of the moral within the department.
P<0.10*, P<0.05†, P<0.01‡, P<0.001¶; -ve, negative; +ve, positive.

Factors influencing Emergency Department waiting times
©NCCSDO 2007 135
Table 4F Final template for qualitative analysis
1 Things that prevent people leaving emergency department
a Access
1 Access to primary care
i Social services
ii Mental health
iii GP
2 Access to secondary care
i Pathology
ii X-ray
iii Other services
b Hospital management
i IT system
ii Communication
1 Communication of patient information
2 Communication and co-operation between agencies and departments
c Absence of services
d Transfers out of the hospital (by ambulance)
i Elderly patients
ii Availability of services
iii Funding for Emergency Department paramedic teams
e Bed shortages and bed management
i Discharges from wards
ii Lack of beds
iii Lack of porters
iv Obtaining specialist opinion
f Management of Emergency Department
i Sickness absence
ii Appropriate allocation of staff to meet demand
iii Conflict between nurses and doctors
iv Physical issues, e.g. space, equipment, food and drink
v Lack of experience/training/leadership
vi Lack of role clarity
g Working practices associated with the 4-hour targets
i Moving people into wards to meet targets
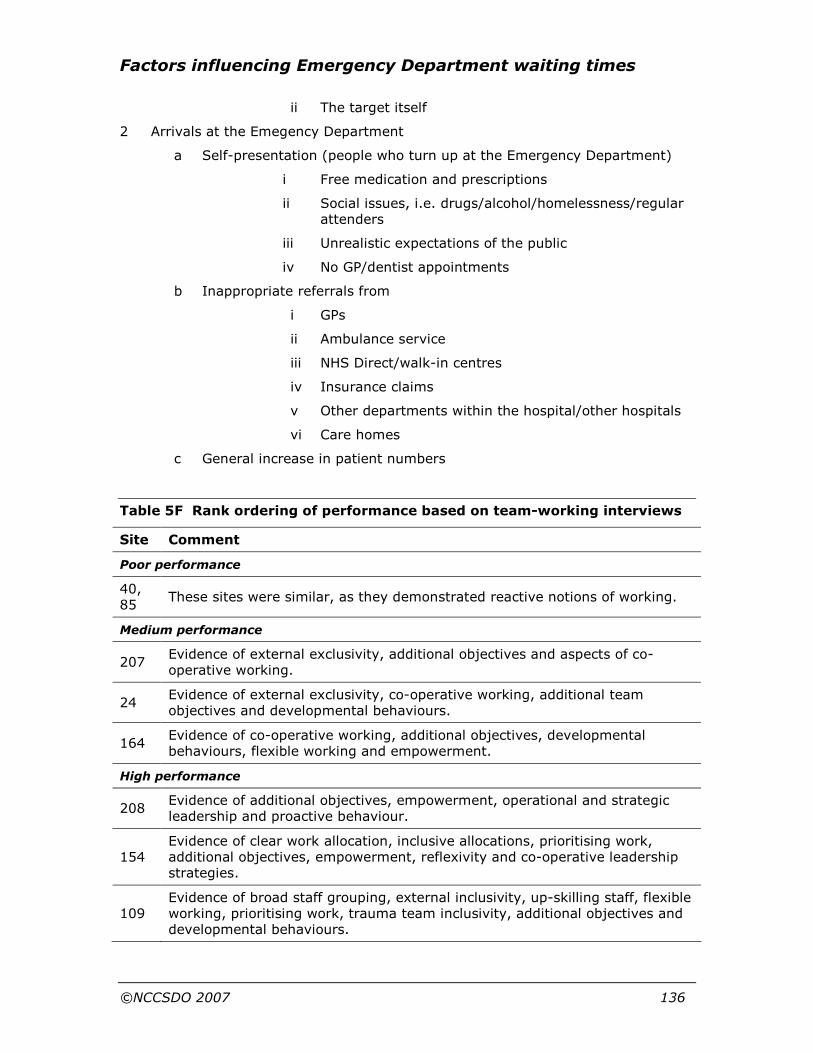
Factors influencing Emergency Department waiting times
©NCCSDO 2007 136
ii The target itself
2 Arrivals at the Emegency Department
a Self-presentation (people who turn up at the Emergency Department)
i Free medication and prescriptions
ii Social issues, i.e. drugs/alcohol/homelessness/regular attenders
iii Unrealistic expectations of the public
iv No GP/dentist appointments
b Inappropriate referrals from
i GPs
ii Ambulance service
iii NHS Direct/walk-in centres
iv Insurance claims
v Other departments within the hospital/other hospitals
vi Care homes
c General increase in patient numbers
Table 5F Rank ordering of performance based on team-working interviews
Site Comment
Poor performance
40, 85
These sites were similar, as they demonstrated reactive notions of working.
Medium performance
207 Evidence of external exclusivity, additional objectives and aspects of co-operative working.
24 Evidence of external exclusivity, co-operative working, additional team objectives and developmental behaviours.
164 Evidence of co-operative working, additional objectives, developmental behaviours, flexible working and empowerment.
High performance
208 Evidence of additional objectives, empowerment, operational and strategic leadership and proactive behaviour.
154 Evidence of clear work allocation, inclusive allocations, prioritising work, additional objectives, empowerment, reflexivity and co-operative leadership strategies.
109 Evidence of broad staff grouping, external inclusivity, up-skilling staff, flexible working, prioritising work, trauma team inclusivity, additional objectives and developmental behaviours.
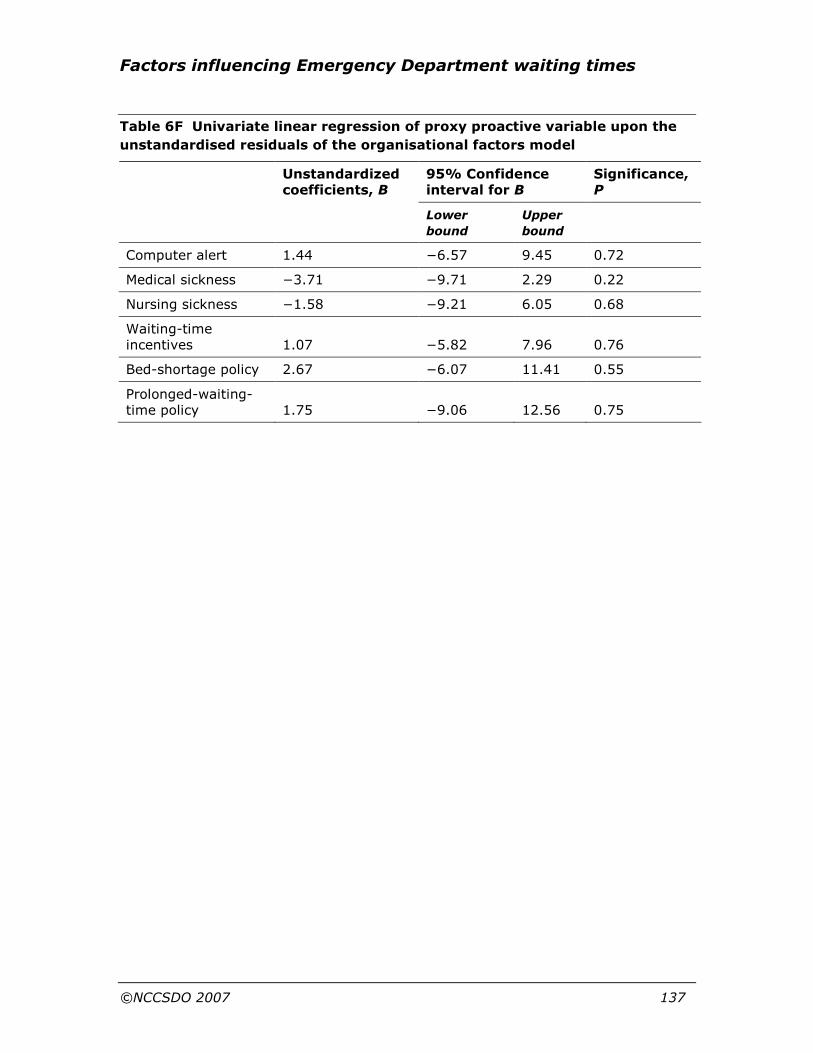
Factors influencing Emergency Department waiting times
©NCCSDO 2007 137
Table 6F Univariate linear regression of proxy proactive variable upon the
unstandardised residuals of the organisational factors model
95% Confidence interval for B
Significance, P
Unstandardized coefficients, B
Lower
bound
Upper
bound
Computer alert 1.44 −6.57 9.45 0.72
Medical sickness −3.71 −9.71 2.29 0.22
Nursing sickness −1.58 −9.21 6.05 0.68
Waiting-time incentives 1.07 −5.82 7.96 0.76
Bed-shortage policy 2.67 −6.07 11.41 0.55
Prolonged-waiting-time policy 1.75 −9.06 12.56 0.75

Factors influencing Emergency Department waiting times
©NCCSDO 2007 138
Appendix G Research Governance delays
Research Governance approval was obtained in the 112 sites participating
in Phase One of the study. This process caused considerable delays in
some sites. The mean time from submission of an application to receipt of
Research Governance approval was 63 days, with a maximum of
182 days. The distribution of the time taken to receive approval is shown
in Figure 1G.
Figure 1G Distribution of time from application submission to receipt of
Research Governance approval
0
5
10
15
20
25
30
35
40
0-19
20-39
40-59
60-79
80-99
100-119
120-139
140-159
>159
Time from application submission to receipt of Research
Governance approval (days)
Number of sites
Interim analysis
As a result of the delays experienced in obtaining Research Governance
approval in some sites participating in Phase One of the study it was
decided to perform an interim analysis in order to select the sites to be
invited to participate in Phase Two of the study.
At the time the interim analysis was undertaken only two-thirds of the
Phase One interview data were available. It was therefore decided to base
this analysis on the data collected by the Healthcare Commission, as this
was almost complete at the time of the analysis.
To generate the most generalisable model possible, data from all
potential sites were included, not just those that had consented to the
study.

Factors influencing Emergency Department waiting times
©NCCSDO 2007 139
To maintain the focus upon only organisational factors that might
influence the mean waiting time, the analysis was undertaken in the
following way.
Step 1 Controlling for variations in case-mix and size
To control for variations in performance arising from differences in
case-mix and department size, the following factors were controlled for:
• percentage arriving by ambulance,
• percentage of GP referrals,
• percentage aged over 65,
• percentage of children,
• percentage with deliberate overdose,
• percentage of medical cases,
• percentage of injuries,
• percentage admitted,
• percentage discharged,
• total attendances per annum.
Step 2 Univariate analysis of organisational factors
Having controlled for the above variables, each remaining variable
recorded by the Healthcare Commission was assessed for its ability to
predict the dependent variable.
Step 3 Multivariate analysis of organisational factors
Those factors shown to be potentially predictive (P<0.1) in the preceding
step were then entered into a linear regression model using a stepwise
elimination algorithm. The factors shown to be predictive in this model
are listed in Table 1G.
Table 1G Results of the multivariate model
95% Confidence interval
B Lower
bound
Upper
bound
Significance, P
Non-Pay over-/under-spend 0.13 0.03 0.23 0.01
Emergency Department ward present 11.38 0.17 22.58 0.05
Emergency Nurse Practitioners (whole-time equivalents per 10,000 patients)
9.47 1.19 17.75 0.03
Percentage of child nurses −0.83 −1.63 −0.04 0.04

Factors influencing Emergency Department waiting times
©NCCSDO 2007 140
Step 4 Selection of departments to be invited to
participate in Phase Two
Each department was ranked in descending order of the unstandardised
residuals obtained from the model in step 3. The top, middle and bottom
10 departments according to the model were then selected, to provide a
sample of sites in which the models predicted well or over-/under-
predicted the mean waiting time.
Of these 30 sites nine did not participate in the study (four from the top
10, two from the middle 10 and three from the bottom 10). Sites showing
an extreme of a particular characteristic (for example, department size)
were also excluded as these were likely to be unrepresentative. Five
departments from each group were then invited to participate.

Factors influencing Emergency Department waiting times
©NCCSDO 2007 141
Appendix H A survey on working in the Accident and Emergency Department
ID____________________
This identification number will be kept separately from your name.
A survey on working in the Accident and Emergency department
What is this survey?
This is a survey of your views and opinions of the job that you do, and of
the Accident and Emergency department where you work. This is not a
test. There are no right or wrong answers.
We want to know your personal views on the issues raised in the
questionnaire. Please read each question carefully, but give your
immediate response by ticking the box � that best matches your views.
Who will see my answers?
The information you give is totally confidential. Findings will be made
available to all who participate, but in such a way that it is not possible
for individuals to be identified. The Trust/department will at no time have
access to any of the questionnaires completed by individuals.
How do I fill in this survey?
Please complete the questionnaire for your current job or the job you do
most of the time. Please complete this at work, should you wish. The
survey will take about 15 minutes to complete.
What is covered by this survey?
The questionnaire is divided into five sections.
Section A
This section asks for background details about you and the work you do.
It is particularly important to us to have this information when we analyse
the questionnaire so that we can represent the views of different groups
of staff.

Factors influencing Emergency Department waiting times
©NCCSDO 2007 142
Section B
This section is concerned with your views of your job, and the department
where you work.
Section C
This section is concerned with working relationships.
Section D
This section is concerned with the A&E Department as a whole.
Section E
This section is concerned with your feelings towards your job and your
well-being and health more generally.
How should I respond?
For each statement you are asked to tick � one response that best fits
your views. Please answer all the questions as openly and honestly as
possible. Respond according to your first reaction. Do not spend too long
on one question.
For example, the question below is about who plans your work. If you
plan quite a lot of your own work, you would answer like this:
Not at all Just a little
Moderate
amount Quite a lot A great deal
To what extent do you plan your own work?
���� ���� ���� ���� ����
Now that you have read the instructions, please begin the survey. Please
read every question carefully before responding and answer every
question. Thank you.
Section A Background details
It is important that we know some of your background details. This will
enable us to represent the views of different groups of staff.
About your job
1. Length of time as an NHS employee: ……. years ……. months
2. Length of time as an employee in this A&E Department:
……. years ……. months
3. Length of time in current post:
……. years ……. months

Factors influencing Emergency Department waiting times
©NCCSDO 2007 143
The following questions require you to think of a typical full working
week. Include your on-call hours.
4. In your last full working week, how many hours were you contracted to work?
……. hours
5. What was the total number of extra hours worked in your last full working week?
……. hours
please go to Question 6
Not applicable � please go to Question
7
6. Were you able to choose whether or not you worked those extra hours?
Yes � No �
7. Are you on a fixed-term contract? Yes � No �
8. Do you work: Full-time � Part-time
� In a job share
�
About you
9. Age: ……. years
10. Are you? Male � Female �
11. Dependants:
a) Do you have any children? Yes � No �
b) Number of children and/or other dependants living at home:
………..
12. Were you born in Britain?
Yes � please go to
Question 14
No � please go to
Question 13
13. Approximately how long have you lived in Britain? ……. years
14. What is your ethnic background? (Please tick the one box that best describes your ethnic background)
White Mixed Asian or Asian British

Factors influencing Emergency Department waiting times
©NCCSDO 2007 144
British � White & Black British � British �
Irish � White & Black Caribbean � Chinese �
Other � White & Black African � Indian �
White & Asian � Pakistani � Black or Black British
Any other mixed background � Bangladeshi �
British � Any other Asian background �
Caribbean � Any other ethnic group
Africa � Please specify: ………………………………………………
Any other Black background �
Section B Your job
The following questions ask you to describe your job. Please answer all
the questions ticking the answer which best describes the job you do
most of the time.
15. The following questions concern the amount of choice you have in your job.
To what extent do you:
Not at
all
Just a
little
Moderate
amount
Quite
a lot
A great
deal
a. Determine the methods and procedures you use in your work?
� � � � �
b. Choose what work you will carry out? � � � � � c. Decide when to take a break? � � � � � d. Vary how you do your work? � � � � � e. Plan your own work? � � � � � f. Carry out your work in the way you think best? � � � � �
16. How often do you find these issues arising in carrying out your job?
Not at
all
Just a
little
Moderate
amount
Quite
a lot
A great
deal
a. I receive conflicting instructions from two or more people.
� � � � �
b. Professionals make conflicting demands on me. � � � � �

Factors influencing Emergency Department waiting times
©NCCSDO 2007 145
c. Managers make conflicting demands on me. � � � � � d. I do things at work, which are accepted by one
person, but not by another. � � � � �
17. How often do you find yourself meeting the following problems in carrying out your job?
Not at
all
Just a
little
Moderate
amount
Quite
a lot
A great
deal
a. I do not have enough time to carry out my work.
� � � � �
b. I cannot meet all the conflicting demands made on my time at work.
� � � � �
c. I never finish work feeling I have completed everything I should.
� � � � �
d. I am asked to do work without adequate resources to complete it.
� � � � �
e. I cannot follow best practice in the time available.
� � � � �
f. I am required to do basic tasks, which prevent me completing more important ones.
� � � � �
18. How true are the following of your job?
Not at
all
Just a
little
Moderate
amount
Quite
a lot
A great
deal
a. I have clear, planned goals and objectives for my job.
� � � � �
b. I know that I have divided my time properly. � � � � � c. I know what my responsibilities are. � � � � � d. Explanation is clear of what has to be done. � � � � � e. I know exactly what is expected of me. � � � � �
19. In your opinion, how often do staff in the Department meet the following problems in carrying out their work?
Not at
all
Just a
little
Moderate
amount
Quite
a lot
A great
deal
a. Having to make trade-offs between quality of patient care and cost savings.
� � � � �
b. Lack of clarity/agreement about the different responsibilities of doctors and nurses.
� � � � �
c. Being unable to achieve quality in their work because there are staff shortages.
� � � � �

Factors influencing Emergency Department waiting times
©NCCSDO 2007 146
d. Having to do an acceptable minimum of work rather than doing the best quality work possible.
� � � � �
20. The following statements concern the information you get about your work performance.
Strongly
disagree
Disagree Neither
agree nor
disagree
Agree Strongly
agree
a. I usually know whether or not my work is satisfactory in this job.
� � � � �
b. I often have trouble figuring out whether I’m doing well or poorly on this job.
� � � � �
c. Most people on this job have a pretty good idea of how well they are performing their work.
� � � � �
d. Most people on this job have trouble figuring out whether they are doing a good or bad job.
� � � � �
Would you please continue to the next section.
Section C Working relationships
The following questions ask you about the relationships you have at work.
Please answer all the questions, ticking the answer which best describes
how you feel.
21. The following questions deal with your working relationship with your immediate superior, that is, the person who most immediately supervises you and to whom you are responsible for your work. How much does your immediate supervisor:
To very
little
extent
To a
little
extent
To some
extent
To a
great
extent
To a very
great
extent
a. Encourage you to give your best effort? � � � � � b. Set an example by working hard him/herself? � � � � �
c. Offer new ideas for solving job related problems?
� � � � �
d. Encourage those who work for him/her to work as a team?
� � � � �
22. To what extent can you count on your immediate supervisor:
Not at
all
To a
small
extent
Neither
great nor
small
extent
To a
great
extent
Completely
a. To listen to you when you need to talk about problems at work?
� � � � �
b. To help you with a difficult task at work? � � � � �

Factors influencing Emergency Department waiting times
©NCCSDO 2007 147
23. This question concerns the influence you have over decisions at work. To what extent:
Not at all Just a
little
Moderate
amount
Quite
a lot
A great
deal
a. Can you influence what goes on in your work area as a whole?
� � � � �
b. Does your immediate superior ask for your opinion before making decisions affecting your work?
� � � � �
c. Do you have the opportunity to contribute to meetings on new work developments?
� � � � �
d. Are you allowed to participate in decisions, which affect you?
� � � � �
24. To what extent can you:
Not at all To a
small
extent
Neither
great nor
small
extent
To a
great
extent
Completely
a. Count on your colleagues to listen to you when you need to talk about problems?
� � � � �
b. Count on your colleagues to back you up at work?
� � � � �
c. Count on your colleagues to help you with a difficult task at work?
� � � � �
d. Really count on your colleagues to help you in a crisis situation at work, even though they would have to go out of their way to do so?
� � � � �
25. The following questions are about teamworking. To what extent:
a. Do you work as part of a clearly defined team? Yes � No �
b. Does your team have relatively clear objectives? Yes � No �
c. Do you frequently work with other team members in order to achieve these team objectives?
Yes � No �
d. Are there different roles for team members within this team?
Yes � No �
e. Is your team recognised by others in the Trust as a clearly defined work team to perform a specific function?
Yes � No �
26. The following questions are about safety in the workplace.

Factors influencing Emergency Department waiting times
©NCCSDO 2007 148
Strongly disagree
Disagree Neither agree nor disagree
Agree Strongly agree
a. I am involved in improving safety policy and practices.
� � � � �
b. If I think it will make work safer I initiate steps to improve work procedures.
� � � � �
c. If I see something unsafe, I go out of my way to address it.
� � � � �
d. I voluntarily carry out tasks or activities that help to improve workplace safety.
� � � � �
e. I always carry out my work in a safe manner.
� � � � �
f. I always report all safety-related incidents.
� � � � �
g. I sometimes cut corners if it makes the task easier.
� � � � �
h. I work as safely as I possibly can.
� � � � �
i. I do not take risks that could result in an accident.
� � � � �
j. I often make suggestions to improve how safety is handled around here.
� � � � �
k. I often try new approaches to improving workplace safety.
� � � � �
l. I often try to solve problems in ways that reduce safety risks.
� � � � �
27.
a.
In the past 12 months, how many times have you witnessed violence and aggression in the A&E department?
…….…….number of times
b. In the past 12 months how many of these incidents were officially reported?
………number of incidents
28. These questions concern types of work-related injuries you have sustained while working in the A&E department.
Never Once 2–3 times 4–5 times
More than 5 times
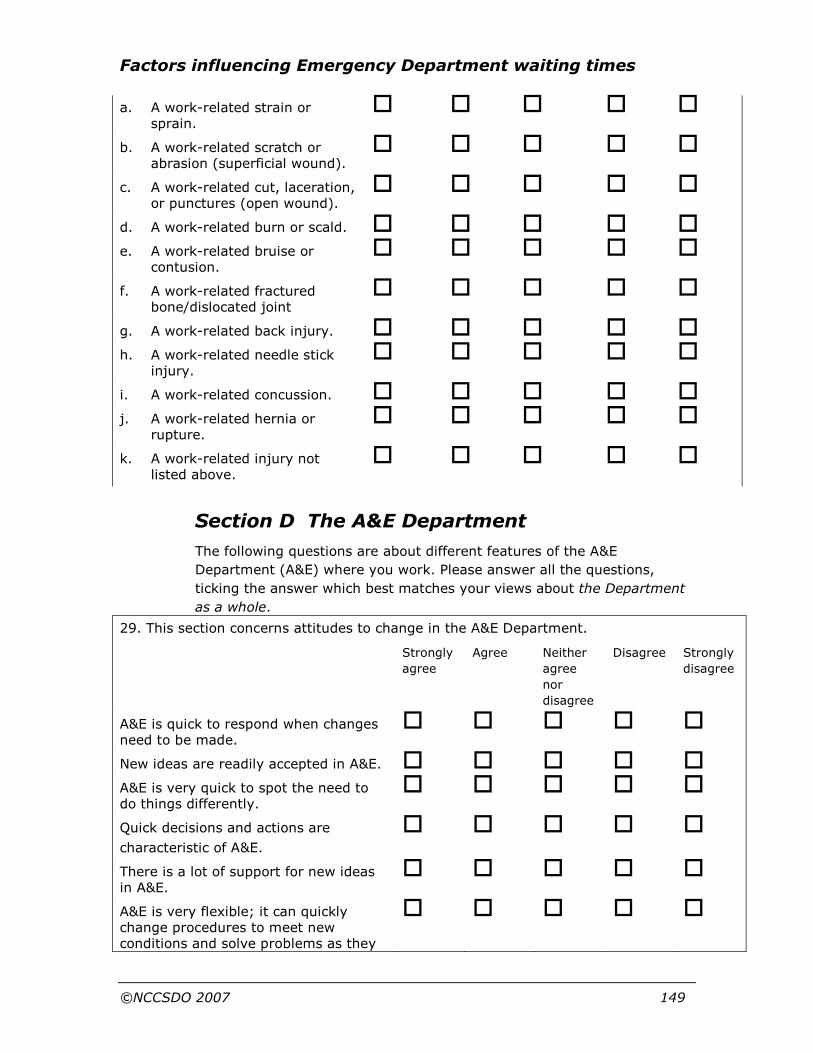
Factors influencing Emergency Department waiting times
©NCCSDO 2007 149
a. A work-related strain or sprain.
� � � � �
b. A work-related scratch or abrasion (superficial wound).
� � � � �
c. A work-related cut, laceration, or punctures (open wound).
� � � � �
d. A work-related burn or scald. � � � � �
e. A work-related bruise or contusion.
� � � � �
f. A work-related fractured bone/dislocated joint
� � � � �
g. A work-related back injury. � � � � �
h. A work-related needle stick injury.
� � � � �
i. A work-related concussion. � � � � �
j. A work-related hernia or rupture.
� � � � �
k. A work-related injury not listed above.
� � � � �
Section D The A&E Department
The following questions are about different features of the A&E
Department (A&E) where you work. Please answer all the questions,
ticking the answer which best matches your views about the Department
as a whole.
29. This section concerns attitudes to change in the A&E Department.
Strongly
agree
Agree Neither
agree
nor
disagree
Disagree Strongly
disagree
A&E is quick to respond when changes need to be made.
� � � � �
New ideas are readily accepted in A&E. � � � � �
A&E is very quick to spot the need to do things differently.
� � � � �
Quick decisions and actions are
characteristic of A&E.
� � � � �
There is a lot of support for new ideas in A&E.
� � � � �
A&E is very flexible; it can quickly change procedures to meet new conditions and solve problems as they
� � � � �

Factors influencing Emergency Department waiting times
©NCCSDO 2007 150
arise.
Please remember to answer these questions with your views of the A&E
Department as a whole.
30. This section concerns measurement and feedback on job performance in the A&E Department.
Strongly
agree
Agree Neither
agree nor
disagree
Disagree Strongly
disagree
Staff usually receive feedback on the quality of work they have done.
� � � � �
The way people do their jobs in A&E is rarely assessed.
� � � � �
In general it is hard for someone to measure the quality of their performance in A&E.
� � � � �
Staff performance is measured on a regular basis.
� � � � �
Staff don’t have any idea how well they’re doing in their jobs.
� � � � �
31. This section concerns how much freedom people in the A&E Department have to do their jobs in their own way.
Strongly
agree
Agree Neither
agree nor
disagree
Disagree Strongly
disagree
The management let people make their own decisions much of the time.
� � � � �
The management tightly control the work of those below them.
� � � � �
The management keep too tight a rein on the way things are done around here.
� � � � �
The management allow people to get on with their work without interfering.
� � � � �
The management trust people to take decisions.
� � � � �
The management allow people to carry out their work in the way they think best.
� � � � �
32. This section examines the amount of conflict and co-operation in the A&E Department.
Strongly Agree Neither
agree nor
Disagree Strongly

Factors influencing Emergency Department waiting times
©NCCSDO 2007 151
agree disagree disagree
There are a lot of petty rivalries in A&E.
� � � � �
People can rely on others to help out when they are overloaded with work in A&E.
� � � � �
There always seem to be quarrels going on in A&E.
� � � � �
People in A&E support one another. � � � � � People all pull together in A&E. � � � � � People can rely on one another in A&E. � � � � �
Please remember to answer these questions with your views of the A&E
Department as a whole.
33. This section concerns the provision of training in the A&E Department.
Strongly
agree
Agree Neither
agree nor
disagree
Disagree Strongly
disagree
a. The skills of staff are developed so that they can improve their job performance.
� � � � �
b. A&E strongly believes in the importance of training.
� � � � �
c. People are not properly trained in A&E when new procedures are introduced.
� � � � �
d. Staff are strongly encouraged to develop their skills in A&E.
� � � � �
e. Staff can only develop skills if they’re prepared to do it in their own time.
� � � � �
f. A&E only gives people the minimum amount of training they need to do their jobs.
� � � � �
34. This section examines the provision of resources in the Trust.
Strongly
agree
Agree Neither
agree nor
disagree
Disagree Strongly
disagree
Staff in A&E are well supplied with equipment.
� � � � �
There is inadequate work-space in A&E.
� � � � �

Factors influencing Emergency Department waiting times
©NCCSDO 2007 152
A&E is never short staffed. � � � � � Staff in A&E can’t do their jobs properly because of insufficient resources.
� � � � �
Staff in A&E often have to do the jobs
of two people.
� � � � �
Staff in A&E are always running out of supplies.
� � � � �
There is a shortage of trained staff in A&E.
� � � � �
35. This section examines how good communication is in the A&E Department.
Strongly
agree
Agree Neither
agree nor
disagree
Disagree Strongly
disagree
Communication in A&E is very good. � � � � �
Information is readily passed to all staff by A&E management.
� � � � �
There are many opportunities to inform A&E management of staff views.
� � � � �
Communication between management and staff is excellent in A&E.
� � � � �
Different sections of A&E do not keep each other informed about what’s going on.
� � � � �
Please remember to answer these questions with your views of the A&E
Department as a whole.
Section E Your well-being
The following questions ask you to describe things you like and dislike
about your work and your general well-being. Please answer all the
questions, ticking the answer which best describes what you do most of
the time.
36. The statements below concern how satisfied you feel with different aspects of your job. How satisfied are you with:
Extremely
dissatisfied
Very
dissatisfied
Moderately
dissatisfied
Not
sure
Moderately
satisfied
Very
satisfied
Extremely
satisfied
a. The physical work conditions?
� � � � � � �
b. The freedom to choose your own
� � � � � � �

Factors influencing Emergency Department waiting times
©NCCSDO 2007 153
method of working?
c. Your fellow workers? � � � � � � �
d. The recognition you get for good work?
� � � � � � �
e. Your immediate boss? � � � � � � �
f. The amount of responsibility you are given?
� � � � � � �
g. Your rate of pay? � � � � � � �
h. Your opportunity to use your abilities?
� � � � � � �
i.
Relations between management and other workers in the Department?
� � � � � � �
j. Your chance of promotion?
� � � � � � �
k. The way the Department is managed?
� � � � � � �
l. The attention paid to suggestions you make?
� � � � � � �
m. Your hours of work? � � � � � � �
n. The amount of variety in your job?
� � � � � � �
o. Your job security? � � � � � � �
p. The in-service training you receive?
� � � � � � �
q. Your physical security/safety?
� � � � � � �
The following questions ask you about your general well-being and
feelings towards your job. Please answer all the questions.
It is possible that completing some questions may draw your attention to
problems you experience. If you are worried that these are serious, we
would advise you to contact your GP.
37. Below are some questions, which deal with your health in general over the past months. Please circle the most appropriate answer for each question. Remember to concentrate on present and recent complaints, not those that you have had in the distant past.
Have you recently:
a. Been able to concentrate on Better than Same as Less than Much less

Factors influencing Emergency Department waiting times
©NCCSDO 2007 154
whatever you are doing? usual usual usual than usual
b. Lost much sleep over worry? Not at all No more
than usual
Rather more
than usual
Much more
than usual
c. Felt that you are playing a useful part in things?
More so
than usual
Same as
usual
Less than
usual
Much less
than usual
d. Felt capable of making decisions about things?
More so
than usual
Same as
usual
Less than
usual
Much less
than usual
e. Felt constantly under strain? Not at all No more
than usual
Rather more
than usual
Much more
than usual
f. Felt that you couldn’t overcome your difficulties?
Not at all No more
than usual
Rather more
than usual
Much more
than usual
g. Been able to enjoy your normal day-to-day activities?
More so
than usual
Same as
usual
Less than
usual
Much less
than usual
h. Been able to face up to your problems?
More so
than usual
Same as
usual
Less than
usual
Much less
than usual
i. Been feeling unhappy or depressed?
Not at all No more
than usual
Rather more
than usual
Much more
than usual
j. Been losing confidence in yourself?
Not at all No more
than usual
Rather more
than usual
Much more
than usual
k. Been thinking of yourself as a worthless person?
Not at all No more
than usual
Rather more
than usual
Much more
than usual
l. Been feeling reasonably happy, all things considered?
More so
than usual
Same as
usual
Less than
usual
Much less
than usual
Many thanks for completing this questionnaire. Please place the
questionnaire in the pre-paid envelope provided, seal it and post back to
the researcher in Sheffield within 14 days.
If you have any further comments to make, please feel free to write them
in the next page.
Thank you for your co-operation
Dr A. Carter, Prof. T.D. Wall, Ms S. Mason, Mr. T. Locker
Copyright 2005 The Authors
All rights reserved.

Factors influencing Emergency Department waiting times
©NCCSDO 2007 155
Appendix I Eight Emergency Departments contributing to Phase Two data collection
Format
The following scenarios have been compiled using information about
departments gathered from interviews, focus groups and observation with
primary and secondary care, doctors, nurses and administrative staff,
team-working interviews with two doctors and nurses, and qualitative
comments from questionnaires to create a story about each Emergency
Department examined in the second phase of the study. Each will be
referred to by an identification number to maintain anonymity.
Qualitative data sample
Data were collected from focus groups, organisational-factors interviews
and ethnographic observations. Six of the eight sites from which data
were collected included focus groups or interviews with five different
groups of participants: primary care, secondary care, doctors, nurses and
administrative staff. At the remaining two sites (sites 207 and 208) it was
not possible to collect data from all groups and therefore the data relate
to a limited sample for these sites.
Analyses
Data were analysed using a template based on an initial model of factors
that prevent patients from leaving the Emergency Department and those
that encourage patients to attend the Emergency Department (the
out-and-in model). Categories in the model were developed from subject-
matter experts and data from one of the sites which formed the basis of a
template. Data from all sites were subsequently coded using the
template, and themes that did not fit the model were examined and a
final template was derived.
Performance
Several measures of performance were available for each site. Firstly the
Trust’s star rating is given. This is followed by other performance ratings
and finally ranking from in-depth qualitative analyses based on interview,
focus groups, ethnographic observation and team-working interviews.

Factors influencing Emergency Department waiting times
©NCCSDO 2007 156
Emergency Department 85
Attendances 60,000–69,999
Case-mix
Percentage of patients aged 65 years or over 10.0–14.9
Percentage of patients aged less than 16 years 20.0–24.9
Percentage of patients arriving by ambulance 20.0–24.9
Percentage of patients admitted 20.0–24.9
Percentage of patients referred to the Emergency Department by a GP
0.0–4.9
Non-pay spend per 10,000 patients (£) 5.0–9.9
See and Treat present? Yes
Percentage of nursing hours lost through sickness 5.0–9.9
Lead clinician’s management style Consult
Performance
Mean total time (min) 125
Mean waiting time (min) 61
Ranking according to Phase One model out of 8 Phase Two sites 2
Overall WT rank out of Phase Two sites 5
WT rank, waiting-time rank.
Phase Two qualitative ranking: 2 (1–8, poor to good)
About the department
The top three salient factors were hospital management, access to
primary and secondary care and bed management and shortages,
indicating a reactive strategy and low performance level. Particular
comments relate to barriers in communication and animosity between the
Emergency Department and other departments, with impolite behaviour
fostering poor working relationships, including conflict between doctors
and nurses within Emergency Department and with porters creating
problems with transferring patients. A lack of shared vision between
health and social services professionals and a reactive approach to
discharge planning results in bottlenecks in Emergency Department while
beds become available elsewhere in the hospital. There was a lack of role
clarity in nursing roles, represented by Emergency Nurse Practitioners
(ENPs) performing a regular nursing role (their extended nursing role
perceived as preventing basic nursing care) and differences in the

Factors influencing Emergency Department waiting times
©NCCSDO 2007 157
capacity of nurses to prescribe medication, being dependent on the doctor
they work with.
Observations from the department
A nurse asks a doctor to prescribe medication for a patient. The doctor
states this has already been done and is written up on the Emergency
Department card. The nurse in charge informs both that it is no longer
policy to do this routinely but neither seems aware.
Groups of nurses and doctors sat at separate desks, the two groups
showing no interaction.
Suggested solutions from the department
Multidisciplinary working was perceived by several participants from all
disciplines as the way forward but can only work if a shared vision of the
service is created with the necessary funding in place. This needs to be
supported by an evidence base to justify initiatives and proposed
solutions. It is also necessary to communicate and build working
relationships and co-operation between different agencies and
departments in the hospital to keep each other informed. It was
important to have support among the Board of the Trust for these
activities.
Other solutions were better discharge processes (and to discharge in the
morning), address the division between nurses and doctors to present a
united front, a core group of experienced staff to help support rotating
junior doctors, public education regarding the role of an Emergency
Department and improvements in the availability of primary care
services, such as GP appointments. Initiatives mentioned that have
already been introduced included moving patients at 3-hour breach,
monitoring of breach statistics, and See and Treat with ENPs.
Questionnaire
A 47% response was received from 32 nurses, 17 doctors, 11
administrative staff and three staff in professions allied to medicine. A
majority were women (62%), with children (64%), a mean age of 38,
who had worked, on average, in the department for 6 years (and
13 years in the NHS).
Factors influencing Emergency Department waiting times
©NCCSDO 2007 158
Well-being
Twenty-four per cent of the Emergency Department are classified as
probable cases of stress6 (variation across the sites is between 20 and
28% caseness in line with other health care organisations; Mullarkey et
al., 1999). The average level of job satisfaction is 4.87, close to
‘moderately satisfied’, indicating a mildly positive level of job satisfaction
(the range across Emergency Departments surveyed was 3.8–5).
Teams
Participants described the department as a whole as a team but were
unclear about its exact composition. Work was allocated individually and
according to grade. Groups of people came together ‘when something
serious happens’ and returned to individual working when the event was
over. Objectives were seen as waiting-time targets. While
interdependence was espoused work roles were described in terms of
occupational groups with separate leaders (consultants and co-ordinating
nurse) and there was little evidence of proactive, inclusive working.
Questionnaire responses suggest that individuals perceive work is mainly
undertaken in clearly defined teams (71%) and less frequently in less
clearly defined teams (19%) or alone (10%).
Comments (1)
There is variation of work enjoyment depending on shift composition and
support depending on shift supervisor; concern and frustration about
quality of patient care in the rush to meet waiting-time targets and
irritation at the time spent using IT rather than talking to patients,
changing the job role.
Suggestions to improve the way people work together: assessment by a
senior doctor and nurse on ambulance arrival; more space in the
department; easier referral to GP for minors; more guidance for Senior
House Officer (SHOs) to make quicker clinical decisions; increased
number of consultants working out of hours; and more porters to move
patients from the department.
6 The questionnaire contained a standardised measure of stress. This was the GHQ-12; a self-administered
screening test designed for use in the general population. It measures feelings of strain, depression, inability
to cope, anxiety-based insomnia and other symptoms. It is scored to distinguish between probable cases
and non-cases (validated by prior research against clinical assessments; 3/4 threshold), where a case
indicates a level of distress sufficiently severe to be of concern.
7 Satisfaction was measured by a 16-item scale covering various areas of work. Items were answered on a
seven-point response scale running from ‘extremely satisfied‘ to ’extremely dissatisfied‘, and the overall
score calculated as a mean over all 16 items.

Factors influencing Emergency Department waiting times
©NCCSDO 2007 159
Emergency Department 208
Attendances 40,000–49,999
Case-mix
Percentage of patients aged 65 years or over 10.0–14.9
Percentage of patients aged less than 16 years 25.0–29.9
Percentage of patients arriving by ambulance 10.0–14.9
Percentage of patients admitted 15.0–19.9
Percentage of patients referred to the Emergency Department by a GP
0.0–4.9
Non-pay spend per patient (£) 0.0–4.9
See and Treat present? Yes
Percentage of nursing hours lost through sickness 0.0–4.9
Lead clinician’s management style N/A
Performance
Mean total time (min) 107
Mean waiting time (min) 60
Ranking according to Phase One model out of 8 Phase Two sites N/A
Overall WT rank out of Phase Two sites 4
Phase Two qualitative ranking: 8 (interviews and focus groups)/7 (team
working) (1–8, poor to good)
About the department
There were no secondary care participants in this sample which may limit
the relevance of the data. The top three salient factors were Emergency
Department management, hospital management and access to primary
and secondary care, indicating a proactive strategy and high performance
level. The hospital has a lack of services available and often patients must
be transferred to the larger hospital nearby. This appeared as a higher
issue than in most other hospitals. Particular comments related to the
new IT system which is seen to increase waiting times, particularly since
it was launched in the X-ray department. Furthermore, other services are
on different systems and IT has been slow to make recommended
changes.
There is a lack of communication and different working practices between
different areas of the hospital, and between management and people ‘on
the ground’, although communication between the medical assessment

Factors influencing Emergency Department waiting times
©NCCSDO 2007 160
unit and Emergency Department has improved recently. It was
recognised that although 50% of cases could be discharged in the
morning only 10% actually are. Middle-grade doctors have been assigned
a leadership role on a shift but some are reluctant to organize SHOs or
seek out complex cases. There was a lack of role clarity identified
between major and minor injuries with staff reluctant to help in other
areas even when quiet in their own area.
Observations from the department
12.20: a patient waiting to go to coronary care unit can now be sent.
12.52: co-ordinator chases up why coronary care unit patient has not
been transferred and arranges with porter for transfer but patient has
breached.
There appeared to be three separate queues of patients; staff seemed
allocated to a particular queue and did not alter when queues changed.
Suggested solutions from the department
The introduction of See and Treat with ENPs has improved waiting times
from 6% discharged at 3 hours to 14% discharged at 3 hours. Further
suggestions involved improving the interaction between nurses in major
and minor cases to build flexibility in who they will treat and development
of See and Treat for major cases. It was also suggested to develop
forums for communication between different agencies involved in patient
care involving primary and secondary care services and develop IT
systems to align with other Trusts and agencies so that initial assessment
and patient time could appear on the patient card. A long-term
suggestion is to create a combined Emergency Assessment Area
consisting of Emergency Department, medical assessment unit and
speciality admissions units. Initiatives mentioned that have already been
introduced included patient flow co-ordinator, See and Treat with ENPs
and moving to a 3-hour breach time.
Questionnaire
There was a 56% response from 27 nurses, five administrative staff and
three staff in professions allied to medicine. All of this group were women,
with children (86%), a mean age of 41, who had worked, on average, in
the department for 6 years (and 13 years in the NHS).
Well-being
Twenty-eight per cent of the sample are classified as probable cases of
stress (sample varies between 20 and 28% caseness in line with other
health care organizations; Mullarkey et al., 1999). The average level of

Factors influencing Emergency Department waiting times
©NCCSDO 2007 161
job satisfaction is 4.7, close to ‘moderately satisfied’, indicating a mildly
positive level of job satisfaction (the range across the departments
surveyed was 3.8–5).
Teams
Participants used the word team as a descriptive term and mostly only
talked about occupational groups working separately (nurses and
doctors). Participants were vague about the composition of the work
group, complicated because doctors worked between this and another site
(85). Work was allocated according to shift and area for nurses and grade
for doctors. Objectives were seen as waiting-time targets, keeping people
happy, caring for patients like a member of the family, offering correct
treatment and protecting specialist teams from inappropriate referrals.
While working together and sharing tasks was espoused most people
appeared to work alone unless working with a specific SHO. Work roles
were described in terms of tasks allocated by the nurse co-ordinator.
Decisions are made by senior nurses in each area and ENPs. Doctors have
a new ‘leader’ to co-ordinate the work of the doctors in the department.
This is currently enjoying limited success. There was evidence of external
inclusivity, operational and strategic leadership, additional team
objectives and proactive behaviour.
Questionnaire responses suggest that individuals perceive work as mainly
undertaken in clearly defined teams (65%) and less frequently in less
clearly defined teams (21%) or alone (15%).
Suggestions to improve the way people work together
Suggestions include developing See and Treat for major cases with a
team of doctors and nurses and to formalise See and Treat for minor
cases; increase ENPs in Emergency Department at peak times; focus the
nurse co-ordinator role with a mid-grade doctor to oversee workload of
department; discourage self-presentation with old injuries and educate
patients (a video is being made that will be shown in the waiting room);
develop GP-led unit; redirect patients to GPs; make staff grades more
productive and educate doctors about breach times; formalise discussions
between doctors and nurses and encourage inpatient specialists to consult
without admission; and to direct ambulance transfers to correct
departments. It was noted that current monitoring of targets is helping to
achieve realistic targets.
Emergency Department 40
Attendances 40,000–49,999
Case-mix

Factors influencing Emergency Department waiting times
©NCCSDO 2007 162
Percentage of patients aged 65 years or over 15.0–19.9
Percentage of patients aged less than 16 years 20.0–25.9
Percentage of patients arriving by ambulance 20.0–24.9
Percentage of patients admitted 15.0–19.9
Percentage of patients referred to the Emergency Department by a GP
5.0–9.9
Non-pay spend per patient (£) 5.0–9.9
See and Treat present? Yes
Percentage of nursing hours lost through sickness 10.0–14.9
Lead clinician’s management style Tell
Performance
Mean total time (min) 146
Mean waiting time (min) 135
Ranking according to Phase One model out of 8 Phase Two sites 6
Overall WT rank out of Phase Two sites 8
Phase Two qualitative ranking: 1 (1–8, poor to good)
About the department
There were no primary or secondary care participants in this sample,
which may affect the relevance of this data. The top three salient factors
were Emergency Department management, bed management and bed
shortages and access to primary and secondary care services, which
indicated a reactive strategy and low performance level. Particular
comments related to X-ray being obstructive and refusing to do
investigations, long waits for psychiatric assessment as this is not a Trust
priority and has taken years of pressure to make improvements. There is
incorrect patient information on samples and X-rays and a general
aggressive culture between departments which affects communication.
Primary care participants believed the NHS has a culture where acute
wards would rather refer patients to Emergency Department than primary
care services due to issues of speed and trust. Issues with beds were
unavailability due to lack of cleaning of ward side rooms, slow referral
procedures between Emergency Department and specialties where
patients often ‘ping-pong’ between referrals to medicine or surgery.
Within Emergency Department there is a lack of clinical space to see
patients and role-clarity issues relate to the use of receptionists to
determine who to send to See and Treat, causing stress, wrong patient

Factors influencing Emergency Department waiting times
©NCCSDO 2007 163
allocation and issues of prioritization between clinical roles and
managerial roles.
Observations from the department
Doctor is looking for someone in all the cubicles, doesn’t seem to find who
she wants.
See and Treat doctors and nurse are talking. Doctor says this patient is
not a See and Treat patient, why did you bring her? Nurse says we had
no-one else to see, we might as well see her. Doctor seems unhappy.
I heard the staff discussing a GP referral in disbelief. The GP in question
had told one of his patients to come to Emergency Department because it
would be quicker.
Suggested solutions from the department
Emergency Department should improve communication regarding who
needs beds at an earlier stage. The tracking system should be updated
regularly and staff trained in how to use it. A more holistic service would
place assessment wards next to Emergency Department. It was also
suggested that Emergency Department should be able to charge to the
Primary Care Trust if a patient is not referred directly to a specialty. Bed
numbers in other Trusts should be incorporated into Emergency
Department plans for this hospital. There should be training to help
receptionists determine which patients should go to See and Treat and
reorganisation of the department so that consultants see Emergency
Department patients. Nurses’ roles could be up-skilled to perform whole
tasks rather than fragmented tasks and they should have access to stress
counselling. Initiatives mentioned that have already been introduced
included: See and Treat, increase in numbers of consultants and ENPs,
and discharge lounges.
Questionnaire
There was a 44% response from 13 nurses, seven doctors, 10
administrative staff and one manager. A majority were women (71%),
without children (58%), a mean age of 38, who had worked, on average,
in the department for 4 years (and 11 years in the NHS).
Well-being
Twenty-three per cent of the sample are classified as probable cases of
stress (sample varies between 20 and 28% caseness in line with other
health care organizations; Mullarkey et al., 1999). The average level of
job satisfaction is 4.7, close to ‘moderately satisfied’, indicating a mildly

Factors influencing Emergency Department waiting times
©NCCSDO 2007 164
positive level of job satisfaction (the range across the departments
surveyed was 3.8–5).
Teams
Perceptions of team working varied widely (in terms of area, shift or the
department as a whole) and people were unclear about team
composition. Objectives were seen as patient care and the 4-hour targets.
Work roles were allocated according to shift, grade and occupational
group. Interdependence was acknowledged but doctors and nurses only
described coming together during major incidents and then returned to
flexible working when the incident was over. Work in the department was
described in terms of separate occupational groups with mid-grade
doctors taking an overview of the workload with a view to troubleshooting
to reduce waiting times. Doctors and nurses describe separate leaders
(consultants and co-ordinating nurse) and there was little evidence of
proactive, inclusive working.
Questionnaire responses suggest that individuals perceive work is mainly
undertaken in clearly defined teams (60%) and less frequently in less
clearly defined teams (23%) or alone (17%).
Suggestions to improve the way people work together
Assessment by a doctor who delegates activity; quicker assessment of
urgent cases in waiting room; a rapid-assessment bay staffed by a senior
doctors is being implemented; keeping minor cases separate from the
rest of the department; senior nurse and doctor should take time to
reflect on what happened after an incident to stop recurrence; increase
out-of-hours staff; porter assigned to Emergency Department; better
handover to on-call specialties and assessments; and observation beds
out of Emergency Department.
Emergency Department 207
Attendances 40,000–49,999
Case-mix
Percentage of patients aged 65 years or over 15.0–19.9
Percentage of patients aged less than 16 years 20.0–24.9
Percentage of patients arriving by ambulance 20.0–24.9
Percentage of patients admitted 20.0–24.9
Percentage of patients referred to the Emergency Department by a GP
0.0–4.9
Factors influencing Emergency Department waiting times
©NCCSDO 2007 165
Non-pay spend per patient (£) 10.0–14.9
See and Treat present? Yes
Percentage of nursing hours lost through sickness 0.0–4.9
Lead clinician’s management style Consult
Performance
Mean total time (min) 125
Mean waiting time (min) 55
Ranking according to Phase One model out of 8 Phase Two sites 4
Overall WT rank out of Phase Two sites 3
Phase Two qualitative ranking: 4 (interviews and focus groups)/3 (team
working) (1–8, poor to good)
About the department
The top three salient factors were Emergency Department management,
bed management and bed shortages, and hospital management,
indicating a reactive strategy and low–mid performance level. Particular
comments related to resistance within the Trust to ideas and uncertainty
as to who to communicate ideas to, petty politics getting in the way of
people working together and communication difficulties between porters
and Emergency Department staff.
Issues between the Trust and Primary Care Trust are preventing equal
distribution of funding between primary and secondary care services.
Specialties, while providing vocal support for Emergency Department, do
not provide practical day-to-day support. The hospital night team is not
functioning well as it is run traditionally and leaves a backlog of patients
for the morning shift, especially at the start of the week, which ‘messes
up’ the rest of the day. Whenever major clinical cases occur, staff are
drawn away from the rest of the department. There is no triage system.
This has been replaced by a navigator role where a qualified nurse
streams patients between majors and minors but does not physically
touch the patient. The role is felt to under-utilize nurses’ skills and causes
issues around patient privacy, with the divulging of personal details in the
middle of the waiting room.
Observations from the department
Doctors from other specialties come and go without communicating.
Health care assistant tries to contact the plaster room for a knee
dislocation but seems not very hopeful that they will attend. Health care
Factors influencing Emergency Department waiting times
©NCCSDO 2007 166
assistant returns as cannot locate any plaster technicians. Nurses will
have to plaster the patient which will take two members of staff.
Patient seen by ENP, heard to refer to himself as the navigator. Patient is
taken to small area immediately adjacent to waiting room where brief
history is taken; fully audible from where I am sat in the waiting room.
The consultant is satisfied that only one Emergency Department patient
needs to be seen and leaves the area muttering about ‘they just need
organizing’.
The computer system is not always up to date, which causes confusion.
Suggested solutions from the department
There should be better co-ordination of staff and communication between
staff, including those from Emergency Department acknowledging staff
from other areas of the hospital and specialties providing more practical
support. A holistic approach should consider different Emergency
Department services offered locally and it was suggested to co-locate
Emergency Department and create a Medical Investigation Unit. Inter-
professional working between primary and secondary care is believed to
produce better results and there should be a more even split of funds
between them. Specialties should be trained to take account of breach
times.
Within the department, doctors could be allocated to major or minor
cases to increase role clarity and their work structured better, with
patients seen by referral or appointment. Nurses could be rotated through
different areas to improve or maintain their skills. It was also suggested
that the navigator role should revert back to triage.
Initiatives that have already been introduced include: new walk-in centre
based in Emergency Department, medical assessment unit/acute
admission unit and ENPs working on minors.
Questionnaire
There was a 35% response from 14 nurses, seven doctors and seven
administrative staff. A majority were women (68%), with children (75%),
a mean age of 40, who had worked, on average, in the department for 5
years (and 9 years in the NHS).
Well-being
Twenty-two per cent of the sample are classified as probable cases
(sample varies between 20 and 28% caseness in line with other health
care organizations; Mullarkey et al., 1999). The average level of job
satisfaction is 4.2, close to ‘not sure’, indicating a level of job satisfaction

Factors influencing Emergency Department waiting times
©NCCSDO 2007 167
that is neither positive nor negative (the range across the departments
surveyed was 3.8–5).
Teams
Participants considered a team to be either the department or a shift.
There was some clarity about team composition including receptionists.
Some participants did not think work was allocated in teams. Objectives
were seen as 4-hour targets, optimal patient care, pain relief, safety and
development. Work roles were allocated according to occupational group
and grade; X-ray, laboratories and physiotherapy were mentioned by one
participant. Interdependence was acknowledged in terms of trauma and
cardiac arrest while acknowledging independent working. Doctors and
nurses describe separate leaders (consultant/senior doctor and nurse in
charge). There was evidence of external inclusivity, effective
communication between doctors and nurses and additional team
objectives.
Questionnaire responses suggest that individuals perceive work is carried
out in a variety of work groupings (less clearly defined teams, 43%;
clearly defined teams, 32%; alone, 25%).
Comments (2)
Frustration about quality of patient care in rush to meet waiting time
makes work feel like a conveyor belt; nurses are urged to perform
beyond their abilities by management; bed co-ordinator only focuses on
what has not been done and never offers extra help when busy;
management is bullying, exposing all breaches and allocating blame to
Emergency Department staff when it may be the fault of wards or
porters; more paper work is expected that consumes nurse time; many
senior colleagues are off sick with stress and depression. There have been
four different managers in the last 2–3 years who were not Emergency
Department nurses and set conflicting demands. The new manager
(previously Emergency Department nurse) is improving the way the
department is managed.
Suggestions to improve the way people work together
Shorter waiting times for occupational therapy; record all patient
information in a document on the patient’s bed; improve bed
management; lose the navigator role and replace it with triage by ENP;
nurse in charge should be in reception (as in original department plan),
manage long-term sickness; allocate doctors to major or minor cases to
give clarity to their roles; increase staff in See and Treat; set up a
surgical assessment unit and acute admission ward; influence patients’

Factors influencing Emergency Department waiting times
©NCCSDO 2007 168
expectations regarding waiting times; and discourage GPs from telling
patients they will have a bed when this is not true.
Emergency Department 164
Attendances 70,000–79,999
Case-mix
Percentage of patients aged 65 years or over 15.0–19.9
Percentage of patients aged less than 16 years 20.0–24.9
Percentage of patients arriving by ambulance 30.0–34.9
Percentage of patients admitted 30.0–34.9
Percentage of patients referred to the Emergency Department by a GP
0.0–4.9
Non-pay spend per patient (£) 5.0–9.9
See and Treat present? Yes
Percentage of nursing hours lost through sickness 0.0–4.9
Lead clinician’s management style Consult
Performance
Mean total time (min) 133
Mean waiting time (min) 75
Ranking according to Phase One model out of 8 Phase Two sites 3
Overall WT rank out of Phase Two sites 6
Phase Two qualitative ranking: 6 (interveiws and focus groups)/5 (team
working) (1–8, poor to good)
About the department
The top three salient factors were self-presentation, hospital management
and Emergency Department management, indicating a proactive strategy
and mid performance level. Information received from the department
concerned 67 breaches due to awaiting beds (42), awaiting first
assessment in Emergency Department (10), delayed referral by
Emergency Department (6), waiting for specialist opinion (4), waiting for
transport (1) and clinical exception (4). Particular comments related to
the main objectives of primary care staff not being related to Emergency
Department, a lack of communication regarding patient needs when
arriving by ambulance, and difficulties finding basic secondary care
information; for example, opening times of the dedicated X-ray service.
Emergency Department was seen as a separate unit with special

Factors influencing Emergency Department waiting times
©NCCSDO 2007 169
requirements by the rest of the hospital and that staff outside Emergency
Department do not want to take responsibility for the target. There is
poor discharge planning and when beds are unavailable on wards patients
are left on trolleys in Emergency Department with no-one to look after
them as they are not Emergency Department patients. Doctors also
believed that the nurses were overstretched and needed better support in
their roles and skilled employees are often used to doing unskilled work
due to a lack of administrative staff. Furthermore, it is difficult for the
senior nurse to maintain patient flow when the department becomes busy
due to clinical pressure. There is a lack of support from business
managers. A particular issue raised here was that immigrants attend
because they do not know their right to be registered with a GP.
Observations from the department
Emergency Department doctor tries to view X-rays of patient on PC but
gets the films of the wrong patient.
Paramedics arrive with orthopaedics referral. Emergency Department
have not been notified and the ward has no beds. The patient is placed in
a cubicle.
Sister thinks the patient needs an X-ray but is unsure of criteria for
requesting this. She is heard to state that she has not done this before.
Emergency Department doctors seem oblivious to urgency. Senior nurse
interrupts doctor to ask for direction about a patient.
Suggested solutions from the department
There needs to be better communication and a referral policy between
Emergency Department and the wards so that all parties are aware of the
role of Emergency Department within the system. Different approaches
were suggested to deal with this, ranging from amalgamation of
emergency and acute medicine into one division to encourage closer
working relationships and shared objectives to separate but allied
directorates with a voice on the Trust board and separate hospitals for
emergency and elective patients.
Flexible capacity in other parts of the hospital would help relieve pressure
on Emergency Department. Another suggestion was that the Emergency
Department should work in multidisciplinary teams to discuss treatments
and solutions to improve the decision-making processes and
responsibilities and increase team-building.
Effective shift leaders could be trained to run a shift and there was
recognition of a need for an Emergency Department business manager.
Public education could inform immigrants of their right to a GP and how to
register.
Factors influencing Emergency Department waiting times
©NCCSDO 2007 170
Initiatives that have already been introduced included: See and Treat
with ENPs, progress co-ordination, monitoring of breaches and a walk-in
centre.
Questionnaire
There was a 31% response (from 23 nurses, 14 doctors, 14
administrative staff). A majority were women (84%), with children
(57%), a mean age of 39, who had worked, on average, in the
department for 7 years (and 13 years in the NHS).
Well-being
Twenty-five per cent of the sample are classified as probable cases of
stress (sample varies between 20 and 28% caseness in line with other
health care organizations; Mullarkey et al., 1999). The average level of
job satisfaction is 5, ‘moderately satisfied’, indicating a positive level of
job satisfaction (the range across the departments surveyed was 3.8–5).
Teams
Participants described the Emergency Department as the team but there
were varied perceptions of team composition. The clerical team were
acknowledged as part of Emergency Department. Work was allocated by
occupational group, shift, skill and grade with doctors mentioning working
with nurses and only one participant saw work allocated into teams. A
fixed team was Resus, where doctors and nurses have assigned roles. All
agreed that team objectives were patient care, and then there was some
variation about different objectives between major and minor cases,
working within departmental guidelines and 4-hour targets and
supporting each other.
Team roles were not clear and flexibility was valued will acknowledging
interdependence. Doctors and nurses describe separate leaders
(consultant/senior doctor and nurse in charge) and leaders in areas (i.e.
major cases). There was evidence of co-operative working, additional
team objectives, developmental behaviour, flexible working and
empowerment of local decision-making. Questionnaire responses suggest
that individuals perceive work is carried out mainly in clearly defined
teams (71%) and less frequently in less clearly defined teams (24%) and
alone (6%).
Comments (3)
The department is under-managed (manager is not positive and
involved); there is a ‘them and us’ feel between ward and Emergency
Department staff with little respect or understanding for the Emergency

Factors influencing Emergency Department waiting times
©NCCSDO 2007 171
Department role; little communication between wards and Emergency
Department; staff feel undervalued (hard work is not recognised) and
under pressure; long service is not appreciated; local colleagues
acknowledge your work but a ‘thank you’ is never received from the
hierarchy.
Suggestions to improve the way people work together
Increase access to primary care resources (occupational therapy and
Rapid Response); dedicated access to secondary care (CT and bloods;
improve communication with all specialties in the Trusts and understand
others’ roles; discharge patients earlier (elderly care); run with spare
capacity; allocate minors to ENPs, keep department flexible; have a
larger area for major cases; involve senior doctors in major cases earlier
to support SHOs; identify patients (such as major cases) for whom the 4-
hour target is inappropriate; reduce inappropriate referrals.
Emergency Department 154
Attendances
80,000–89,999
Case-mix
Percentage of patients aged 65 years or over 15.0–19.9
Percentage of patients aged less than 16 years 20.0–24.9
Percentage of patients arriving by ambulance 20.0–24.9
Percentage of patients admitted 15.0–19.9
Percentage of patients referred to the Emergency Department by a GP
5.0–9.9
Non-pay spend per patient (£) 0.0–4.9
See and Treat present? Yes
Percentage of nursing hours lost through sickness 0.0–4.9
Lead clinician’s management style N/A
Performance
Mean total time (min) 91
Mean waiting time (min) 28
Ranking according to Phase One model out of 8 Phase Two sites N/A
Overall WT rank out of Phase Two sites 1
Phase Two qualitative ranking: 7 (interviews and focus groups)/8 (team
working) (1–8, poor to good)

Factors influencing Emergency Department waiting times
©NCCSDO 2007 172
About the department
The top three salient factors were access to primary and secondary care,
hospital management and Emergency Department management,
indicating a proactive strategy and high performance level.
Suggested solutions from the department
Initiatives mentioned that have already been introduced included: See
and Treat with ENPs, progress co-ordination monitoring breaches and a
walk-in centre.
Questionnaire
There was a 32% response from 21 nurses, 10 doctors, 11 administrative
staff, one manager and one ancillary staff. A majority were women
(73%), with children (61%), a mean age of 38, who had worked, on
average, in the department for 5.7 years (and 11 years in the NHS).
Well-being
Twenty per cent of the sample are classified as probable cases of stress
(sample varies between 20 and 28% caseness in line with other health
care organizations; Mullarkey et al., 1999). The average level of job
satisfaction is 4.6, close to ‘moderately satisfied’, indicating a mildly
positive level of job satisfaction (the range across the departments
surveyed was 3.8–5).
Teams
Teams were described as being the department as a whole or area teams.
However, there was little evidence of team working among staff except in
the See and Treat area. The composition of the department was clear and
clerical staff (reception, audio typists) were included. Work was allocated
by area or shift with consultants having allocated time in See and Treat.
Objectives varied; providing necessary treatment of (and caring for)
patients, to work together to best of ability and help each other, and
treating people as quickly as reasonable. Roles were allocated according
to hierarchy, skill, grade or occupational group (e.g. clerical,
receptionist). People needed to work together and communication is
critical (and critical incidents can be traced to failure of communication
and team working. Key leaders were the consultant on duty and the
nurse in charge (clerical staff recognise the clinical matron as their
leader), in addition to section leaders (nurses) and SHO leaders
(registrars). There was evidence of clear work roles and inclusive
allocations, prioritising work, additional objectives, empowerment,
reflexivity and co-operative leadership strategies.

Factors influencing Emergency Department waiting times
©NCCSDO 2007 173
Questionnaire responses suggest that individuals perceive that work is
carried out mainly in clearly defined teams (54%) and less-clearly defined
teams (39%), but less frequently alone (7%).
Suggestions to improve the way people work together
Bloods and cannulations can be done by health care assistants before
being seen by a doctor; pain relief should be given immediately; extra
nursing staff, porters and health care assistants; have more experienced
staff; senior nursing staff can decide where patients need to go and what
assessments are needed (some don’t need blood tests); hoping to fund a
nurse consultant; time taken to organise a bed is long; clinical pathways
and protocols can be helpful; Greet and Treat run by registrars has been
successful in major cases.
Emergency Department 109
Attendances
40,000–49,999
Case-mix
Percentage of patients aged 65 years or over 10.0–15.9
Percentage of patients aged less than 16 years 25.0–29.9
Percentage of patients arriving by ambulance 15.0–19.9
Percentage of patients admitted 15.0–19.9
Percentage of patients referred to the Emergency Department by a GP
0.0–4.9
Non-pay spend per patient (£) 5.0–9.9
See and Treat present? Yes
Percentage of nursing hours lost through sickness 0.0–4.9
Lead clinician’s management style Consult
Performance
Mean total time (min) 89
Mean waiting time (min) 37
Ranking according to Phase One model out of 8 Phase Two sites 1
Overall WT rank out of Phase Two sites 2
Phase Two qualitative ranking: 5 (interviews and focus groups)/6 (team
working) (1–8, poor to good)

Factors influencing Emergency Department waiting times
©NCCSDO 2007 174
About the department
The top three salient factors were hospital management, self-presentation
and Emergency Department management, indicating a proactive strategy
and mid–high performance level.
Suggested solutions from the department
Initiatives mentioned that have already been introduced included: See
and Treat with ENPs, progress co-ordination, monitoring breaches and a
walk-in centre.
Questionnaire
Only one questionnaire was returned so there are no data to report from
this site.
Teams
In general, participants referred to the department as a whole as a team
or to the nursing team. In addition there were nursing teams for
developmental purposes. Staff were moderately clear about the
composition of the department and there was evidence of inclusion of
other staff groups such as occupational therapists, physiotherapists and
play specialists. Work was allocated into areas for nurses and by demand
(and shift) for doctors. Individuals work flexibly, and usually
independently, unless a team is required (in cases of trauma, cardiac
arrest) or when a doctor and nurse work together in See and Treat.
Participants agreed that the main team objective was quality patient care
and to meet the 4-hour targets; there was evidence of additional
objectives such as to provide pain relief, get patients to wards and
provide specialist care. These objectives were linked with the Emergency
Department business plan.
Individuals took on tasks within the department and adopted roles in
trauma teams as allocated by the co-ordinator. Effective communication
between doctors and nurses was emphasised in the way people worked
together. The department leader was the consultant in charge and the
nurse in charge co-ordinated the department but individuals were seen to
lead areas and co-ordinate trauma teams. There is evidence of broad staff
grouping, external exclusivity, up-skilling staff, flexible working,
prioritising work, trauma team inclusively, additional objectives and
developmental behaviours.
Suggestions to improve the way people work together
Better discharge planning enabling beds to be available; 4-hour targets
provide a focus for staff; wards should have targets for assessment to
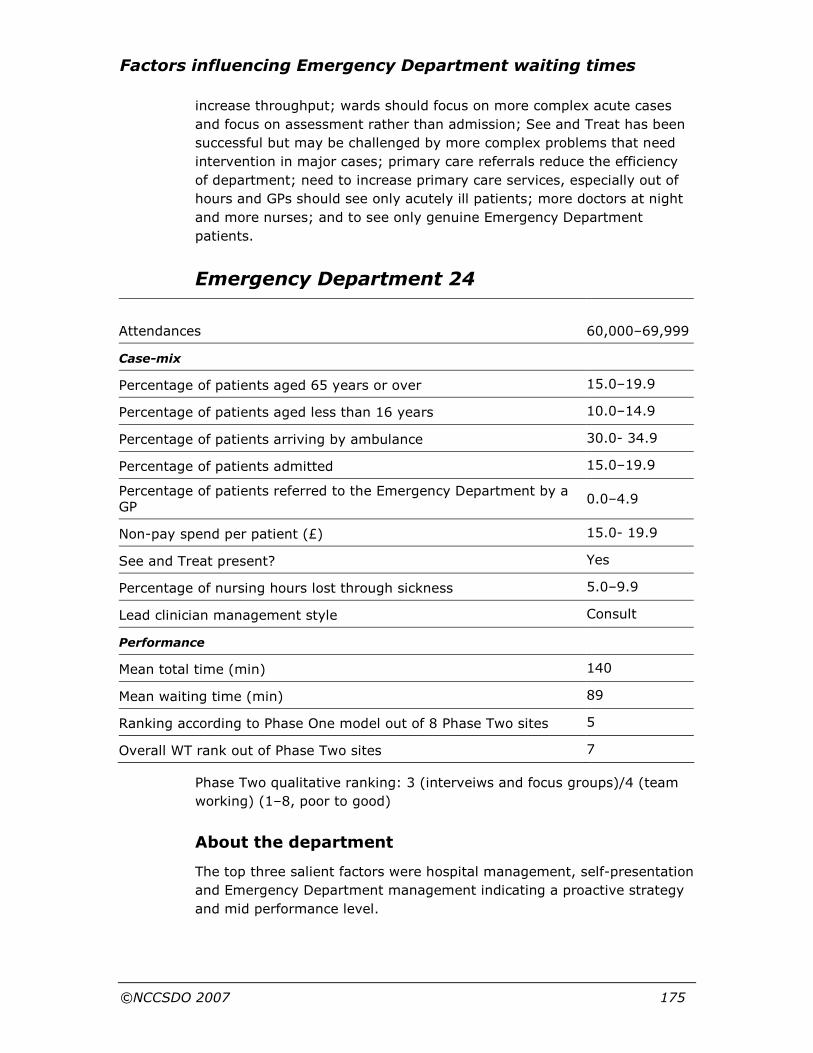
Factors influencing Emergency Department waiting times
©NCCSDO 2007 175
increase throughput; wards should focus on more complex acute cases
and focus on assessment rather than admission; See and Treat has been
successful but may be challenged by more complex problems that need
intervention in major cases; primary care referrals reduce the efficiency
of department; need to increase primary care services, especially out of
hours and GPs should see only acutely ill patients; more doctors at night
and more nurses; and to see only genuine Emergency Department
patients.
Emergency Department 24
Attendances
60,000–69,999
Case-mix
Percentage of patients aged 65 years or over 15.0–19.9
Percentage of patients aged less than 16 years 10.0–14.9
Percentage of patients arriving by ambulance 30.0- 34.9
Percentage of patients admitted 15.0–19.9
Percentage of patients referred to the Emergency Department by a GP
0.0–4.9
Non-pay spend per patient (£) 15.0- 19.9
See and Treat present? Yes
Percentage of nursing hours lost through sickness 5.0–9.9
Lead clinician management style Consult
Performance
Mean total time (min) 140
Mean waiting time (min) 89
Ranking according to Phase One model out of 8 Phase Two sites 5
Overall WT rank out of Phase Two sites 7
Phase Two qualitative ranking: 3 (interveiws and focus groups)/4 (team
working) (1–8, poor to good)
About the department
The top three salient factors were hospital management, self-presentation
and Emergency Department management indicating a proactive strategy
and mid performance level.

Factors influencing Emergency Department waiting times
©NCCSDO 2007 176
Suggested solutions from the department
Initiatives mentioned that have already been introduced included: See
and Treat with ENPs, progress co-ordination, monitoring breaches and a
walk-in centre.
Questionnaire
There was an 18% response from 16 nurses, six doctors and 15
administrative staff. A majority of responses were from women (81%),
with children (57%), aged 40 (mean) who had worked, on average, in the
department for 7 years (and 11 years in the NHS).
Well-being
Twenty per cent of the sample are classified as probable cases (sample
varies between 20 and 28% caseness in line with other health care
organizations; Mullarkey et al., 1999). The average level of job
satisfaction is 3.8, close to ‘not sure’, indicating a level of job satisfaction
that is tending towards dissatisfaction (the range across the departments
surveyed was 3.8–5).
Teams
Participants varied in their descriptions of teams from specialist
assessment team to the department as the team. There was a lack of
clarity of composition, but paramedics were acknowledged. Work was
allocated by occupational group and area (nurses) and shifts (doctors).
Fixed teams were Resus and assessment where doctors and nurses have
assigned roles. Team objectives varied, including optimal patient care,
building a positive working environment and helping to keep the
department ‘afloat’. Team roles were unclear while acknowledging
interdependence. Doctors and nurses describe separate leaders
(consultant and nurse in charge) and leaders in areas (i.e. major cases).
There was evidence of external exclusivity, co-operative working,
additional team objectives, and developmental behaviours. Questionnaire
responses suggest that individuals perceive work is carried out in a
variety of work groupings (less clearly defined teams, defined teams and
alone).
Comments (4)
There is an improving climate in the department over the last 5 years;
allocation of new manager who does not appreciate my role; and pressure
from management to corrupt waiting-time figures.
Factors influencing Emergency Department waiting times
©NCCSDO 2007 177
Suggestions to improve the way people work together
It was suggested to involve registrars and consultants in regular ‘board’
checks to ensure effective patient management; increase medical beds;
use See and Treat and triage only at peak times; employ a phlebotomist
to cannulate and take bloods; increase staff numbers (and skills mix);
employ extra middle grades and consultants; stop unnecessary breaks;
better use of space in minor cases; improve space for patients; develop a
central equipment store as looking for equipment wastes time; improve
staff motivation; and reduce inappropriate referrals from other hospitals.

Factors influencing Emergency Department waiting times
©NCCSDO 2007 178
Appendix J Phase Two interview, focus-group and team-working interview schedules
Organisational factors interview schedule
Good morning/afternoon, my name is XXXXX and I would like to thank
you for giving me some of your valuable time for this interview.
This is one of a series of interviews we are conducting with staff in this
A&E department to examine organisational factors that may influence
waiting times. In other words we are looking at ‘things that make your
work hard’ and that may contribute to extending A&E waiting times. This
work is part of a larger study that will examine ALL the A&E departments
in England and Wales. From this sample 10 departments are contributing
to a more in-depth study of how A&E departments work. So, many thanks
for your co-operation in this work.
This is a supportive study, no-one is here to criticise what you do. There
are no right or wrong answers to the questions. The aim of the project is
to explore work-demand issues, methods of working across departments
to work toward improving waiting times in A&E. The interview will take
about 1 hour to complete and I hope that won’t cause you any problems.
Anything that you say to me/us today will be treated in confidence and
NO individual will be identified. I only have your name to note that I have
completed my interviews as planned. You will be considered as a ‘site
manager’ or ‘receptionist’ with no Trust connection so the data will not be
traceable to you. We will examine issues today and ask for your
suggestions that will be put in our report along with the information we
gain from focus groups we are holding later today and tomorrow.
Further, no feedback will be given to anyone in the department about the
content of this interview. The study will conclude early next year and a
copy of the final report will be made available to all participants.
The interview will take about 50 minutes and I have a copy of the
questions for you to have a look at to help you. Is there anything you
would like to ask before we begin? Are you happy to continue?
Here are the questions:
1 What things cause you difficulties in your working day that may
contribute to extending the waiting time for patients in A&E? (note in
all questions we will consider if there are differences between
working in or out of hours)
2 What potential solutions can you see to the problems that you have
described to me?
Factors influencing Emergency Department waiting times
©NCCSDO 2007 179
2a Have you suggested any of these ideas? And if so, what happened?
3 What initiatives have been tried in the Trust to reduce A&E waiting
times and what effect did they have on working practice and waiting
time?
4a To what extent is understaffing, attendance or staff sickness absence
a problem in this work area?
4b How is sickness absence managed?
5 How would you like to see the A&E speciality managed?
6 That is all our questions. Is there anything you would like to add to
our information gathering about how to reduce waiting times in A&E?
Organisational factors focus group for nurses and doctors
As people come in ask them to complete the consent form.
Introduction 10 minutes
Good afternoon, my name is XXXXX and I am a researcher working on
the ‘A&E waiting time study’ and this is my colleague XXXXX.
This is one of four planned focus groups to discuss with A&E staff work
demands, in other words ‘things that make your work hard’. The aim of
the project is to explore appreciate the things that contribute to waiting
time in A&E departments and examine your ideas of how these may be
reduced. This is part of a larger study that will examine ALL the A&E
departments in England and Wales. From this sample 10 departments will
contribute to the process of in-depth examination of how an A&E
department works. So, many thanks for your co-operation in this work.
This is a supportive study no-one is here to criticise what you do. We will
examine issues together and ask for your suggestions that will be put in
our report.
Anything that you say to us today will be treated in confidence and NO
individual will be identified. Identities will be protected and individuals will
not be named. Further, no feedback will be given to anyone in the
department about the content of this interview. The study will conclude
early next year and a copy of the final report will be made available to all
participants.
It is intended that we work together for 75 minutes. The first 25-minute
part will be about identifying problems that you face in your day-to-day
work the second part will be to come up with some solutions to the
problems you raise.
Factors influencing Emergency Department waiting times
©NCCSDO 2007 180
Are you happy to continue? Let anyone leave who is not happy to
contribute to the study.
RECORD ANY MATERIAL ON A FLIP CHART THAT CAN BE REMOVED FOR
ANALYSIS
Brainstorm 20 minutes
The first part of our session this afternoon is to think of all the things that
cause you difficulties in your working day that may contribute to
extending patients waiting times and to list these. We will consider if
there any differences between out-of-hours working in a minute.
Can I suggest you think about this for a few minutes and then we will go
around the group so that we can record these on the flip chart?
Two minutes’ thought and encourage people to be precise and describe
how these things cause them difficulties at work.
Go round group to get out ideas (2 minutes each) put these on one page
and note the number of repeats.
ASK TO NOTE SOLUTIONS BUT THAT THE NEXT SESSION WILL WORK ON
THIS
Any differences in out-of-hours working? 5 minutes
Any differences between different areas of A&E? 5 minutes
Note any suggestions as you go along to come back to when looking at
solutions.
Summarise points that have come from the session and wish to examine
solutions 40 minutes
What can be done with these issues?
Can I suggest you think about this for a few minutes and then we will go
around the group so that we can record these on the flip chart?
NOTE ON CHART THE ISSUE AND A POSSIBLE SOLUTION
Go round group to get out ideas (2 minutes each) put these on one page
and note the number of repeats. ENCOURAGE A DEBATE AND WORKABLE
SOLUTIONS LOOKING FOR THE RESOURCES THAT WILL BE REQUIRED TO
CARRY THIS THROUGH 15 minutes
DEBATE AND DISCUSS SOLUTIONS SUGGESTING THAT IF JUST ONE
GOOD IDEA COMES FROM THIS GROUP THAT WILL BE SUFFICIENT so
work it through in some detail 15 minutes

Factors influencing Emergency Department waiting times
©NCCSDO 2007 181
Conclusion 5 minutes
We have reached the end of our time now and would like to thank you for
your participation. Many thanks for your time; a copy of our report will be
made available to all who have participated in this study.
Organisational factors focus group for Primary and Secondary care staff
Ask people to complete consent form as they arrive
Introduction 10 minutes
Good afternoon, my name is XXXXX and I am a researcher working on
the ‘A&E waiting time study’ and this is my colleague XXXXX.
This is one of four planned focus groups to discuss with staff working with
A&E staff/department, in other words ‘things that make your work hard’.
The aim of the project is to explore appreciate the things that contribute
to waiting time in A&E departments and examine your ideas of how these
may be reduced. This is part of a larger study that will examine ALL the
A&E departments in England and Wales. From this sample 10
departments will contribute to the process of in-depth examination of how
an A&E department works. So, many thanks for your co-operation in this
work.
This is a supportive study no-one is here to criticise what you do. We will
examine issues together and ask for your suggestions that will be put in
our report.
Anything that you say to us today will be treated in confidence and NO
individual will be identified. Identities will be protected and individuals will
not be named. The study will conclude early next year and a copy of the
final report will be made available to all participants.
It is intended that we work together for 75 minutes. This group is running
in parallel with a group of A&E staff and primary and secondary care staff
(delete as appropriate) associated with the department. We will use a
two-stage process of getting your ideas and then see if we can come up
with some solutions.
Are you happy to continue? Let anyone leave who is not happy to
contribute to the study.
RECORD ANY MATERIAL ON A FLIP CHART THAT CAN BE REMOVED FOR
ANALYSIS

Factors influencing Emergency Department waiting times
©NCCSDO 2007 182
Brainstorm 20 minutes
The first part of our session this afternoon is to think of all the things that
cause you difficulties in your working day that may contribute to
extending A&E patients waiting times and to list these. We will consider if
there any differences between out of hours working in a minute.
Can I suggest you think about this for a few minutes and then we will go
around the group so that we can record these on the flip chart?
Two minutes’ thought and encourage people to be precise and describe
how these things cause them difficulties at work.
Go round group to get out ideas (2 minutes each) put these on one page
and note the number of repeats.
ASK TO NOTE SOLUTIONS BUT THAT THE NEXT SESSION WILL WORK ON
THIS 5 minutes
Any differences in out-of-hours working? 5 minutes
Any differences between different areas of A&E?
Note any suggestions as you go along to come back to in the last session.
Summarise points that have come from the session and explain that we
are going to join the other group to work together to come up with some
solutions.
MAKE A SUMMARY FLIP CHART OF POINTS FOR THE NEXT SESSION TO
LOOK FOR SOLUTIONS 40 minutes
What can be done with these issues?
Can I suggest you think about this for a few minutes and then we will go
around the group so that we can record these on the flip chart?
NOTE ON CHART THE ISSUE AND A POSSIBLE SOLUTION
Go round group to get out ideas (2 minutes each) put these on one page
and note the number of repeats.
ENCOURAGE A DEBATE AND WORKABLE SOLUTIONS LOOKING FOR THE
RESOURCES THAT WILL BE REQUIRED TO CARRY THIS THROUGH
15 minutes
DEBATE AND DISCUSS SOLUTIONS SUGGESTING THAT IF JUST ONE
GOOD IDEA COMES FROM THIS GROUP THAT WILL BE SUFFICIENT
15 minutes
Conclusion 5 minutes
We have reached the end of our time now and would like to thank you for
your participation.
Factors influencing Emergency Department waiting times
©NCCSDO 2007 183
Many thanks for your time; a copy of our report will be made available to
all who have participated in this study.
Questions asked in the team-working interviews
Team working in Emergency Departments
Good morning/afternoon, my name is XXXXX and I would like to thank
you for giving me some of your valuable time for this interview.
This is one of a series of interviews we are conducting with staff in this
A&E department to examine organisational factors that may influence
waiting times. Particularly I am interested in the way the department
works together and team working.
This work is part of a larger study that will examine all Emergency
Departments in England and Wales. From this sample 10 departments are
contributing to a more in-depth study of how A&E departments work. So
many thanks for your co-operation in this work.
This is a supportive study, no-one is here to criticise what you do. There
are no right or wrong answers to the questions. The aim of the project is
to explore work-demand issues, methods of working across departments
to work toward improving waiting times in A&E. The interview will take
about 1 hour to complete and I hope that won’t cause you any problems.
Anything that you say to me/us today will be treated in confidence and
NO individual will be identified. I only have your name to note that I have
completed my interviews as planned. You will be considered as a ‘nurse’
or a ‘doctor’ so the data will not be traceable to you. We will examine
issues today and ask for your suggestions that will be put in our final
report. Further, no feedback will be given to anyone in the department
about the content of this interview. The study will conclude early next
year and a copy of the final report will be made available to all
participants.
The interview will take about 1 hour and I have a copy of the questions
for you to have a look at to help you. Is there anything you would like to
ask before we begin? Are you happy to continue?
How many people work in the A & E department? (2 minutes)
How is work allocated? You may wish to draw this? (8 minutes)
Is work allocated in teams? What are the teams called? (3 minutes)
Do you work in a team? Describe that team to me. Who is in the team? (7
minutes)
What are the objectives of the team/s? (or individuals) (10 minutes)

Factors influencing Emergency Department waiting times
©NCCSDO 2007 184
What roles do people take within the teams? (5 minutes)
Do people need to work together to achieve their tasks? (5 minutes)
Do the teams have team leaders and who are they? (10 minutes)
Can you suggest any other way of organising work to increase throughput
in the department? (10 minutes).

Factors influencing Emergency Department waiting times
©NCCSDO 2007 185
Appendix K Ethnographic residual analysis: the use of an innovative design from educational research for use in health services research
This mixed-methods study used an innovative design described in
educational research as ethnographic residual analysis (ERA; Fry et al.,
1981).
The basic steps of ERA
In 1981, while assessing the combination of qualitative and quantitative
methods in three studies of school performance, a group of researchers
devised the concept of ERA (Fry et al., 1981). They explained how it
worked in the context of assessing school performance. A multiple
regression of factors affecting school performance was undertaken, each
school’s expected performance was compared with its actual
performance, and schools with unusually high and low performance were
then examined using qualitative methods to find factors accounting for
any statistical deviance. The design draws on the strength of quantitative
research to explain variation and the strength of qualitative research to
uncover lesser-known or -understood issues. Fry et al. (1981) described
the following stages in ERA.
Stage 1 Define the dependent variable.
Stage 2 Undertake multiple regression with the available independent
variables.
Stage 3 Compare the predicted outcome with the actual outcome for
each case to identify cases with large residuals. Study cases with
large residuals to explore further issues that may be important, but
which have not been considered in the original regression, using
ethnography where investigators are blinded to the quantitative
findings for each case in order to minimise the potential for
preconceived bias. Rerun regression equations, if possible,
incorporating new insights or variables discovered during the
qualitative phase.
The potential benefits of ERA
ERA is a variation of extreme-case sampling which is a well-known
approach to combining qualitative and quantitative methods. In extreme-
case sampling, qualitative researchers identify extreme cases of a
phenomenon to explore to gain a better understanding of the

Factors influencing Emergency Department waiting times
©NCCSDO 2007 186
phenomenon; for example, using a survey to highlight extreme cases for
the qualitative research. The unusual thing about ERA is that cases with
large residuals, rather than cases with high or low values of an outcome
variable, form a sampling base for the qualitative research. Thus
qualitative research is focused on uncovering unexplained variance from
quantitative research; that is, ‘reaching the variance which the
quantitative component has failed to reach’.
Although Fry et al. (1981) developed the design, they did not use it in
practice. A search of electronic databases for ERA failed to uncover
examples of its use in practice or its further development. However, it has
been described as an innovative approach to analysing data in mixed-
methods studies (Caracelli and Greene, 1983), and similar approaches
have been discussed as ‘qualitative residual analysis’ (Onwuegbuzie and
Teddlie, 2003) or extreme-case sampling in qualitative research using
cases which do not fit a statistical regression (Qureshi, 1992; Rogers and
Nicolaas, 1998). ERA has the potential to be more powerful than other
combinations of statistical residuals with qualitative research because
there is a formal step of returning to the quantitative data-set with
insights from the qualitative data-set. That is, ERA forces the researcher
to make links between the qualitative and quantitative data and findings.
This overcomes a common failure of mixed-methods studies whereby
qualitative and quantitative components tend to be undertaken separately
rather than exploiting links between data-sets for further insights
(O'Cathain and Thomas, 2006).
How ERA worked in this study
The design of this study of Emergency Department waiting times was
planned without knowledge of ERA. The use of qualitative research to
explore Emergency Departments with large residuals in the quantitative
analysis emerged within team discussions as a powerful way of exploring
factors affecting waiting times. Emergency Departments with small
residuals were also included in the sampling strategy for the qualitative
research. In the early stages of the study, the work of Fry et al. was
identified and shaped the way in which the study was actually
undertaken.
The design of the study followed the first two stages, and part of the third
stage, of ERA. During the early stages of the study, prior to the
qualitative data sampling and data collection, the paper on ERA was
identified. Two new issues were introduced into the study: blinding
between the qualitative and quantitative research, and rerunning the
regression equations incorporating new insights from the qualitative case
studies. The research team made the explicit decision that the qualitative
researchers would be blind to the quantitative findings, in that they would
not be told whether the statistical model had overestimated,

Factors influencing Emergency Department waiting times
©NCCSDO 2007 187
underestimated or accurately predicted the waiting times of Emergency
Departments which had been selected, until they had analysed their data.
Towards the end of the study, findings from the qualitative case studies
were placed alongside the residuals from the regression analysis to
identify further factors which were then tested in the original quantitative
data-set.
The future of ERA in health services research
ERA encouraged researchers in this study to make links between the
quantitative and qualitative data-sets. However, it was not without its
problems. Issues arose that were challenging to deal with, such as the
best way of placing the qualitative data and residuals side by side to
identify hypotheses for testing in the large data-set. Additionally,
research bureaucracy limited the extent to which ERA operated as
planned. For all this, it is an innovative design which the health services
research community may benefit from knowing more about. To this end
we intend to publish a paper about ERA to explain the design and its use
in practice, with this project as a case study.

Factors influencing Emergency Department waiting times
©NCCSDO 2007 188
Appendix references
Audit Commission. 2001. Accident and Emergency. Review of National
Findings. London: Audit Commission
Caracelli, V.J. and Greene, J.C. 1983. Data analysis strategies for mixed-
method evaluation designs. Educational Evaluation and Policy
Analysis 15(2): 195–207
Fry, G., Chantavanich, S. and Chantavanich, A. 1981. Merging
quantitative and qualitative research techniques: toward a new
research paradigm. Anthropology & Education Quarterly XII(2): 145–
57
Mullarkey, S., Wall, T.D., Warr, P.B., Clegg, C.W. and Stride, C.B. 1999.
Measures of Job Satisfaction, Mental Health and Job-Related Well-
Being: A bench-marking manual. Sheffield: Sheffield Academic Press
O'Cathain, A. and Thomas, K. 2006. ‘Mixed methods': combining
qualitative and quantitative methods. In Qualitative Research in
Health Care, 3rd edn (Pope, C. and Mays, N., eds), pp. 102–11
Onwuegbuzie, A.J. and Teddlie, C. 2003. A framework for analysing data
in mixed methods research. In Handbook of Mixed Methods in Social
and Behavioural Research (Tashakkori, A. and Teddlie, C., eds), pp.
351–83. Thousand Oaks, CA: Sage Publications
Qureshi, H. 1992. Integrating methods in applied research in social
policy: a case study of carers. In Brannen, J. (ed.), Mixing Methods:
Qualitative and Quantitative Research. Aldershot: Ashgate
Rogers, A. and Nicolaas, G. 1998. Understanding the patterns and
processes of primary care use: a combined quantitative and
qualitative approach. Sociological Research Online
www.socresonline.org.uk/socresonline/3/4/5.html
Sadler, P.J. 1970. Leadership style, confidence in management and job
satisfaction. Journal of Applied Behavioural Science 6: 3–19
Simpson, A.N., Wardrope, J. and Burke, D. 2001. The Sheffield
experiment: the effects of centralising accident and emergency
services in a large urban setting. Emergency Medicine Journal 18(3):
193–7

This document was published by the National Coordinating Centre for the Service Delivery and Organisation (NCCSDO) research programme, managed by the London School of Hygiene & Tropical Medicine.
The management of the Service Delivery and Organisation (SDO) programme has now transferred to the National Institute for Health Research Evaluations, Trials and Studies Coordinating Centre (NETSCC) based at the University of Southampton. Prior to April 2009, NETSCC had no involvement in the commissioning or production of this document and therefore we may not be able to comment on the background or technical detail of this document. Should you have any queries please contact [email protected].

Disclaimer: This report presents independent research commissioned by the National Institute for Health Research (NIHR). The views and opinions expressed therein are those of the authors and do not necessarily reflect those of the NHS, the NIHR, the SDO programme or the Department of Health.