Satellite altimetry for geodetic, oceanographic and climate - Geodesy

adar altimeter measurements of the marine geoid col-lected during the Seasat altimeter mission gave geo-physicists hope of uncovering the gravity field over all theocean basins. However, because of insufficient track den-sity, it has taken 16 years for the full potential of the satel-lite altimeter to be realized. The high-density coverageobtained by ERS-1 during its geodetic mapping phase(April 1994-March 1995) prompted the U.S. Navy todeclassify all of the Geosat altimeter data in June 1995. Thecombination of these two high-density data sets providedthe first global view of all the ocean basins at a wavelengthresolution of 20-30 km.
Here we assess the future of satellite altimetry forexploration in relation to other measurements and thetypes of structures that need to be imaged. We address thefollowing questions: What are the physical limitations ofsatellite altimetry? Can satellite-derived gravity beimproved using more measurements or better processing?How well does satellite-derived gravity compare withmore accurate local surveys, especially near land? Andfinally, what is the best way to merge satellite-derivedgravity with more accurate local data?
Satellite altimetry methods and limitations. A satellitealtimeter uses pulse-limited radar to measure the altitudeof the satellite above the closest point of the sea surface.Global precise tracking coupled with orbit dynamic cal-culations provide an independent measurement of theheight of the satellite above the ellipsoid. The differencebetween these two measurements is equal to the height ofthe sea surface (~geoid height) minus any delays in thepropagation of the radar echo due to the ionosphere andtroposphere. There are many errors in these measure-ments but most occur over length scales greater than a fewhundred km. For exploration or detailed marine geo-physical studies which focus on shorter wavelengths, themajor source of error is the roughness of the ocean surfacedue to waves (1-6 m). The radar pulse reflects from an areaof ocean surface (footprint) that grows with increasingwave height. The superposition of the reflections from thislarger area stabilizes the shape of the echo, but it alsosmooths the echo so that the timing of its leading edge ismore uncertain. By averaging many echoes (1000 Hz) overmultiple repeat cycles, precision of 10-20 mm can beachieved. Over 4 km (i.e., 1/4 wavelength) this corre-sponds to a sea-surface slope error of 4-µrad. Laplace'sequation provides the mapping from sea surface slope togravity anomaly, so a 4-µrad slope error maps into a grav-ity error of about 4-mGal. Thus the only way to improvethe resolution is to make many more measurements orstop the ocean waves!
The situation is even more hopeless in the deep oceans(~4000 m) because upward continuation of the gravityfield from the ocean floor to the ocean surface provides astrong high-cut filter to the gravity signal. Consider ananomaly on the ocean floor with a 16-km wavelength anda 15-mGal amplitude (i.e., a typical value for oceans). Onthe surface this anomaly will be reduced to 3.1 mGal by
upward continuation. Of course on the shallow margins,the upward continuation effect is minimal so there will beimportant signals having wavelengths down to a few hun-dred meters (Table 1). Global satellite gravity grids areoptimized for the dominant deep-ocean situation by high-cut filtering the data. For shallow-water exploration, onemay ask if the resolution can be pushed to shorter wave-lengths. We think there are some minor improvements tobe made through more careful treatment of the data, butthere won't be a breakthrough.
Gravity anomaly resolution — the thresholds of surveyreliability. Gravity anomaly resolution can be measuredboth objectively and subjectively. The objective approachis to establish the wavelength where the noise level andsignal levels are equal. In the case of satellite altimetry, thiscan be done in the Gulf of Mexico where the true gravitysignal is known from more precise shipboard measure-ments. More commonly, a subjective approach is usedwhere one identifies the smallest anomaly apparent in agravity map. The danger is that a group of people will pro-vide a variety of estimates, and many estimates may beoptimistic. Nevertheless, it is important to understand thelikely noise threshold for a map so that you can knowwhich anomalies can be trusted and which should beevaluated with suspicion. The following opinions aremeant to help with that understanding:
• The size of an anomaly is a combination of its ampli-tude in mGal and its width or apparent wavelength
JANUARY 1998 THE LEADING EDGE 73
Figure 1. In the course of processing, both signal andnoise are filtered together in the effort to suppressnoise. The dashed curve shows the effect of a 5-km-wavelength, high-cut filter on the signal of an anom-aly source with a depth of 1 km. At this scale, a 1-km-wavelength, high-cut filter has no discernible effect.
What are the limitations of satellite altimetry? MARA M. YALE and DAVID T. SANDWELL, Scripps Institution of Oceanography, La Jolla, CaliforniaALAN T. HERRING, EDCON, Denver, Colorado
R
where wavelength typically amounts to somethingless than twice the anomaly width.
• Shorter wavelength anomalies tend to have shallow-er sources and smaller amplitudes.
• Wavelengths longer than depth to source dominate thegravity anomaly signal; i.e., a high-cut filter that cutsonly wavelengths shorter than the depth to source willhave practically no effect on anomaly half-widths andanomaly gradient measurements typically used fordepth estimation. Any greater degree of filtering orsmoothing will have a marked impact on anomalyshape and will distort interpretation results. Figure 1is an example.
Wavelength resolution is limited by sampling intervaland ultimately by wavelength filtering used to reducenoise and enhance signal (Figure 2). Typically station grav-ity data are not filtered, including underwater and micro-gravity surveys. So, in the case of station data, wave-length resolution is taken to be twice the station spacing,and station repeatability gives an estimate of amplituderesolution.
In the case of satellite gravity and dynamic gravity(marine and airborne), practically continuous data areavailable along acquisition tracks so that it is the level offiltering used in processing that determines wavelengthresolution; line spacing is important, but it is the level offiltering that limits spatial resolution. Filtering is necessaryto suppress short-wavelength, high-amplitude noise thatwould otherwise obliterate the signal. Remarkably, sub-milligal signal is routinely extracted from dynamic-grav-ity background noise levels of tens of thousands of milli-
74 THE LEADING EDGE JANUARY 1998
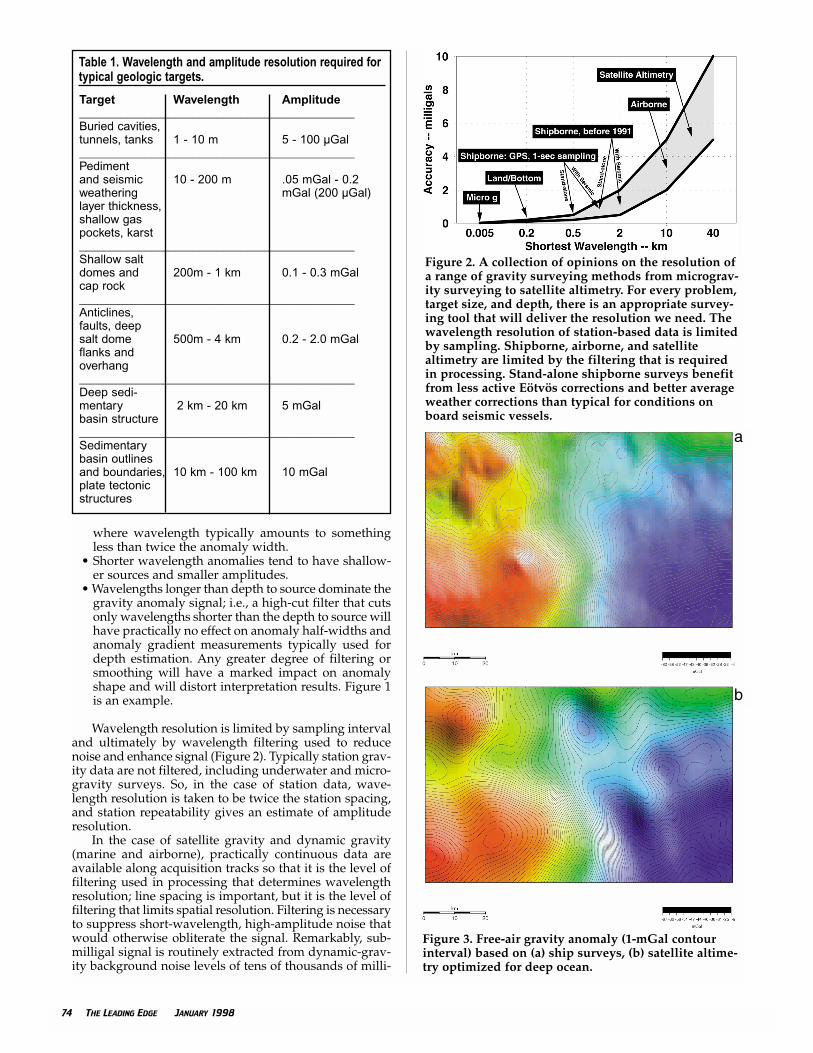
Figure 2. A collection of opinions on the resolution ofa range of gravity surveying methods from micrograv-ity surveying to satellite altimetry. For every problem,target size, and depth, there is an appropriate survey-ing tool that will deliver the resolution we need. Thewavelength resolution of station-based data is limitedby sampling. Shipborne, airborne, and satellitealtimetry are limited by the filtering that is requiredin processing. Stand-alone shipborne surveys benefitfrom less active Eötvös corrections and better averageweather corrections than typical for conditions onboard seismic vessels.
Figure 3. Free-air gravity anomaly (1-mGal contourinterval) based on (a) ship surveys, (b) satellite altime-try optimized for deep ocean.
Table 1. Wavelength and amplitude resolution required fortypical geologic targets.
Target Wavelength Amplitude______________________________________________Buried cavities,tunnels, tanks 1 - 10 m 5 - 100 µGal______________________________________________Pediment and seismic 10 - 200 m .05 mGal - 0.2 weathering mGal (200 µGal)layer thickness,shallow gas pockets, karst______________________________________________Shallow salt domes and 200m - 1 km 0.1 - 0.3 mGalcap rock______________________________________________Anticlines,faults, deepsalt dome 500m - 4 km 0.2 - 2.0 mGalflanks and overhang______________________________________________Deep sedi-mentary 2 km - 20 km 5 mGalbasin structure______________________________________________Sedimentary basin outlines and boundaries, 10 km - 100 km 10 mGal plate tectonic structures
a
b

gals. Dynamic gravity resolution has improved over thepast few years mainly because of improved GPS posi-tioning and the consequent improvements to instrumen-tation and processing. The present state-of-the-art, underthe very best conditions, seems to be stuck at a wavelengthresolution of about three minutes of sailing or flight time,which corresponds to about 500 m at typical ship speedsand 9 km at a typical 90-knot survey aircraft speed.Gravity gradiometry seems to hold the most promise fora further breakthrough in resolution.
Satellite gravity also seems to have practical limits ofresolution with a threshold around 20-40 km, depend-ing on the level of noise that you think you can seethrough. Marginal data often show intriguing, but false,anomaly patterns. These can be misleading and costly.Figure 3a is a free-air anomaly map taken from an areain the Gulf of Mexico and based on a high-qualitymarine gravity data with a line spacing of 1 mile. Forpurposes of comparing with satellite-derived gravitymaps, this represents the true gravity field. The corre-sponding free-air gravity field based on satellite altime-try shows the same broad features but lacks importantdetails (Figure 3b).
Ground truth accuracy and resolution of satellite-derived gravity. The Gulf of Mexico provides a uniqueopportunity to assess the accuracy and resolution ofsatellite-derived gravity because of the high-accuracymarine gravity coverage available in EDCON's archives.In an effort to improve gravity field resolution, up to 43profiles from the repeat phases of the ERS-1 and ERS-2missions were averaged using the methods described byYale et al. in the Journal of Geophysical Research in 1995.Along-track sea-surface slopes from the V7.2 gravityfield were subtracted from the stacked profiles, result-ing in residual profiles containing both signal and noisenot captured in the V7.2 gravity grid. A 1-D Hankeltransform was used to convert these along-track resid-ual slopes into residual gravity, and finally the V7.2gravity was added back to form a full bandwidth grav-ity profile. We then extracted the ground-truth gravityalong 40 of these stacked profiles in the northern Gulffrom the EDCON data. An example is shown in Figure
4 (top) where satellite gravity (noisy) is plotted alongwith ship gravity (smooth). The mean and rms differ-ences of -0.7 and 4.4 mGal are representative of the other39 profiles (the mean of all of the rms’s is 4.7 mGal). Anexamination of all of the profiles reveals a number ofcommon features:
• Mean differences are generally less than 1 mGal.• There is usually good agreement for gravity features
greater than 50 km across, but there are some differ-ences (Figure 4, top).
• There is good agreement for some of the smaller-scalefeatures but poor agreement for others. A 10-km high-cut filter does not suppress all of the altimeter noise,but a 20-km filter may be too strong in shallow areas.
• About 1/2 of the profiles show high noise levels with-in about 20 km of the coastline, suggesting some strayechoes are effecting the radar and/or our processinghas introduced significant edge effects.
• Less filtering combined with stacking more profilescan improve ERS resolution from 30 km to the 24-kmresolution (Figure 4 bottom).
• The comparison of ship and satellite gravity in theAlaminos Canyon area (Figure 3) reveals other impor-tant features. In this case the satellite-derived gravitywas filtered (~22 km wavelength) to suppress thenoise. However, it is clear that this filtering eliminatessmall-scale structure that is apparent in the shipboardgravity.
The value of satellite gravity. These figures illustrate thevalue and limits of satellite gravity. A broad view of thegravity field over most of the world’s oceans is availableto anyone at practically no cost (http://topex.ucsd.edu).The locations of sedimentary basins along with regionalstructural relationships can be reliably interpreted fromsatellite gravity. Satellite gravity provides regional back-ground control for detailed marine surveys. In fact, satel-lite gravity is usually more valuable and reliable thanwidely spaced public and commercial marine data thatwere acquired 20 or 30 years ago.
On the other hand, structural features within basins,including salt domes, anticlines, and fault blocks at a
JANUARY 1998 THE LEADING EDGE 75
Figure 4. (top) Comparison of ship-board (smooth) and satellite-derived(noisy) gravity in the Gulf of Mexico.The satellite-derived gravity profile is astack of up to 43 repeat profiles andrepresents a best-case example. Thereis good agreement at wavelengthsgreater than about 50 km except in afew locations. At small scales thealtimeter-derived gravity contains bothsignal and noise (a 10-km wavelengthhigh-cut filter was applied). (bottom)Coherence between stacked ERSaltimetry and the ground truth ship (25profiles across northern Gulf) data pro-vides a quantitative resolution of 24 kmat 0.5 coherence where signal-to-noiseequals 1. This slight improvement inresolution over deep ocean compar-isons (23-30 km) may be due to thehigher signal strength of the shallowerwater in the Gulf.

petroleum-prospect scale of interest (Table 1), usuallyrequire resolution at much shorter wavelengths than canbe reliably taken from satellite measurements. It is obvi-ously perilous to pursue a prospect based on a fictitiousanomaly.
Summary. So here are brief answers to the original ques-tions:
Ocean surface waves are the primary factor that lim-its the accuracy and resolution of the satellite-derivedgravity. A factor of 2 improvement will require 4 timesmore data. Since ERS and Geosat data span 10 years, we would need another 30 years of data collection.
In the case of ERS data, better processing of the rawwaveform data may lead to significant gains in accuracy,but the improvement will be less than a factor of 2. Geosatand Topex altimeter data do not suffer from the noiseproblems of the ERS onboard tracker, so don't expectmuch overall improvement in the global gravity models.
A number of independent studies show satellite-derived gravity has accuracies of 3-7 mGal and resolutionof 20-30 km depending on such factors as typical sea stateand proximity to land.
The best way to use satellite-derived gravity for explo-ration is to augment the more accurate local surveys. Thesatellite-derived gravity can provide the big picture need-ed for the local interpretation. This is especially true inareas where large-scale tectonics has had an importantinfluence on basin development.
Corresponding author: Alan Herring, EDCON, 171 S. Van GordonStreet, Denver, C0 80228.
76 THE LEADING EDGE JANUARY 1998
LE