What are the ineractions between food security and planetary boundaries
48
What are the interactions between Food Security and Planetary Boundaries? John Ingram NERC Food Security Leader Environmental Change Institute University of Oxford ?
-
Upload
get-resilient -
Category
Documents
-
view
214 -
download
0
description
John Ingram Natural Environment Research Council (NERC)
Transcript of What are the ineractions between food security and planetary boundaries
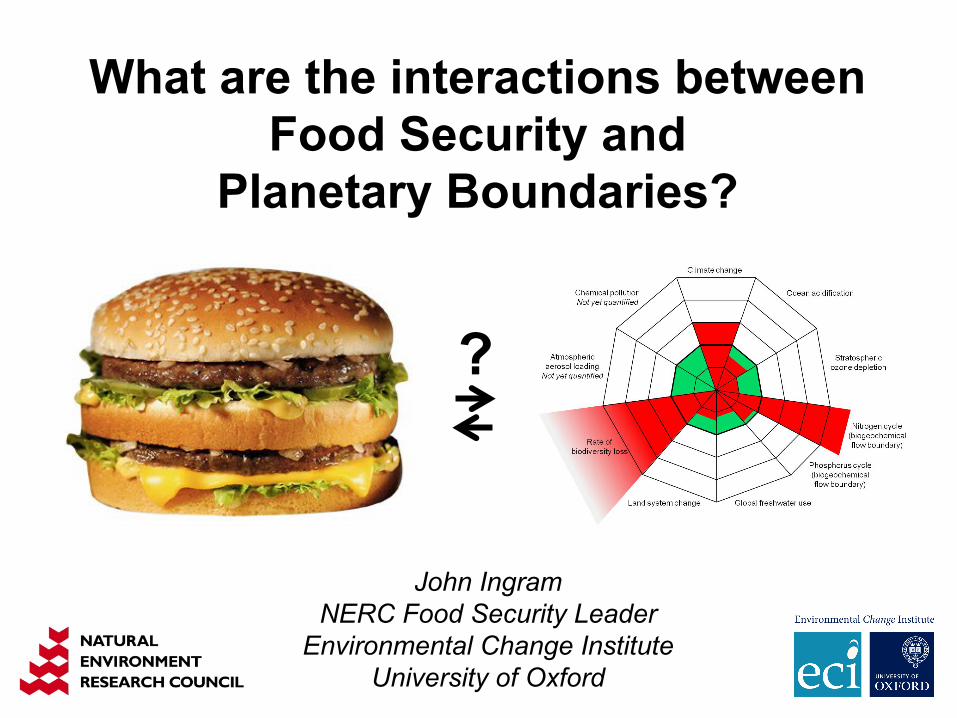
What are the interactions between Food Security and
Planetary Boundaries?
John Ingram NERC Food Security Leader
Environmental Change Institute University of Oxford
?
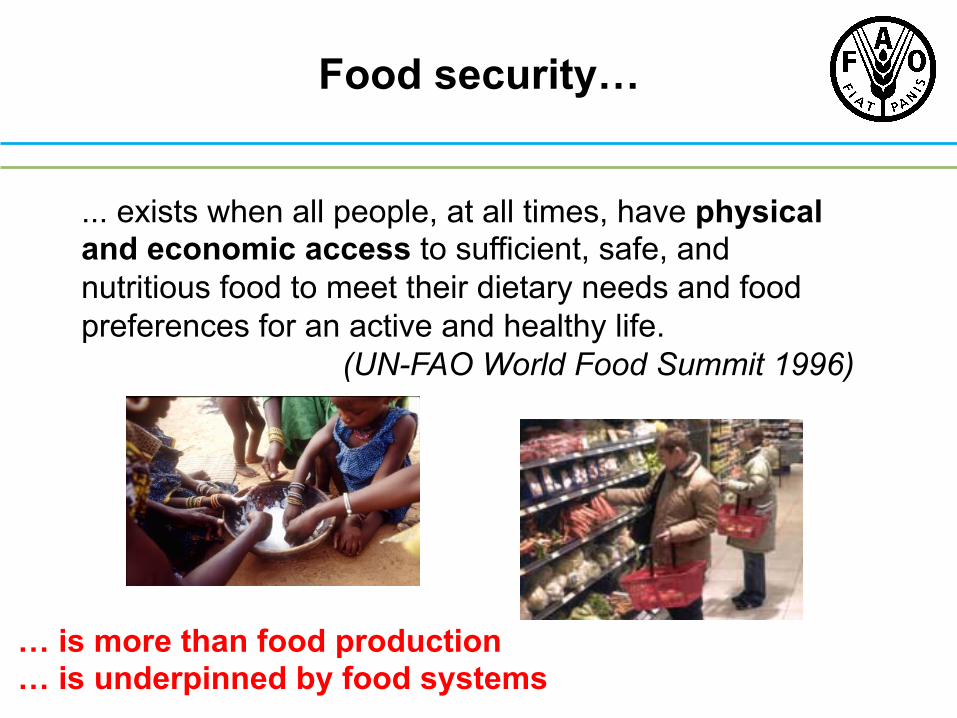
Food security…
... exists when all people, at all times, have physical and economic access to sufficient, safe, and nutritious food to meet their dietary needs and food preferences for an active and healthy life.
(UN-FAO World Food Summit 1996)
… is more than food production … is underpinned by food systems
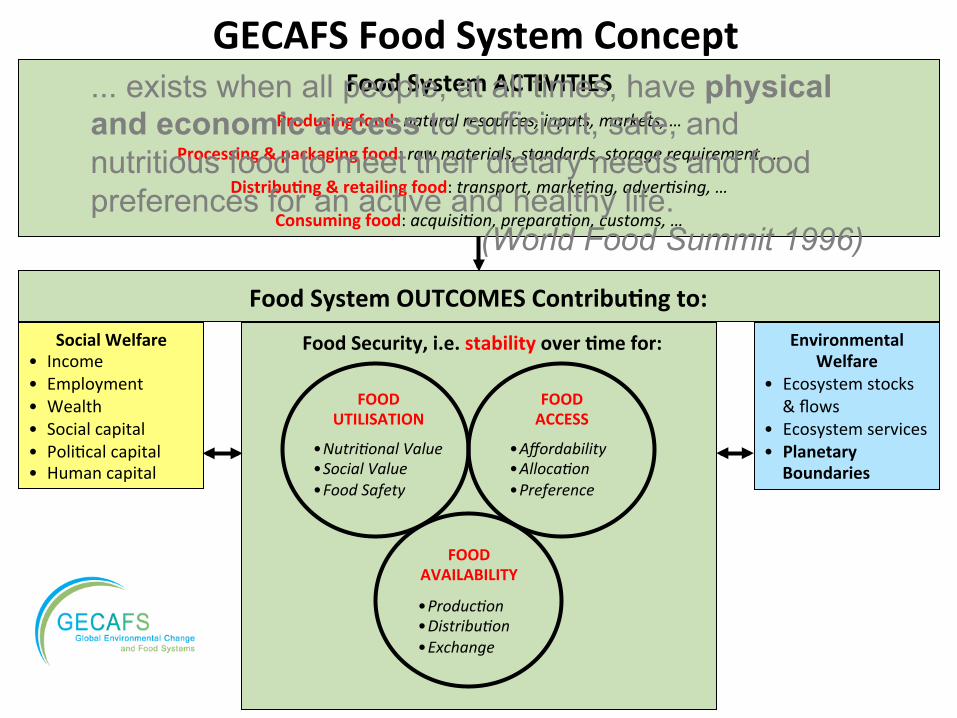
Food Security, i.e. stability over 4me for:
FOOD UTILISATION
FOOD ACCESS
• Affordability • Alloca.on • Preference
• Nutri.onal Value • Social Value • Food Safety
FOOD AVAILABILITY
• Produc.on • Distribu.on • Exchange
Environmental Welfare
• Ecosystem stocks & flows
• Ecosystem services • Planetary Boundaries
Social Welfare • Income • Employment • Wealth • Social capital • Poli;cal capital • Human capital
Food System OUTCOMES Contribu4ng to:
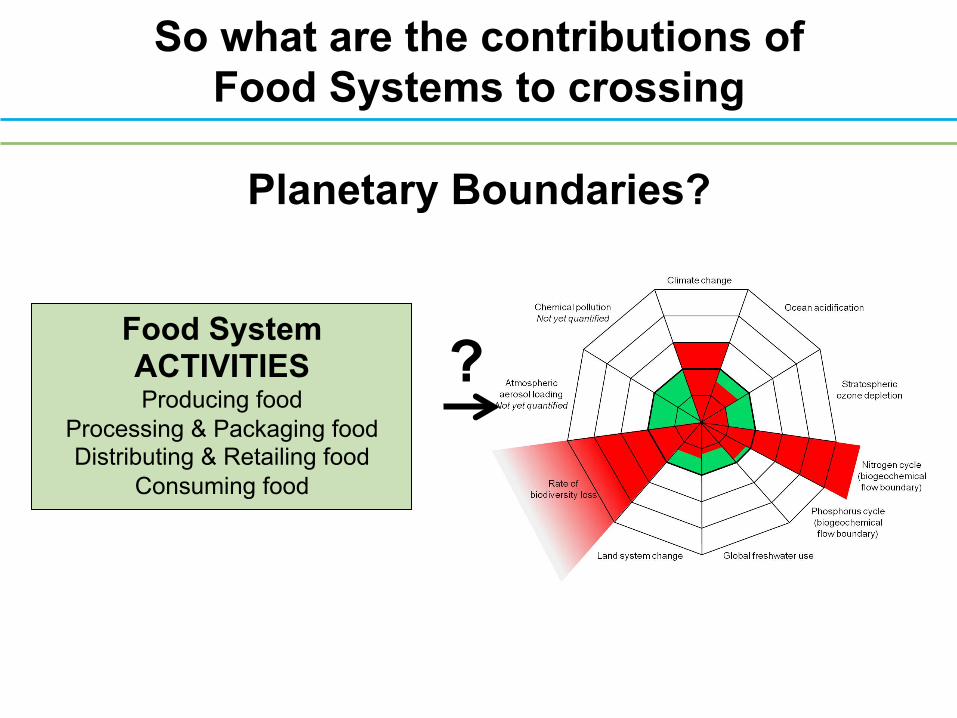
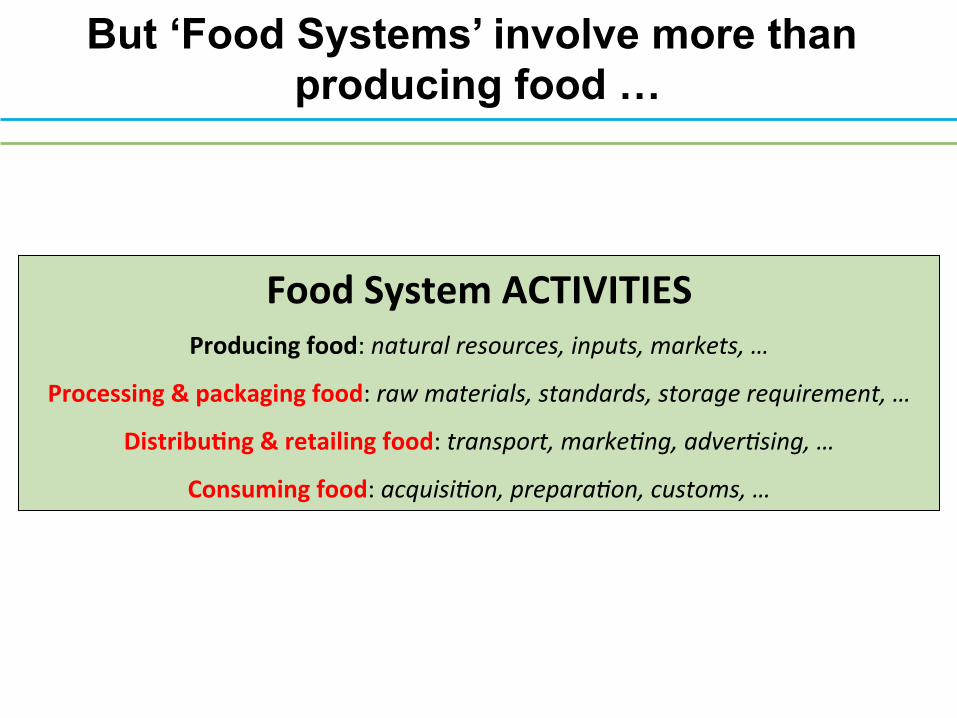
Food System ACTIVITIES Producing food: natural resources, inputs, markets, …
Processing & packaging food: raw materials, standards, storage requirement, …
Distribu4ng & retailing food: transport, marke.ng, adver.sing, …
Consuming food: acquisi.on, prepara.on, customs, …
GECAFS Food System Concept ... exists when all people, at all times, have physical and economic access to sufficient, safe, and nutritious food to meet their dietary needs and food preferences for an active and healthy life.
(World Food Summit 1996)
Food System ACTIVITIES Producing food
Processing & Packaging food Distributing & Retailing food
Consuming food
?
So what are the contributions of Food Systems to crossing
Planetary Boundaries?
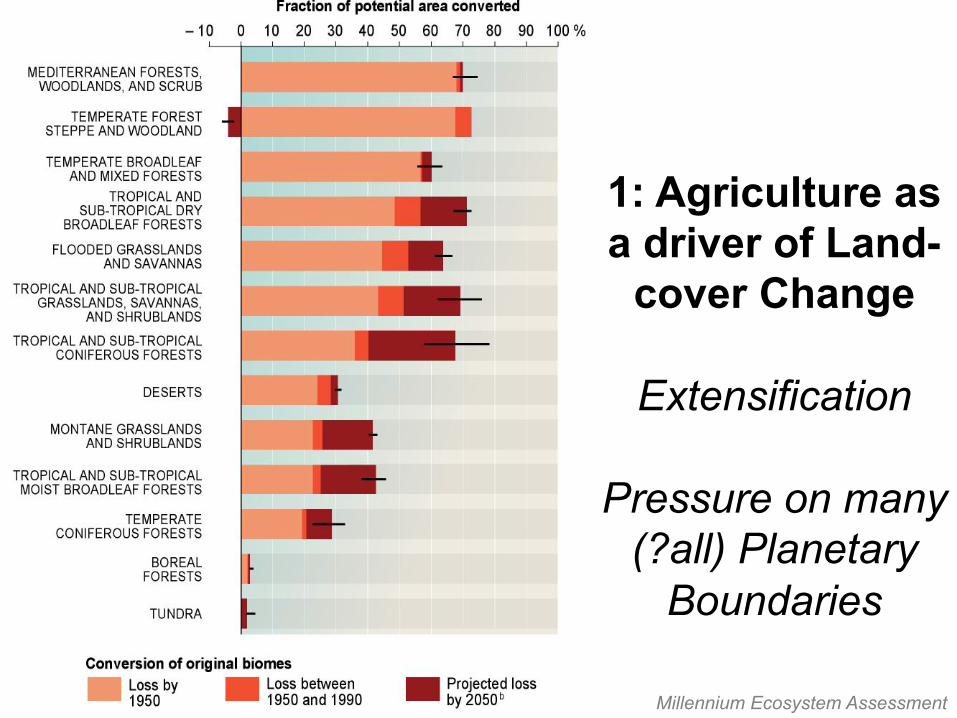
1: Agriculture as a driver of Land-
cover Change
Extensification
Pressure on many (?all) Planetary
Boundaries
Millennium Ecosystem Assessment
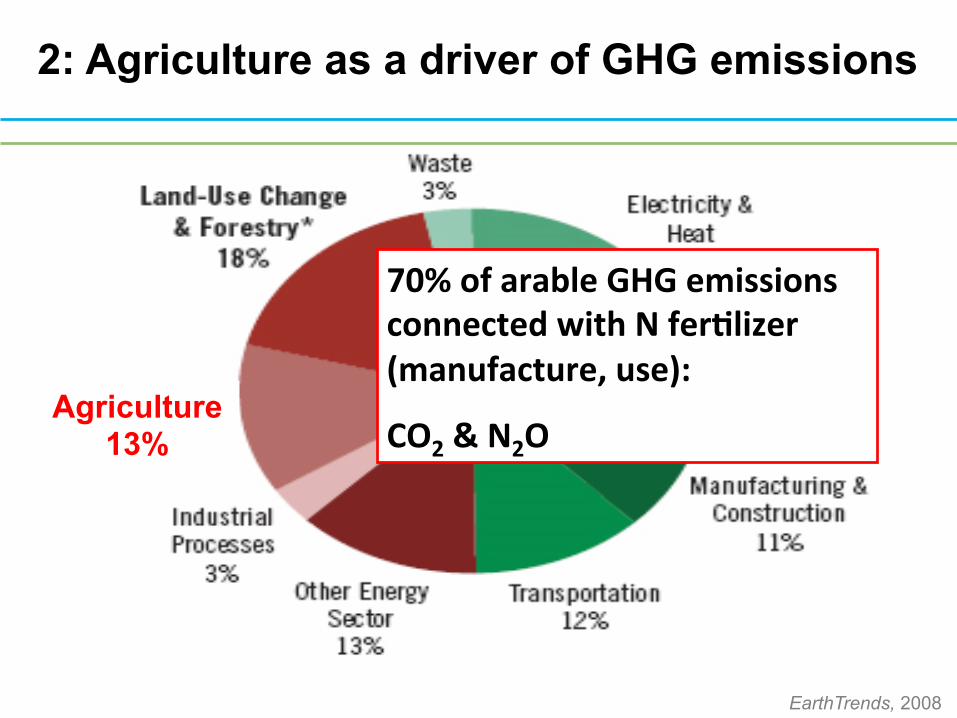
Agriculture 13%
70% of arable GHG emissions connected with N fer4lizer (manufacture, use):
CO2 & N2O
2: Agriculture as a driver of GHG emissions
EarthTrends, 2008
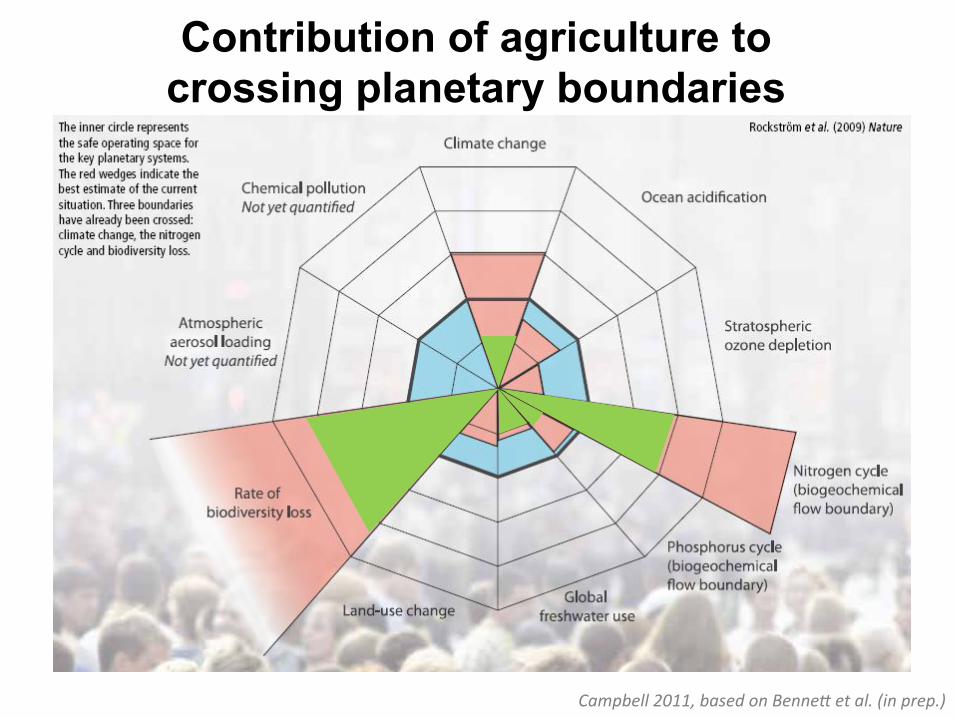
Campbell 2011, based on BenneK et al. (in prep.)
Contribution of agriculture to crossing planetary boundaries

Contribution of capture fisheries to crossing planetary boundaries
Food System ACTIVITIES Producing food: natural resources, inputs, markets, …
Processing & packaging food: raw materials, standards, storage requirement, …
Distribu4ng & retailing food: transport, marke.ng, adver.sing, …
Consuming food: acquisi.on, prepara.on, customs, …
But ‘Food Systems’ involve more than producing food …
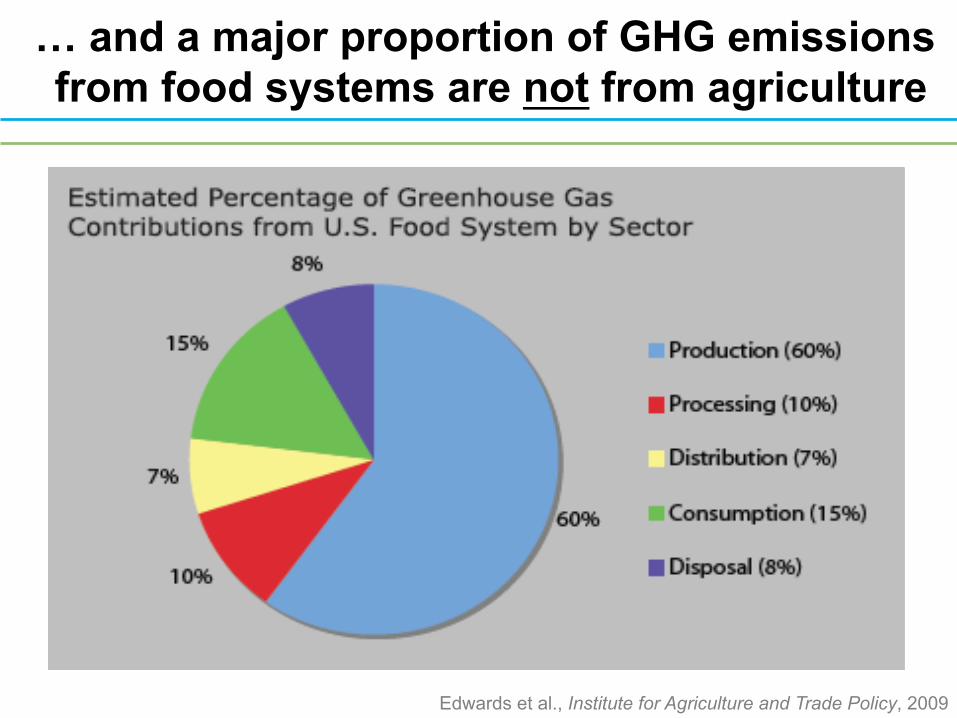
… and a major proportion of GHG emissions from food systems are not from agriculture
Edwards et al., Institute for Agriculture and Trade Policy, 2009
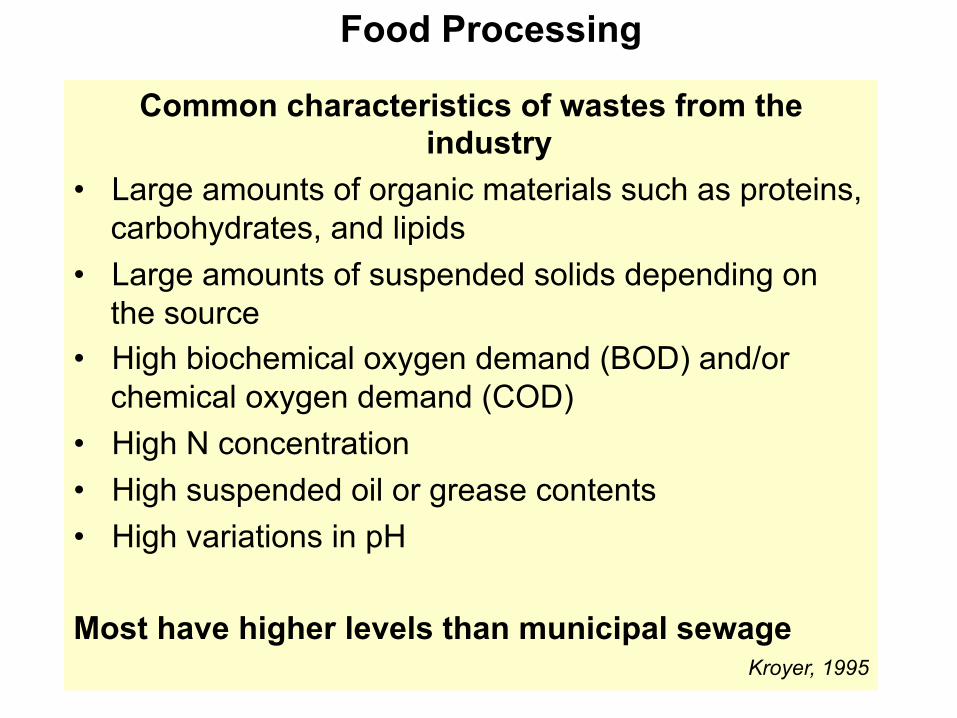
Food Processing
Common characteristics of wastes from the industry
• Large amounts of organic materials such as proteins, carbohydrates, and lipids
• Large amounts of suspended solids depending on the source
• High biochemical oxygen demand (BOD) and/or chemical oxygen demand (COD)
• High N concentration • High suspended oil or grease contents • High variations in pH Most have higher levels than municipal sewage
Kroyer, 1995
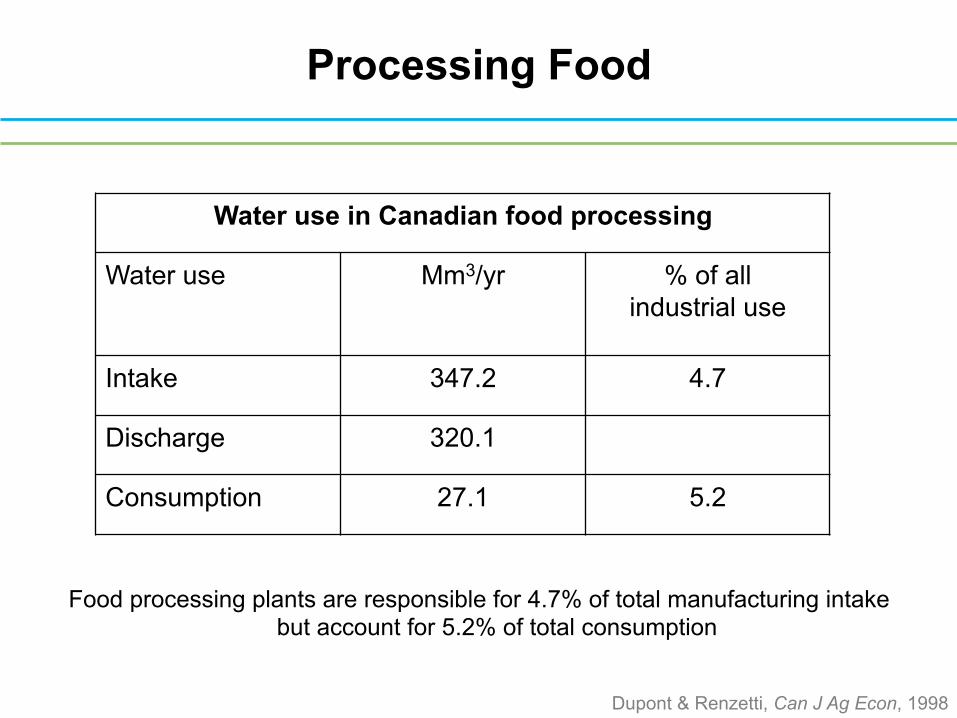
Dupont & Renzetti, Can J Ag Econ, 1998
Food processing plants are responsible for 4.7% of total manufacturing intake but account for 5.2% of total consumption
Water use in Canadian food processing
Water use Mm3/yr % of all industrial use
Intake 347.2 4.7
Discharge 320.1
Consumption 27.1 5.2
Processing Food
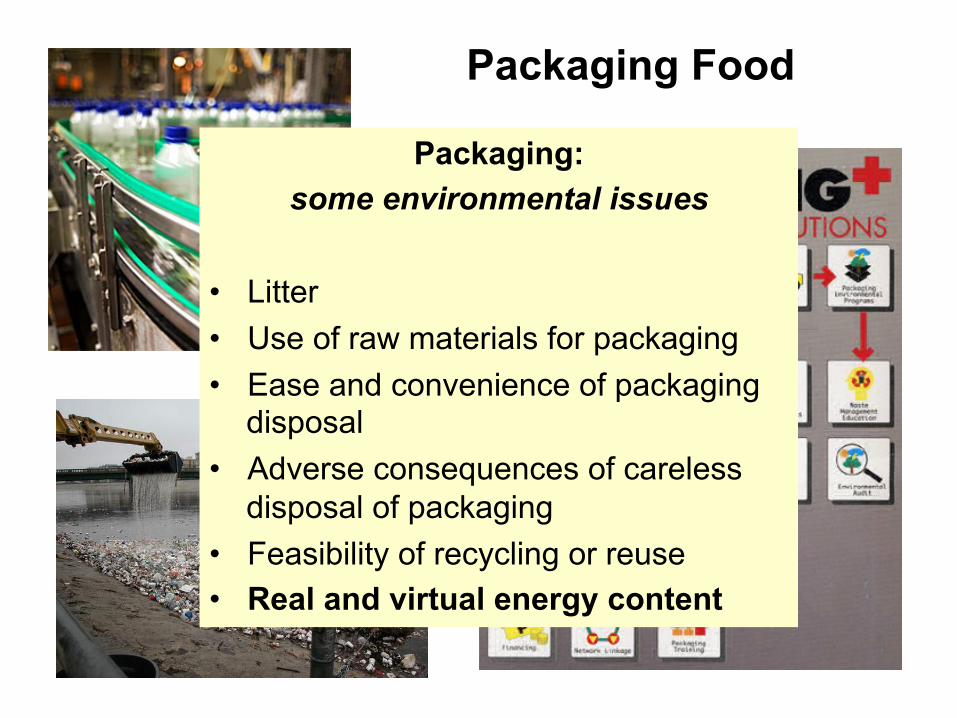
Packaging Food
Packaging: some environmental issues
• Litter • Use of raw materials for packaging • Ease and convenience of packaging
disposal • Adverse consequences of careless
disposal of packaging • Feasibility of recycling or reuse • Real and virtual energy content

Guardian 1 February 2009
Refrigerant leakage accounts for 30% of super-markets’ direct GHG emissions (Environment Investigation Agency, 2010)
Retailing food
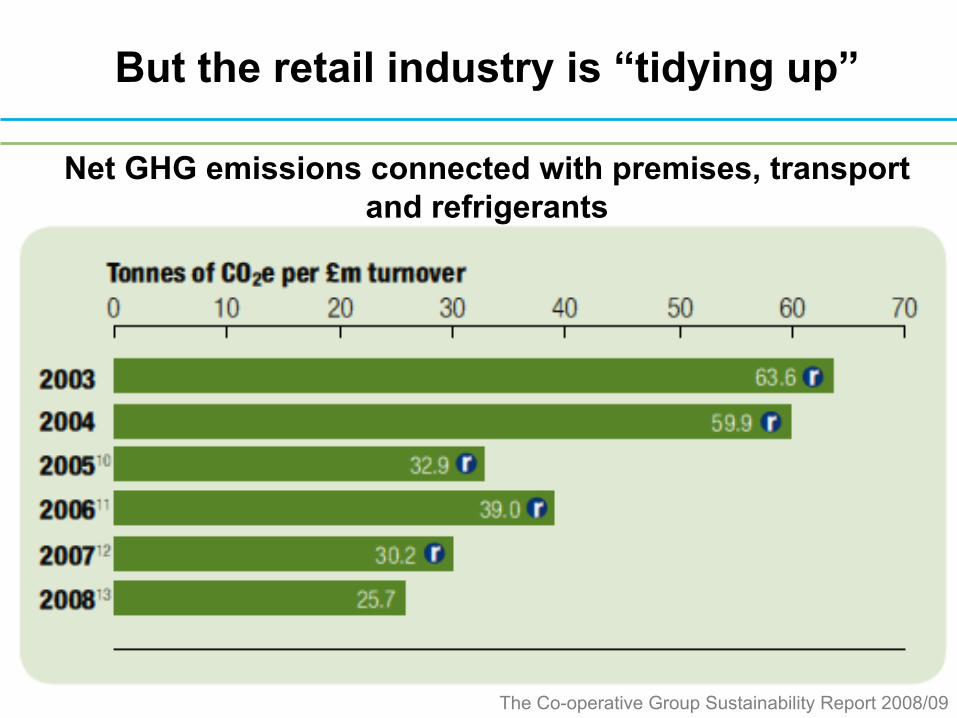
The Co-operative Group Sustainability Report 2008/09
But the retail industry is “tidying up”
Net GHG emissions connected with premises, transport and refrigerants
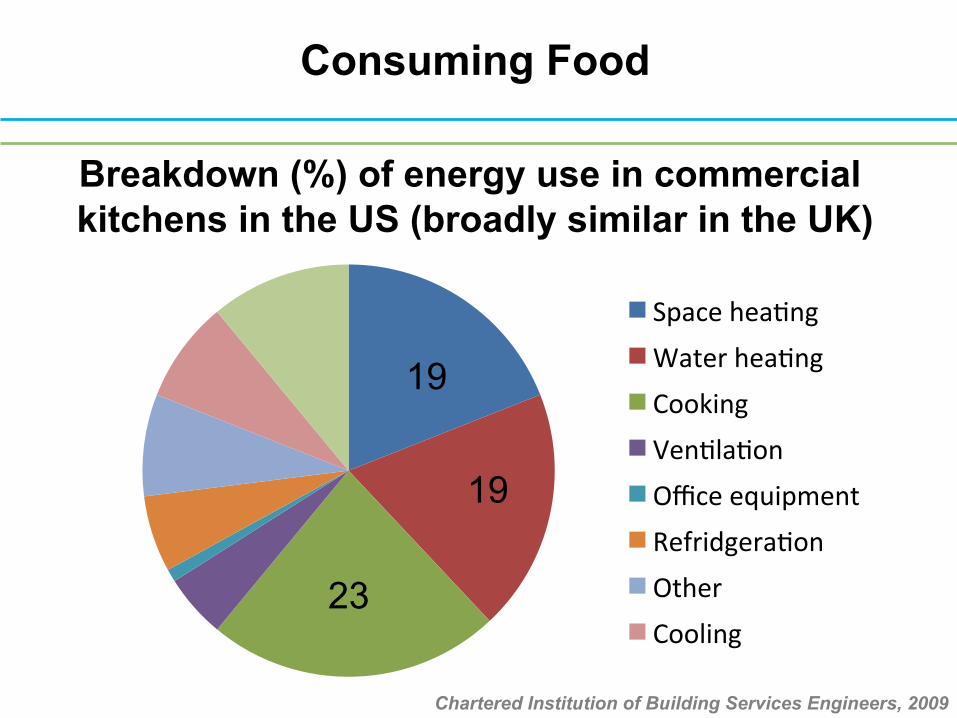
Consuming Food
Breakdown (%) of energy use in commercial kitchens in the US (broadly similar in the UK)
Space hea;ng Water hea;ng Cooking Ven;la;on Office equipment Refridgera;on Other Cooling
19
23
19
Chartered Institution of Building Services Engineers, 2009
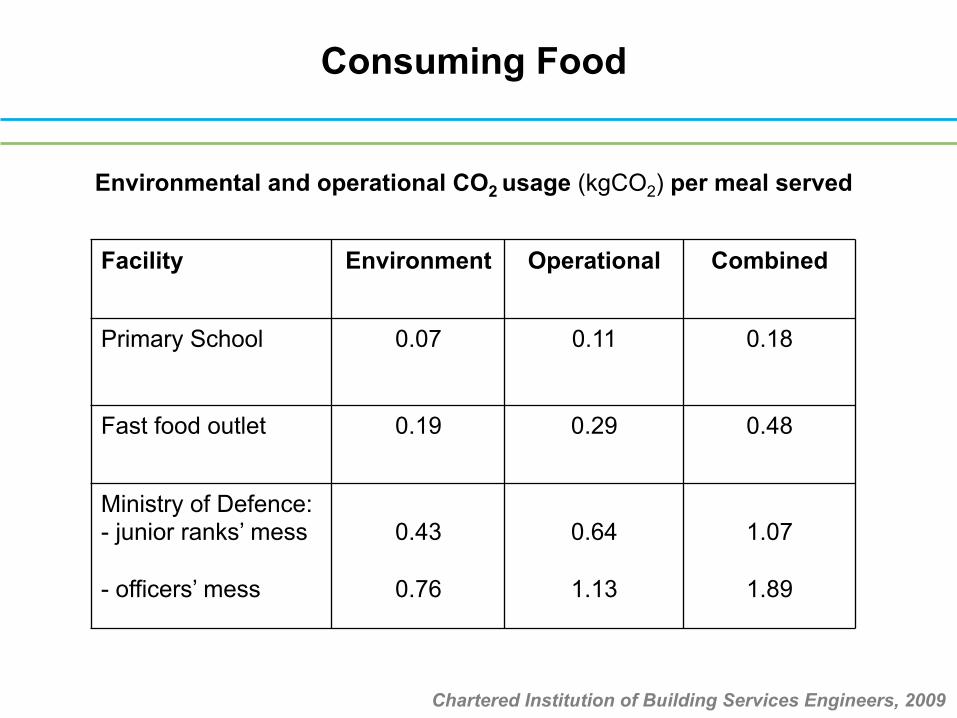
Consuming Food
Environmental and operational CO2 usage (kgCO2) per meal served
Facility Environment Operational Combined
Primary School 0.07 0.11 0.18
Fast food outlet 0.19 0.29 0.48
Ministry of Defence: - junior ranks’ mess
- officers’ mess
0.43
0.76
0.64
1.13
1.07
1.89
Chartered Institution of Building Services Engineers, 2009

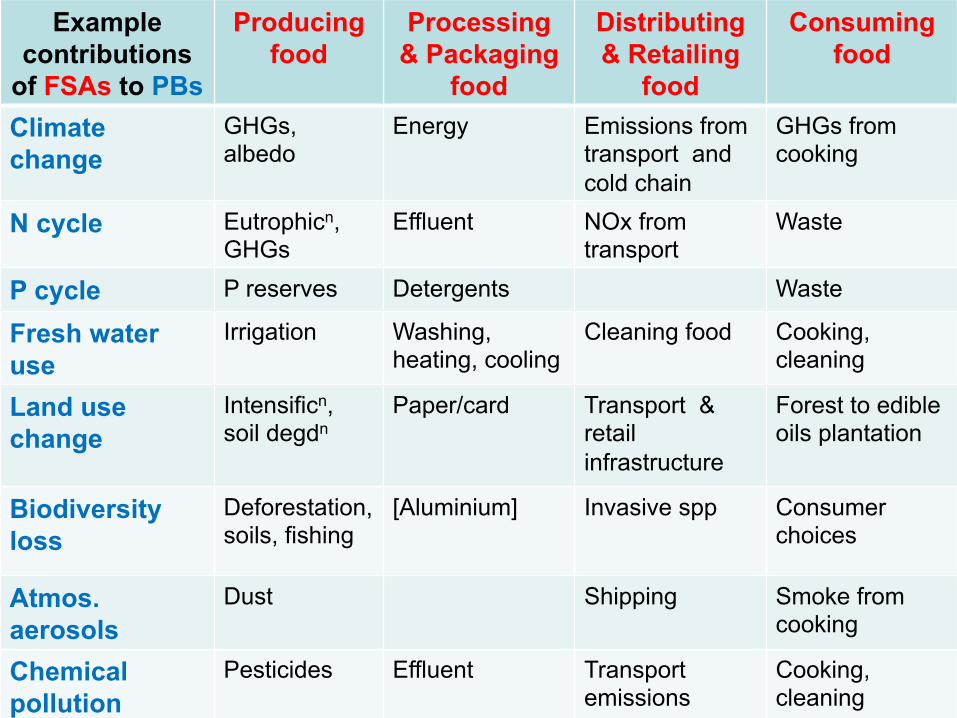
Example contributions
of FSAs to PBs
Producing food
Processing & Packaging
food
Distributing & Retailing
food
Consuming food
Climate change
N cycle
P cycle Fresh water use Land use change
Biodiversity loss
Atmos. aerosols Chemical pollution
Example contributions
of FSAs to PBs
Producing food
Processing & Packaging
food
Distributing & Retailing
food
Consuming food
Climate change
GHGs, albedo
Energy Emissions from transport and cold chain
GHGs from cooking
N cycle Eutrophicn, GHGs
Effluent NOx from transport
Waste
P cycle P reserves Detergents Waste
Fresh water use
Irrigation Washing, heating, cooling
Cleaning food Cooking, cleaning
Land use change
Intensificn, soil degdn
Paper/card
Transport & retail infrastructure
Forest to edible oils plantation
Biodiversity loss
Deforestation, soils, fishing
[Aluminium]
Invasive spp Consumer choices
Atmos. aerosols
Dust Shipping Smoke from cooking
Chemical pollution
Pesticides Effluent Transport emissions
Cooking, cleaning
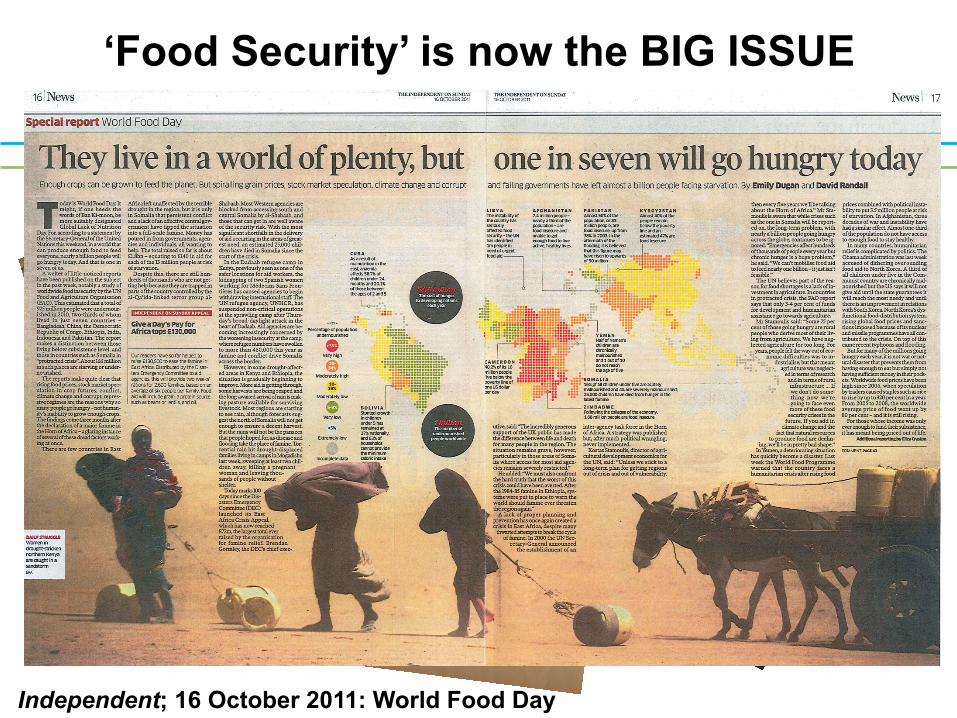
‘Food Security’ is now the BIG ISSUE
Independent; 16 October 2011: World Food Day
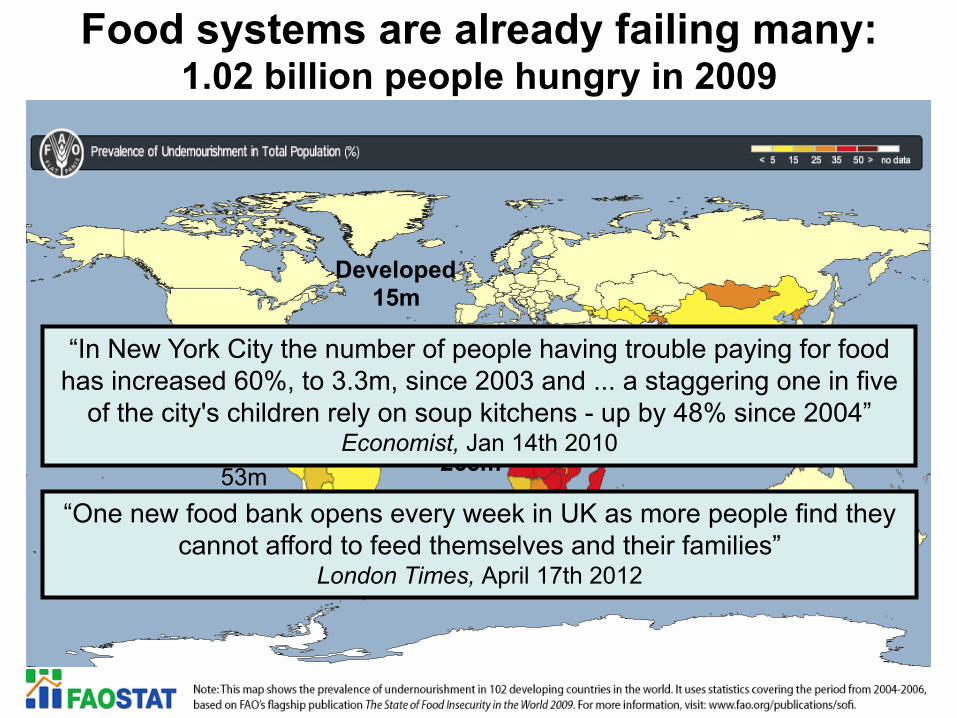
LAC 53m
Asia & Pac 642m
SSA 265m
NENA 42m
Developed 15m
Food systems are already failing many: 1.02 billion people hungry in 2009
“In New York City the number of people having trouble paying for food has increased 60%, to 3.3m, since 2003 and ... a staggering one in five
of the city's children rely on soup kitchens - up by 48% since 2004” Economist, Jan 14th 2010
“One new food bank opens every week in UK as more people find they cannot afford to feed themselves and their families”
London Times, April 17th 2012
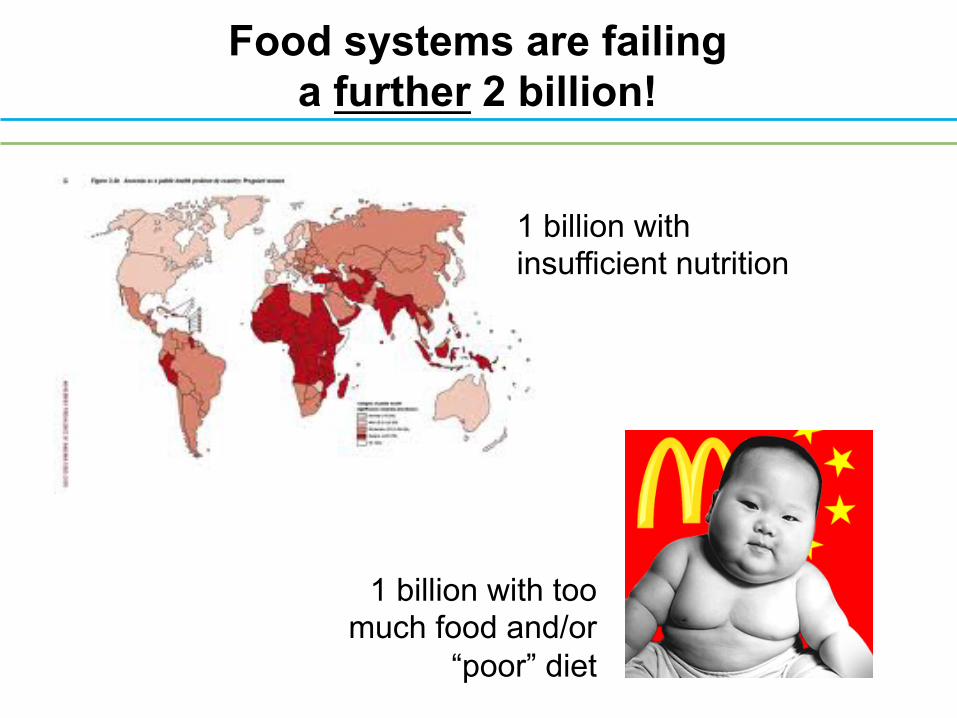
Food systems are failing a further 2 billion!
1 billion with too much food and/or
“poor” diet
1 billion with insufficient nutrition
?
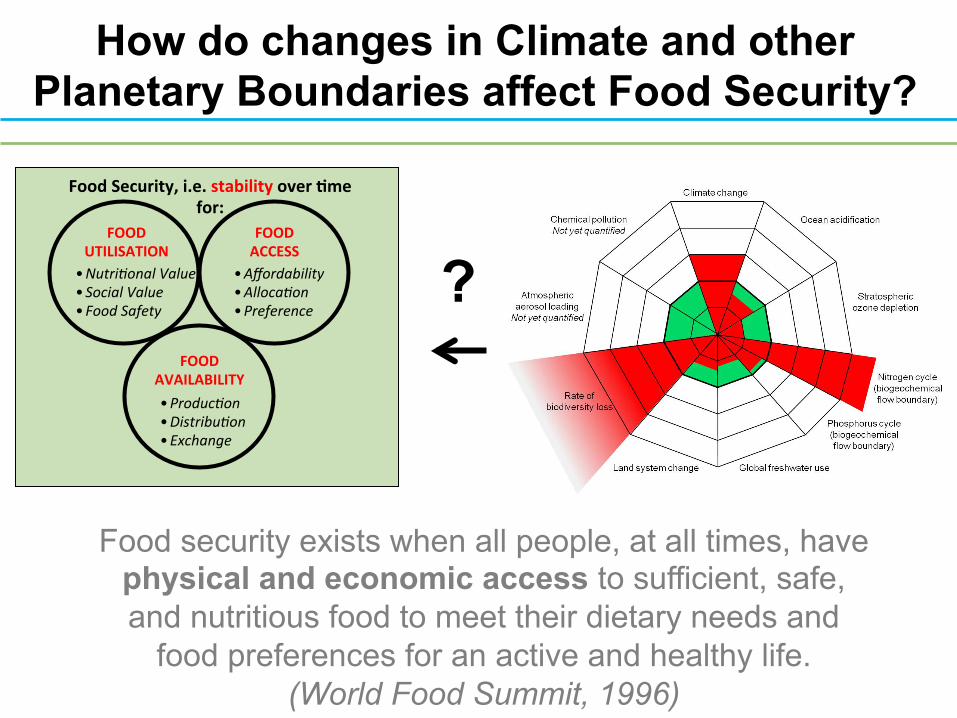
Food Security, i.e. stability over 4me for:
FOOD UTILISATION
FOOD ACCESS
• Affordability • Alloca.on • Preference
• Nutri.onal Value • Social Value • Food Safety
FOOD AVAILABILITY • Produc.on • Distribu.on • Exchange
How do changes in Climate and other Planetary Boundaries affect Food Security?
Food security exists when all people, at all times, have physical and economic access to sufficient, safe, and nutritious food to meet their dietary needs and
food preferences for an active and healthy life. (World Food Summit, 1996)
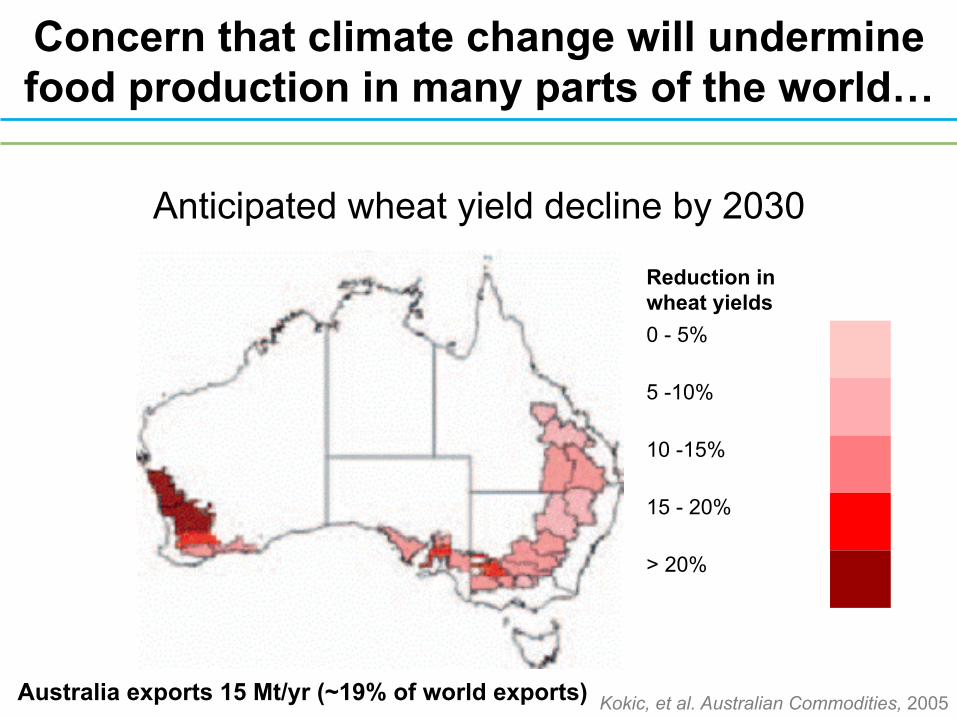
Concern that climate change will undermine food production in many parts of the world…
Reduction in wheat yields 0 - 5% 5 -10% 10 -15% 15 - 20% > 20%
Anticipated wheat yield decline by 2030
Australia exports 15 Mt/yr (~19% of world exports) Kokic, et al. Australian Commodities, 2005
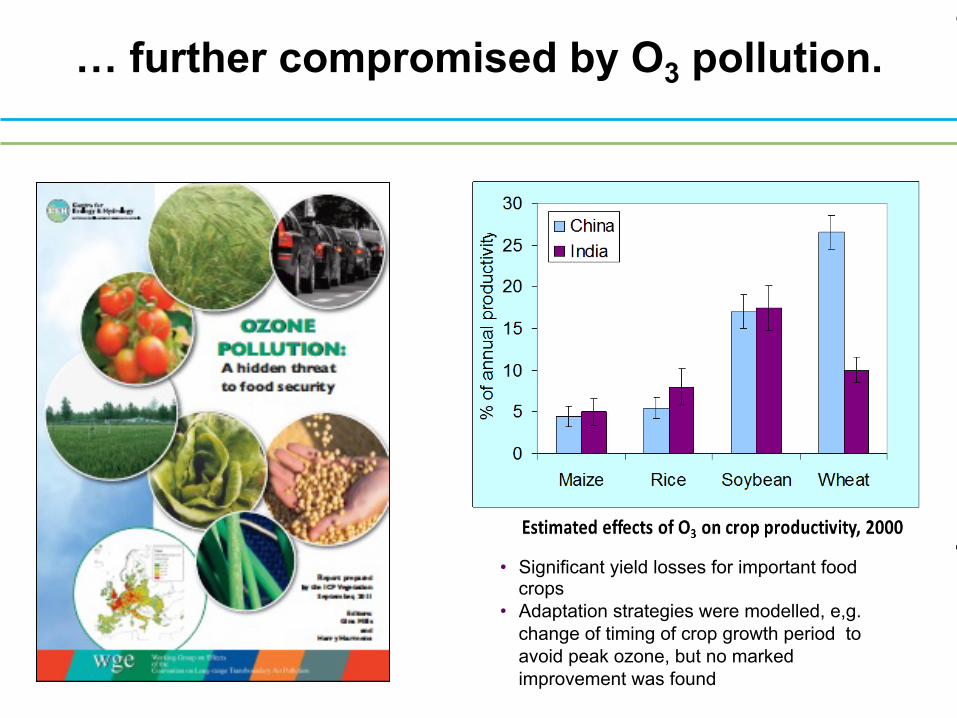
… further compromised by O3 pollution. The accumulated hourly mean ozone concentration above 40 ppb, during daylight hours
• Significant yield losses for important food crops
• Adaptation strategies were modelled, e,g. change of timing of crop growth period to avoid peak ozone, but no marked improvement was found
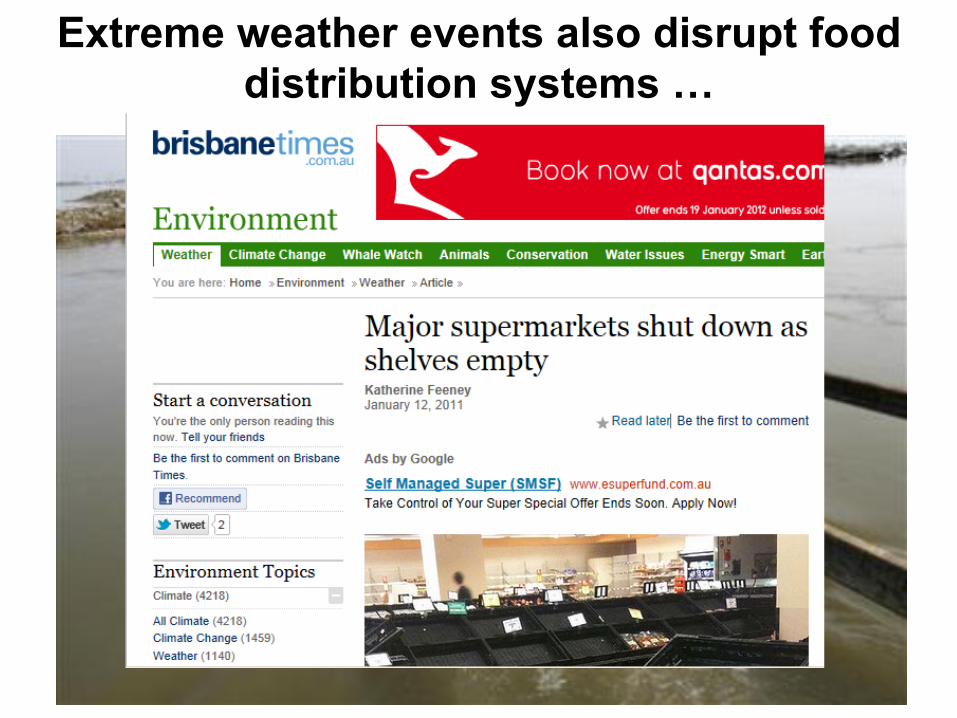
Extreme weather events also disrupt food distribution systems …
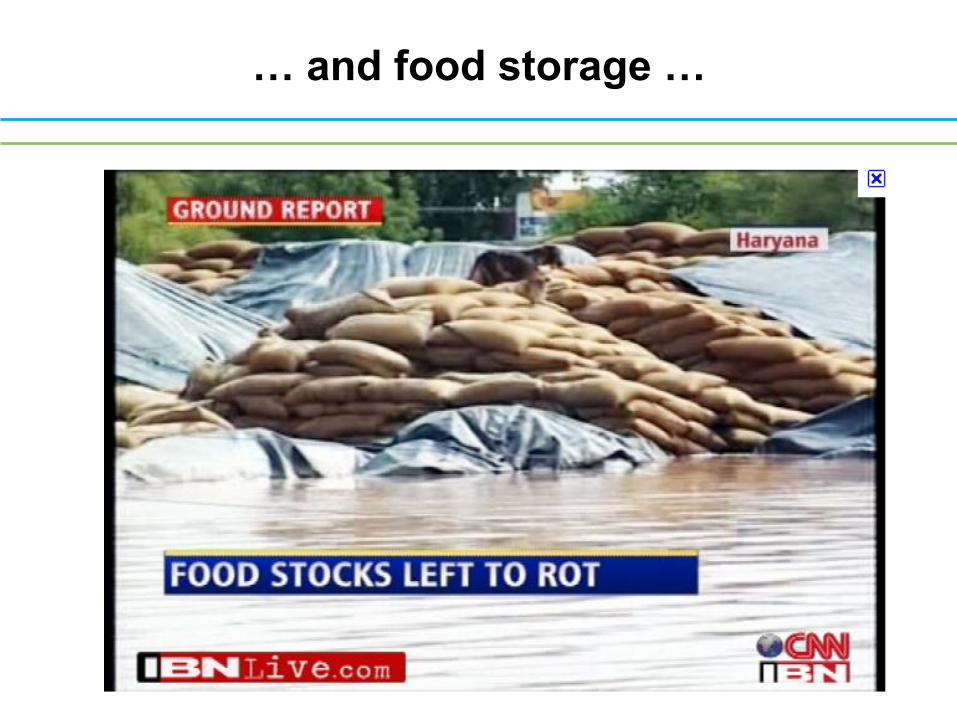
… and food storage …
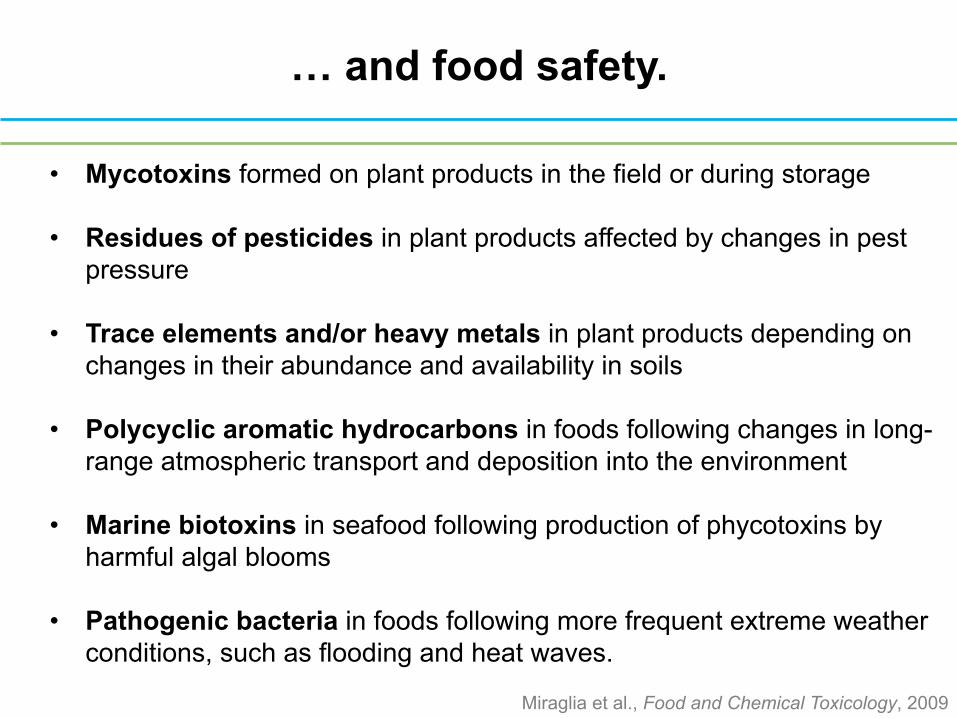
• Mycotoxins formed on plant products in the field or during storage
• Residues of pesticides in plant products affected by changes in pest pressure
• Trace elements and/or heavy metals in plant products depending on changes in their abundance and availability in soils
• Polycyclic aromatic hydrocarbons in foods following changes in long-range atmospheric transport and deposition into the environment
• Marine biotoxins in seafood following production of phycotoxins by harmful algal blooms
• Pathogenic bacteria in foods following more frequent extreme weather conditions, such as flooding and heat waves.
… and food safety.
Miraglia et al., Food and Chemical Toxicology, 2009
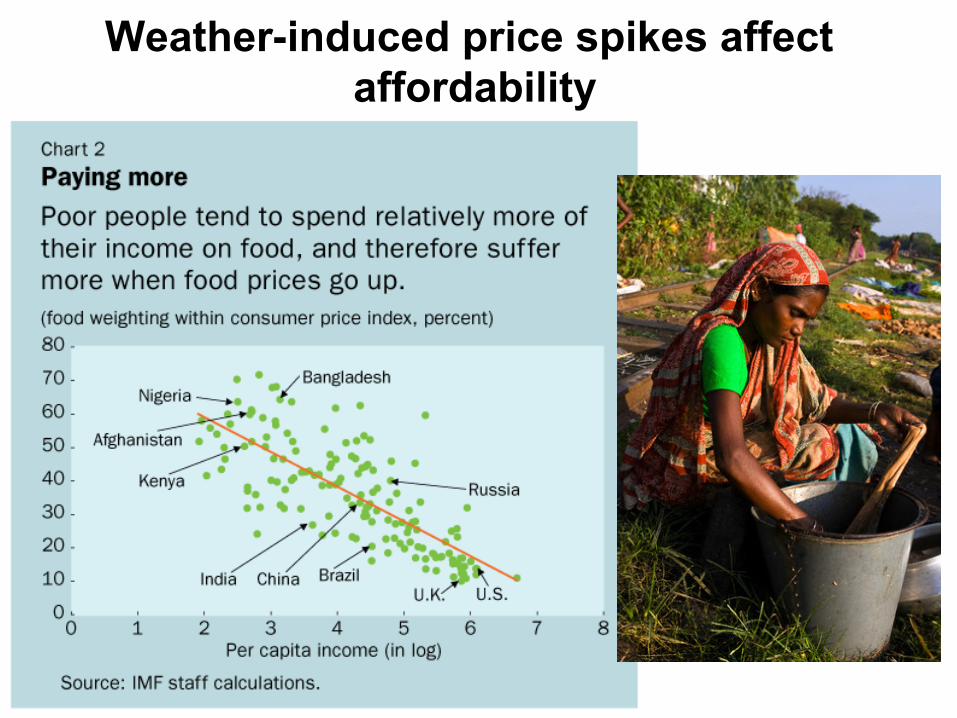
Weather-induced price spikes affect affordability
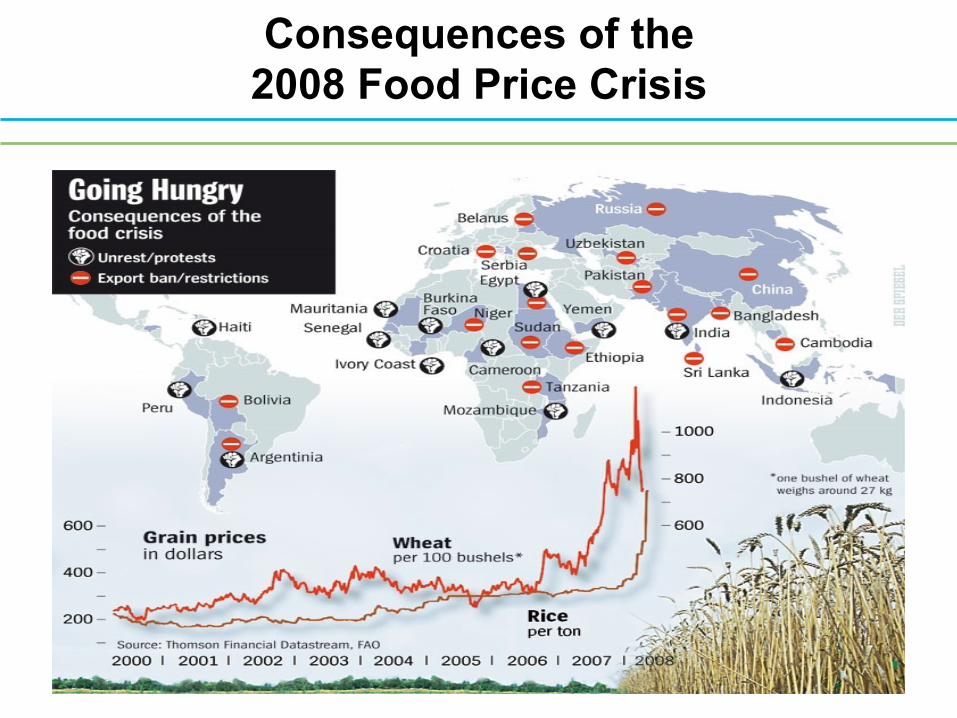
Consequences of the 2008 Food Price Crisis
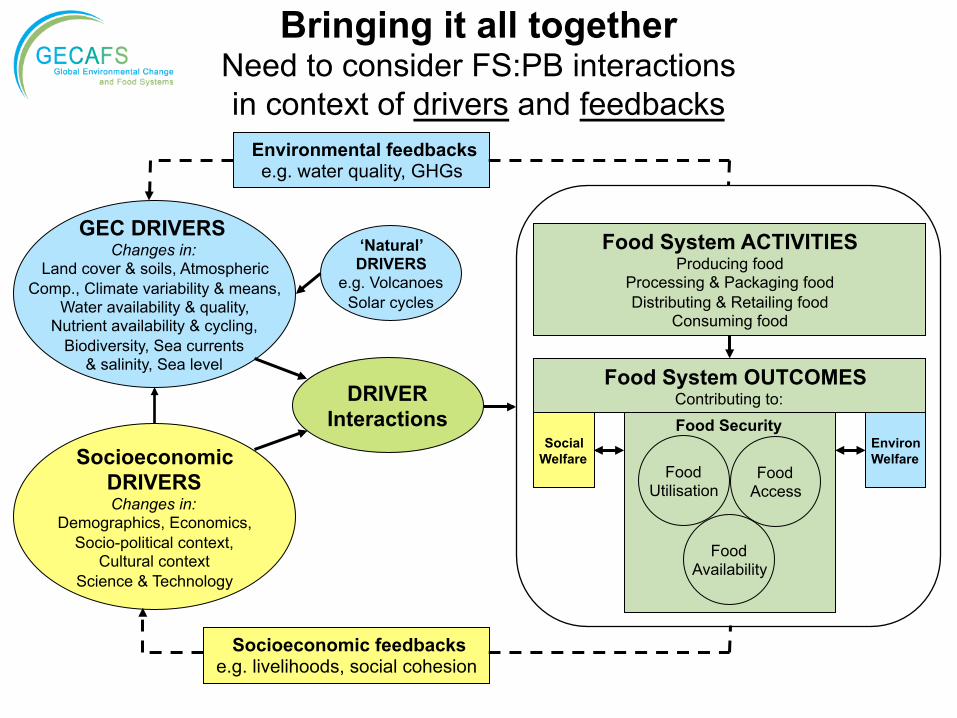
DRIVER Interactions
Socioeconomic DRIVERS Changes in:
Demographics, Economics, Socio-political context,
Cultural context Science & Technology
GEC DRIVERS Changes in:
Land cover & soils, Atmospheric Comp., Climate variability & means,
Water availability & quality, Nutrient availability & cycling,
Biodiversity, Sea currents & salinity, Sea level
‘Natural’ DRIVERS
e.g. Volcanoes Solar cycles
Environmental feedbacks e.g. water quality, GHGs
Socioeconomic feedbacks e.g. livelihoods, social cohesion
Food System ACTIVITIES Producing food
Processing & Packaging food Distributing & Retailing food
Consuming food
Food System OUTCOMES Contributing to:
Social Welfare
Environ Welfare
Food Utilisation
Food Access
Food Availability
Food Security
Bringing it all together Need to consider FS:PB interactions in context of drivers and feedbacks
So what do we do about it? ü Adapt to inevitable change ü Mitigate further change
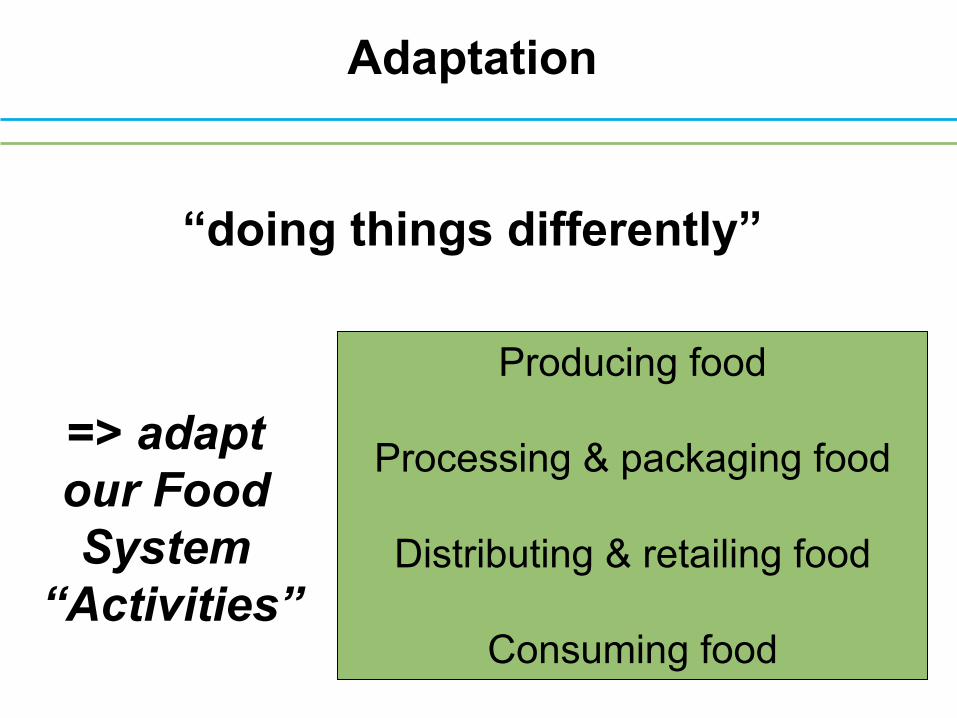
Adaptation
“doing things differently”
Producing food
Processing & packaging food
Distributing & retailing food
Consuming food
=> adapt our Food System
“Activities”
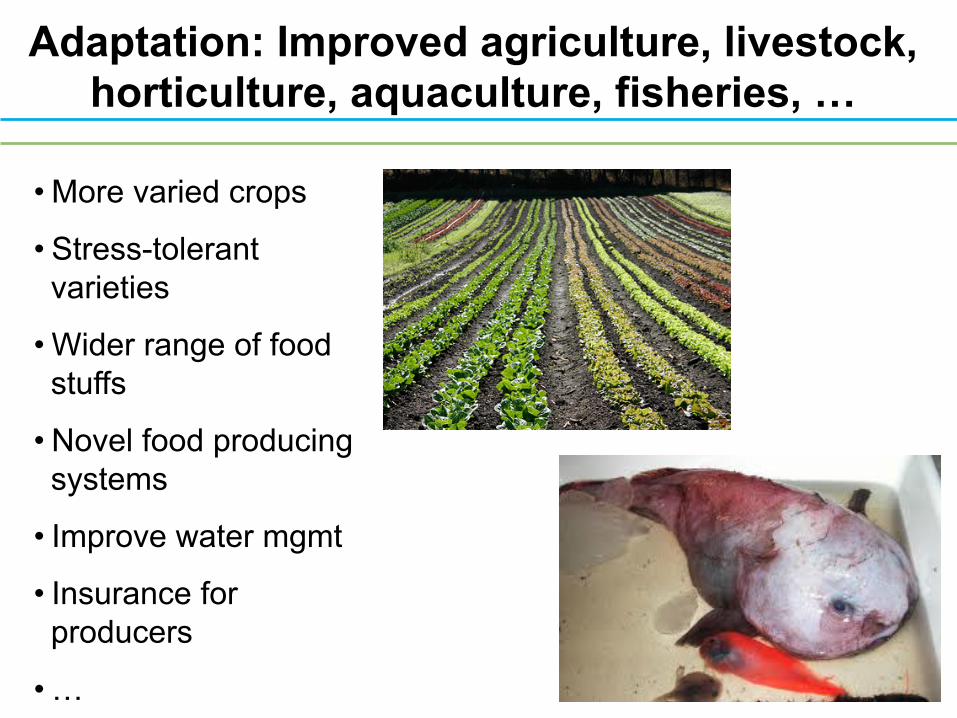
Adaptation: Improved agriculture, livestock, horticulture, aquaculture, fisheries, …
• More varied crops
• Stress-tolerant varieties
• Wider range of food stuffs
• Novel food producing systems
• Improve water mgmt
• Insurance for producers
• …
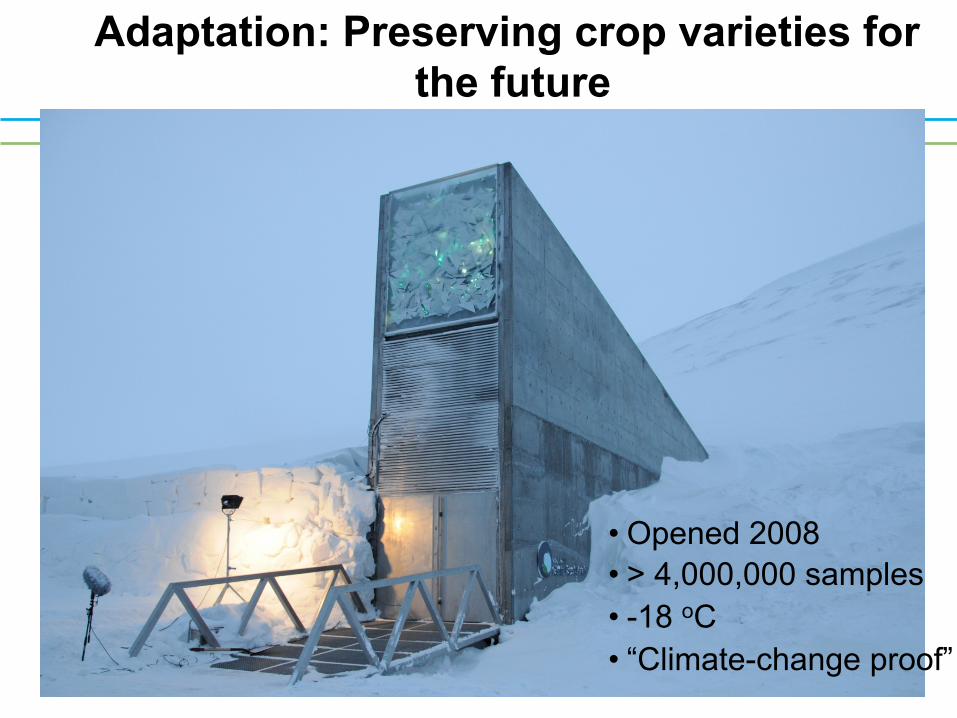
Adaptation: Preserving crop varieties for the future
• Opened 2008 • > 4,000,000 samples • -18 oC • “Climate-change proof”
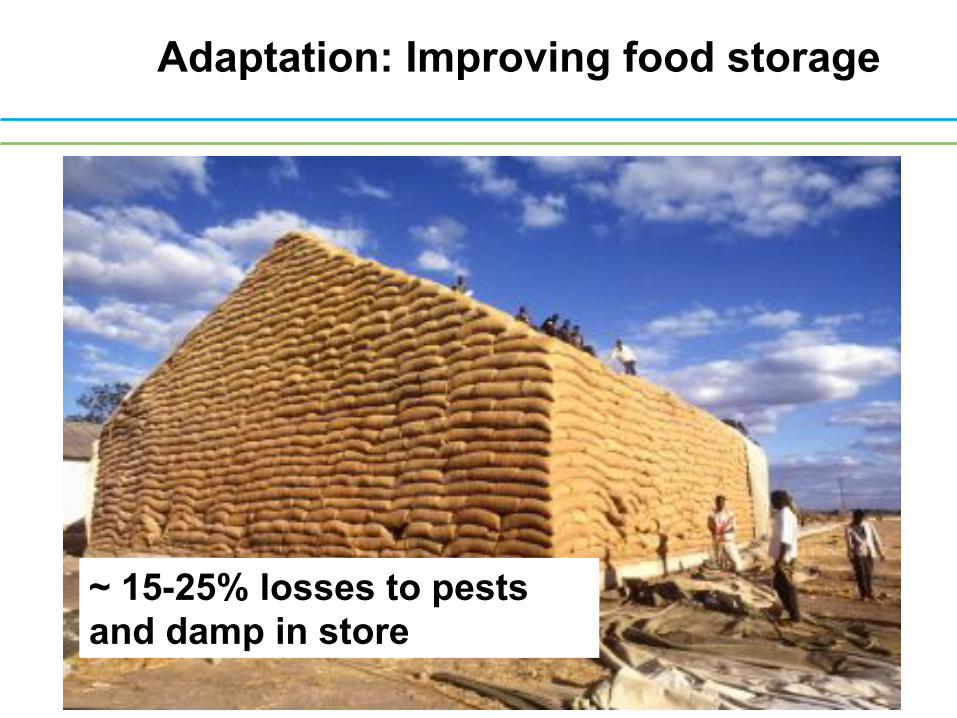
Adaptation: Improving food storage
~ 15-25% losses to pests and damp in store
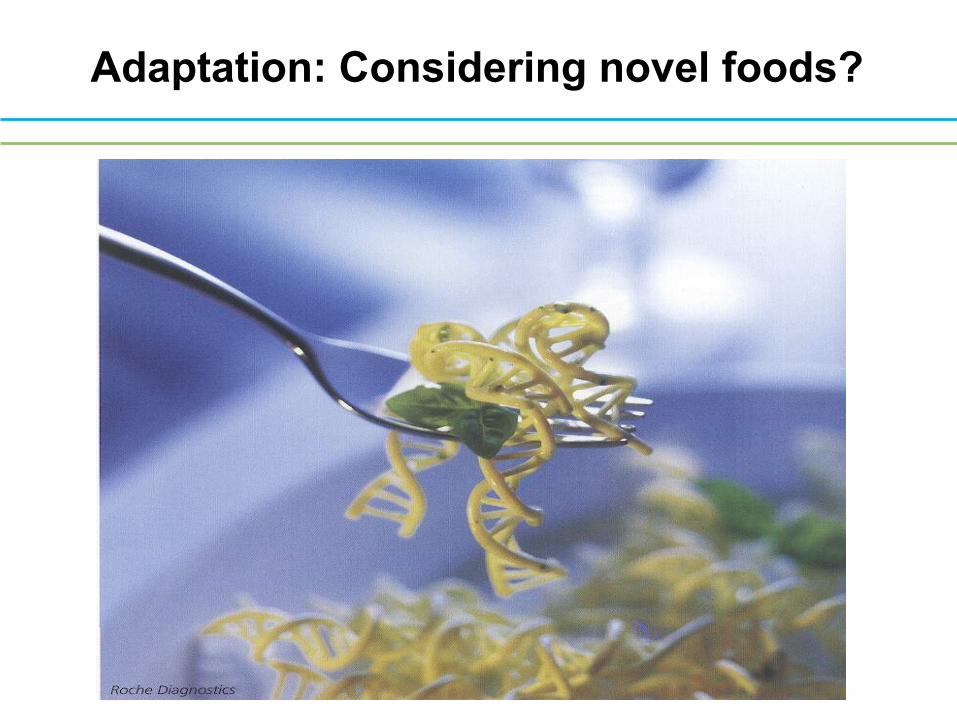
Adaptation: Considering novel foods?
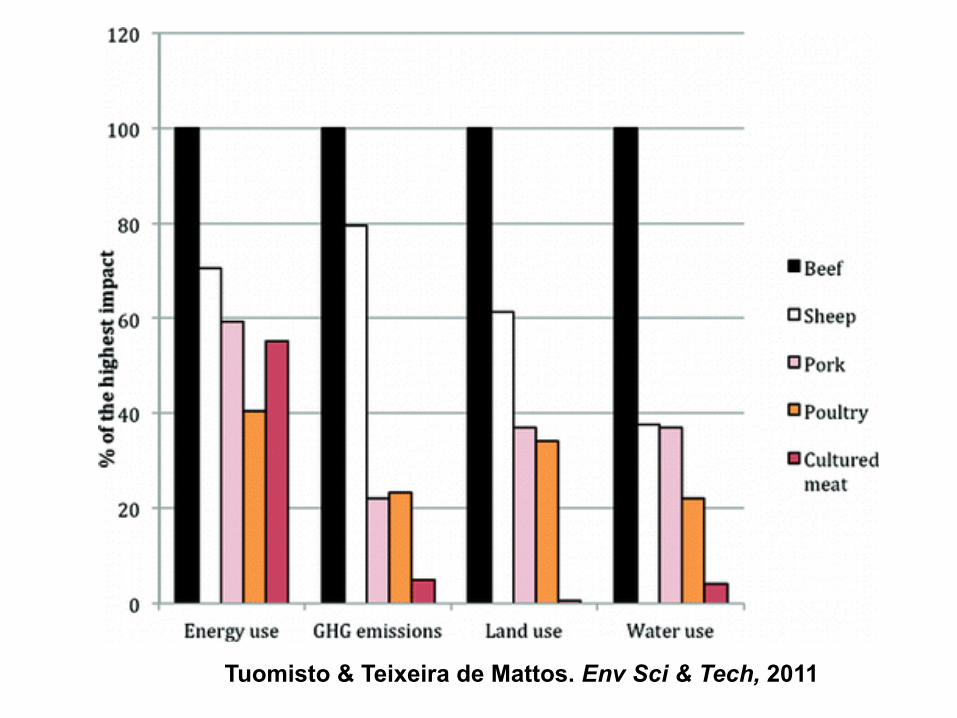
Tuomisto & Teixeira de Mattos. Env Sci & Tech, 2011
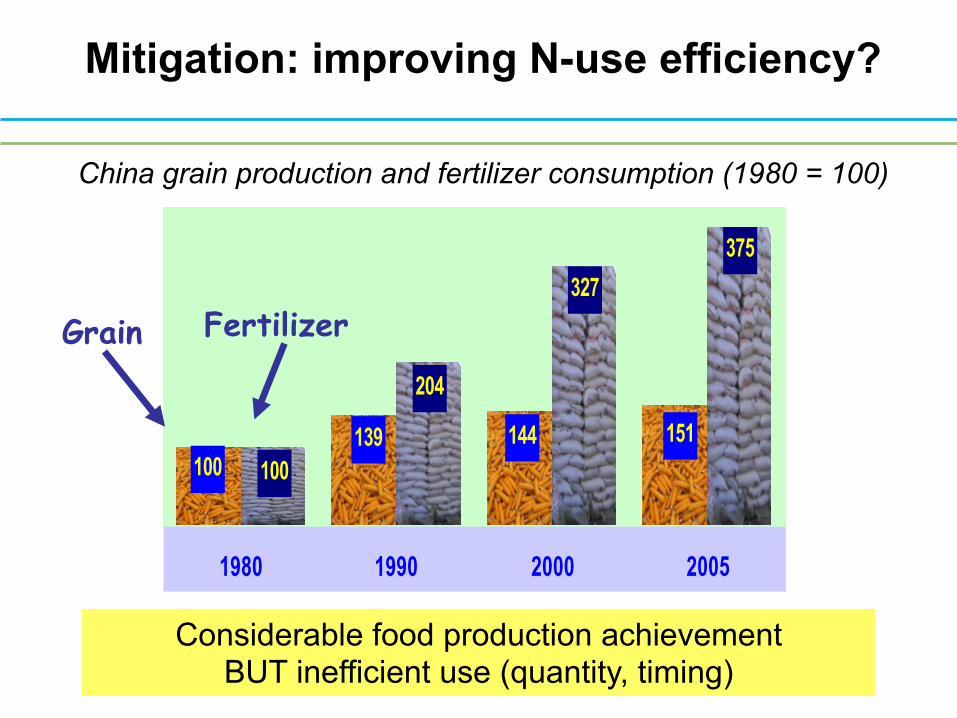
100139 144 151
100
204
327375
1980 1990 2000 2005
Mitigation: improving N-use efficiency?
China grain production and fertilizer consumption (1980 = 100)
Grain Fertilizer
Considerable food production achievement BUT inefficient use (quantity, timing)
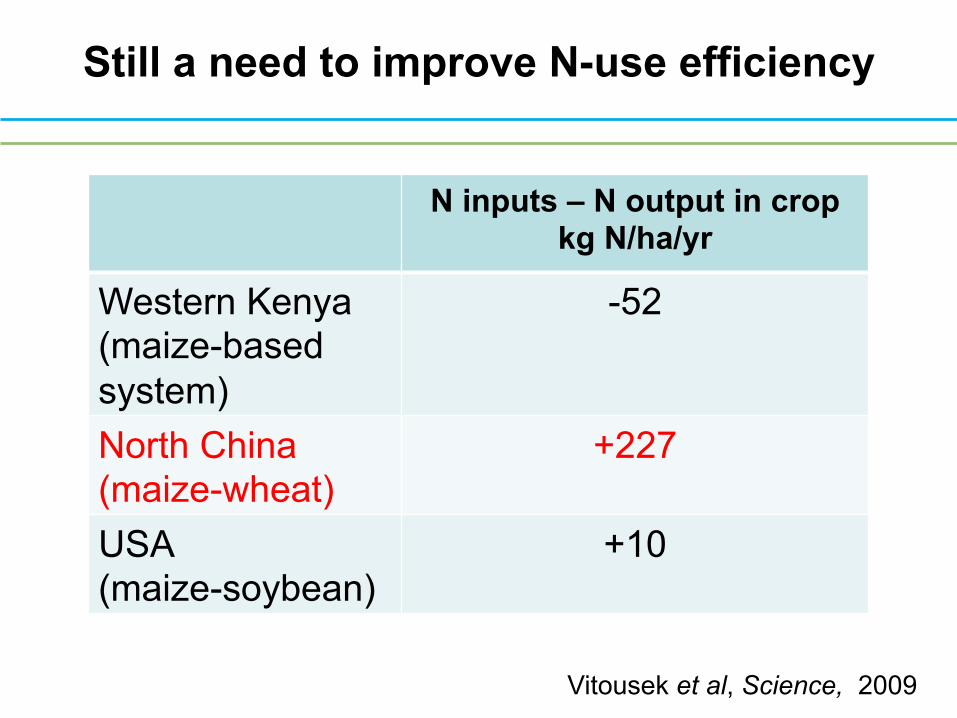
Still a need to improve N-use efficiency
N inputs – N output in crop kg N/ha/yr
Western Kenya (maize-based system)
-52
North China (maize-wheat)
+227
USA (maize-soybean)
+10
Vitousek et al, Science, 2009

Mitigation: reduced tillage?
ü Reduce SOC oxidation ü Reduce input energy
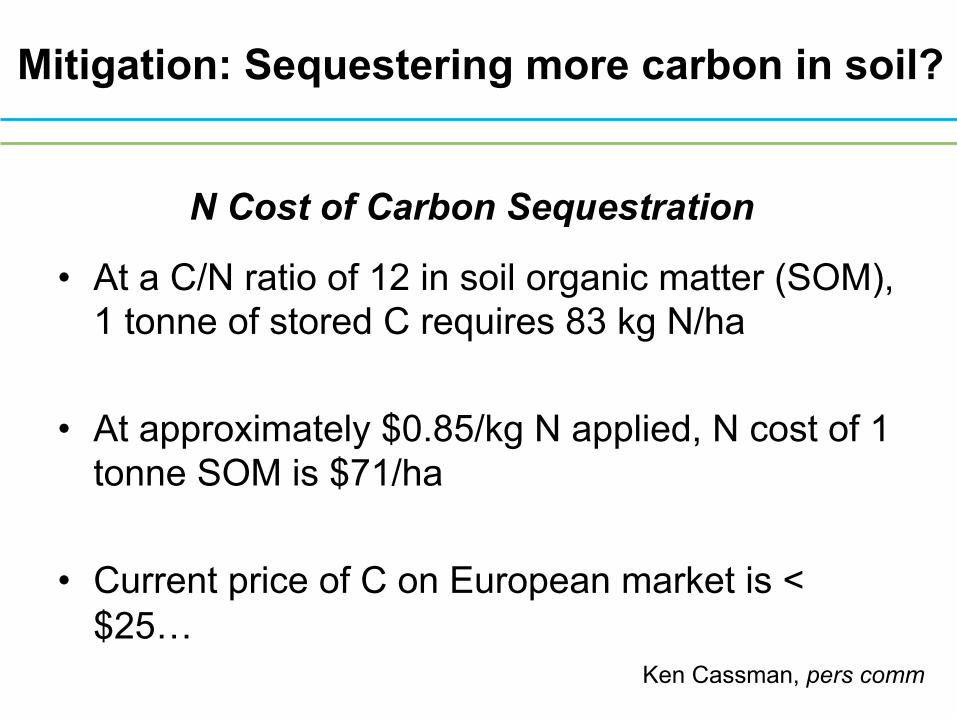
• At a C/N ratio of 12 in soil organic matter (SOM), 1 tonne of stored C requires 83 kg N/ha
• At approximately $0.85/kg N applied, N cost of 1 tonne SOM is $71/ha
• Current price of C on European market is <$25…
Mitigation: Sequestering more carbon in soil?
Ken Cassman, pers comm
N Cost of Carbon Sequestration
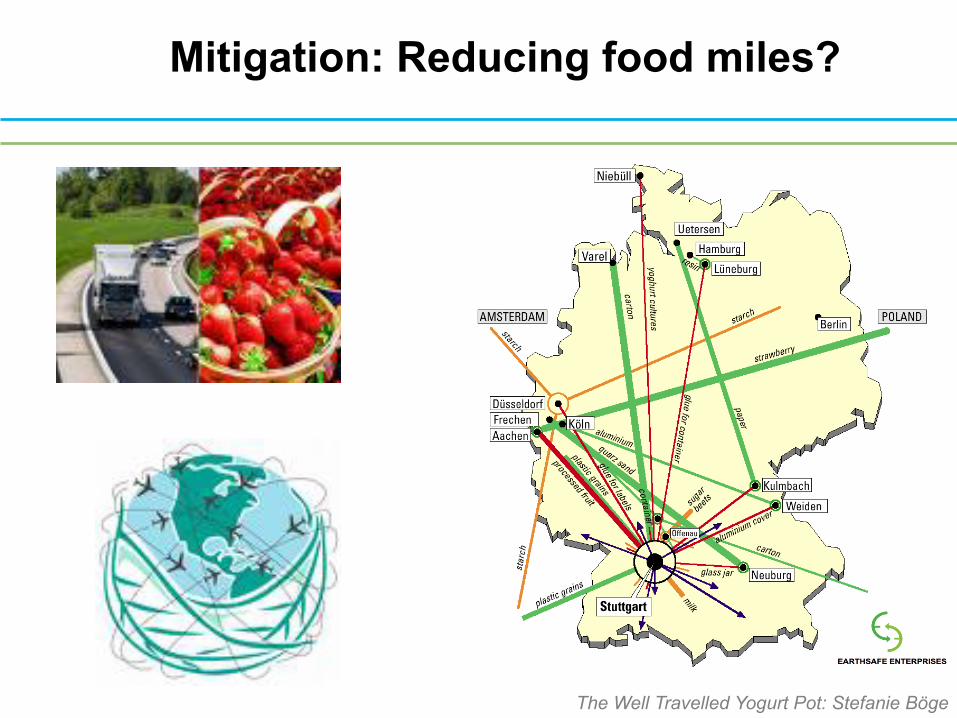
Mitigation: Reducing food miles?
The Well Travelled Yogurt Pot: Stefanie Böge
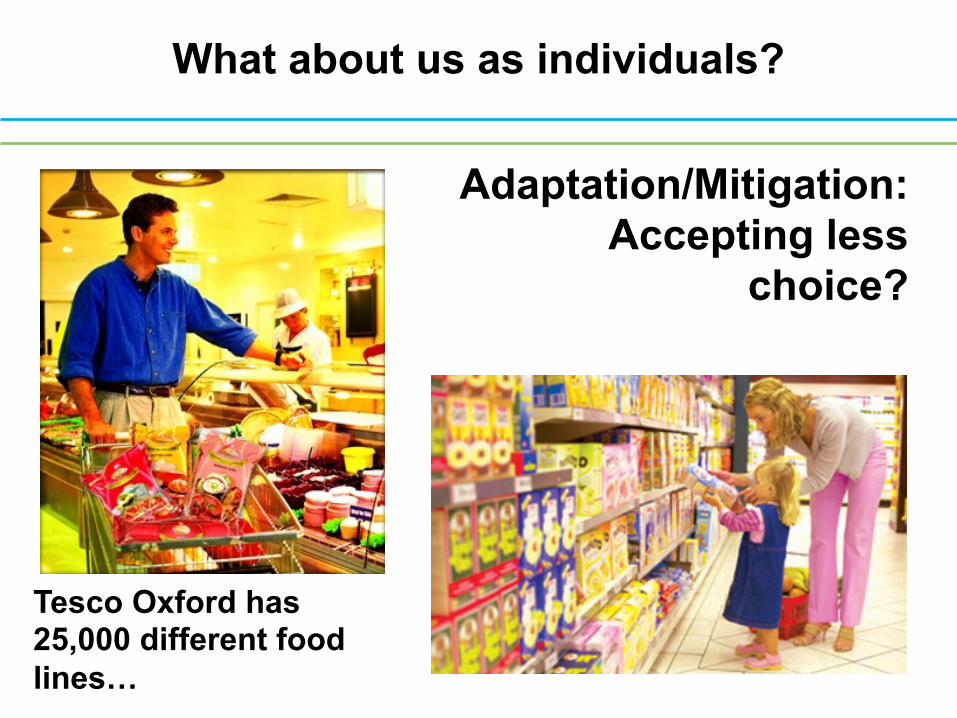
Adaptation/Mitigation: Accepting less
choice?
Tesco Oxford has 25,000 different food lines…
What about us as individuals?
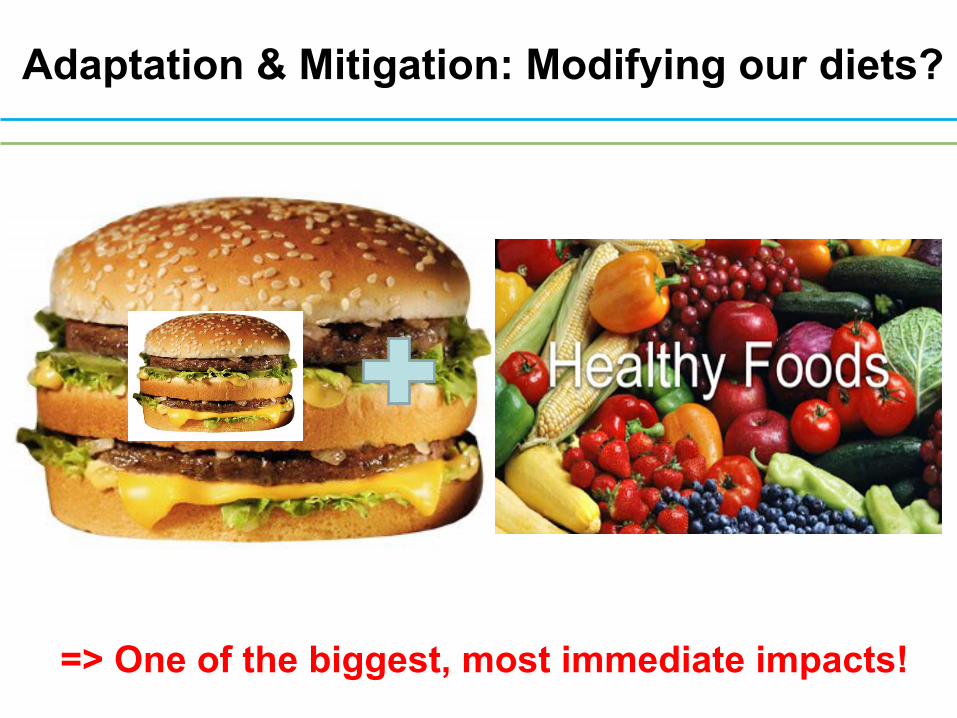
Adaptation & Mitigation: Modifying our diets?
=> One of the biggest, most immediate impacts!
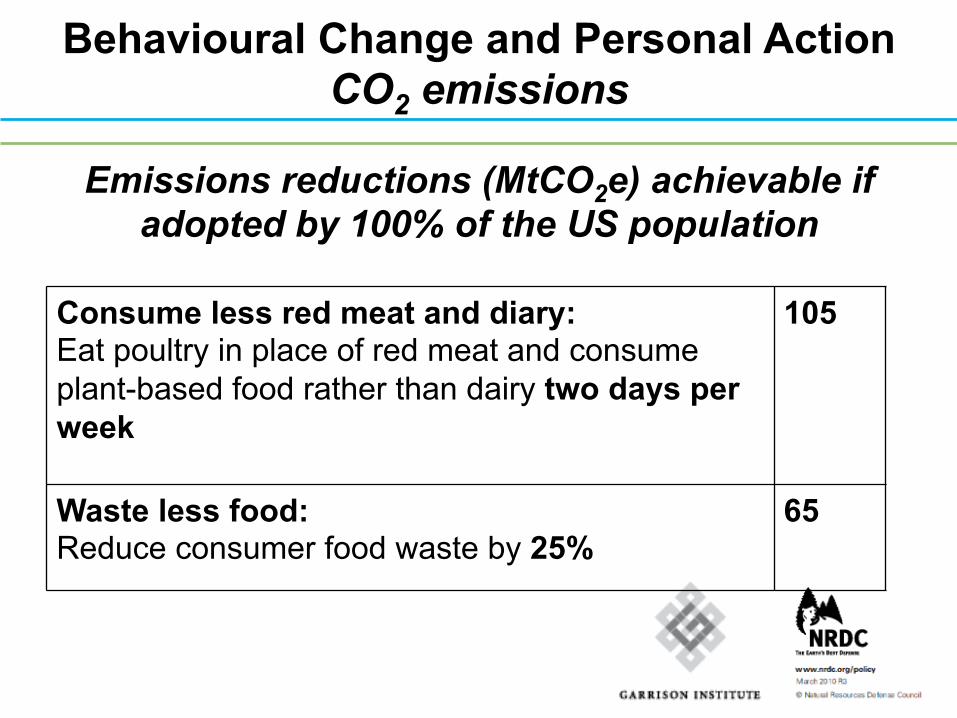
Consume less red meat and diary: Eat poultry in place of red meat and consume plant-based food rather than dairy two days per week
105
Waste less food: Reduce consumer food waste by 25%
65
Behavioural Change and Personal Action CO2 emissions
Emissions reductions (MtCO2e) achievable if adopted by 100% of the US population
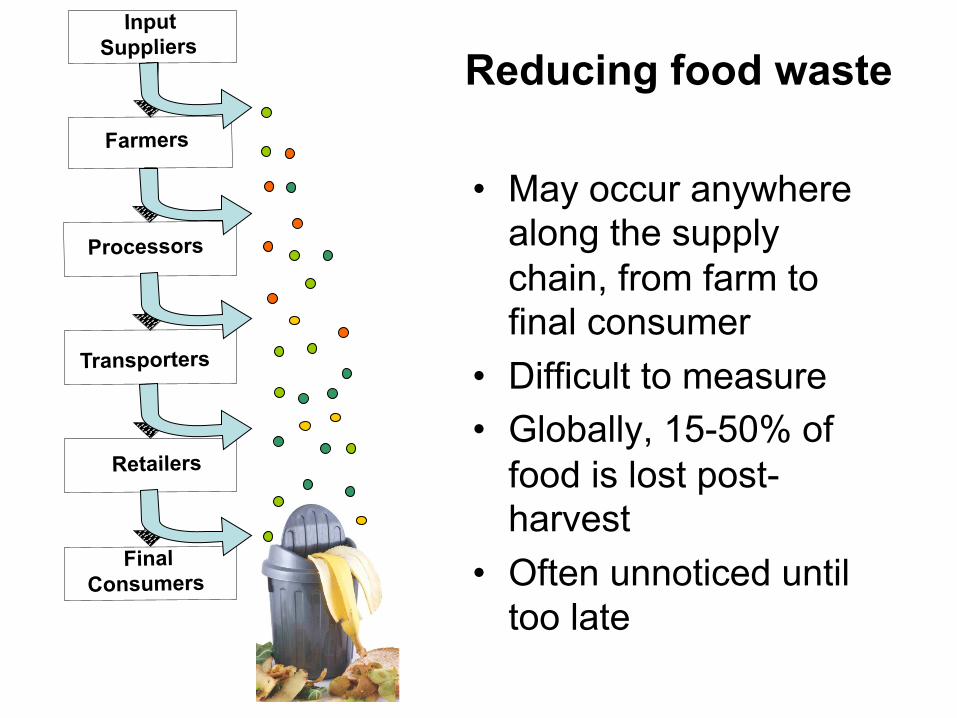
Reducing food waste
• May occur anywhere along the supply chain, from farm to final consumer
• Difficult to measure • Globally, 15-50% of
food is lost post-harvest
• Often unnoticed until too late
Farmers
Processors
Final Consumers
Transporters
Retailers
Input Suppliers