What are the effects of input subsidy programs on...
47
What are the effects of input subsidy programs on equilibrium maize prices? Evidence from Malawi and Zambia. Jacob Ricker-Gilbert (Purdue University) 1 Nicole Mason (Michigan State University) Thomas Jayne (Michigan State University) Francis Darko (Purdue University) Solomon Tembo (Indaba Agricultural Policy Research Institute) Selected Paper prepared for presentation at the Agricultural & Applied Economics Association’s 2013 AAEA & CAES Joint Annual Meeting, Washington, DC, August 4-6, 2013. 1 Denotes corresponding author Department of Agricultural Economics Purdue University 403 W. State Street W. Lafayette, IN. 47907 USA 1(765)494-4260 [email protected] Copyright 2013 by Ricker-Gilbert et al.. All rights reserved. Readers may make verbatim copies of this document for non-commercial purposes by any means, provided that this copyright notice appears on all such copies.
Transcript of What are the effects of input subsidy programs on...

What are the effects of input subsidy programs on equilibrium maize prices?
Evidence from Malawi and Zambia.
Jacob Ricker-Gilbert (Purdue University)1
Nicole Mason (Michigan State University)
Thomas Jayne (Michigan State University)
Francis Darko (Purdue University)
Solomon Tembo (Indaba Agricultural Policy Research Institute)
Selected Paper prepared for presentation at the Agricultural & Applied Economics
Association’s 2013 AAEA & CAES Joint Annual Meeting, Washington, DC, August 4-6,
2013.
1 Denotes corresponding author
Department of Agricultural Economics
Purdue University
403 W. State Street
W. Lafayette, IN. 47907
USA
1(765)494-4260
Copyright 2013 by Ricker-Gilbert et al.. All rights reserved. Readers may make verbatim copies
of this document for non-commercial purposes by any means, provided that this copyright notice
appears on all such copies.

1
Abstract
An important hypothesized benefit of large-scale input subsidy programs in Africa is that by
raising maize production, the subsidies should put downward pressure on retail maize prices to
the benefit of urban consumers and the rural poor who tend to be net food buyers. To inform
debates related to this rationale for input subsidies, this study estimates the effects of fertilizer
subsidies on retail maize prices in Malawi and Zambia using market or district-level panel data
covering the 2000/01 to 2011/12 maize marketing years. Results indicate that roughly doubling
the size of Malawi’s subsidy program (i.e., increasing the amount of subsidized fertilizer
distributed to each district by 4,000 metric tons per year) reduces maize prices by 1.2% to 1.6%
on average. In Zambia, roughly doubling the scale of the country’s subsidy program (i.e.,
increasing the amount of subsidized fertilizer distributed to each district by 1,000 metric tons per
year) reduces maize prices by 1.8% to 2.4% on average. The results are robust across countries
and model specifications, and indicate that the fertilizer subsidy programs in Malawi and Zambia
have had a minimal effect on reducing retail maize prices.
Introduction
Millions of smallholder farm households in sub-Saharan Africa (SSA) are net consumers of
staple crops, and millions of poor urban households spend a significant share of their income
purchasing staple foods. Recent research has underscored the major effects of changes in food
prices on poverty, with the weight of the evidence indicating that rising food prices exacerbate
poverty and food insecurity (Ivanic and Martin 2008; Ravallion, 1990; Ravallion, 2000). Input
subsidy programs, while normally analyzed in terms of their direct impact on recipient
households, may also have powerful general equilibrium effects by reducing the price of food.
Therefore, the ability of input subsidy programs to lower food prices could have major impacts
on the well-being of millions of households in SSA. Understanding these impacts using
household survey data is problematic not least because of the difficulty in identifying the
counterfactual, since potential general equilibrium price impacts affect the behavior and welfare
of the control group (non-recipients of the subsidy) as well as the direct recipients of the subsidy
through the prices of food and non-tradable inputs. As a result, the food price effects from input

2
subsidy programs is a crucial yet still under-examined determinant of their overall benefits,
costs, and distributional effects.
Empirical investigation of the potential general equilibrium effects of input subsidy
programs is especially important considering the high proportion of government budgets
currently being allocated to such programs. For example, between 2005/06 and 2008/09, Malawi
spent an average of 9.8% of its annual national budget on fertilizer and seed subsidies. These
expenditures ranged from a low of 5.6% of the national budget in 2005/06 to a high of 16.2% in
2008/09 (Dorward & Chirwa, 2011). In Zambia, input subsidies averaged 30% of total
government agricultural sector spending per year between 2004 and 2011 (Government of the
Republic of Zambia, various years). In 2010 and 2011, spending on these subsidies was
equivalent to nearly 1% of Zambia’s gross domestic product (IMF, 2012). Due to the high costs
of input subsidies, knowing how these programs affect maize prices can help policy makers fully
understand the potential benefits in order to weigh them against program costs.
The objective of this study is to estimate the effects of fertilizer subsidies on domestic
retail maize prices based on the cases of two countries with large-scale and well-known input
subsidy programs: Malawi and Zambia. To our knowledge, the present article is the first to
quantify the effects of fertilizer subsidies on food prices in SSA. Malawi and Zambia are ideal
case studies to measure the impacts of fertilizer subsidies on maize prices. Both countries have
large input subsidy programs, where the quantities distributed vary spatially and over time.
Also, the scale of the subsidy programs was large enough in both countries to have substantially
affected national maize production, and hence have potentially discernible effects on domestic
food prices.

3
Malawi scaled up its fertilizer subsidy program in 2005/06 to wide acclaim from many
and criticism from others (Dugger, 2007; Sachs, 2012). National statistics in Malawi indicate
that maize production has increased markedly since the country devoted more resources to
subsidizing fertilizer. However, maize prices have risen at the same time that production has
increased. While this is a bivariate relationship only, it goes against what we might expect (see
figure 1). A number of explanations have been given for rising maize prices in the face of
increased production, including i) increased maize exports by the Malawian government and
purchases for the strategic grain reserve; ii) rising real household income; iii) increased storage
losses as a result of increasing production of hybrid maize; iv) changes in informal cross-border
trade flows; and v) over-estimates of national maize production following the implementation of
the subsidy program (Dorward et al. 2010). While these explanations may be plausible,
empirical analysis of how the subsidy programs affect maize prices that provides a
counterfactual is the only way to address the apparent higher maize production-higher maize
price paradox in Malawi.
In Zambia, large-scale fertilizer subsidies were reintroduced in 2002/03 and have been
implemented in every subsequent year to date. The volume of subsidized inputs and the numbers
of beneficiaries have increased dramatically over time. For example, while the program aimed to
distribute 48,000 MT of fertilizer to 120,000 farmers in its first year, by 2012/13 the scale of the
program had increased to 180,000 MT of fertilizer to 900,000 farmers (MAL, 2012). As the
program has grown over time, so has national maize production, and Zambia recorded three
consecutive bumper harvests in the 2009/10 to 2011/12 agricultural years. However, during the
same period, weather patterns were unusually favorable and the government ramped up its maize
purchases at above-market prices through the Food Reserve Agency (FRA). Thus fertilizer

4
subsidies were not the only factor driving increased maize production in the country (Burke et
al., 2010; Mason et al., 2011; Mason et al., 2012). Despite the market price-raising effects of
FRA activities (Mason and Myers, 2013), real retail maize prices trended significantly downward
in four of Zambia’s nine provincial capitals between the 2003/04 and 2011/12 maize marketing
years.1 Our study seeks to determine if the quantity of fertilizer distributed through the subsidy
program was a significant factor contributing to these declines in real retail maize prices.
The main contribution of this paper is a consistent estimate of the potential general
equilibrium effects of input subsidy programs, both in terms of providing estimates in two
important countries in Africa and in terms of developing a sound analytical approach for
empirically estimating such effects. We use two estimators to model factors affecting maize
prices: (i) the first difference (FD) estimator, which removes time-constant, unobserved
heterogeneity from the model; and (ii) the Arellano-Bond (AB) estimator, which controls for
unobserved heterogeneity via first differencing and enables consistent estimation of a dynamic
panel data model (i.e., a model including lagged retail maize prices) (Arellano and Bond, 1991).
In the AB approach, maize prices lagged at least two periods earlier serve as instruments for
lagged first-differenced maize prices.
Results from this study indicate that roughly doubling the size of Malawi’s subsidy
program (i.e., increasing the amount of subsidized fertilizer distributed to each district by 4,000
metric tons per year) only reduces maize prices by 1.2% to 1.6% on average. In Zambia, roughly
doubling the scale of the country’s subsidy program (i.e., increasing the amount of subsidized
1 The maize marketing year in Zambia and Malawi is from May through April. The 2003/04 to
2011/12 marketing years correspond to the 2002/03 to 2010/11 agricultural years. The four
provincial capitals with significant downward trends in real retail maize prices are Kabwe,
Chipata, Lusaka, and Mongu. Price trends are not statistically different from zero in the other
provincial capitals (p>0.10).

5
fertilizer distributed to each district by 1,000 metric tons per year) only reduces maize prices by
1.8% to 2.4% on average. These results are marginally statistically significant but economically
small in magnitude, indicating that the fertilizer subsidy programs in Malawi and Zambia exert
minimal downward pressure on retail maize prices in those countries
Data
Malawi
Data from Malawi used in this study come from a variety of sources. Maize grain, and rice
prices come from 72 markets located in Malawi’s 26 districts. The prices are collected weekly
over the years of our study by the Malawi Ministry of Agriculture and Food Security. The
Consumer Price Index of retail prices comes from Malawi’s National Statistical Office.
Information on district-level subsidized fertilizer distribution comes from the Logistics Unit
annual reports. Rainfall data are from the Malawian meteorological service’s district-level
experiment station records. Maize prices from Zambia’s Chipata district on the Malawi-Zambia
border come from the Zambian Central Statistical Office.
Zambia
The Zambia data come from a number of sources. District-level retail maize grain, bread, rice,
and diesel prices are from the Central Statistical Office’s Consumer Price Index retail prices
database. These monthly data are consistently available throughout the period of analysis (May
2000-April 2012) for 50 of Zambia’s 72 districts. District-level subsidized fertilizer allocations
are from the Ministry of Agriculture and Cooperatives (MACO, various years). The rainfall data
are from the Zambia Meteorological Department and are district-level estimates based on data
collected from 36 rainfall stations throughout the country. District-level FRA maize purchases

6
are from the FRA. Maize prices from Malawi’s Mchinji district on the Zambia-Malawi border
come from the Malawian Ministry of Agriculture and Food Security.
Background
Input subsidies and maize prices in Malawi
Input subsidies have existed in the Republic of Malawi for decades. However, the modern wave
of targeted input subsidies began with the Starter Pack program in 1998, which was in place in
1998/99 and 1999/00. Officially, 2.8 million households were reached each year under the
Starter Pack, and beneficiary farmers were supposed to receive 10-15 kilograms of free fertilizer
and 2 kilograms of hybrid seed (Harrigan, 2008). The Starter Pack program was rebranded as
the Targeted Inputs Program (TIP) in 2000/01, and it ran through the 2004/05 season. Under the
TIP, the Malawian government distributed between 15,000 metric tons and 54,000 metric tons of
fertilizer, and targeted 1-2 million households per season depending on the year (see table 1,
column B). Each recipient household was supposed to receive 10 kilograms of fertilizer for free,
and between 2 and 4 kilograms of hybrid or open pollinated seed varieties (OPV) for free.
Unfortunately there was a severe drought during the 2004/05 growing season, resulting in
a poor harvest. In response, the Malawian government decided to re-package and scale up its
targeted fertilizer subsidy program under the name of the Agricultural Input Subsidy Program
(AISP). The amount of subsidized fertilizer distributed to farmers increased from 54,000 metric
tons in 2004/05 under TIP to 131,388 metric tons in 2005/06 under AISP. In addition, the
official amount of subsidized fertilizer distributed increased to 100 kilograms per household on
average per year (table 1, column B).

7
The AISP program continued to be scaled up every year until the 2007/08 season, when
more than 216,000 metric tons of subsidized fertilizer were distributed to households. In
2008/09 the AISP was renamed the Farm Input Support Program (FISP), and was scaled down to
202,000 metric tons due to high fertilizer costs. From 2008/09 to present, the quantity of
subsidized fertilizer distributed to smallholders in Malawi has remained around 160,000 metric
tons per year (table 1, column B).
Official statistics from Malawi report that maize production has increased substantially in
the years of the AISP and the FISP, averaging between 2.6 million and 3.7 million metric tons
per year (see figure 1). Conversely and curiously as mentioned in the introduction, maize prices
have also increased in Malawi during that time (figure 2). The fact that maize prices increased at
the same time that production increased may mean that actual production has been below
national estimates and/or that Malawi is more spatially integrated with the region than is
commonly believed. Spatial market integration studies for maize in Malawi, Mozambique, and
Zambia (Goletti and Babu, 1994; Chirwa, 1999; Tostau and Brorsen, 2005; Loy and Wichern,
2000; Awudu, 2007; Myers, 2008; Burke 2012; Myers and Jayne 2012) and for the wider region
(Rashid, 2004; van Campenhout, 2008) are broadly consistent in their conclusions: maize
markets are reasonably well integrated, are becoming more efficient over time, and marketing
costs are declining. Monitoring of cross-border trade in the region by the Famine Early Warning
Systems Network (FEWSNET) indicates that Malawi has imported maize from Mozambique and
often from other countries in almost every month since the monitoring started in 2004 (Jayne et
al 2010). However, some markets in Malawi continue to be poorly integrated mainly due to high
transport costs and government activities in the maize market. For example, the Malawian
government arranged for export of 400,000 MT of maize to Zimbabwe after anticipating a
8
bumper harvest in 2007; maize prices shot up within several months of government attempts to
source this quantity on domestic markets. Controlling for this and other policy shocks is one of
the important modeling and estimation challenges to derive accurate estimates for the impact of
the subsidy program on maize prices.
Input subsidies and maize prices in Zambia
The Government of the Republic of Zambia (GRZ) has subsidized agricultural inputs in most
years since independence. The universal subsidies that were prominent prior to structural
adjustment were eliminated in 1991 but GRZ never fully abandoned input subsidies (Jayne and
Jones, 1997; Govereh et al., 2008). Throughout the early-to-mid 1990s, GRZ experimented with
several approaches to building private sector capacity and promoting private sector participation
in the fertilizer value chain. Then, in 1997/98, GRZ established the Fertilizer Credit Program,
which was administered through the Food Reserve Agency (FRA) (MACO et al., 2002).
Under the Fertilizer Credit Program, which ran through the 2001/02 agricultural season,
participating farmers could obtain 200 to 800 kg of fertilizer on credit, with approximately 10%
of the market cost of the fertilizer due upon receipt and the remaining 90% due in cash or in kind
at harvest. The fertilizer was not subsidized per se (as farmers were to pay the full market price)
but loan repayment rates were dismally low, so defaulting farmers received the fertilizer at an
effective 90% subsidy (ibid). An average of 29,000 MT of fertilizer per year were distributed
through the Fertilizer Credit Program during the three years of the program that fall into our
study period (1999/2000-2001/02 agricultural years) (Table 3, col. B). Of this total, over two
thirds of the fertilizer went to Central, Eastern, and Southern Provinces – the major maize-

9
producing areas in the country (Table 4). Most of the remaining fertilizer was allocated to
Copperbelt, Lusaka, and Northern Provinces.
In response to the low loan repayment rates under the Fertilizer Credit Program and
severe droughts during the 2000/01 and 2001/02 agricultural years, GRZ moved to a cash-only
(no credit) input subsidy program with the establishment of the Fertilizer Support Program in
2002/03. Under the program, selected beneficiary farmers paid 50% of the full cost of the inputs
in cash. (The subsidy rate has increased over time – see Table 3, col. A.) A standard input pack
consisted of 400 kg of fertilizer and 20 kg of hybrid maize seed to be used to plant one hectare of
maize. The Fertilizer Support Program ran through the 2008/09 agricultural year and an average
of 60,000 MT of fertilizer were distributed through the program each year – roughly double the
average volumes distributed through the Fertilizer Credit Program (Table 3, col. B). In addition
to the volumes being larger, the provincial shares of total subsidized fertilizer were also more
even under the Fertilizer Support Program than under its predecessor program. Whereas Central,
Eastern, and Southern accounted for an average of 68% of the total subsidized fertilizer under the
Fertilizer Credit Program, that share dropped to 53% under the Fertilizer Support Program.
Northern Province registered the greatest increase in subsidized fertilizer receipts, while
Southern Province saw the largest drop in its share (Table 4).
The Fertilizer Support Program was renamed the Farmer Input Support Program in
2009/10 and that program has continued to run to the present day. Under the Farmer Input
Support Program, the input pack size was halved to 200 kg of fertilizer and 10 kg of hybrid
maize seed, in principle doubling the number of beneficiary farmers per MT of inputs. Fertilizer
subsidy rates have generally been higher and the volumes of subsidized inputs distributed have
been substantially larger under the Farmer Input Support Program than under the two previous

10
subsidy programs (Table 3). Provincial shares of the total inputs, however, have not changed
substantially under the new program (Table 4 ).
Increases over time in the volumes of fertilizer distributed through Zambia’s input
subsidy programs have generally coincided with increases in smallholder maize production and
sales (Table 3, cols. D and E; Figure 3). However, the size of the population and the volumes of
maize purchased at typically above-market prices by the parastatal FRA have also increased over
time (Table 3, col. F).2 Moreover, Zambia was blessed with unusually favorable weather
conditions for maize production in the 2009/10 through 2011/12 growing seasons (Burke et al.,
2010; Mason et al., 2011). Subsidized fertilizer is therefore just one of several factors
contributing to the rise in maize production in Zambia over the last decade. Holding FRA
purchases, rainfall, and other factors constant, Mason et al. (2012) find statistically significant,
small positive impacts of subsidized fertilizer on maize output and yields in Zambia.
Consistent with rising maize production and sales, real retail maize prices in Zambia have
declined over the last decade (Figure 4). In addition to input subsidies for maize and maize
purchases by the FRA, the Zambian government used several other maize marketing and price
policy tools during the period of analysis. These include: (i) sales of FRA maize on the domestic
market, often at subsidized prices to select large-scale millers; (ii) exports of FRA maize to other
countries in eastern and southern Africa, often at prices below the FRA purchase price; (iii)
government-arranged maize imports in deficit production years and subsequent sales to select
large-scale millers at subsidized prices; (iv) explicit maize export bans or implicit export bans
through restrictions on the numbers of export licenses granted; (v) tariffs on maize imports; and
2 FRA began purchasing maize from farmers at a pan-territorial price in the 2002/03 marketing
year but private maize trade remains legal and private sector maize prices are not regulated. See
Mason and Myers (2013) for details.
11
(vi) levies on inter-district maize trade, which were in place between 2002 and 2009. See
Govereh et al. (2008), Nkonde et al. (2011), and Chapoto (2012) for further details on maize
marketing and price policies in Zambia.
Conceptual Framework
Conceptually, large-scale fertilizer subsidy programs, such as those in Malawi and Zambia, may
have direct and/or indirect effects on households. For example, recipient households directly
benefit from the subsidies because they acquire fertilizer at a reduced price, and in turn may use
more fertilizer and produce more maize. Furthermore, by increasing maize production, input
subsidies may generate the indirect effect of lower maize prices. Lower maize prices would
affect all households that participate in maize markets as buyers and/or sellers but would be
particularly beneficial to the rural and urban poor who are net-buyers of maize. At the same
time, lower maize prices would negatively affect net-sellers of maize, including larger, better-off
farmers.
Several factors influence the extent to which fertilizer subsidy programs affect retail
maize prices. The first is the degree to which fertilizer subsidies increase maize production.
Increases in maize production depend in part on how much new fertilizer the subsidy program
adds to total fertilizer use in the country, which in turn depends on how much commercial
fertilizer gets crowded out by the subsidy. The empirical evidence from Malawi suggests that on
average, 100 additional kilograms of subsidized fertilizer add 78 new kilograms to total fertilizer
use, as 22 kilograms of commercial fertilizer are displaced by the subsidy (Ricker-Gilbert, et al.,
2011). When this number is adjusted for leakages based on a 33% leakage estimate in Holden
and Lunduka (2013) and the approach developed by Mason and Jayne (forthcoming), 100

12
kilograms of subsidized fertilizer only adds 45 kilograms of new fertilizer to farmers’ fields. In
Zambia, Mason and Jayne (forthcoming) find that 100 kilograms of subsidized fertilizer
increases total fertilizer use by 54 kilograms after accounting for leakage.
In addition to crowding out, the extent to which subsidized fertilizer raises maize
production also depends on the management ability of subsidy recipients, soil quality, and
rainfall, among other factors. The existing literature generally suggests that subsidized fertilizer
has positive but small impacts on maize production and crop income in Malawi and Zambia
(Holden and Lunduka, 2010; Ricker-Gilbert and Jayne, 2011; Shively et al., 2012; Mason et al.,
forthcoming).
A second factor influencing the effect of fertilizer subsidies on retail maize prices is
vertical price transmission, or the extent to which changes in farm-level maize prices translate
into changes in retail maize prices. Therefore, marketing margins will affect the spread between
farm and retail maize prices. Evidence suggests that marketing margins in SSA are often a
function of transport costs, interest rates, and transactions costs.
A third factor mediating the effects of input subsidies on maize prices is the degree of
integration between domestic markets and international markets. If Malawi and Zambia were
perfectly integrated into the world market, then an increase in maize production from the subsidy
would have no effect (or only a very small, short-lived effect) on maize prices in those countries
because both are small economies. Conversely, if both countries were completely closed off
from the world market then a boost in maize production from the subsidy program would be
expected to lower domestic maize prices.
The central research question of this article is whether or not, and to what extent, an
increase in the quantity of subsidized fertilizer allocated to a district in Malawi and/or Zambia

13
affects retail maize prices in that district. In order to effectively answer this question and guide
our empirical model specification, we first present an economic model of the potential pathways
through which subsidized fertilizer affects maize prices. From there we explain the empirical
model and estimation strategy used to obtain consistent estimates of the subsidy programs’
average partial effects on maize prices in Malawi and Zambia.
The first component of the economic model is an output supply function for maize in the
presence of an input subsidy program.
) (1)
where is maize quantity produced,
is the expected producer price of maize, is the
quantity of subsidized fertilizer, and is a vector of other supply shifters.
In addition to being influenced by maize supply, equilibrium maize prices are also
affected by maize demand. Since we are modeling the effects of fertilizer subsidies on retail
maize prices, we consider a retail consumer demand function for maize:
) (2)
where is maize quantity demanded, is the retail price of maize, and is a vector of
other demand shifters.
The equilibrium retail maize price is a function of the realized producer price (
) and
the marketing price margin (M( )):
+ M( ) (3)
The variables that might affect the price margin are represented by . From there we use the
market clearing condition:
(4)

14
and then plug (1), (2) and (3) into (4). Solving for as a function of the exogenous variables
and noting that the realized producer price ( is a function of realized maize production level
gives:
( ) (5)
Equation (5) is our reduced form model of the retail maize price as a function of subsidized
fertilizer and other factors.
Empirical model
The empirical form of our economic model of factors affecting retail maize prices (equation 5)
is:
= Ψ + + ∑
+ Xi,tβ + Ztθ + ci + μi,t (6)
where i indexes 72 markets in Malawi’s 26 districts, and 50 districts in Zambia.3,4
In addition, t
indexes the time period. We include retail maize prices during two time periods in each maize
marketing year: i) the mean maize price during the harvest season (May-October) when maize
stocks are high; and ii) the mean maize price during the hungry (lean) season (November-April)
when maize stocks dwindle. We match up the marketing year/season maize price observations
with variables affecting maize production in the corresponding agricultural year (October-
September). For example, maize prices in the 2010/11 marketing year (May 2010-April 2011)
3 We were able to obtain sub-district market prices for maize and rice in Malawi. In Zambia
prices are only available at the district level. Therefore, the Malawi unit of analysis is more
disaggregated than it is in Zambia. However we feel it is worth keeping the analysis at market-
level in Malawi, rather than aggregating prices up to the district-level. Doing the analysis at
market-level takes full advantage of the intra-district variation in the price data. 4 There were 72 districts in Zambia during the period of analysis but retail maize prices were
consistently collected by the Central Statistical Office in only 50 of the 72 districts.

15
should be affected by maize production (and factors affecting it) in the 2009/10 agricultural year
(October 2009-September 2010).
The retail maize price is denoted by Up to J lags of the dependent variable are
included in the model, and the associated parameters are the ϒj’s. The retail maize prices are in
local currency units (LCU) per kg. LCUs are Malawian Kwacha (MWK) and Zambian Kwacha
(ZMK). The key explanatory variables of interest are the quantities of subsidized fertilizer, in
metric tons, allocated to a given district ( FISP
i,t). The corresponding parameter is α.
The coefficient estimate, , gives the short-run effect of an additional metric ton of
subsidized fertilizer on the retail maize price. Additionally,
a
1- gj
j=1
J
å
is the estimate of the long
run effect of an additional metric ton of subsidized fertilizer on the retail maize price (Chow,
1975). The short-run and long-run effects allow us to answer the key testable hypotheses and
research questions of this article: how and to what extent does an additional metric ton of
subsidized fertilizer distributed to a district in Malawi and Zambia affect retail maize prices in
that market or district.
A set of district-level control variables that are thought to affect maize prices are
represented by the vector X. The supply shift factors in X, represented by in equations (1)
and (5), include rainfall during the growing season (November – March) in millimeters, and
rainfall stress, measured as the number of 20-day periods during the growing season with less
than 40 millimeters total rainfall. For Zambia, we also include district-level FRA maize

16
purchases in metric tons.5, 6
The demand shift factors in X, represented by in equations (2)
and (5), include the retail price of rice in LCU per kilogram in both the Malawi and Zambia
models, and the retail price of bread in ZMK per loaf in the Zambia model. Also included in X is
a set of district-level dummy variables. The district-level dummy variables serve as a district
fixed effects and capture unobserved district-level factors, such as road access, and the level of
spatial market integration in a given district, which can impact maize prices. The vector of
corresponding parameters is represented by β.
The vector of national-level factors that affect maize prices are represented by Z. The
marketing margin variables, represented by in equations (3) and (5), include national
commercial lending interest rates and petrol prices in LCU per liter. (For Zambia, district-level
diesel prices are used instead of national-level petrol prices, and the model also includes
national-level electricity prices in ZMK/kilowatt hour.). We also include prices in international
markets, which could affect domestic prices through formal and informal trade. The inclusion of
these external prices should also help to control for the level of spatial market integration and
price transmission. The external prices included in the model are first, Zambian border prices
(Chipata retail) in the Malawi model, and Malawian border prices (Mchinji retail) in the Zambia
5 Comprehensive data on FRA sales are not available for the full period of analysis are so are
excluded from the model. ADMARC purchase and sales data are only available at the national
level in Malawi so are not included in the Malawi model. This should be of little consequence
since table 1 shows that ADMARC maize purchases in Malawi were minimal relative to
production during the years of our analysis. Therefore, ADMARC activities should have little to
no effect on maize prices in Malawi. 6 Readers may be concerned about high correlation between district-level FRA purchases and
subsidized fertilizer receipt in Zambia, which would result in multicollinearity and increase the
standard errors of both coefficient estimates. However, the correlation coefficient between the
two variables is just 0.52. Therefore, although there is some correlation, it is not high enough to
raise serious concerns about multicollinearity. Moreover, the coefficient estimates are still
unbiased and consistent in the presence of multicollinearity; only the standard errors are affected.

17
model. Second, we include lagged maize spot prices on the South African Futures Exchange
(SAFEX) in the models for both Malawi and Zambia. (See Appendices A and B for summary
statistics for the Malawi and Zambia models, respectively.) Moreover, both models include
maize marketing year dummies, a hungry/lean season dummy (=1 if November-April and 0
otherwise), time period dummies, and a linear time trend. These variables should control for
other national- and international level factors and policies affecting retail maize prices in Malawi
and Zambia. These include many of the maize marketing and price policies discussed in the
background section, such as changes over time in import tariffs, export bans, levies on inter-
district maize trade, maize marketing board pan-territorial prices, the Malawian government’s
decision to source 400,000 MT of maize for export to Zimbabwe in 2007, etc. The parameter
vector for Z is represented by θ.
The error term in equation (6) has two components: ci represents time constant
unobserved heterogeneity, while μi,t represents the unobserved time-varying shocks that affect
maize prices. We give thorough treatment to potential correlation between the errors and the
observable covariates in the following section.
Estimation Strategy
In order to obtain consistent and efficient estimates of the factors affecting maize prices, there
are several estimation challenges that we must address. The first is dealing with correlation
between the observed covariates and the unobserved time-constant heterogeneity, ci. In order to
do so we convert equation (6) into first difference (FD) form as follows:
Δpri,t = + ∑
+ ΔXi,tβ + ΔZtθ + Δμi,t (7)

18
where Δ represents the change in the variables of interest between one time period and the next.
First-differencing removes the ci from the model. However, we face an additional modeling
challenge because in FD form Δμi,t is correlated with , since
depends on μi,t-1.
Fortunately, if Δμi,t is uncorrelated with
for j ≥ 2, then we can use lagged values of
where j≥2 to instrument for . The resulting framework is known as the Arellano-Bond
estimator following Arellano and Bond (1991).
The AB framework allows us to designate variables as strictly exogenous (e.g., rainfall
levels and stress), predetermined but weakly endogenous (e.g., subsidized fertilizer, FISP), or
contemporaneously endogenous (e.g., border prices, rice/bread prices, and FRA purchases). The
AB framework then uses lagged levels and/or differences as instruments for the
contemporaneously endogenous and predetermined/weakly endogenous variables in order to
consistently estimate the model parameters. In the AB framework, we treat subsidized fertilizer
(FISP) as a pre-determined variable because FISP levels are determined before maize prices in
the subsequent maize marketing year are realized. However, FISP may violate strict exogeneity
if there is feedback from current retail maize prices to future levels of subsidized fertilizer. For
example, if retail maize prices are high in a given season, the government may decide to increase
FISP levels in the next season in an attempt to reduce maize prices. The AB framework allows us
to correct for the potential endogeneity of FISP and other variables in the model. We estimate
two sets of models: one via FD but excluding the lagged dependent variables (LDVs), and one
via AB including the LDVs. Standard errors in both the FD and AB models are made robust to
heteroskedasticity, and the FD standard errors are also made robust to serial correlation.
Serial correlation

19
While serial correlation only affects the efficiency of the FD estimates, the AB estimates are
inconsistent in the presence of serial correlation. Therefore, eliminating serial correlation is of
critical importance in the AB models. In the AB models we therefore add lags of the retail maize
price until the serial correlation (in the first-differenced errors) is eliminated.7 Test results
indicate that serial correlation is eliminated once we include three lags of the retail maize price in
the Malawi model, and eight lags in the Zambia model (see Appendices C and D).
Functional form
The maize price variable in our model is in log form, while the key explanatory variable of
interest (FISP) is in levels.8 Therefore, the coefficient should be interpreted as a semi-
elasticity (or in this case a semi-flexibility). The other price variables are in log form, so the
coefficients can be interpreted directly as flexibilities. In our main models, all prices are
converted to real terms by dividing by the CPI in the respective countries. We also run
robustness checks where the models are estimated using nominal prices, and/or in level-level
form.
Results
Table 5 presents the results for factors affecting real retail maize prices in Malawi. The four
columns in table 5 present different versions of the model. Columns A) and C) present the
“sparse” model specification, where maize prices are a function of subsidized fertilizer receipt
and rainfall along with district fixed effects, time and season fixed effects, a linear time trend,
7 The AB first-differenced errors are serially correlated by construction at lag order 1 but are
serially-uncorrelated at higher lags. See Appendices C and D. 8 Subsidized fertilizer is equal to zero in some districts in some years, so it is not possible to
transform the variable into logs.

20
and a constant. Columns B) and D) present the “fully specified” model. In addition to the
variables in the “sparse” model, the “fully specified” model also includes rice prices, maize
prices at the Zambian border, and lagged maize prices on SAFEX. Columns A) and C) are
estimated via FD, while columns B) and D) are estimated via AB.
The coefficient on the subsidized fertilizer variable clearly indicates that, across the four
models, subsidized fertilizer has a marginally statistically significant and small negative effect on
market-level retail maize prices in Malawi. The coefficients in columns A), B) and D) indicate
that an additional 1,000 metric tons of subsidized fertilizer delivered to a district in Malawi
reduces retail maize prices by just 0.3% on average in the markets in that district. In column C)
the same increase in subsidized fertilizer reduces the maize price by 0.4%, which is still
economically small. Between 1999/00 and 2010/11 agricultural years the average district in
Malawi received 4,373 metric tons of fertilizer per year (appendix A). Therefore, if Malawi
decided to roughly double the size of its input subsidy program by increasing the amount of
subsidized fertilizer distributed to each district by 4,000 metric tons per year, it would only
reduce the price of maize by 1.2% to 1.6% on average, ceteris paribus.
The bottom of columns B) and D) show the long run (three period) impact flexibility of
subsidized fertilizer on maize prices. The long run effect is statistically insignificant (p>0.10)
and economically small in magnitude similar to the current year effect of subsidized fertilizer.
The other coefficients in table 5 generally have the expected signs, although their
statistical significance varies by model specification. Cumulative rainfall over the growing
season has a negative effect on maize prices, while increased rainfall stress has a positive effect
on maize prices. The lean season dummy variable has a statistically significant and positive sign
in all models except for the sparse model estimated via FD in column A), which is the most basic

21
and likely least robust of our four specifications. Higher rice prices lead to higher maize prices,
indicating that the commodities are complements, as we would expect. Moreover, higher prices
on the Zambian border lead to significantly higher prices in Malawi. Recall that the border
prices are treated as contemporaneously endogenous, and endogeneity is dealt with by using
lagged prices as instruments for current prices with the AB estimator. The finding of higher
prices on the Zambian border driving higher prices in Malawi indicates some degree of spatial
price transmission and market integration between the two countries.
Table 6 presents the results for factors affecting maize prices in Zambia. Table 6 presents
the results in the same way that table 5 does for the Malawi models, except the Zambian model
includes eight lags of retail maize prices to remove serial correlation. In addition, the “fully
specified” Zambian model has FRA prices, bread prices, and diesel prices as additional controls.
Several variables (the log retail electricity price, the log real commercial lending rate, and the
lagged log real SAFEX price) drop out of the fully specified models due to perfect collinearity.
In Zambia, an additional 1,000 metric tons of subsidized fertilizer delivered to each
district reduces maize prices in that district by 1.8% to 2.4% on average (table 6, columns A
through C); however, subsidized fertilizer has no statistically significant effect on retail maize
prices in the fully-specified AB model (column D). The subsidy program in Zambia is a bit
smaller than in Malawi, and the average amount of subsidized fertilizer distributed in each
district between the 1999/00 and 2011/12 production years was 1,108 metric tons (Appendix B).
Therefore, the coefficient estimates from table 6 indicate that if Zambia’s fertilizer subsidy
program were to increase by 1,000 metric tons in each district per year (roughly doubling the
size of the program), then maize prices would only decrease between 1.8% and 2.4% on average,
other factors constant.

22
The long run (eight period) impact flexibility indicates that subsidized fertilizer has a
negative and small effect on maize prices. The long-run effect is statistically significant at the
1% level in the sparse AB model and indicates that a 1,000 metric ton increase in subsidized
fertilizer distributed to a district reduces the retail maize price by 2.8% on average.
Table 6 shows that higher rainfall in a district leads to higher maize prices in that district,
but the effect is only statistically significant in the FD specifications. Higher rainfall stress also
leads to statistically significantly higher maize prices in the FD specification, which is what we
would expect. The lean season dummy is positive and statistically significant in all models, as
expected a priori. Increases in FRA purchases are found to have a negative effect on maize
prices. This finding may seem counterintuitive but could be explained by the fact that heavy
FRA purchases are generally associated with large subsidized sales to millers, which put
downward pressure on maize market prices.
Table 7 shows robustness checks for the Malawi models, and table 8 presents the same
robustness checks for the Zambia models. The three additional specifications in these tables are:
1) level-level form with real prices, 2) log-log form with nominal prices, and 3) level-level form
with nominal prices. When the models are estimated in level-level form the results are
interpreted as Malawian or Zambian Kwacha changes in the maize price given a change in the
quantity of subsidized fertilizer distributed to a district. The degree of statistical significance in
tables 7 and 8 varies by functional form specification, but the direction and magnitude of the
coefficient is the same. The long-run impact flexibilities of subsidized fertilizer are negative but
not statistically significant in any specification for Malawi but the current year impact
flexibilities are statistically significant in 7 of the 12 specifications. In Zambia, the long-run
impact flexibilities are statistically significant in the sparsely specified AB models regardless of

23
functional form, while the current year effects are statistically significant in 5 of the 12
specifications. The robustness checks (tables 7 and 8) show that subsidized fertilizer has
essentially the same effect on maize prices as it does in our base specification (tables 5 and 6)
where the model is estimated in real terms in log-log form. Overall, subsidized fertilizer has a
negative and statistically significant (p<0.10) short-run effect on retail maize prices in 11 of the
16 models estimated for Malawi and in eight of the 16 models estimated for Zambia.
Overall the results from Malawi and Zambia indicate that the maize price effects from the
fertilizer subsidy programs in both countries are very small. This finding is consistent with
literature showing that input subsidies crowd out commercial fertilizer in Malawi (Ricker-Gilbert
et al. 2011) and in Zambia (Xu et al. 2009; Mason and Jayne, forthcoming). It is also supported
by the literature showing that inputs subsidies have positive but quite small effects on maize
production in both countries. (See Holden and Lunduka (2010), Ricker-Gilbert and Jayne (2011),
and Shively et al. (2012) for estimates of program impacts in Malawi; and Mason et al.
(forthcoming) for estimates for Zambia.) Our findings are also in line with recent studies
demonstrating that markets in the southern Africa region are reasonably well integrated (Myers
and Jayne 2011, Burke 2012).
Conclusions
Input subsidy programs are currently gaining substantial attention as a strategy for boosting
staple crop production and improving household food security in sub-Saharan Africa (SSA).
While emerging literature is beginning to quantify the impacts of input subsidies on maize
production, it is sometimes argued that the most important welfare effects of input subsidy
programs operate through the price of maize. To the extent that the rural poor tend to be net

24
buyers of maize, government programs that expand the supply of food and exert downward
pressure on food prices may have important poverty reducing effects. However, to date there has
been little quantitative evidence about how input subsidies affect maize prices. The motivation
of this study was to empirically investigate and quantify this important potential general
equilibrium effect, based on two sub-Saharan African countries, Malawi and Zambia that have
both implemented large-scale input subsidy programs and where it would be plausible to detect
such general equilibrium effects.
This study uses market and district-level retail price data, along with data on the quantity
of subsidized fertilizer distributed to each district over a 12-year period in both Malawi and
Zambia. We control for the effects of other staple food prices, rainfall, marketing board
activities, spatial market integration, and factors affecting marketing margins in our econometric
models of fertilizer subsidy effects on retail maize prices.
The findings from our article are consistent between Malawi and Zambia. They indicate
that fertilizer subsidies have either no statistically significant effect on retail maize prices or,
more commonly, a statistically significant but very small negative effect on those prices. The
results suggest that roughly doubling the size of Malawi’s subsidy program (i.e., increasing the
amount of subsidized fertilizer distributed to in each district by 4,000 metric tons per year) only
reduces maize prices by 1.2% to 1.6% on average. In Zambia, roughly doubling the scale of the
country’s subsidy program (i.e., by increasing the amount of subsidized fertilizer distributed to
each district by 1,000 metric tons per year) only reduces maize prices by 1.8% and 2.4% on
average. These results are in line with the finding that there has been virtually no change in
rural poverty rates in either country since these large-scale input subsidy programs were scaled
25
up (see GOM 2012 for Malawi; and Central Statistical Office (CSO) 2009, and 2011 for
Zambia).
To our knowledge the results from Malawi and Zambia provide the strongest and most
externally valid results to date on how fertilizer subsidy programs influence food price levels.
Our findings of no significant or statistically significant but very small negative impacts of input
subsidies on retail maize prices are supported by the literature that finds fertilizer subsidies
crowd out commercial fertilizer and have a positive but relatively small impact on maize
production. The findings are also consistent with the literature showing that maize markets are
reasonably well integrated in the region. Ultimately if the fertilizer subsidy programs in both
Malawi and Zambia produce modest gains in maize production, and maize markets in both
countries are at least partially integrated into international markets, then there is no reason to
expect that the subsidy programs would have large impacts on maize prices for more than a
relatively short period. Moreover, because food prices in Malawi have been at or near import
parity levels for most of the lean season periods over the past 12 years, and the country has been
importing maize from neighboring countries almost continuously even since the subsidy program
was scaled up in 2005/06 (Myers and Jayne 2012; Jayne et al 2010), it is plausible that any
production expansion in Malawi has mainly substituted local production for a reduction in
imports without affecting its general import parity position. While increased local production is
an important national policy goal, it may not have been large enough to alter the country’s
import parity pricing position during its lean season period.
Notwithstanding this point, it should be noted that even small decreases in maize prices
would benefit the many poor rural and urban households that are net buyers of maize. However,
empirical evidence presented here does not support the often-asserted claim that large public

26
expenditures on input subsidies have major poverty reducing effects because the programs
produce large spill-over benefits in the form of substantially lower maize prices. The empirical
evidence to date suggests that even the large-scale fertilizer subsidy programs in the region may
result in very small, if any, reductions in retail food prices in semi-open economies.
References
Arellano, M. and Bond, S., 1991. Some Tests of Specification for Panel Data: Monte Carlo
Evidence and an Application to Employment Equations. Review of Economic Studies. 58,
277-297.
Awudu, A., 2007. Spatial and vertical price transmission in food staples market chains in eastern
and southern Africa: What is the evidence? Paper prepared for the Conference on Staple
Food Trade and Market Policy Options for Promoting Development in Eastern and
Southern Africa. Trade and Markets Division, FAO Headquarters, Rome, Italy, March 1-
2, 2007.
Burke, W.J., Jayne, T.S. and Chapoto, A. 2010. Factors Contributing to Zambia’s 2010 Maize
Bumper Harvest. Food Security Research Project Working Paper No. 48. Lusaka, Zambia
FSRP, Accessed March 2012, available at http://fsg.afre.msu.edu/zambia/wp48.pdf.
Burke, W.J., 2012. Maize Production in Zambia and Regional Marketing: Input Productivity and
Output Price Transmission. Ph.D. dissertation. Lansing, MI: Michigan State University.
Central Statistical Office (CSO), 2009. Living Conditions Monitoring Survey 2006 Draft Report
– Chapter 12, Poverty. CSO, Lusaka, Zambia.
Central Statistical Office (CSO), 2011. Living Conditions Monitoring Survey Report, 2006 and
2010. CSO, Lusaka, Zambia.
Chapoto, A., 2012. The political economy of food price policy: The case of Zambia. UNU-Wider
Working Paper No. 2012/100, Accessed March 2013, available at
http://www.wider.unu.edu/publications/working-papers/2012/en_GB/wp2012-
100/_files/88782264728748108/default/wp2012-100.pdf.
Chirwa, E., 1999. Food marketing reforms and integration of maize and rice markets in Malawi.
Working paper WC/05/99. University of Malawi, Chancellors College, Department of
Economics, Zomba, Malawi.
Chow G.C., 1975. Analysis and Control of Dynamic Economic Systems, John Wiley & Sons Inc.,
New York

27
Dorward, A.R., Chirwa, E., and Slater, R., 2010. Evaluation of the 2008/9 agricultural input
subsidy programme, Malawi: Report on programme implementation. School of Oriental
and African Studies, London.
Dorward, A.R, Chirwa, E., 2011. The Malawi Agricultural Input Subsidy Programme: 2005/06
to 2008/09. International Journal of Agricultural Sustainability. 16, 232-247.
Dugger, C. W., 2007. Ending Famine, Simply by Ignoring the Experts. New York Times,
December 2, 2007, pp. 1.
Goletti, F. and Babu. S., 1994. Market liberalization and integration of maize markets in Malawi.
Agricultural Economics. 11, 311 – 324.
Govereh, G., Jayne, T. S., Chapoto, A., 2008. Assessment of alternative maize trade and market
policy interventions in Zambia. Food Security Research Project Working Paper No. 33.
Lusaka, Zambia: FSRP. Accessed March 2013, available at
http://fsg.afre.msu.edu/zambia/wp_33.pdf.
Government of Malawi, 2012. Integrated Household Survey 2010-11. Household Socio-
Economic Characteristics Report. National Statistical Office, Zomba.
Harrigan, J., 2008. Food Insecurity, Poverty and the Malawian Starter Pack: Fresh Start or False
Start? Food Policy 3, 237-49.
Holden, S., Lunduka, R., 2010. Too Poor to be Efficient? Impacts of the targeted fertilizer
subsidy program in Malawi on farm plot level input use, crop choice and land
productivity. Working Paper, Depart. of Econ. and Resource Management, Norwegian
University of Life Sciences, Norway.
Holden S., Lunduka, R., 2013. Who Benefited from Malawi’s Targeted Farm Input Subsidy
Program? Forum for Development Studies, 40(1), 1-25. Available online at:
http://dx.doi.org/10.1080/08039410.2012.688858
International Monetary Fund (IMF), 2012. Zambia: 2012 Article IV Consultation. IMF Country
Report No. 12/200, July, 2012. Accessed March 2013, available at
http://www.imf.org/external/pubs/ft/scr/2012/cr12200.pdf.
Ivanic, M. and Martin, W., 2008. Implications of Higher Global Food Prices for Poverty in
Low-Income Countries. Policy Research Working Paper 4594. Washington, DC: World
Bank.
Jayne, T. S., Jones, S., 1997. Food marketing and price policy in eastern and southern Africa: A
survey. World Development 25, 1505-1527.

28
Jayne, T. S., Sitko, N., Ricker-Gilbert, J. and Mangisoni, J., 2010. Malawi’s Maize Marketing
System. The Evaluation of the 2008/9 Agricultural Input Subsidy Programme, Malawi.
Logistics Unit, Malawi. (Various years). Annual input subsidy implementation reports.
Lilongwe, Malawi: Logistics Unit.
Loy, J.P. and Wichern, R., 2000. Integration of Zambian Maize Markets.” Quarterly Journal of
International Agriculture. 39(2), 173-198.
Mason, N.M., Burke, W.J., Shipekesa, A. and Jayne, T.S., 2011. The 2011 Surplus in
Smallholder Maize Production in Zambia: Drivers, Beneficiaries, and Implications for
Agricultural and Poverty Reduction Policies. Food Security Research Project Working
Paper No. 58. Lusaka, Zambia: FSRP. Accessed March 2013, available at
http://fsg.afre.msu.edu/zambia/wp58.pdf.
Mason, N. M., Jayne, T. S., Myers, R. J., 2012. Smallholder behavioral responses to marketing
board activities in a dual channel marketing system: The case of maize in Zambia.
Selected paper prepared for presentation at the International Association of Agricultural
Economics Triennial Conference, Foz do Iguaçu, Brazil, 18-24 August, 2012. Accessed
March 2013, available at
http://ageconsearch.umn.edu/bitstream/126927/2/MasonEtAl.pdf.
Mason, N.M. and Jayne, T.S., (Forthcoming). Fertilizer Subsidies and Smallholder Commercial
Fertilizer Purchases: Crowding Out, Leakage, and Policy Implications for Zambia.
Journal of Agricultural Economics, in press.
Mason, N.M., T.S. Jayne, and R. Mofya-Mukuka. Zambia’s Input Subsidy Programmes. Indaba
Agricultural Policy Research Institute Working Paper, in press. IAPRI, Lusaka, Zambia.
Mason, N.M. and Myers, R.J., 2013. The Effects of the Food Reserve Agency on Maize Market
Prices in Zambia. Agricultural Economics. 44, 203-216.
Mason, N., and J. Ricker-Gilbert., Forthcoming. Disrupting Demand for Commercial Seed: Input
Subsidies in Malawi and Zambia. World Development, in press.
Ministry of Agriculture and Cooperatives (MACO), various years. Fertilizer Support Program
and Farmer Input Support Program Implementation Manuals. MACO, Lusaka, Zambia.
Ministry of Agriculture and Cooperatives (MACO), Agricultural Consultative Forum, and Food
Security Research Project, 2002. Developments in fertilizer marketing in Zambia:
Commercial trading, government programs, and the smallholder farmer. Food Security
Research Project Working Paper No. 4. Accessed March 2013, available at
http://fsg.afre.msu.edu/zambia/wp4zambia.pdf.
Ministry of Agriculture and Livestock (MAL), 2012. Farmer Input Support Programme
Implementation Manual, 2012/13 Agricultural Season. Lusaka, Zambia: MAL.

29
Myers, R.J. and Jayne, T.S., 2012. Multiple-Regime Spatial Price Transmission with an
Application to Maize Markets in Southern Africa. American Journal of Agricultural
Economics. 94(1), 174-188.
Myers, R. 2008. Evaluating the efficiency of inter-regional trade and storage in Malawi maize
markets. Report for the World Bank. Michigan State University, East Lansing, MI, USA
National Statistical Office (NSO), 2011. 2011 Statistical Yearbook. NSO, Zomba, Malawi.
Nkonde, C., Mason, N.M., Sitko, N.J., Jayne, T.S., 2011. Who gained and who lost from
Zambia’s 2010 maize marketing policies? Food Security Research Project Working Paper
No. 49. Accessed March 2013, available at
http://www.aec.msu.edu/fs2/zambia/wp49.pdf.
Rashid, S., 2004. Spatial integration of maize markets in post-liberalized Uganda. Discussion
Paper 71. Markets, Trade, and Institutions Division, International Food Policy Research
Institute, Washington D.C.
Ravallion, M., 1990. Rural Welfare Effects of Food Price Changes Under Induced Wage
Response: Theory and Evidence for Bangladesh. Oxford Economic Paper 42(3), 574-585.
Ravallion, M., 2000. Prices, Wages and Poverty in Rural India: What Lessons do the Time Series
Data Hold for Policy? Food Policy. 25, 351-364.
Ricker-Gilbert, J., Jayne, T.S. and Chirwa, E., 2011. Subsidies and Crowding Out: A Double-
Hurdle Model of Fertilizer Demand in Malawi. American Journal of Agricultural
Economics. 93(1), 26-42.
Ricker-Gilbert, J., Jayne, T.S., 2011. What are the Enduring Effects of Fertilizer Subsidy
Programs on Recipient Farm Households? Evidence from Malawi. Staff Paper 2011-09,
Department of Agricultural, Food and Resource Economics, Michigan State University.
East Lansing, MI. USA.
Sachs, J., 2012. How Malawi Fed Its Own People. New York Times, April 19, 2012. Retrieved
from http://www.nytimes.com/2012/04/20/opinion/how-malawifed-its-own-
people.html?pagewanted=all
Shively, G., Chibwana, C., Fisher, M., Jumbe, C., Masters, W., 2012. Measuring the Impacts of
Malawi’s Farm Input Subsidy Program. Working Paper, Department of Agricultural
Economics, Purdue University. West Lafayette, IN. USA.
Tostau, E. and Brorsen, W., 2005. Spatial price efficiency in Mozambique’s post-reform maize
markets. Agricultural Economics. 33(2), 205–214.

30
Van Campenhout, B., 2008. Modelling trends in food market integration: Method and an
application to Tanzanian maize markets. Food Policy. 32(1), 112-127.

31
Figure 1: Trends in subsidized fertilizer tonnage and smallholder maize production,
1999/2000 to 2010/11 agricultural years – Malawi
Source: Maize production from FAOSTAT. Subsidized fertilizer quantities are from Logistics Unit Reports for various years.
0
500,000
1,000,000
1,500,000
2,000,000
2,500,000
3,000,000
3,500,000
4,000,000
0
50,000
100,000
150,000
200,000
250,000
Mai
ze p
rod
uct
ion
(M
T)
MT
of
sub
sid
ize
d f
ert
ilize
r
Agricultural year
Subsidized fertilizer (MT) Smallholder maize production (MT, right scale)

32
Figure 2: Subsidized Fertilizer Distribution and Maize Price Trends in Malawi.
Source:
Subsidized fertilizer quantities from the Logistics Unit Reports for various years. Maize prices come from
the Malawi Ministry of Agriculture and Food Security.
0
50,000
100,000
150,000
200,000
250,000
0
10
20
30
40
50
60
70
80
00
/01
H
00
/01
L
01
/02
H
01
/02
L
02
/03
H
02
/03
L
03
/04
H
03
/04
L
04
/05
H
04
/05
L
05
/06
H
05
/06
L
06
/07
H
06
/07
L
07
/08
H
07
/08
L
08
/09
H
08
/09
L
09
/10
H
09
/10
L
10
/11
H
10
/11
L
11
/12
H
MT
of
sub
sid
ize
d f
ert
ilize
r
Re
tail
mai
ze p
rice
(ZM
K/k
g)
Maize marketing year and season (H=harvest, L=lean)
MT of subsidized fertilizer distributed in the previous agricultural season (right scale)
Nominal retail maize price (MWK/kg)
Real retail maize price (MWK/kg, Oct. 2011=100)

33
Figure 3: Trends in subsidized fertilizer tonnage and smallholder maize production and
sales, 1999/2000 to 2011/12 agricultural years – Zambia
Source: MAL (2012); CSO/MACO Crop Forecast Survey data (various years); CSO/MACO Post-Harvest Survey data (various years); CSO/MACO/FSRP Supplemental Survey data (various years).
0
500,000
1,000,000
1,500,000
2,000,000
2,500,000
3,000,000
0
20,000
40,000
60,000
80,000
100,000
120,000
140,000
160,000
180,000
200,000
1999/2000
2000/2001
2001/2002
2002/2003
2003/2004
2004/2005
2005/2006
2006/2007
2007/2008
2008/2009
2009/2010
2010/2011
2011/2012
Maizeproduconorsales(M
T)
MTofsubsidizedferlizer
Agriculturalyear
Subsidizedfer lizer(MT)
Smallholdermaizeproduc on(MT,rightscale)
Smallholdermaizesales(MT,rightscale)

34
Figure 4: Average harvest season and lean season retail maize prices and total subsidized
fertilizer distributed during the period agricultural season, 2000/01 to 2011/12 maize
marketing years (1999/2000 to 2010/11 agricultural years) – Zambia
Source: MAL (2012); CSO retail price database. Note: Prices are seasonal averages across 50 districts in Zambia. Harvest season = May-October; lean season = November-April.
0
20,000
40,000
60,000
80,000
100,000
120,000
140,000
160,000
180,000
200,000
0
500
1,000
1,500
2,000
2,500
3,000
3,500
4,000
00/01H
00/01L
01/02H
01/02L
02/03H
02/03L
03/04H
03/04L
04/05H
04/05L
05/06H
05/06L
06/07H
06/07L
07/08H
07/08L
08/09H
08/09L
09/10H
09/10L
10/11H
10/11L
11/12H
11/12L
MTofsubsidizedferlizer
Retailmaizeprice(ZM
K/kg)
Maizemarke ngyearandseason(H=harvest,L=lean)
MTofsubsidizedfer lizerdistributedinthepreviousagriculturalseason(rightscale)
Nominalretailmaizeprice(ZMK/kg)
Realretailmaizeprice(ZMK/kg,Apr.2012=100)

35
Table 1: Fertilizer subsidy program subsidy rates, volumes, and numbers of intended beneficiaries; total smallholder maize
production; and mean harvest season and lean season retail maize prices; 2000/01 to 2012/13 agricultural years – Malawi
Agricultural year
Subsidy Rate
MT of subsidized fertilizera
Intended number of beneficiary households
in ‘000a
Total smallholder
maize productionb
ADMARC maize purchases
(MT)c
Mean retail maize price in year after harvest
(real MK/kg, October. 2011=100)d
Harvest season (May-Oct.)
Lean season (Nov.-Apr.)
(A) (B) (C) (D) (E) (F) (G)
1999/00 100 42,478 2,860 2,479,410 198,021 NA NA
2000/01 100 15000 1,500 2,501,310 0 20.19 26.59
2001/02 100 14,928 1,000 1,713,060 2,890 41.6 84.75
2002/03 100 35,000 2,000 1,556,980 0 48.05 61.34
2003/04 100 22,000 1,700 1,983,440 0 35.58 59.53
2004/05 100 54,000 2,000 1,608,350 7,000 48.03 57.22
2005/06 64 131,388 NA 1,225,230 9,097 70.24 129.76
2006/07 72 174,688 3,000 2,611,490 75,622 65.94 66.51
2007/08 79 216,553 1,500 3,226,420 32,728 56.5 113.23
2008/09 91 202,278 1,500 2,634,700 69,485 159.34 209.26 2009/10 88 161,495 1,600 3,582,500 44,268 123.42 144.77 2010/11 93 160,531 1,600 3,419,410 45,248 104.03 102.78 2011/12 NA 160,834 NA 3,699,150 17,420 NA NA
Source: a. Logistics Unit Reports (Various Years) b. FAO statistics c. National Statistical Office (2011) d. Ministry of Agriculture and Food Security

36
Table 2: Percentage of total subsidized fertilizer allocated to each Region, 1999/2000 to 2011/12 agricultural years – Malawi
Source: Logistics Unit Reports (various years).
Agricultural year
Northern
Central
Southern
Total Quantity (MT)
1999/00 10.7 40.7 48.7 42,478 2000/01 9.6 38.1 52.3 15,000 2001/02 9.6 39.7 50.7 14,928 2002/03 9.6 39.2 51.2 35,000 2003/04 9.6 37.5 52.9 22,000 2004/05 9.6 37.5 53.0 54,000 2005/06 12.0 48.3 39.8 131,388 2006/07 15.6 46.7 37.7 174,688 2007/08 19.4 45.4 35.3 216,553 2008/09 18.9 37.7 43.4 202,278 2009/10 13.5 40.3 46.1 161,495 2010/11 13.7 40.3 46.0 160,531 2011/12 -- -- -- 160,834
Average 12.65 41.95 46.43 1,391,173

37
Table 3: Fertilizer subsidy program subsidy rates, volumes, and numbers of intended beneficiaries; total smallholder maize
production and sales; FRA purchases; and mean harvest/lean season retail maize prices; 1999/2000 to 2012/13 agricultural
years – Zambia
Agricultural year (marketing year in paren.)
Fertilizer subsidy
rate
MT of subsidized fertilizer
Intended number of beneficiary households
Total smallholder
maize production
(MT)
Total smallholder maize sales in
the subsequent marketing year
(MT)
FRA maize purchases in
the subsequent marketing year
(MT)
FRA maize purchases as % of smallholder
maize sales
Mean retail maize price in the subsequent marketing year (real ZMK/kg, Apr. 2012=100)
Harvest season (May-Oct.)
Lean season (Nov.-Apr.)
(A) (B) (C) (D) (E) (F) (G) (H) (I)
1999/2000 (2000/01) Loan 34,999 -- 1,282,352 323,387 0 0% 1,302 1,499
2000/01 (2001/02) Loan 23,227 -- 938,539 197,915 0 0% 1,773 3,337
2001/02 (2002/03) Loan 28,985 -- 947,825 195,407 23,535 12.0% 2,595 3,013
2002/03 (2003/04) 50% 48,000 120,000 1,365,455 370,332 54,847 14.8% 1,659 1,779
2003/04 (2004/05) 50% 60,000 150,000 1,216,943 356,750 105,279 29.5% 1,328 1,626
2004/05 (2005/06) 50% 46,000 115,000 800,574 206,092 78,667 38.2% 1,564 2,106
2005/06 (2006/07) 50% 50,000 125,000 1,339,479 454,676 389,510 85.7% 1,154 1,328
2006/07 (2007/08) 60% 84,000 210,000 1,960,692 762,093 396,450 52.0% 1,169 1,558
2007/08 (2008/09) 60% 50,000 125,000 1,392,180 522,033 73,876 14.2% 1,427 2,021
2008/09 (2009/10) 75% 80,000 200,000 1,657,117 613,356 198,630 32.4% 1,548 1,770
2009/10 (2010/11) 75% 100,000 500,000a 2,463,523 1,062,010 883,036 83.1% 1,259 1,374
2010/11 (2011/12) 76% 178,000 891,500a 2,786,896 1,429,911 1,751,660 122.5% 1,087 1,153
2011/12 (2012/13) 79% 182,454 914,670a 2,731,843 1,440,944 1,034,000c 71.8% -- --
2012/13 (2013/14) -- 183,634b 900,000b -- -- -- -- -- --
Source: MAL (2012); CSO/MACO Crop Forecast Survey data (various years); CSO/MACO Post-Harvest Survey data (various years); CSO/MACO/FSRP Supplemental Survey data (various years); CSO retail price database; FRA. Note: -- Information not yet available. aPack size reduced from eight 50 kg bags to four 50 kg bags. bPlanned distribution and number of intended beneficiaries (2012/2013 agricultural year not yet complete at time of writing). 2010/11 through 2012/13 total fertilizer and intended beneficiaries are for all crops. Other crops were included in the program beginning in 2010/11 (rice beginning in 2010/11, and sorghum, cotton, and groundnuts beginning in 2012/13). Varying quantities of fertilizer were distributed along with these crops. Values in the table are for the Fertilizer Credit Programme for 2000/01-2001/02, the Fertilizer Support Program for 2002/03-2008/09, and the Farmer Input Support Program for 2009/10-2012/2013. cPreliminary figure. Final figure not yet released by FRA.

38
Table 4: Percentage of total subsidized fertilizer allocated to each province, 1999/2000 to 2012/13 agricultural years – Zambia
Agricultural year Central Copperbelt Eastern Luapula Lusaka Northern
North- western Southern Western Backup Total Quantity
1999/2000 20.1 6.3 24.2 2.2 9.4 11.3 2.0 23.2 1.3 0 34,999 2000/01 14.5 7.3 21.4 2.2 7.7 10.8 1.7 32.9 1.5 0 23,227 2001/02 22.1 7.4 21.9 2.0 7.4 10.7 2.0 24.7 1.8 0 28,985 2002/03 13.9 5.7 26.0 5.5 3.5 15.2 4.4 19.0 6.9 0 48,000 2003/04 15.3 9.1 25.7 5.7 6.7 16.7 5.9 10.7 4.2 0 60,000 2004/05 18.1 13.3 21.1 4.6 7.3 17.0 3.7 12.3 2.6 0 46,000 2005/06 18.0 13.0 20.0 4.1 6.8 16.5 5.5 13.9 2.1 0 50,000 2006/07 15.7 11.7 16.0 4.3 5.7 17.3 3.7 19.0 2.5 4.1 84,000 2007/08 16.5 12.3 18.5 4.8 6.2 13.7 5.0 17.7 2.3 3.0 50,000 2008/09 17.1 12.5 18.8 7.3 4.4 14.2 5.1 18.1 2.5 0 80,000 2009/10 17.6 10.5 19.5 5.1 6.9 14.5 6.2 15.4 4.4 0 100,000 2010/11 16.9 9.6 19.5 5.8 6.4 14.9 6.2 17.0 2.5 1.1 178,000 2011/12 16.7 9.8 17.7 5.9 6.3 15.9 6.0 16.7 3.0 2.0 182,454 2012/13 16.6 10.0 18.3 5.9 6.3 16.2 5.9 17.0 3.3 0.4 183,634
Average 16.9 10.2 19.6 5.3 6.3 15.3 5.3 17.2 3.0 1.0 1,149,299
Source: MACO (various years); MAL (2012). Note: Backup fertilizer is additional fertilizer intended for the program but not allocated to a particular province or district.

39
Table 5: First-difference and Arellano-Bond estimation results on the effects of subsidized fertilizer on log real retail maize
prices – Malawi Model specification: Sparse Fully-specified
Estimator: (A) First-difference (B) Arellano-Bond (C) First-difference (D) Arellano-Bond
Explanatory variables: Coef. Sig. p-val. Coef. Sig. p-val. Coef. Sig. p-val. Coef. Sig. p-val.
Subsidized fertilizer ('000 MT) -0.003 * 0.069 -0.003 * 0.099 -0.004 ** 0.049 -0.003 * 0.088 Growing season rainfall ('00 mm, Nov.-Mar.) -2.11E-04 * 0.073 -1.92E-04 0.101 -2.10E-04 * 0.069 -1.85E-04 0.105 Rainfall stress (# of 20-day periods with <40 mm) 9.03E-03 0.249 0.008 ** 0.120 7.87E-03 0.332 6.13E-03 0.255 Lean season (Nov.-Apr.)=1; harvest season (May-Oct.)=0 -0.144 *** 0.000 0.170 *** 0.000 0.121 *** 0.000 0.172 *** 0.000 Linear time trend N/A -0.017 *** 0.000 N/A -0.034 *** 0.000 Log real retail maize price (MK, t-1) 0.202 *** 0.002 0.192 *** 0.002 Log real retail maize price (MK, t-2) 0.099 ** 0.032 0.090 * 0.056 Log real retail maize price (MK, t-3) -0.034 0.422 -0.037 0.358
Log real retail rice price (MK/kg) ** 0.039
0.137 * 0.076 0.117 ** 0.032 Log real Zambia border retail maize price (MK/kg) 0.800 *** 0.000 Log real SAFEX maize spot price, (MK/kg, 2 quarter lag) -0.039 0.104 Constant 0.017 *** 0.000 3.336 *** 0.000 -0.005 0.114 2.845 *** 0.000 Marketing year dummies? Yes Yes Yes Yes Time period dummies? Yes Yes Yes Yes
Long-run effect of subsidized fertilizer N/A -0.004 0.120 N/A -0.003 0.105 Observations 1,122 969 1,070 969
Overall model F-test for FD, Wald test for AB 2615.86 *** 0.000 26,874.68 *** 0.000 1,991.60 *** 0.000 27,680.49 *** 0.000 R-squared 0.798 N/A 0.815 N/A
Source: Own calculations. Note: ***p < 0.01, **p < 0.05, *p <0.10. Real prices are in October 2011 terms. Three lags of the dependent variable required to eliminate serial correlation in the errors of both Arellano-Bond models. Several variables dropped due to perfect collinearity (diesel prices, and lags of log real SAFEX prices).

40
Table 6: First-difference and Arellano-Bond estimation results on the effects of subsidized fertilizer on log real retail maize
prices – Zambia Model specification: Sparse Fully-specified
Estimator: (A) First-difference (B) Arellano-Bond (C) First-difference (D) Arellano-Bond
Explanatory variables: Coef. Sig. p-val. Coef. Sig. p-val. Coef. Sig. p-val. Coef. Sig. p-val.
Subsidized fertilizer ('000 MT) -0.0241 ** 0.042 -0.0187 *** 0.010 -0.0184 * 0.072 -0.00459 0.534 Growing season rainfall ('00 mm, Nov.-Mar.) 0.00528 ** 0.044 0.00288 0.282 0.00477 * 0.062 0.00468 0.103 Rainfall stress (# of 20-day periods with <40 mm) 0.00778 * 0.059 0.00572 0.126 0.00700 * 0.086 0.00679 0.107 Lean season (Nov.-Apr.)=1; harvest season (May-Oct.)=0 0.446 *** 0.000 0.0631 * 0.077 0.545 *** 0.000 0.107 *** 0.000 Linear time trend N/A -0.00586 * 0.056 N/A -0.0110 ** 0.013 Log real retail maize price (ZMK, t-1) 0.381 *** 0.000 0.342 *** 0.000 Log real retail maize price (ZMK, t-2) 0.149 *** 0.000 0.136 *** 0.000 Log real retail maize price (ZMK, t-3) -0.234 *** 0.000 -0.238 *** 0.000 Log real retail maize price (ZMK, t-4) 0.176 *** 0.000 0.171 *** 0.000 Log real retail maize price (ZMK, t-5) -0.118 *** 0.000 -0.131 *** 0.000 Log real retail maize price (ZMK, t-6) 0.125 *** 0.003 0.120 *** 0.003 Log real retail maize price (ZMK, t-7) -0.0939 ** 0.034 -0.109 ** 0.011 Log real retail maize price (ZMK, t-8) -0.0433 0.266 -0.0630 0.101 FRA maize purchases ('000 MT) -0.000881 0.218 -0.00137 ** 0.032 Log real retail rice price (ZMK/kg) 0.0730 ** 0.020 -0.0545 0.116 Log real retail bread price (ZMK/700g loaf) 0.0428 0.664 -0.0694 0.539 Log real retail diesel price (ZMK/liter) 0.246 0.157 -0.511 *** 0.000 Log real Malawi border retail maize price (ZMK/kg) 0.296 *** 0.000 -0.0628 * 0.077 Constant -0.00126 0.468 4.765 *** 0.000 -0.0212 *** 0.000 11.796 *** 0.000 Marketing year dummies? Yes Yes Yes Yes Time period dummies? Yes Yes Yes Yes
Long-run effect of subsidized fertilizer N/A -0.0284 *** 0.004 N/A -0.00595 0.529 Observations 1,145 745 1,145 745 Overall model F-test for FD, Wald test for AB 490.5 *** 0.000 17,381.2 *** 0.000 573.7 *** 0.000 29,561.7 *** 0.000 R-squared 0.800 N/A 0.802 N/A
Source: Own calculations. Note: ***p < 0.01, **p < 0.05, *p <0.10. Real prices are in April 2012 terms. Eight lags of the dependent variable required to eliminate serial correlation in the errors of both Arellano-Bond models. Several variables dropped due to perfect collinearity (log retail electricity price, log real commercial lending rate, and lagged log real SAFEX prices).

41
Table 7: Robustness checks (partial effects of subsidized fertilizer on retail maize prices) – Malawi Model specification: Sparse Fully-specified
Estimator: (A) First-difference (B) Arellano-Bond (C) First-difference (D) Arellano-Bond
Nominal vs. real, prices log-log vs. level-levela Coef. Sig. p-val. Coef. Sig. p-val. Coef. Sig. p-val. Coef. Sig. p-val.
Real, level-level: Subsidized fertilizer ('000 MT) -0.114 0.130 -0.064 0.335 -0.119 0.111 -0.078 0.196 Long-run effect of subsidized fertilizer N/A -0.067 0.367 N/A -0.081 0.228
Nominal, log-log: Subsidized fertilizer ('000 MT) -0.003 * 0.069 -0.003 * 0.099 -0.004 * 0.054 -0.003 * 0.088 Long-run effect of subsidized fertilizer N/A -0.004 0.120 N/A -0.003 0.105
Nominal, level-level: Subsidized fertilizer ('000 MT) -0.103 * 0.085 -0.062 0.207 -0.105 * 0.072 -0.073 * 0.099 Long-run effect of subsidized fertilizer N/A -0.060 0.222 N/A -0.071 0.108
Source: Own calculations. Note: ***p < 0.01, **p < 0.05, *p <0.10. Real prices are in October 2011 terms.
aSubsidized fertilizer is in levels in all models.
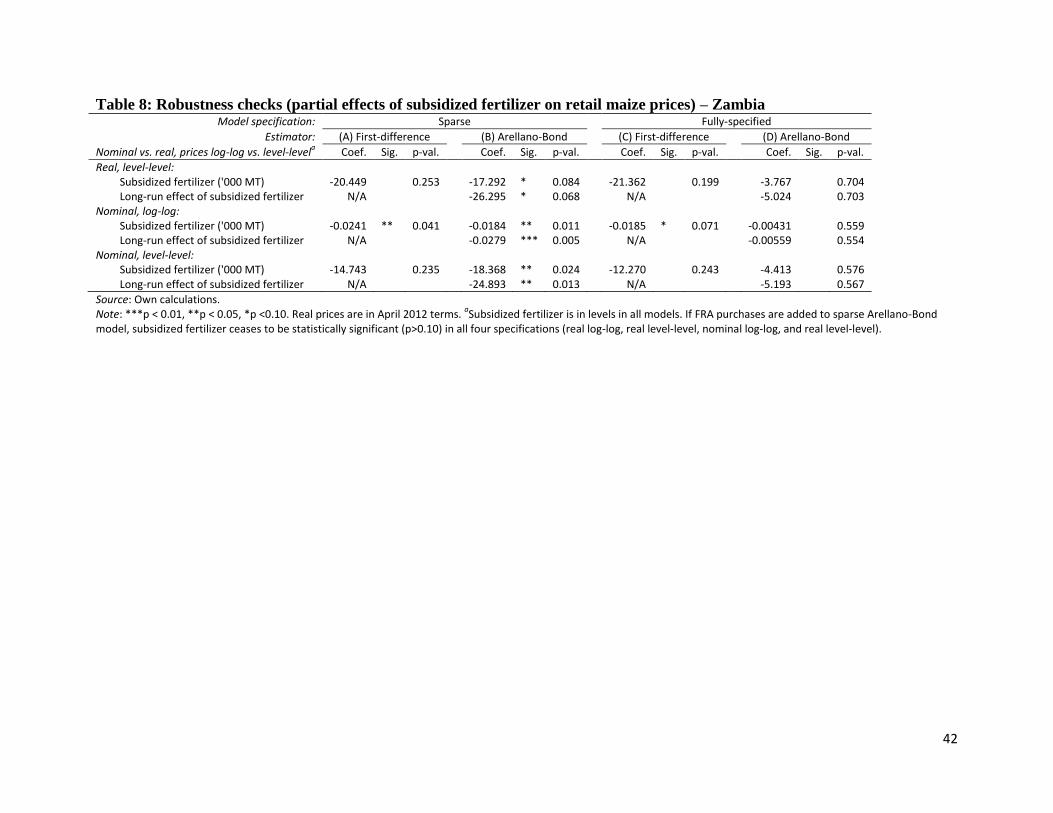
42
Table 8: Robustness checks (partial effects of subsidized fertilizer on retail maize prices) – Zambia Model specification: Sparse Fully-specified
Estimator: (A) First-difference (B) Arellano-Bond (C) First-difference (D) Arellano-Bond
Nominal vs. real, prices log-log vs. level-levela Coef. Sig. p-val. Coef. Sig. p-val. Coef. Sig. p-val. Coef. Sig. p-val.
Real, level-level: Subsidized fertilizer ('000 MT) -20.449 0.253 -17.292 * 0.084 -21.362 0.199 -3.767 0.704 Long-run effect of subsidized fertilizer N/A -26.295 * 0.068 N/A -5.024 0.703
Nominal, log-log: Subsidized fertilizer ('000 MT) -0.0241 ** 0.041 -0.0184 ** 0.011 -0.0185 * 0.071 -0.00431 0.559 Long-run effect of subsidized fertilizer N/A -0.0279 *** 0.005 N/A -0.00559 0.554
Nominal, level-level: Subsidized fertilizer ('000 MT) -14.743 0.235 -18.368 ** 0.024 -12.270 0.243 -4.413 0.576 Long-run effect of subsidized fertilizer N/A -24.893 ** 0.013 N/A -5.193 0.567
Source: Own calculations. Note: ***p < 0.01, **p < 0.05, *p <0.10. Real prices are in April 2012 terms.
aSubsidized fertilizer is in levels in all models. If FRA purchases are added to sparse Arellano-Bond
model, subsidized fertilizer ceases to be statistically significant (p>0.10) in all four specifications (real log-log, real level-level, nominal log-log, and real level-level).

43
Appendix A: Summary statistics – Malawi Percentiles
Variables Mean Std. dev. 10th
25th
50th
75th
90th
Dependent variable: Real retail maize price (MK/kg) 37.300 15.456 21.428 26.934 33.537 43.944 59.919
Explanatory variables: Subsidized fertilizer ('000 MT) 4.373 5.834 0.407 0.708 1.728 5.617 10.713 Growing season rainfall ('00 mm, Nov.-Mar.) 835.001 112.371 707.058 750.194 820.674 911.771 988.961 Rainfall stress (# of 20-day periods with <40 mm) 0.925 1.116 0.000 0.000 1.000 2.000 3.000 Real retail rice price (MK/kg) 141.977 39.369 96.108 113.751 135.923 168.576 195.098 Real retail diesel price (MK/liter) 194.932 58.674 120.490 133.358 195.267 240.553 253.372 Real Zambia border retail maize price (MK/kg) 38.724 11.169 23.723 31.980 38.405 45.667 50.949 Real SAFEX maize spot price in the previous quarter (MK/kg) 29.867 9.342 19.432 24.006 29.473 35.895 42.022
Source: Own calculations. Note: N=1,173. Real prices are in October 2011 terms.

44
Appendix B: Summary statistics – Zambia Percentiles
Variables Mean Std. dev. 10th
25th
50th
75th
90th
Dependent variable: Real retail maize price (ZMK/kg) 1,686.531 622.657 1,094.402 1,264.013 1,538.381 1,903.208 2,596.529
Explanatory variables: Subsidized fertilizer ('000 MT) 1.108 1.227 0.027 0.225 0.738 1.600 2.627 Growing season rainfall ('00 mm, Nov.-Mar.) 1,002.625 277.228 639.600 837.038 991.950 1,177.500 1,332.025 Rainfall stress (# of 20-day periods with <40 mm) 1.344 1.682 0 0 1.000 2.000 4.000 FRA maize purchases ('000 MT) 2.688 9.457 0 0 0 0.915 5.599 Real retail rice price (ZMK/kg) 8,145.144 1,852.134 6,072.096 6,857.067 7,999.106 9,121.189 10,373.800 Real retail bread price (ZMK/700g loaf) 5,179.944 931.310 4,142.568 4,584.456 5,038.741 5,638.660 6,400.811 Real retail diesel price (ZMK/liter) 9,682.974 2,153.108 7,679.091 8,144.514 9,114.011 10,511.230 13,154.530 Real Malawi border retail maize price (ZMK/kg) 1,784.797 1,249.260 792.936 1,058.940 1,388.091 1,751.680 3,176.874 Real SAFEX maize spot price in the previous quarter (ZMK/kg) 1,368.107 398.366 924.214 1,072.957 1,315.966 1,574.35 1,924.196
Source: Own calculations. Note: N=1,200. Real prices are in April 2012 terms.

45
Appendix C Arellano-Bond tests for zero serial correlation in the first-differenced errors - Malawi
Model specification: Sparse Fully-specified
Order Z p-val. z p-val.
1 -3.824 0.000 -3.677 0.000 2 0.732 0.464 0.822 0.411 3 -0.779 0.436 -0.872 0.383 4 0.908 0.364 1.034 0.301 5 -0.438 0.662 -0.443 0.658
Source: Own calculations. Note: H0: no autocorrelation; H1: serial correlation at order m.

46
Appendix D Arellano-Bond tests for zero serial correlation in the first-differenced errors - Zambia
Model specification: Sparse Fully-specified
Order Z p-val. z p-val.
1 -5.510 0.000 -5.256 0.000 2 1.065 0.287 0.982 0.326 3 -0.906 0.365 -1.065 0.287 4 0.439 0.661 0.475 0.635 5 0.302 0.763 0.526 0.599 6 -1.401 0.161 -1.441 0.150 7 0.401 0.689 0.354 0.724 8 0.617 0.537 0.425 0.671 9 1.493 0.136 1.386 0.166
10 -0.009 0.993 -0.206 0.837
Source: Own calculations. Note: H0: no autocorrelation; H1: serial correlation at order m.