
Van Velzen C.S. - International Legal Architecture ... · Created Date: 3/6/2016 7:05:35 PM
This is an electronic reprint of the original article.This reprint may differ from the original in pagination and typographic detail.
Powered by TCPDF (www.tcpdf.org)
This material is protected by copyright and other intellectual property rights, and duplication or sale of all or part of any of the repository collections is not permitted, except that material may be duplicated by you for your research use or educational purposes in electronic or print form. You must obtain permission for any other use. Electronic or print copies may not be offered, whether for sale or otherwise to anyone who is not an authorised user.
Wevers, T.; Pasham, D. R.; van Velzen, S.; Leloudas, G.; Schulze, S.; Miller-Jones, J. C. A.;Jonker, P. G.; Gromadzki, M.; Kankare, E.; Hodgkin, S. T.; Wyrzykowski, L.; Kostrzewa-Rutkowska, Z.; Moran, S.; Berton, Marco; Maguire, K.; Onori, F.; Mattila, S.; Nicholl, M.Evidence for rapid disc formation and reprocessing in the X-ray bright tidal disruption eventcandidate AT 2018fyk
Published in:Monthly Notices of the Royal Astronomical Society
DOI:10.1093/mnras/stz1976
Published: 01/10/2019
Document VersionPublisher's PDF, also known as Version of record
Published under the following license:CC BY
Please cite the original version:Wevers, T., Pasham, D. R., van Velzen, S., Leloudas, G., Schulze, S., Miller-Jones, J. C. A., Jonker, P. G.,Gromadzki, M., Kankare, E., Hodgkin, S. T., Wyrzykowski, L., Kostrzewa-Rutkowska, Z., Moran, S., Berton, M.,Maguire, K., Onori, F., Mattila, S., & Nicholl, M. (2019). Evidence for rapid disc formation and reprocessing in theX-ray bright tidal disruption event candidate AT 2018fyk. Monthly Notices of the Royal Astronomical Society,488(4), 4816-4830. https://doi.org/10.1093/mnras/stz1976

MNRAS 488, 4816–4830 (2019) doi:10.1093/mnras/stz1976Advance Access publication 2019 July 22
Evidence for rapid disc formation and reprocessing in the X-ray brighttidal disruption event candidate AT 2018fyk
T. Wevers,1‹ D. R. Pasham,2 S. van Velzen,3,4 G. Leloudas,5 S. Schulze ,6
J. C. A. Miller-Jones ,7 P. G. Jonker,8,9 M. Gromadzki,10 E. Kankare,11
S. T. Hodgkin,1 Ł. Wyrzykowski,10 Z. Kostrzewa-Rutkowska,8 S. Moran,11,12
M. Berton,13,14 K. Maguire,15,16 F. Onori ,17 S. Mattila11 and M. Nicholl18,19
Affiliations are listed at the end of the paper
Accepted 2019 July 15. Received 2019 July 15; in original form 2019 March 22
ABSTRACTWe present optical spectroscopic and Swift UVOT/XRT observations of the X-ray andUV/optical bright tidal disruption event (TDE) candidate AT 2018fyk/ASASSN–18ul dis-covered by ASAS–SN. The Swift light curve is atypical for a TDE, entering a plateau after∼40 d of decline from peak. After 80 d the UV/optical light curve breaks again to declinefurther, while the X-ray emission becomes brighter and harder. In addition to broad H, He,and potentially O/Fe lines, narrow emission lines emerge in the optical spectra during theplateau phase. We identify both high-ionization (O III) and low-ionization (Fe II) lines, whichare visible for ∼45 d. We similarly identify Fe II lines in optical spectra of ASASSN–15oi 330d after discovery, indicating that a class of Fe-rich TDEs exists. The spectral similarity betweenAT 2018fyk, narrow-line Seyfert 1 galaxies, and some extreme coronal line emitters suggeststhat TDEs are capable of creating similar physical conditions in the nuclei of galaxies. TheFe II lines can be associated with the formation of a compact accretion disc, as the emergenceof low-ionization emission lines requires optically thick, high-density gas. Taken togetherwith the plateau in X-ray and UV/optical luminosity this indicates that emission from thecentral source is efficiently reprocessed into UV/optical wavelengths. Such a two-componentlight curve is very similar to that seen in the TDE candidate ASASSN–15lh, and is a naturalconsequence of a relativistic orbital pericentre.
Key words: accretion, accretion discs – black hole physics – galaxies: nuclei – ultraviolet:galaxies – X-rays: galaxies.
1 INTRODUCTION
Passing within the tidal radius of the supermassive black hole(SMBH) in the centre of a galaxy can lead to a star’s demise (Hills1975; Rees 1988; Phinney 1989). Such cataclysmic events, calledtidal disruption events (TDEs), resemble panchromatic cosmicfireworks, with bright emission at wavelengths ranging from radio(Alexander et al. 2016; van Velzen et al. 2016a), IR (Jiang et al.2016; van Velzen et al. 2016b; Mattila et al. 2018), optical andUV (Gezari et al. 2008; van Velzen et al. 2011; Arcavi et al. 2014;Holoien et al. 2016b; Wyrzykowski et al. 2017) as well as X-rays(Komossa & Bade 1999; Greiner et al. 2000), and even γ rays(Bloom et al. 2011; Cenko et al. 2012). The duration and brightnessof such flares depends on the complex dynamics of material in
� E-mail: [email protected]
the presence of strong gravitational fields (Guillochon & Ramirez-Ruiz 2015; Metzger & Stone 2016). Wide-field surveys such as theRoentgen Satellite (ROSAT) and the X-ray MultiMirror telescope(XMM; Jansen et al. 2001) in X-rays and the Galaxy and EvolutionExplorer (GALEX), Sloan Digital Sky Survey (SDSS; Stoughtonet al. 2002), the (intermediate) Palomar Transient Factory (PTF;Law et al. 2009) and the All Sky Automated Supernova (ASASSN;Kochanek et al. 2017) surveys in the UV/optical have led to thediscovery and characterization, first in archival data and later in nearreal time, of a few dozen TDEs and even more TDE candidates.
Sparse (or non-existent) temporal data coverage of UV/opticalselected TDEs at X-ray wavelengths (and vice versa) inhibit themultiwavelength characterization and subsequently the detailedstudy of the energetics and dynamics at play. This sparse coverageis the result of a variety of factors, such as the difficulty to performimage subtraction in galactic nuclei, the need for fast and systematicspectroscopic follow-up of nuclear transients, and the limited
C© 2019 The Author(s)Published by Oxford University Press on behalf of The Royal Astronomical Society. This is an Open Access article distributed under the terms of the Creative
Commons Attribution Non-Commercial License (http://creativecommons.org/licenses/by-nc/4.0/), which permits non-commercial re-use, distribution, andreproduction in any medium, provided the original work is properly cited.
Dow
nloaded from https://academ
ic.oup.com/m
nras/article-abstract/488/4/4816/5536954 by Helsinki U
niversity of Technology Library user on 10 March 2020

Fe II emission in an X-ray bright TDE 4817
availability of multiwavelength monitoring. Coordinated efforts inrecent years have led to significant progress in this respect, andmost spectroscopically confirmed TDEs are now observed with theSwiftX-ray observatory, made possible due to its flexible schedulingsystem.
Nevertheless, disentangling the dominant emission mechanismsremains a challenge. The thermal soft X-ray emission is thoughtto originate from a compact accretion disc (e.g. Komossa & Bade1999; Auchettl, Guillochon & Ramirez-Ruiz 2017) while luminoushard X-ray emission finds it origin in a relativistic jet (Bloom et al.2011; Cenko et al. 2012). For the UV/optical emission, however,a clear picture has not yet emerged. Shocks due to stream–streamcollisions (Piran et al. 2015; Shiokawa et al. 2015) or reprocessingof accretion power in either static (Loeb & Ulmer 1997; Guillochon,Manukian & Ramirez-Ruiz 2014; Roth et al. 2016) or outflowingmaterial (e.g. Strubbe & Quataert 2009; Metzger & Stone 2016;Roth & Kasen 2018) have all been proposed to explain the obser-vations. Dai et al. (2018) proposed a model that can explain boththe X-ray and UV/optical observations by suggesting a geometrysimilar to the active galactic nucleus (AGN) unification model (seealso Metzger & Stone 2016), where an optically thick structurein the disc orbital plane or an optically thick super-Eddingtondisc wind obscures the X-ray emission for certain viewing angles.The presence of Bowen fluorescence lines, which require an X-ray powering source, in several TDEs with X-ray non-detections(Leloudas et al. 2019), support this scenario.
In terms of their optical spectra, TDEs typically show broad (10–20 × 103 km s−1) H and/or He lines (Arcavi et al. 2014), althoughit is unclear what determines whether a TDE is H-rich, He-rich,or shows both features. Furthermore, while some TDEs show onlybroad He II emission, the sudden appearance or disappearance ofother lines such as He I has been observed (Holoien et al. 2016a).One feature in particular is observed in many TDEs: the broadHe II line appears to have an asymmetric shoulder in its blue wing.Moreover, it is often observed to be significantly blueshifted (whenfit with a Gaussian line profile), whereas other broad Balmer lines,when present, do not show a similar blueshift. While asymmetricBalmer emission line profiles can be modelled using an ellipticalaccretion disc model (Liu et al. 2017; Cao et al. 2018; Holoien et al.2019) or alternatively a spherically expanding medium (Roth &Kasen 2018; Hung et al. 2019), it does not appear to adequatelyexplain the He II line morphology. Leloudas et al. (2019) suggestinstead that the asymmetry in the line is due to Bowen fluorescencelines, but this cannot explain all cases (e.g. ASASSN–15oi).
Leloudas et al. (2016) were the first to claim that two emissionmechanisms were observed in a TDE candidate, namely in thedouble-peaked light curve of ASASSN–15lh. Although the debateas to the nature of this peculiar transient event is still ongoing(Dong et al. 2016; Godoy-Rivera et al. 2017; Margutti et al. 2017),one explanation focused on the TDE interpretation. Leloudas et al.(2016) claim that the double-peaked light curve can be explainedin terms of the fallback and viscous time-scales around a verymassive (≥108 M�) SMBH. In this case the orbital pericentre of thedisrupted star is relativistic, making disc formation very efficient.This can lead to two distinct maxima in the light curve. In fact,van Velzen et al. (2019b) recently demonstrated that a two-phasestructure appears to be common for all TDEs, but often the second,more shallow phase is observed a few years after peak. Alternatively,Margutti et al. (2017) invoke a model where a sudden change in theejecta opacity due to an underlying source of ionizing radiationleads to a double-humped light curve. We will show that the lightcurve of AT 2018fyk shows a similarly double-humped profile to
ASASSN–15lh. We propose that the relatively massive black hole(∼2 × 10⁷ MBH) for AT2018fyk similarly leads to a relativisticpericentre, speeding up the disc formation process and explainingthe similarities.
In this work we present our observations of a new tidal disruptionevent candidate, AT 2018fyk/ASASSN–18ul, discovered by theAll Sky Automated Survey for SuperNovae (ASAS–SN; Shappeeet al. 2014). We analyse Swift’s UltraViolet/Optical Telescope(UVOT) and X-Ray Telescope (XRT) data together with opticallow-resolution spectroscopic observations covering the first 120 dof its evolution. While both the light curve and spectra show featurespeculiar to known TDEs, in particular a secondary maximum in theUVOT bands and the simultaneous emergence of narrow emissionlines (in addition to broad H and He lines), we show that theseproperties can be explained by the reprocessing of (part of the)X-ray emission into UV/optical photons. While the light curve issimilar to ASASSN–15lh, this is the first time that unambiguousevidence for reprocessing is found in the optical spectra of TDEs.This shows that the dynamics of the disruption can leave clearimprints on the light curves. Furthermore, the spectral signaturesof reprocessing are strongest during the second maximum in thelight curve. This suggests that the X-ray source turned on almostcontemporaneously with the initial UV/optical peak, in line with arapid accretion disc formation scenario.
In Section 2, we present X-ray, UV/optical, and radio obser-vations and describe the data reduction process. We present thespectroscopic and light-curve analysis and results in Section 3, whilediscussing the implications in Section 4. We summarize our mainfindings in Section 5.
2 OBSERVATIONS AND DATA REDUCTION
The transient AT 2018fyk/ASASSN–18ul was discovered near thecentre of the galaxy LCRS B224721.6−450748 (estimated offsetof 0.85 arcsec from the nucleus) by the ASAS–SN survey on 2018September 8 (MJD 58 369.23). The estimated transient brightnesswas g= 17.8 mag, with a non-detection reported (g≥ 17.4 mag) on2018 August 29. A classification spectrum was taken as part of theextended Public ESO Spectroscopic Survey for Transient Objects(ePESSTO; Smartt et al. 2015) on 2018 September 15, revealing ablue featureless continuum superposed with several broad emissionlines, suggesting that the transient was likely a TDE (Wevers et al.2018).
No high spatial resolution archival imaging is available to con-strain the position of the transient with respect to the host galaxy cen-tre of light. Fortunately, Gaia Science Alerts (GSA; Hodgkin et al.2013) also detected the transient (aka Gaia18cyc) at the position (α,δ) = (22:50:16.1, –44:51:53.5) on 2018 October 10, with an esti-mated astrometric accuracy of ∼100 mas.1 The host galaxy is partof the Gaia Data Release 2 (GDR2) catalogue (Gaia Collaboration2016, 2018), and its position is reported as (α, δ) = (22:50:16.093,–44:51:53.499) with formal uncertainties of 1.1 and 1.5 mas in rightascension and declination, respectively (Lindegren et al. 2018). Wenote that the GDR2 astrometric excess noise parameter is 11 mas,which indicates that the formal errors are likely underestimated (asexpected for an extended source, Lindegren et al. 2018). The offsetbetween the transient and host galaxy positions is 15 mas.
1This is due to the fact that GSA uses the initial data treatment astrometricsolution (Fabricius et al. 2016). In the future, the implementation of animproved astrometric solution could improve this to mas precision.
MNRAS 488, 4816–4830 (2019)
Dow
nloaded from https://academ
ic.oup.com/m
nras/article-abstract/488/4/4816/5536954 by Helsinki U
niversity of Technology Library user on 10 March 2020
4818 T. Wevers et al.
Table 1. Host galaxy photometry, both observed (abovethe line) and synthesized in the SwiftUVOT bands (belowthe line). The synthetic Swift photometry is used for hostgalaxy subtraction of the light curves.
Filter AB mag
GALEX NUV 21.91 ± 0.4SkyMapper g 17.07 ± 0.05SkyMapper r 16.51 ± 0.14SkyMapper i 15.98 ± 0.04SkyMapper z 15.71 ± 0.18WISE W1 16.27 ± 0.03WISE W2 16.87 ± 0.03Swift UVW2 22.3Swift UVM2 21.9Swift UVW1 20.8Swift U 18.7Swift B 17.4Swift V 16.5
Kostrzewa-Rutkowska et al. (2018) have shown that the meanoffset in the Gaia data of SDSS galaxies is ∼100 mas, consistentwith the mean offset of SDSS galaxies and their GDR2 counterparts.Additionally, we can try to estimate a potential systematic offsetbetween Gaia transients and their GDR2 counterparts. To quantifysuch an offset, we cross-match the ∼7000 publishedGaia alerts withGDR2 within a search radius of 0.25 arcsec. The offset distribution(angular distance on the sky) is well described by a Rayleighfunction, as expected if the uncertainties in right ascension and dec-lination follow a normal distribution. The distance distribution has amedian of 62 mas and standard deviation of 40 mas. This representsthe potential systematic offset between the coordinate systems and isfully consistent with the 100 mas transient positional uncertainties,indicating that both coordinate systems are properly aligned.
In conclusion, we find an offset between the transient and hostgalaxy position of 15 ± 100 mas, which corresponds to 17 ± 120 pcat the host redshift. This illustrates the power ofGaia for identifyingnuclear transients (see also Kostrzewa-Rutkowska et al. 2018 for adetailed investigation), as it firmly constrains AT 2018fyk to thenucleus of the galaxy.
2.1 Host galaxy spectral energy distribution
We determine the host galaxy redshift from the spectra, which showstrong Ca II H + K absorption lines, and find z = 0.059. Thiscorresponds to a luminosity distance of approximately 275.1 Mpc,assuming a �CDM cosmology with H0 = 67.11 km s−1 Mpc−1,�m = 0.32, and �� = 0.68 (Planck Collaboration XVI 2014). Nonarrow emission lines from the host galaxy are evident, indicatingthat the event occurred in a quiescent galaxy. We observe H α andH β in absorption, indicating no ongoing star formation. The lack ofsignificant H δ absorption suggests that the galaxy does not belongto the E + A galaxy class (Dressler & Gunn 1983) in which TDEshave been known to be overrepresented (Arcavi et al. 2014; French,Arcavi & Zabludoff 2016). We identify strong absorption linesat λ4303 (G band), λ5172 (Mg I b, which indicates an old stellarpopulation), λ5284 (Fe II), and the Na I D doublet at 5890 + 5895Å. Finally, the AllWISE colour W1–W2 = 0.04 (Cutri & et al. 2014)further indicates that the black hole is most likely inactive (e.g. Sternet al. 2012; Wu et al. 2012).
To measure the galaxy mass and star formation rate (SFR), wemodel the spectral energy distribution (SED; see Table 1) with
the software package LEPHARE version 2.2 (Arnouts et al. 1999;Ilbert et al. 2006).2 This also allows us to synthesize the hostgalaxy brightness in the Swift bands, which we use to subtract thehost galaxy contribution from the TDE light curves. We generate3.9 × 106 templates based on the Bruzual & Charlot (2003)stellar population synthesis models with the Chabrier initial massfunction (IMF; Chabrier 2003). The star formation history (SFH)is approximated by a declining exponential function of the forme(− t/τ ), where t is the age of the stellar population and τ the e-folding time-scale of the SFH (varied in nine steps between 0.1 and30 Gyr). These templates are attenuated with the Calzetti attenuationcurve (varied in 22 steps from E(B− V) = 0 to 1 mag; Calzetti et al.2000). LEPHARE accounts for the contribution from the diffuse gas(e.g. H II regions) following the relation between SFR and the linefluxes presented in Kennicutt (1998).
From the best-fitting template spectrum, we derive a host galaxystellar mass of log(M�/M�) = 10.2+0.5
−0.2, and a SFR and intrinsic E(B−V) consistent with 0. Using an empirical bulge-to-total (B/T) ratio(Stone et al. 2018) of 0.47 (very similar to the ratio of the PSF to Pet-rosian g-band flux of 0.57) for this galaxy mass, we find an SMBHmass of 2+3
−1.2 × 10⁷ M� using the MBH–Mbulge relation (Haring &Rix 2004). We synthesize photometry in the Swift UVOT filters,which can be found in Table 1, to perform the host subtraction.
2.2 Swift X-ray and UV/optical observations
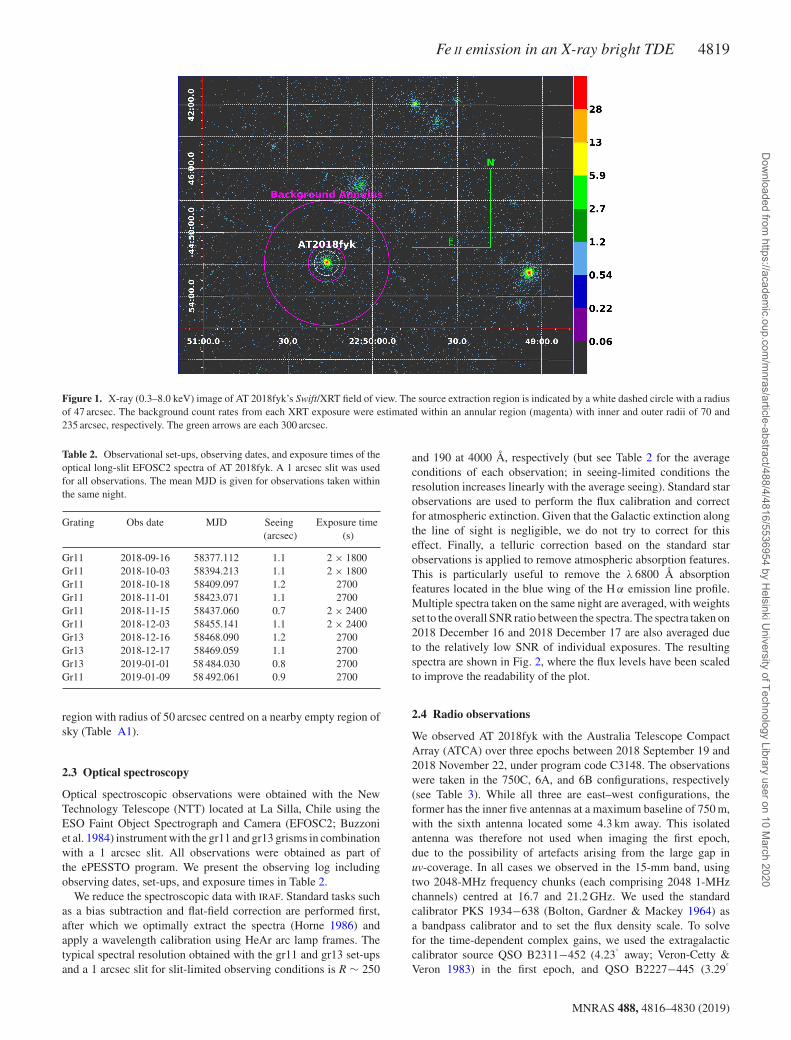
Swift’s (Gehrels et al. 2004) UVOT (Roming et al. 2005) and theXRT (Burrows et al. 2005) started monitoring AT 2018fyk on MJD58 383.7, approximately 8 d after the classification spectrum wastaken and 14 d after the reported discovery (Brimacombe et al.2018) by the ASAS–SN survey. Between 2018 September 22 and2019 January 8, 52 monitoring observations were made with anaverage observing cadence varying between 2 and 4 d. Swift couldnot observe the source after 2019 January 8 due to Sun pointingconstraints. We removed two observations (obsIDs: 00010883004and 00010883038) from further analysis as they had limited XRTexposure (∼10 s) and lacked UVOT data. Fig. 1 shows an X-rayimage of AT 2018fyk’s field of view as observed with Swift/XRT.
The XRT observations were all performed in photon counting(PC) mode, and were reduced using the latest version of the SwiftXRTPIPELINE provided as part of HEASOFT 6.25 analysis package.Source counts were extracted using a circular aperture with a radiusof 47 arcsec, and corrected for the background contribution usingan annulus with an inner and outer radius of 70 and 250 arcsec,respectively. Count rates are converted to an unabsorbed 0.3 – 8 keVflux using a conversion factor of 4.4 × 10⁻¹¹, derived from theaverage count rate and flux in the stacked X-ray observations, andassuming a Galactic nH column of 0.012 × 1020 cm−2.
We note that no source is detected in archival ROSAT observa-tions down to a limit of ∼5 × 10⁻⁴ cts s−1 (Boller et al. 2016). Usingthe webPIMMS tool,3 this corresponds to a flux limit of 5 × 10⁻¹⁵
erg cm−2 s−1 (0.3–8 keV, assuming a power-law model with n = 2typical for AGN), which translates to an upper limit for the hostX-ray luminosity of ∼5 × 1040 erg s−1 (a blackbody model withkT = 0.1 keV results in an upper limit of 1.5 × 1040 erg s−1).
We used the uvotsource task to construct UVOT light curves,using a 5 arcsec aperture in all filters to estimate the sourcebrightness. Background levels were estimated by using a circular
2http://www.cfht.hawaii.edu/∼arnouts/LEPHARE/lephare.html3https://heasarc.gsfc.nasa.gov/cgi-bin/Tools/w3pimms/w3pimms.pl
MNRAS 488, 4816–4830 (2019)
Dow
nloaded from https://academ
ic.oup.com/m
nras/article-abstract/488/4/4816/5536954 by Helsinki U
niversity of Technology Library user on 10 March 2020
Fe II emission in an X-ray bright TDE 4819
Figure 1. X-ray (0.3–8.0 keV) image of AT 2018fyk’s Swift/XRT field of view. The source extraction region is indicated by a white dashed circle with a radiusof 47 arcsec. The background count rates from each XRT exposure were estimated within an annular region (magenta) with inner and outer radii of 70 and235 arcsec, respectively. The green arrows are each 300 arcsec.
Table 2. Observational set-ups, observing dates, and exposure times of theoptical long-slit EFOSC2 spectra of AT 2018fyk. A 1 arcsec slit was usedfor all observations. The mean MJD is given for observations taken withinthe same night.
Grating Obs date MJD Seeing Exposure time(arcsec) (s)
Gr11 2018-09-16 58377.112 1.1 2 × 1800Gr11 2018-10-03 58394.213 1.1 2 × 1800Gr11 2018-10-18 58409.097 1.2 2700Gr11 2018-11-01 58423.071 1.1 2700Gr11 2018-11-15 58437.060 0.7 2 × 2400Gr11 2018-12-03 58455.141 1.1 2 × 2400Gr13 2018-12-16 58468.090 1.2 2700Gr13 2018-12-17 58469.059 1.1 2700Gr13 2019-01-01 58 484.030 0.8 2700Gr11 2019-01-09 58 492.061 0.9 2700
region with radius of 50 arcsec centred on a nearby empty region ofsky (Table A1).
2.3 Optical spectroscopy
Optical spectroscopic observations were obtained with the NewTechnology Telescope (NTT) located at La Silla, Chile using theESO Faint Object Spectrograph and Camera (EFOSC2; Buzzoniet al. 1984) instrument with the gr11 and gr13 grisms in combinationwith a 1 arcsec slit. All observations were obtained as part ofthe ePESSTO program. We present the observing log includingobserving dates, set-ups, and exposure times in Table 2.
We reduce the spectroscopic data with IRAF. Standard tasks suchas a bias subtraction and flat-field correction are performed first,after which we optimally extract the spectra (Horne 1986) andapply a wavelength calibration using HeAr arc lamp frames. Thetypical spectral resolution obtained with the gr11 and gr13 set-upsand a 1 arcsec slit for slit-limited observing conditions is R ∼ 250
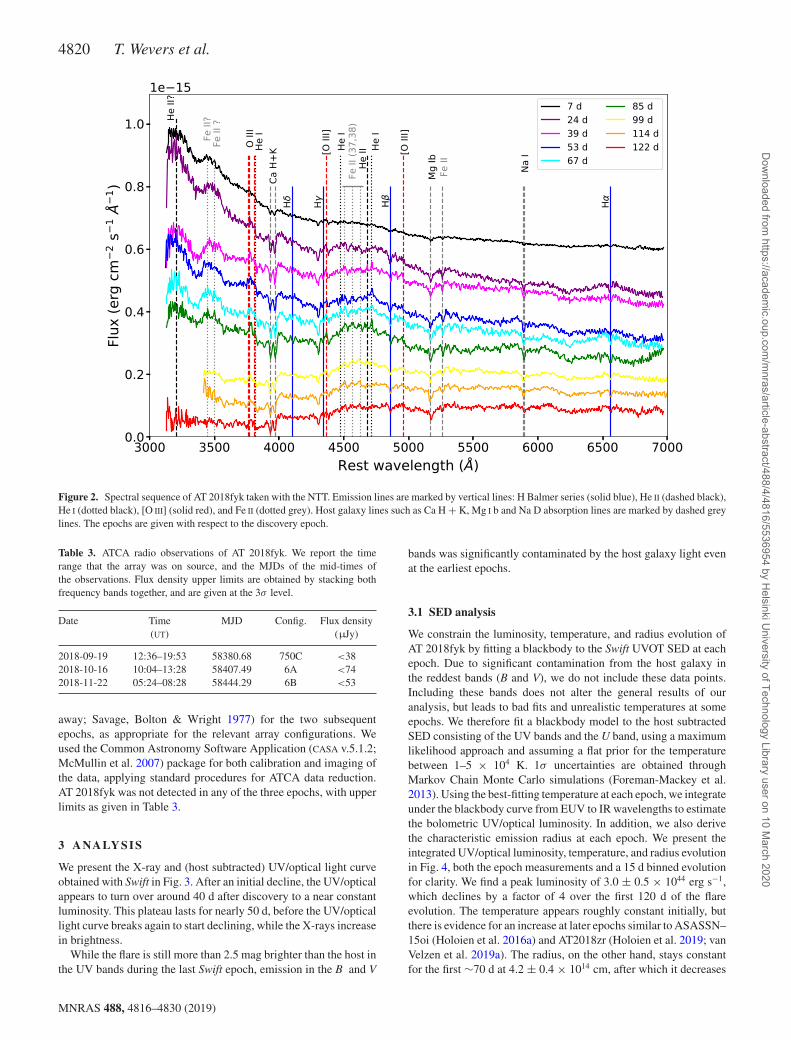
and 190 at 4000 Å, respectively (but see Table 2 for the averageconditions of each observation; in seeing-limited conditions theresolution increases linearly with the average seeing). Standard starobservations are used to perform the flux calibration and correctfor atmospheric extinction. Given that the Galactic extinction alongthe line of sight is negligible, we do not try to correct for thiseffect. Finally, a telluric correction based on the standard starobservations is applied to remove atmospheric absorption features.This is particularly useful to remove the λ 6800 Å absorptionfeatures located in the blue wing of the H α emission line profile.Multiple spectra taken on the same night are averaged, with weightsset to the overall SNR ratio between the spectra. The spectra taken on2018 December 16 and 2018 December 17 are also averaged dueto the relatively low SNR of individual exposures. The resultingspectra are shown in Fig. 2, where the flux levels have been scaledto improve the readability of the plot.
2.4 Radio observations
We observed AT 2018fyk with the Australia Telescope CompactArray (ATCA) over three epochs between 2018 September 19 and2018 November 22, under program code C3148. The observationswere taken in the 750C, 6A, and 6B configurations, respectively(see Table 3). While all three are east–west configurations, theformer has the inner five antennas at a maximum baseline of 750 m,with the sixth antenna located some 4.3 km away. This isolatedantenna was therefore not used when imaging the first epoch,due to the possibility of artefacts arising from the large gap inuv-coverage. In all cases we observed in the 15-mm band, usingtwo 2048-MHz frequency chunks (each comprising 2048 1-MHzchannels) centred at 16.7 and 21.2 GHz. We used the standardcalibrator PKS 1934−638 (Bolton, Gardner & Mackey 1964) asa bandpass calibrator and to set the flux density scale. To solvefor the time-dependent complex gains, we used the extragalacticcalibrator source QSO B2311−452 (4.23
◦away; Veron-Cetty &
Veron 1983) in the first epoch, and QSO B2227−445 (3.29◦
MNRAS 488, 4816–4830 (2019)
Dow
nloaded from https://academ
ic.oup.com/m
nras/article-abstract/488/4/4816/5536954 by Helsinki U
niversity of Technology Library user on 10 March 2020
4820 T. Wevers et al.
Figure 2. Spectral sequence of AT 2018fyk taken with the NTT. Emission lines are marked by vertical lines: H Balmer series (solid blue), He II (dashed black),He I (dotted black), [O III] (solid red), and Fe II (dotted grey). Host galaxy lines such as Ca H + K, Mg I b and Na D absorption lines are marked by dashed greylines. The epochs are given with respect to the discovery epoch.
Table 3. ATCA radio observations of AT 2018fyk. We report the timerange that the array was on source, and the MJDs of the mid-times ofthe observations. Flux density upper limits are obtained by stacking bothfrequency bands together, and are given at the 3σ level.
Date Time MJD Config. Flux density(UT) (μJy)
2018-09-19 12:36–19:53 58380.68 750C <382018-10-16 10:04–13:28 58407.49 6A <742018-11-22 05:24–08:28 58444.29 6B <53
away; Savage, Bolton & Wright 1977) for the two subsequentepochs, as appropriate for the relevant array configurations. Weused the Common Astronomy Software Application (CASA v.5.1.2;McMullin et al. 2007) package for both calibration and imaging ofthe data, applying standard procedures for ATCA data reduction.AT 2018fyk was not detected in any of the three epochs, with upperlimits as given in Table 3.
3 ANALYSIS
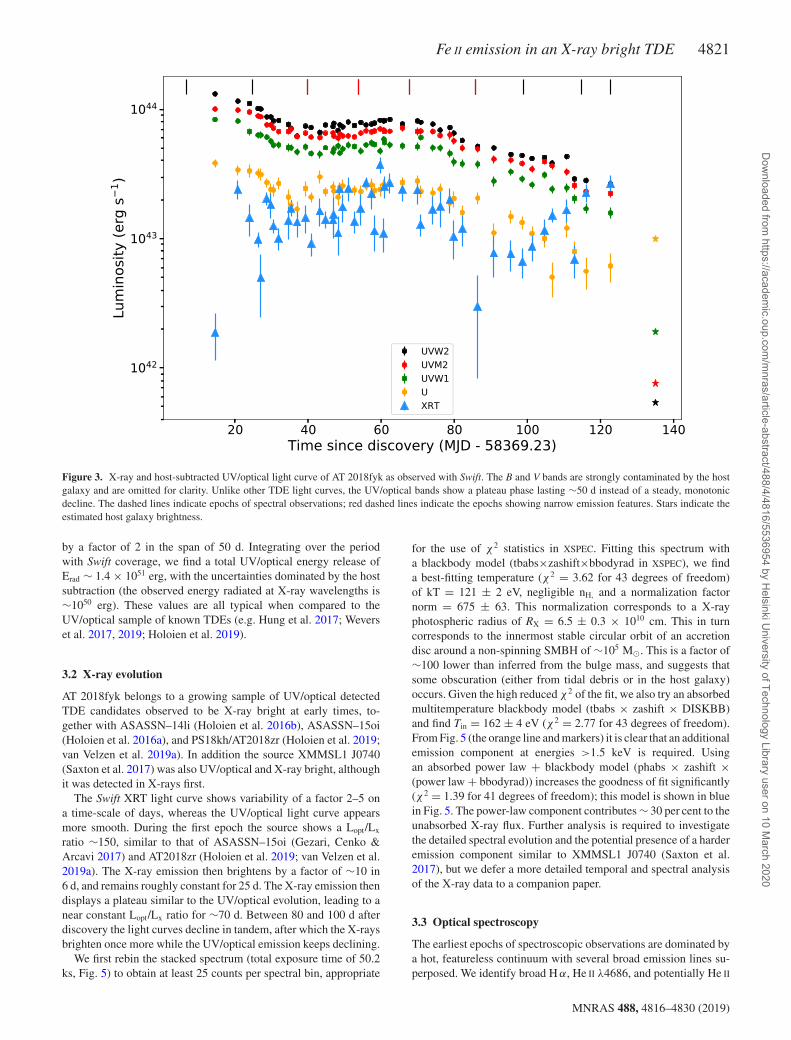
We present the X-ray and (host subtracted) UV/optical light curveobtained with Swift in Fig. 3. After an initial decline, the UV/opticalappears to turn over around 40 d after discovery to a near constantluminosity. This plateau lasts for nearly 50 d, before the UV/opticallight curve breaks again to start declining, while the X-rays increasein brightness.
While the flare is still more than 2.5 mag brighter than the host inthe UV bands during the last Swift epoch, emission in the B and V
bands was significantly contaminated by the host galaxy light evenat the earliest epochs.
3.1 SED analysis
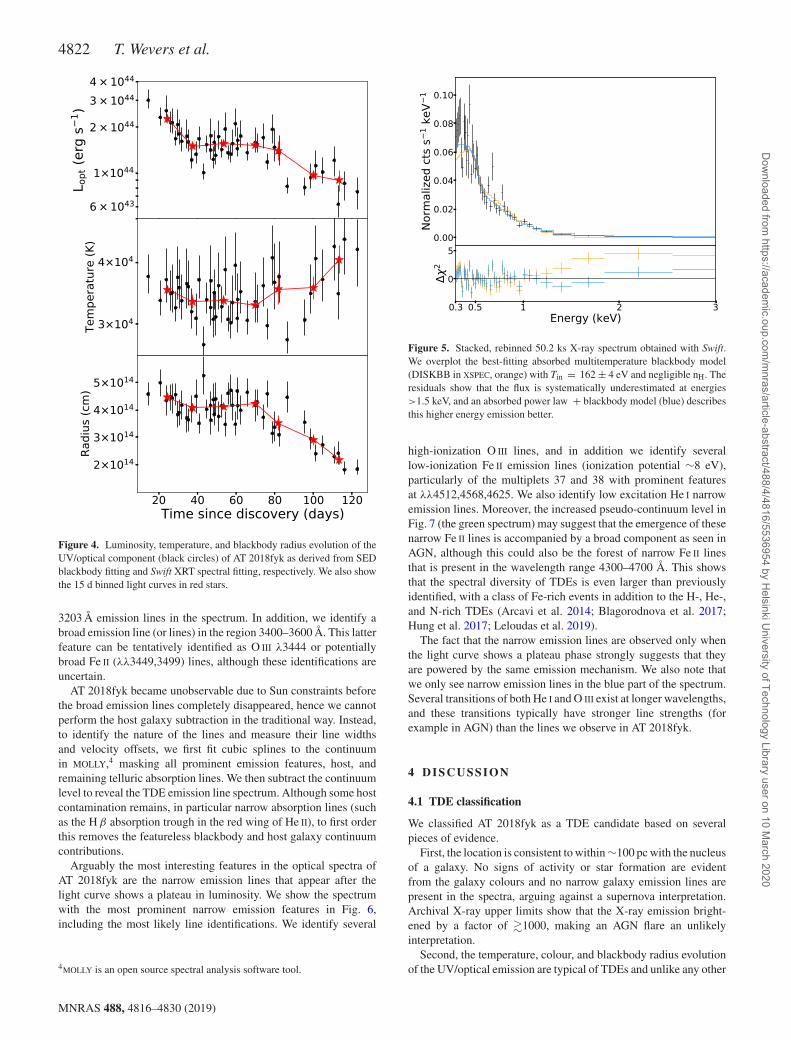
We constrain the luminosity, temperature, and radius evolution ofAT 2018fyk by fitting a blackbody to the Swift UVOT SED at eachepoch. Due to significant contamination from the host galaxy inthe reddest bands (B and V), we do not include these data points.Including these bands does not alter the general results of ouranalysis, but leads to bad fits and unrealistic temperatures at someepochs. We therefore fit a blackbody model to the host subtractedSED consisting of the UV bands and the U band, using a maximumlikelihood approach and assuming a flat prior for the temperaturebetween 1–5 × 10⁴ K. 1σ uncertainties are obtained throughMarkov Chain Monte Carlo simulations (Foreman-Mackey et al.2013). Using the best-fitting temperature at each epoch, we integrateunder the blackbody curve from EUV to IR wavelengths to estimatethe bolometric UV/optical luminosity. In addition, we also derivethe characteristic emission radius at each epoch. We present theintegrated UV/optical luminosity, temperature, and radius evolutionin Fig. 4, both the epoch measurements and a 15 d binned evolutionfor clarity. We find a peak luminosity of 3.0 ± 0.5 × 1044 erg s−1,which declines by a factor of 4 over the first 120 d of the flareevolution. The temperature appears roughly constant initially, butthere is evidence for an increase at later epochs similar to ASASSN–15oi (Holoien et al. 2016a) and AT2018zr (Holoien et al. 2019; vanVelzen et al. 2019a). The radius, on the other hand, stays constantfor the first ∼70 d at 4.2 ± 0.4 × 1014 cm, after which it decreases
MNRAS 488, 4816–4830 (2019)
Dow
nloaded from https://academ
ic.oup.com/m
nras/article-abstract/488/4/4816/5536954 by Helsinki U
niversity of Technology Library user on 10 March 2020
Fe II emission in an X-ray bright TDE 4821
Figure 3. X-ray and host-subtracted UV/optical light curve of AT 2018fyk as observed with Swift. The B and V bands are strongly contaminated by the hostgalaxy and are omitted for clarity. Unlike other TDE light curves, the UV/optical bands show a plateau phase lasting ∼50 d instead of a steady, monotonicdecline. The dashed lines indicate epochs of spectral observations; red dashed lines indicate the epochs showing narrow emission features. Stars indicate theestimated host galaxy brightness.
by a factor of 2 in the span of 50 d. Integrating over the periodwith Swift coverage, we find a total UV/optical energy release ofErad ∼ 1.4 × 1051 erg, with the uncertainties dominated by the hostsubtraction (the observed energy radiated at X-ray wavelengths is∼1050 erg). These values are all typical when compared to theUV/optical sample of known TDEs (e.g. Hung et al. 2017; Weverset al. 2017, 2019; Holoien et al. 2019).
3.2 X-ray evolution
AT 2018fyk belongs to a growing sample of UV/optical detectedTDE candidates observed to be X-ray bright at early times, to-gether with ASASSN–14li (Holoien et al. 2016b), ASASSN–15oi(Holoien et al. 2016a), and PS18kh/AT2018zr (Holoien et al. 2019;van Velzen et al. 2019a). In addition the source XMMSL1 J0740(Saxton et al. 2017) was also UV/optical and X-ray bright, althoughit was detected in X-rays first.
The Swift XRT light curve shows variability of a factor 2–5 ona time-scale of days, whereas the UV/optical light curve appearsmore smooth. During the first epoch the source shows a Lopt/Lx
ratio ∼150, similar to that of ASASSN–15oi (Gezari, Cenko &Arcavi 2017) and AT2018zr (Holoien et al. 2019; van Velzen et al.2019a). The X-ray emission then brightens by a factor of ∼10 in6 d, and remains roughly constant for 25 d. The X-ray emission thendisplays a plateau similar to the UV/optical evolution, leading to anear constant Lopt/Lx ratio for ∼70 d. Between 80 and 100 d afterdiscovery the light curves decline in tandem, after which the X-raysbrighten once more while the UV/optical emission keeps declining.
We first rebin the stacked spectrum (total exposure time of 50.2ks, Fig. 5) to obtain at least 25 counts per spectral bin, appropriate
for the use of χ2 statistics in XSPEC. Fitting this spectrum witha blackbody model (tbabs×zashift×bbodyrad in XSPEC), we finda best-fitting temperature (χ2 = 3.62 for 43 degrees of freedom)of kT = 121 ± 2 eV, negligible nH, and a normalization factornorm = 675 ± 63. This normalization corresponds to a X-rayphotospheric radius of RX = 6.5 ± 0.3 × 1010 cm. This in turncorresponds to the innermost stable circular orbit of an accretiondisc around a non-spinning SMBH of ∼105 M�. This is a factor of∼100 lower than inferred from the bulge mass, and suggests thatsome obscuration (either from tidal debris or in the host galaxy)occurs. Given the high reduced χ2 of the fit, we also try an absorbedmultitemperature blackbody model (tbabs × zashift × DISKBB)and find Tin = 162 ± 4 eV (χ2 = 2.77 for 43 degrees of freedom).From Fig. 5 (the orange line and markers) it is clear that an additionalemission component at energies >1.5 keV is required. Usingan absorbed power law + blackbody model (phabs × zashift ×(power law + bbodyrad)) increases the goodness of fit significantly(χ 2 = 1.39 for 41 degrees of freedom); this model is shown in bluein Fig. 5. The power-law component contributes ∼ 30 per cent to theunabsorbed X-ray flux. Further analysis is required to investigatethe detailed spectral evolution and the potential presence of a harderemission component similar to XMMSL1 J0740 (Saxton et al.2017), but we defer a more detailed temporal and spectral analysisof the X-ray data to a companion paper.
3.3 Optical spectroscopy
The earliest epochs of spectroscopic observations are dominated bya hot, featureless continuum with several broad emission lines su-perposed. We identify broad H α, He II λ4686, and potentially He II
MNRAS 488, 4816–4830 (2019)
Dow
nloaded from https://academ
ic.oup.com/m
nras/article-abstract/488/4/4816/5536954 by Helsinki U
niversity of Technology Library user on 10 March 2020
4822 T. Wevers et al.
Figure 4. Luminosity, temperature, and blackbody radius evolution of theUV/optical component (black circles) of AT 2018fyk as derived from SEDblackbody fitting and Swift XRT spectral fitting, respectively. We also showthe 15 d binned light curves in red stars.
3203 Å emission lines in the spectrum. In addition, we identify abroad emission line (or lines) in the region 3400–3600 Å. This latterfeature can be tentatively identified as O III λ3444 or potentiallybroad Fe II (λλ3449,3499) lines, although these identifications areuncertain.
AT 2018fyk became unobservable due to Sun constraints beforethe broad emission lines completely disappeared, hence we cannotperform the host galaxy subtraction in the traditional way. Instead,to identify the nature of the lines and measure their line widthsand velocity offsets, we first fit cubic splines to the continuumin MOLLY,4 masking all prominent emission features, host, andremaining telluric absorption lines. We then subtract the continuumlevel to reveal the TDE emission line spectrum. Although some hostcontamination remains, in particular narrow absorption lines (suchas the H β absorption trough in the red wing of He II), to first orderthis removes the featureless blackbody and host galaxy continuumcontributions.
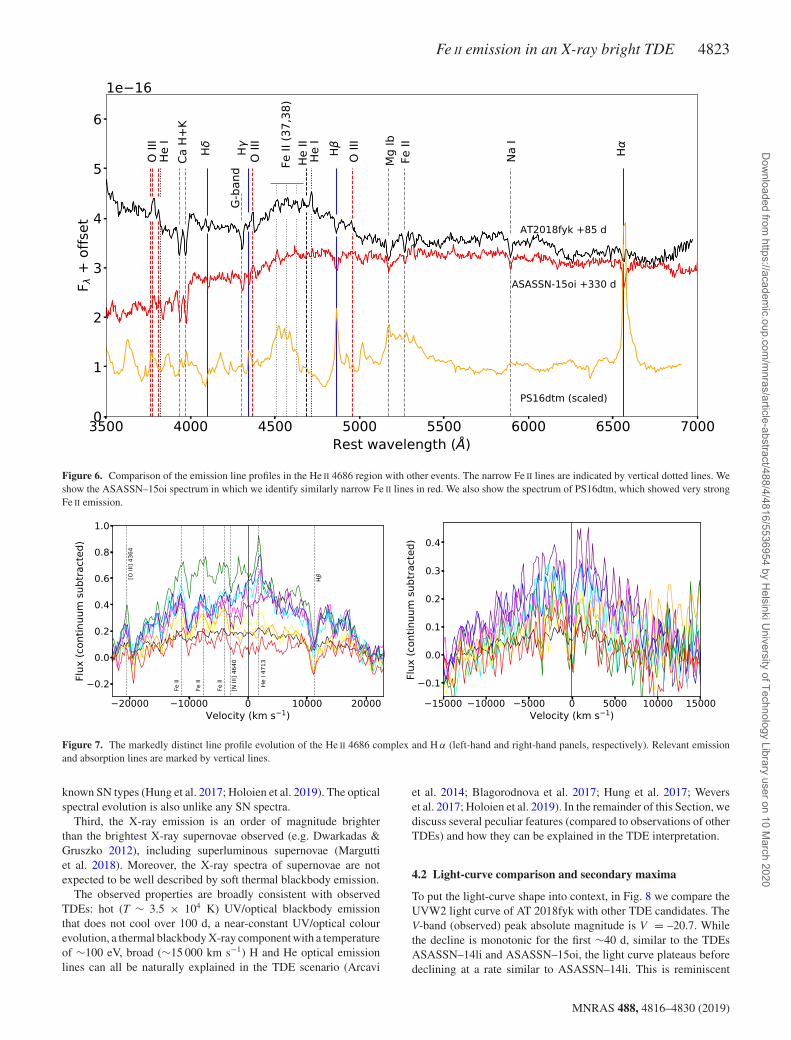
Arguably the most interesting features in the optical spectra ofAT 2018fyk are the narrow emission lines that appear after thelight curve shows a plateau in luminosity. We show the spectrumwith the most prominent narrow emission features in Fig. 6,including the most likely line identifications. We identify several
4MOLLY is an open source spectral analysis software tool.
Figure 5. Stacked, rebinned 50.2 ks X-ray spectrum obtained with Swift.We overplot the best-fitting absorbed multitemperature blackbody model(DISKBB in XSPEC, orange) with Tin = 162 ± 4 eV and negligible nH. Theresiduals show that the flux is systematically underestimated at energies>1.5 keV, and an absorbed power law + blackbody model (blue) describesthis higher energy emission better.
high-ionization O III lines, and in addition we identify severallow-ionization Fe II emission lines (ionization potential ∼8 eV),particularly of the multiplets 37 and 38 with prominent featuresat λλ4512,4568,4625. We also identify low excitation He I narrowemission lines. Moreover, the increased pseudo-continuum level inFig. 7 (the green spectrum) may suggest that the emergence of thesenarrow Fe II lines is accompanied by a broad component as seen inAGN, although this could also be the forest of narrow Fe II linesthat is present in the wavelength range 4300–4700 Å. This showsthat the spectral diversity of TDEs is even larger than previouslyidentified, with a class of Fe-rich events in addition to the H-, He-,and N-rich TDEs (Arcavi et al. 2014; Blagorodnova et al. 2017;Hung et al. 2017; Leloudas et al. 2019).
The fact that the narrow emission lines are observed only whenthe light curve shows a plateau phase strongly suggests that theyare powered by the same emission mechanism. We also note thatwe only see narrow emission lines in the blue part of the spectrum.Several transitions of both He I and O III exist at longer wavelengths,and these transitions typically have stronger line strengths (forexample in AGN) than the lines we observe in AT 2018fyk.
4 DISCUSSION
4.1 TDE classification
We classified AT 2018fyk as a TDE candidate based on severalpieces of evidence.
First, the location is consistent to within ∼100 pc with the nucleusof a galaxy. No signs of activity or star formation are evidentfrom the galaxy colours and no narrow galaxy emission lines arepresent in the spectra, arguing against a supernova interpretation.Archival X-ray upper limits show that the X-ray emission bright-ened by a factor of �1000, making an AGN flare an unlikelyinterpretation.
Second, the temperature, colour, and blackbody radius evolutionof the UV/optical emission are typical of TDEs and unlike any other
MNRAS 488, 4816–4830 (2019)
Dow
nloaded from https://academ
ic.oup.com/m
nras/article-abstract/488/4/4816/5536954 by Helsinki U
niversity of Technology Library user on 10 March 2020
Fe II emission in an X-ray bright TDE 4823
Figure 6. Comparison of the emission line profiles in the He II 4686 region with other events. The narrow Fe II lines are indicated by vertical dotted lines. Weshow the ASASSN–15oi spectrum in which we identify similarly narrow Fe II lines in red. We also show the spectrum of PS16dtm, which showed very strongFe II emission.
Figure 7. The markedly distinct line profile evolution of the He II 4686 complex and H α (left-hand and right-hand panels, respectively). Relevant emissionand absorption lines are marked by vertical lines.
known SN types (Hung et al. 2017; Holoien et al. 2019). The opticalspectral evolution is also unlike any SN spectra.
Third, the X-ray emission is an order of magnitude brighterthan the brightest X-ray supernovae observed (e.g. Dwarkadas &Gruszko 2012), including superluminous supernovae (Marguttiet al. 2018). Moreover, the X-ray spectra of supernovae are notexpected to be well described by soft thermal blackbody emission.
The observed properties are broadly consistent with observedTDEs: hot (T ∼ 3.5 × 10⁴ K) UV/optical blackbody emissionthat does not cool over 100 d, a near-constant UV/optical colourevolution, a thermal blackbody X-ray component with a temperatureof ∼100 eV, broad (∼15 000 km s−1) H and He optical emissionlines can all be naturally explained in the TDE scenario (Arcavi
et al. 2014; Blagorodnova et al. 2017; Hung et al. 2017; Weverset al. 2017; Holoien et al. 2019). In the remainder of this Section, wediscuss several peculiar features (compared to observations of otherTDEs) and how they can be explained in the TDE interpretation.
4.2 Light-curve comparison and secondary maxima
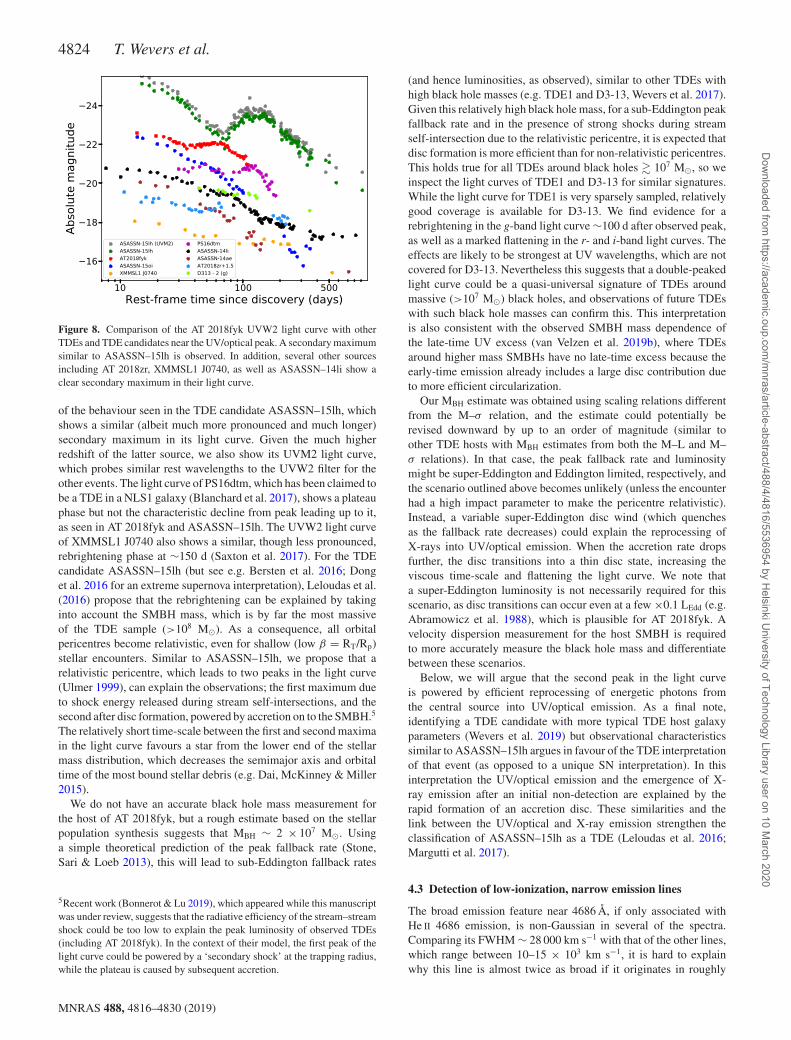
To put the light-curve shape into context, in Fig. 8 we compare theUVW2 light curve of AT 2018fyk with other TDE candidates. TheV-band (observed) peak absolute magnitude is V = –20.7. Whilethe decline is monotonic for the first ∼40 d, similar to the TDEsASASSN–14li and ASASSN–15oi, the light curve plateaus beforedeclining at a rate similar to ASASSN–14li. This is reminiscent
MNRAS 488, 4816–4830 (2019)
Dow
nloaded from https://academ
ic.oup.com/m
nras/article-abstract/488/4/4816/5536954 by Helsinki U
niversity of Technology Library user on 10 March 2020
4824 T. Wevers et al.
Figure 8. Comparison of the AT 2018fyk UVW2 light curve with otherTDEs and TDE candidates near the UV/optical peak. A secondary maximumsimilar to ASASSN–15lh is observed. In addition, several other sourcesincluding AT 2018zr, XMMSL1 J0740, as well as ASASSN–14li show aclear secondary maximum in their light curve.
of the behaviour seen in the TDE candidate ASASSN–15lh, whichshows a similar (albeit much more pronounced and much longer)secondary maximum in its light curve. Given the much higherredshift of the latter source, we also show its UVM2 light curve,which probes similar rest wavelengths to the UVW2 filter for theother events. The light curve of PS16dtm, which has been claimed tobe a TDE in a NLS1 galaxy (Blanchard et al. 2017), shows a plateauphase but not the characteristic decline from peak leading up to it,as seen in AT 2018fyk and ASASSN–15lh. The UVW2 light curveof XMMSL1 J0740 also shows a similar, though less pronounced,rebrightening phase at ∼150 d (Saxton et al. 2017). For the TDEcandidate ASASSN–15lh (but see e.g. Bersten et al. 2016; Donget al. 2016 for an extreme supernova interpretation), Leloudas et al.(2016) propose that the rebrightening can be explained by takinginto account the SMBH mass, which is by far the most massiveof the TDE sample (>108 M�). As a consequence, all orbitalpericentres become relativistic, even for shallow (low β = RT/Rp)stellar encounters. Similar to ASASSN–15lh, we propose that arelativistic pericentre, which leads to two peaks in the light curve(Ulmer 1999), can explain the observations; the first maximum dueto shock energy released during stream self-intersections, and thesecond after disc formation, powered by accretion on to the SMBH.5
The relatively short time-scale between the first and second maximain the light curve favours a star from the lower end of the stellarmass distribution, which decreases the semimajor axis and orbitaltime of the most bound stellar debris (e.g. Dai, McKinney & Miller2015).
We do not have an accurate black hole mass measurement forthe host of AT 2018fyk, but a rough estimate based on the stellarpopulation synthesis suggests that MBH ∼ 2 × 10⁷ M�. Usinga simple theoretical prediction of the peak fallback rate (Stone,Sari & Loeb 2013), this will lead to sub-Eddington fallback rates
5Recent work (Bonnerot & Lu 2019), which appeared while this manuscriptwas under review, suggests that the radiative efficiency of the stream–streamshock could be too low to explain the peak luminosity of observed TDEs(including AT 2018fyk). In the context of their model, the first peak of thelight curve could be powered by a ‘secondary shock’ at the trapping radius,while the plateau is caused by subsequent accretion.
(and hence luminosities, as observed), similar to other TDEs withhigh black hole masses (e.g. TDE1 and D3-13, Wevers et al. 2017).Given this relatively high black hole mass, for a sub-Eddington peakfallback rate and in the presence of strong shocks during streamself-intersection due to the relativistic pericentre, it is expected thatdisc formation is more efficient than for non-relativistic pericentres.This holds true for all TDEs around black holes � 107 M�, so weinspect the light curves of TDE1 and D3-13 for similar signatures.While the light curve for TDE1 is very sparsely sampled, relativelygood coverage is available for D3-13. We find evidence for arebrightening in the g-band light curve ∼100 d after observed peak,as well as a marked flattening in the r- and i-band light curves. Theeffects are likely to be strongest at UV wavelengths, which are notcovered for D3-13. Nevertheless this suggests that a double-peakedlight curve could be a quasi-universal signature of TDEs aroundmassive (>107 M�) black holes, and observations of future TDEswith such black hole masses can confirm this. This interpretationis also consistent with the observed SMBH mass dependence ofthe late-time UV excess (van Velzen et al. 2019b), where TDEsaround higher mass SMBHs have no late-time excess because theearly-time emission already includes a large disc contribution dueto more efficient circularization.
Our MBH estimate was obtained using scaling relations differentfrom the M–σ relation, and the estimate could potentially berevised downward by up to an order of magnitude (similar toother TDE hosts with MBH estimates from both the M–L and M–σ relations). In that case, the peak fallback rate and luminositymight be super-Eddington and Eddington limited, respectively, andthe scenario outlined above becomes unlikely (unless the encounterhad a high impact parameter to make the pericentre relativistic).Instead, a variable super-Eddington disc wind (which quenchesas the fallback rate decreases) could explain the reprocessing ofX-rays into UV/optical emission. When the accretion rate dropsfurther, the disc transitions into a thin disc state, increasing theviscous time-scale and flattening the light curve. We note thata super-Eddington luminosity is not necessarily required for thisscenario, as disc transitions can occur even at a few ×0.1 LEdd (e.g.Abramowicz et al. 1988), which is plausible for AT 2018fyk. Avelocity dispersion measurement for the host SMBH is requiredto more accurately measure the black hole mass and differentiatebetween these scenarios.
Below, we will argue that the second peak in the light curveis powered by efficient reprocessing of energetic photons fromthe central source into UV/optical emission. As a final note,identifying a TDE candidate with more typical TDE host galaxyparameters (Wevers et al. 2019) but observational characteristicssimilar to ASASSN–15lh argues in favour of the TDE interpretationof that event (as opposed to a unique SN interpretation). In thisinterpretation the UV/optical emission and the emergence of X-ray emission after an initial non-detection are explained by therapid formation of an accretion disc. These similarities and thelink between the UV/optical and X-ray emission strengthen theclassification of ASASSN–15lh as a TDE (Leloudas et al. 2016;Margutti et al. 2017).
4.3 Detection of low-ionization, narrow emission lines
The broad emission feature near 4686 Å, if only associated withHe II 4686 emission, is non-Gaussian in several of the spectra.Comparing its FWHM ∼ 28 000 km s−1 with that of the other lines,which range between 10–15 × 103 km s−1, it is hard to explainwhy this line is almost twice as broad if it originates in roughly
MNRAS 488, 4816–4830 (2019)
Dow
nloaded from https://academ
ic.oup.com/m
nras/article-abstract/488/4/4816/5536954 by Helsinki U
niversity of Technology Library user on 10 March 2020
Fe II emission in an X-ray bright TDE 4825
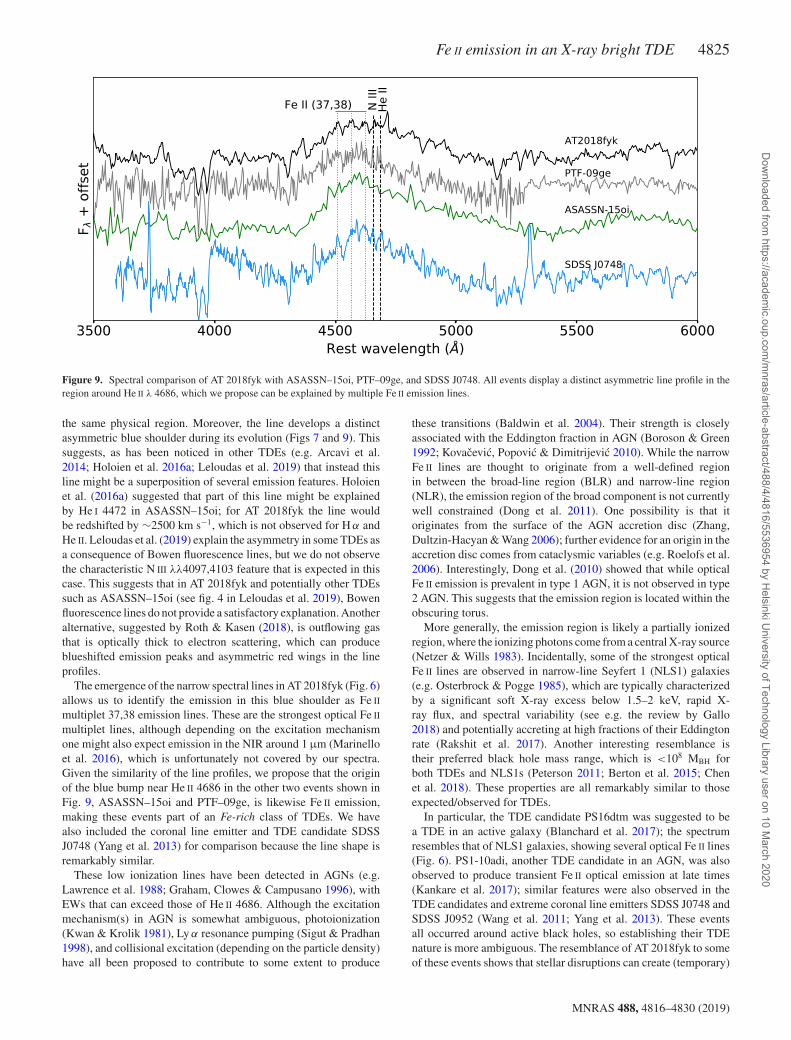
Figure 9. Spectral comparison of AT 2018fyk with ASASSN–15oi, PTF–09ge, and SDSS J0748. All events display a distinct asymmetric line profile in theregion around He II λ 4686, which we propose can be explained by multiple Fe II emission lines.
the same physical region. Moreover, the line develops a distinctasymmetric blue shoulder during its evolution (Figs 7 and 9). Thissuggests, as has been noticed in other TDEs (e.g. Arcavi et al.2014; Holoien et al. 2016a; Leloudas et al. 2019) that instead thisline might be a superposition of several emission features. Holoienet al. (2016a) suggested that part of this line might be explainedby He I 4472 in ASASSN–15oi; for AT 2018fyk the line wouldbe redshifted by ∼2500 km s−1, which is not observed for H α andHe II. Leloudas et al. (2019) explain the asymmetry in some TDEs asa consequence of Bowen fluorescence lines, but we do not observethe characteristic N III λλ4097,4103 feature that is expected in thiscase. This suggests that in AT 2018fyk and potentially other TDEssuch as ASASSN–15oi (see fig. 4 in Leloudas et al. 2019), Bowenfluorescence lines do not provide a satisfactory explanation. Anotheralternative, suggested by Roth & Kasen (2018), is outflowing gasthat is optically thick to electron scattering, which can produceblueshifted emission peaks and asymmetric red wings in the lineprofiles.
The emergence of the narrow spectral lines in AT 2018fyk (Fig. 6)allows us to identify the emission in this blue shoulder as Fe II
multiplet 37,38 emission lines. These are the strongest optical Fe II
multiplet lines, although depending on the excitation mechanismone might also expect emission in the NIR around 1μm (Marinelloet al. 2016), which is unfortunately not covered by our spectra.Given the similarity of the line profiles, we propose that the originof the blue bump near He II 4686 in the other two events shown inFig. 9, ASASSN–15oi and PTF–09ge, is likewise Fe II emission,making these events part of an Fe-rich class of TDEs. We havealso included the coronal line emitter and TDE candidate SDSSJ0748 (Yang et al. 2013) for comparison because the line shape isremarkably similar.
These low ionization lines have been detected in AGNs (e.g.Lawrence et al. 1988; Graham, Clowes & Campusano 1996), withEWs that can exceed those of He II 4686. Although the excitationmechanism(s) in AGN is somewhat ambiguous, photoionization(Kwan & Krolik 1981), Ly α resonance pumping (Sigut & Pradhan1998), and collisional excitation (depending on the particle density)have all been proposed to contribute to some extent to produce
these transitions (Baldwin et al. 2004). Their strength is closelyassociated with the Eddington fraction in AGN (Boroson & Green1992; Kovacevic, Popovic & Dimitrijevic 2010). While the narrowFe II lines are thought to originate from a well-defined regionin between the broad-line region (BLR) and narrow-line region(NLR), the emission region of the broad component is not currentlywell constrained (Dong et al. 2011). One possibility is that itoriginates from the surface of the AGN accretion disc (Zhang,Dultzin-Hacyan & Wang 2006); further evidence for an origin in theaccretion disc comes from cataclysmic variables (e.g. Roelofs et al.2006). Interestingly, Dong et al. (2010) showed that while opticalFe II emission is prevalent in type 1 AGN, it is not observed in type2 AGN. This suggests that the emission region is located within theobscuring torus.
More generally, the emission region is likely a partially ionizedregion, where the ionizing photons come from a central X-ray source(Netzer & Wills 1983). Incidentally, some of the strongest opticalFe II lines are observed in narrow-line Seyfert 1 (NLS1) galaxies(e.g. Osterbrock & Pogge 1985), which are typically characterizedby a significant soft X-ray excess below 1.5–2 keV, rapid X-ray flux, and spectral variability (see e.g. the review by Gallo2018) and potentially accreting at high fractions of their Eddingtonrate (Rakshit et al. 2017). Another interesting resemblance istheir preferred black hole mass range, which is <108 MBH forboth TDEs and NLS1s (Peterson 2011; Berton et al. 2015; Chenet al. 2018). These properties are all remarkably similar to thoseexpected/observed for TDEs.
In particular, the TDE candidate PS16dtm was suggested to bea TDE in an active galaxy (Blanchard et al. 2017); the spectrumresembles that of NLS1 galaxies, showing several optical Fe II lines(Fig. 6). PS1-10adi, another TDE candidate in an AGN, was alsoobserved to produce transient Fe II optical emission at late times(Kankare et al. 2017); similar features were also observed in theTDE candidates and extreme coronal line emitters SDSS J0748 andSDSS J0952 (Wang et al. 2011; Yang et al. 2013). These eventsall occurred around active black holes, so establishing their TDEnature is more ambiguous. The resemblance of AT 2018fyk to someof these events shows that stellar disruptions can create (temporary)
MNRAS 488, 4816–4830 (2019)
Dow
nloaded from https://academ
ic.oup.com/m
nras/article-abstract/488/4/4816/5536954 by Helsinki U
niversity of Technology Library user on 10 March 2020
4826 T. Wevers et al.
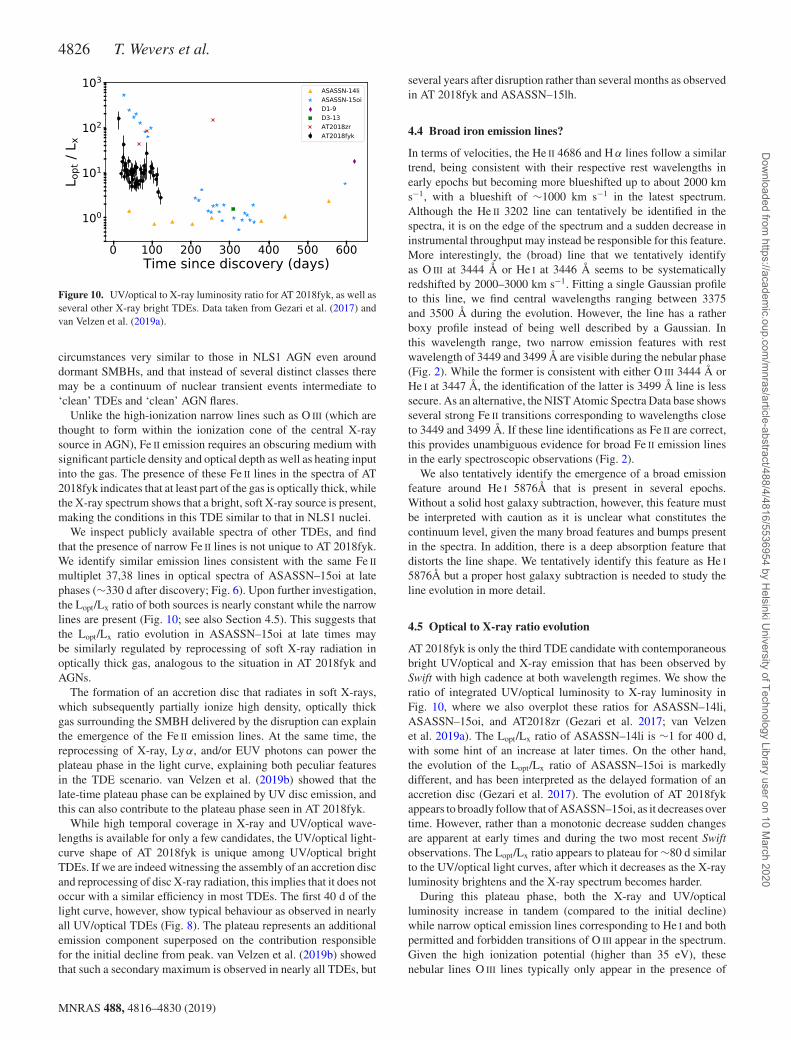
Figure 10. UV/optical to X-ray luminosity ratio for AT 2018fyk, as well asseveral other X-ray bright TDEs. Data taken from Gezari et al. (2017) andvan Velzen et al. (2019a).
circumstances very similar to those in NLS1 AGN even arounddormant SMBHs, and that instead of several distinct classes theremay be a continuum of nuclear transient events intermediate to‘clean’ TDEs and ‘clean’ AGN flares.
Unlike the high-ionization narrow lines such as O III (which arethought to form within the ionization cone of the central X-raysource in AGN), Fe II emission requires an obscuring medium withsignificant particle density and optical depth as well as heating inputinto the gas. The presence of these Fe II lines in the spectra of AT2018fyk indicates that at least part of the gas is optically thick, whilethe X-ray spectrum shows that a bright, soft X-ray source is present,making the conditions in this TDE similar to that in NLS1 nuclei.
We inspect publicly available spectra of other TDEs, and findthat the presence of narrow Fe II lines is not unique to AT 2018fyk.We identify similar emission lines consistent with the same Fe II
multiplet 37,38 lines in optical spectra of ASASSN–15oi at latephases (∼330 d after discovery; Fig. 6). Upon further investigation,the Lopt/Lx ratio of both sources is nearly constant while the narrowlines are present (Fig. 10; see also Section 4.5). This suggests thatthe Lopt/Lx ratio evolution in ASASSN–15oi at late times maybe similarly regulated by reprocessing of soft X-ray radiation inoptically thick gas, analogous to the situation in AT 2018fyk andAGNs.
The formation of an accretion disc that radiates in soft X-rays,which subsequently partially ionize high density, optically thickgas surrounding the SMBH delivered by the disruption can explainthe emergence of the Fe II emission lines. At the same time, thereprocessing of X-ray, Ly α, and/or EUV photons can power theplateau phase in the light curve, explaining both peculiar featuresin the TDE scenario. van Velzen et al. (2019b) showed that thelate-time plateau phase can be explained by UV disc emission, andthis can also contribute to the plateau phase seen in AT 2018fyk.
While high temporal coverage in X-ray and UV/optical wave-lengths is available for only a few candidates, the UV/optical light-curve shape of AT 2018fyk is unique among UV/optical brightTDEs. If we are indeed witnessing the assembly of an accretion discand reprocessing of disc X-ray radiation, this implies that it does notoccur with a similar efficiency in most TDEs. The first 40 d of thelight curve, however, show typical behaviour as observed in nearlyall UV/optical TDEs (Fig. 8). The plateau represents an additionalemission component superposed on the contribution responsiblefor the initial decline from peak. van Velzen et al. (2019b) showedthat such a secondary maximum is observed in nearly all TDEs, but
several years after disruption rather than several months as observedin AT 2018fyk and ASASSN–15lh.
4.4 Broad iron emission lines?
In terms of velocities, the He II 4686 and H α lines follow a similartrend, being consistent with their respective rest wavelengths inearly epochs but becoming more blueshifted up to about 2000 kms−1, with a blueshift of ∼1000 km s−1 in the latest spectrum.Although the He II 3202 line can tentatively be identified in thespectra, it is on the edge of the spectrum and a sudden decrease ininstrumental throughput may instead be responsible for this feature.More interestingly, the (broad) line that we tentatively identifyas O III at 3444 Å or He I at 3446 Å seems to be systematicallyredshifted by 2000–3000 km s−1. Fitting a single Gaussian profileto this line, we find central wavelengths ranging between 3375and 3500 Å during the evolution. However, the line has a ratherboxy profile instead of being well described by a Gaussian. Inthis wavelength range, two narrow emission features with restwavelength of 3449 and 3499 Å are visible during the nebular phase(Fig. 2). While the former is consistent with either O III 3444 Å orHe I at 3447 Å, the identification of the latter is 3499 Å line is lesssecure. As an alternative, the NIST Atomic Spectra Data base showsseveral strong Fe II transitions corresponding to wavelengths closeto 3449 and 3499 Å. If these line identifications as Fe II are correct,this provides unambiguous evidence for broad Fe II emission linesin the early spectroscopic observations (Fig. 2).
We also tentatively identify the emergence of a broad emissionfeature around He I 5876Å that is present in several epochs.Without a solid host galaxy subtraction, however, this feature mustbe interpreted with caution as it is unclear what constitutes thecontinuum level, given the many broad features and bumps presentin the spectra. In addition, there is a deep absorption feature thatdistorts the line shape. We tentatively identify this feature as He I
5876Å but a proper host galaxy subtraction is needed to study theline evolution in more detail.
4.5 Optical to X-ray ratio evolution
AT 2018fyk is only the third TDE candidate with contemporaneousbright UV/optical and X-ray emission that has been observed bySwift with high cadence at both wavelength regimes. We show theratio of integrated UV/optical luminosity to X-ray luminosity inFig. 10, where we also overplot these ratios for ASASSN–14li,ASASSN–15oi, and AT2018zr (Gezari et al. 2017; van Velzenet al. 2019a). The Lopt/Lx ratio of ASASSN–14li is ∼1 for 400 d,with some hint of an increase at later times. On the other hand,the evolution of the Lopt/Lx ratio of ASASSN–15oi is markedlydifferent, and has been interpreted as the delayed formation of anaccretion disc (Gezari et al. 2017). The evolution of AT 2018fykappears to broadly follow that of ASASSN–15oi, as it decreases overtime. However, rather than a monotonic decrease sudden changesare apparent at early times and during the two most recent Swiftobservations. The Lopt/Lx ratio appears to plateau for ∼80 d similarto the UV/optical light curves, after which it decreases as the X-rayluminosity brightens and the X-ray spectrum becomes harder.
During this plateau phase, both the X-ray and UV/opticalluminosity increase in tandem (compared to the initial decline)while narrow optical emission lines corresponding to He I and bothpermitted and forbidden transitions of O III appear in the spectrum.Given the high ionization potential (higher than 35 eV), thesenebular lines O III lines typically only appear in the presence of
MNRAS 488, 4816–4830 (2019)
Dow
nloaded from https://academ
ic.oup.com/m
nras/article-abstract/488/4/4816/5536954 by Helsinki U
niversity of Technology Library user on 10 March 2020
Fe II emission in an X-ray bright TDE 4827
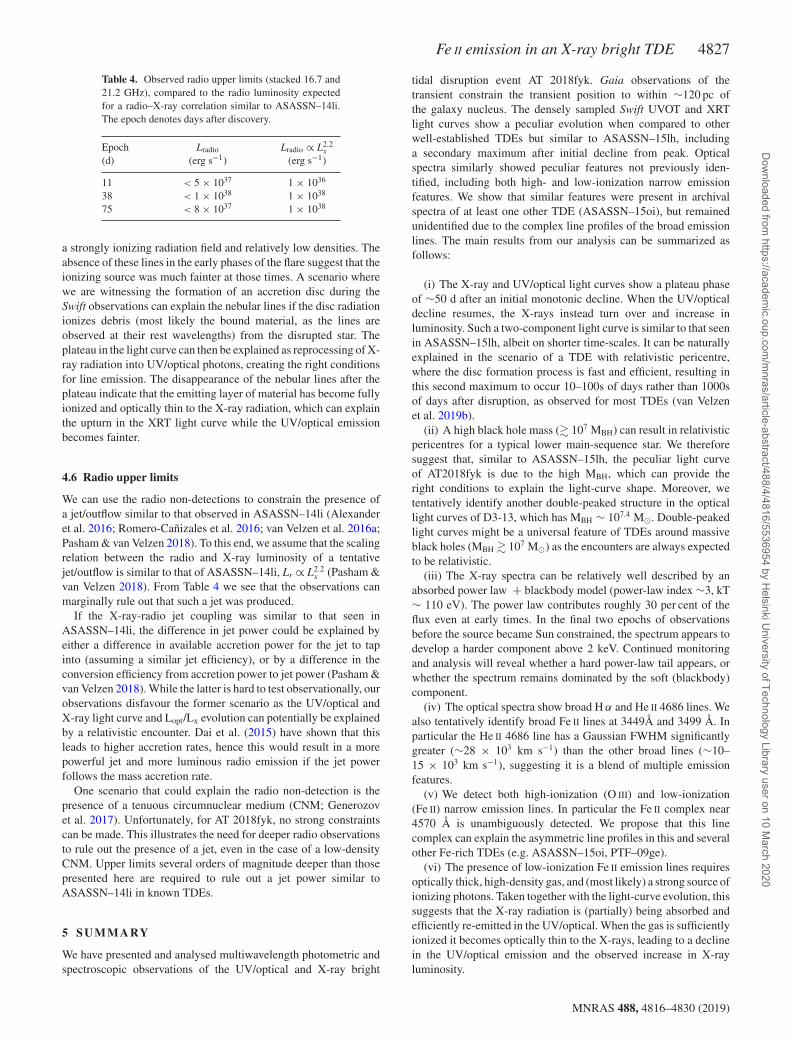
Table 4. Observed radio upper limits (stacked 16.7 and21.2 GHz), compared to the radio luminosity expectedfor a radio–X-ray correlation similar to ASASSN–14li.The epoch denotes days after discovery.
Epoch Lradio Lradio ∝ L2.2x
(d) (erg s−1) (erg s−1)
11 < 5 × 1037 1 × 1036
38 < 1 × 1038 1 × 1038
75 < 8 × 1037 1 × 1038
a strongly ionizing radiation field and relatively low densities. Theabsence of these lines in the early phases of the flare suggest that theionizing source was much fainter at those times. A scenario wherewe are witnessing the formation of an accretion disc during theSwift observations can explain the nebular lines if the disc radiationionizes debris (most likely the bound material, as the lines areobserved at their rest wavelengths) from the disrupted star. Theplateau in the light curve can then be explained as reprocessing of X-ray radiation into UV/optical photons, creating the right conditionsfor line emission. The disappearance of the nebular lines after theplateau indicate that the emitting layer of material has become fullyionized and optically thin to the X-ray radiation, which can explainthe upturn in the XRT light curve while the UV/optical emissionbecomes fainter.
4.6 Radio upper limits
We can use the radio non-detections to constrain the presence ofa jet/outflow similar to that observed in ASASSN–14li (Alexanderet al. 2016; Romero-Canizales et al. 2016; van Velzen et al. 2016a;Pasham & van Velzen 2018). To this end, we assume that the scalingrelation between the radio and X-ray luminosity of a tentativejet/outflow is similar to that of ASASSN–14li, Lr ∝ L2.2
x (Pasham &van Velzen 2018). From Table 4 we see that the observations canmarginally rule out that such a jet was produced.
If the X-ray-radio jet coupling was similar to that seen inASASSN–14li, the difference in jet power could be explained byeither a difference in available accretion power for the jet to tapinto (assuming a similar jet efficiency), or by a difference in theconversion efficiency from accretion power to jet power (Pasham &van Velzen 2018). While the latter is hard to test observationally, ourobservations disfavour the former scenario as the UV/optical andX-ray light curve and Lopt/Lx evolution can potentially be explainedby a relativistic encounter. Dai et al. (2015) have shown that thisleads to higher accretion rates, hence this would result in a morepowerful jet and more luminous radio emission if the jet powerfollows the mass accretion rate.
One scenario that could explain the radio non-detection is thepresence of a tenuous circumnuclear medium (CNM; Generozovet al. 2017). Unfortunately, for AT 2018fyk, no strong constraintscan be made. This illustrates the need for deeper radio observationsto rule out the presence of a jet, even in the case of a low-densityCNM. Upper limits several orders of magnitude deeper than thosepresented here are required to rule out a jet power similar toASASSN–14li in known TDEs.
5 SUMMARY
We have presented and analysed multiwavelength photometric andspectroscopic observations of the UV/optical and X-ray bright
tidal disruption event AT 2018fyk. Gaia observations of thetransient constrain the transient position to within ∼120 pc ofthe galaxy nucleus. The densely sampled Swift UVOT and XRTlight curves show a peculiar evolution when compared to otherwell-established TDEs but similar to ASASSN–15lh, includinga secondary maximum after initial decline from peak. Opticalspectra similarly showed peculiar features not previously iden-tified, including both high- and low-ionization narrow emissionfeatures. We show that similar features were present in archivalspectra of at least one other TDE (ASASSN–15oi), but remainedunidentified due to the complex line profiles of the broad emissionlines. The main results from our analysis can be summarized asfollows:
(i) The X-ray and UV/optical light curves show a plateau phaseof ∼50 d after an initial monotonic decline. When the UV/opticaldecline resumes, the X-rays instead turn over and increase inluminosity. Such a two-component light curve is similar to that seenin ASASSN–15lh, albeit on shorter time-scales. It can be naturallyexplained in the scenario of a TDE with relativistic pericentre,where the disc formation process is fast and efficient, resulting inthis second maximum to occur 10–100s of days rather than 1000sof days after disruption, as observed for most TDEs (van Velzenet al. 2019b).
(ii) A high black hole mass (� 107 MBH) can result in relativisticpericentres for a typical lower main-sequence star. We thereforesuggest that, similar to ASASSN–15lh, the peculiar light curveof AT2018fyk is due to the high MBH, which can provide theright conditions to explain the light-curve shape. Moreover, wetentatively identify another double-peaked structure in the opticallight curves of D3-13, which has MBH ∼ 107.4 M�. Double-peakedlight curves might be a universal feature of TDEs around massiveblack holes (MBH � 107 M�) as the encounters are always expectedto be relativistic.
(iii) The X-ray spectra can be relatively well described by anabsorbed power law + blackbody model (power-law index ∼3, kT∼ 110 eV). The power law contributes roughly 30 per cent of theflux even at early times. In the final two epochs of observationsbefore the source became Sun constrained, the spectrum appears todevelop a harder component above 2 keV. Continued monitoringand analysis will reveal whether a hard power-law tail appears, orwhether the spectrum remains dominated by the soft (blackbody)component.
(iv) The optical spectra show broad H α and He II 4686 lines. Wealso tentatively identify broad Fe II lines at 3449Å and 3499 Å. Inparticular the He II 4686 line has a Gaussian FWHM significantlygreater (∼28 × 103 km s−1) than the other broad lines (∼10–15 × 103 km s−1), suggesting it is a blend of multiple emissionfeatures.
(v) We detect both high-ionization (O III) and low-ionization(Fe II) narrow emission lines. In particular the Fe II complex near4570 Å is unambiguously detected. We propose that this linecomplex can explain the asymmetric line profiles in this and severalother Fe-rich TDEs (e.g. ASASSN–15oi, PTF–09ge).
(vi) The presence of low-ionization Fe II emission lines requiresoptically thick, high-density gas, and (most likely) a strong source ofionizing photons. Taken together with the light-curve evolution, thissuggests that the X-ray radiation is (partially) being absorbed andefficiently re-emitted in the UV/optical. When the gas is sufficientlyionized it becomes optically thin to the X-rays, leading to a declinein the UV/optical emission and the observed increase in X-rayluminosity.
MNRAS 488, 4816–4830 (2019)
Dow
nloaded from https://academ
ic.oup.com/m
nras/article-abstract/488/4/4816/5536954 by Helsinki U
niversity of Technology Library user on 10 March 2020

4828 T. Wevers et al.
(vii) The spectral features are remarkably similar to those seen inNLS1 AGN, as well as very similar to other TDE candidates in AGNsuch as the extreme coronal line emitters. This suggests a connectionbetween all these events around AGN and AT2018fyk, whichoccurred in a quiescent SMBH. This strengthens the argumentsin favour of a TDE interpretation for PS16dtm, the Kankare et al.(2017) events and the coronal line emitters.
We have illustrated that a wealth of information can be extractedfrom contemporaneous X-ray and UV/optical observations madepossible by Swift and spectroscopic monitoring, and shown the im-portance of dense temporal coverage to map the detailed behaviourof both the X-ray and UV/optical emission in TDEs. Increasingthe sample of TDEs with such coverage will almost certainlylead to the discovery of new behaviour in these enigmatic cosmiclighthouses, which in turn will reveal the detailed physics that occursin these extreme environments. The detection of narrow emissionlines highlights the need for medium/high-resolution spectroscopicfollow-up of TDEs to uncover the full diversity of their opticalspectral appearance.
ACKNOWLEDGEMENTS
We are grateful for constructive remarks and suggestions fromthe referee. We also thank Richard Saxton for sharing the Swiftdata of XMMSL1 J0740, and Suvi Gezari for sharing some ofthe data in Fig. 10. TW is funded in part by European ResearchCouncil grant 320360 and by European Commission grant 730980.GL was supported by a research grant (19054) from VILLUMFONDEN. JCAM-J is the recipient of an Australian Research Coun-cil Future Fellowship (FT 140101082). PGJ and ZKR acknowl-edge support from European Research Council Consolidator Grant647208. MG is supported by the Polish NCN MAESTRO grant2014/14/A/ST9/00121. KM acknowledges support from STFC(ST/M005348/1) and from H2020 through an ERC Starting Grant(758638). MN acknowledges support from a Royal AstronomicalSociety Research Fellowship. FO acknowledges support of theH2020 Hemera program, grant agreement No 730970. Based onobservations collected at the European Organisation for Astronom-ical Research in the Southern Hemisphere under ESO programme199.D-0143. We acknowledge the use of public data from theSwift data archive. The Australia Telescope Compact Array is partof the Australia Telescope National Facility which is funded bythe Australian Government for operation as a National Facilitymanaged by CSIRO. This work has made use of data from theEuropean Space Agency (ESA) mission Gaia (https://www.cosmos.esa.int/gaia), processed by the Gaia Data Processing and AnalysisConsortium (DPAC, https://www.cosmos.esa.int/web/gaia/dpac/consortium). Funding for the DPAC has been provided by nationalinstitutions, in particular the institutions participating in the GaiaMultilateral Agreement. We also acknowledge the Gaia PhotometricScience Alerts Team (http://gsaweb.ast.cam.ac.uk/alerts).
REFERENCES
Abramowicz M. A., Czerny B., Lasota J. P., Szuszkiewicz E., 1988, ApJ,332, 646
Alexander K. D., Berger E., Guillochon J., Zauderer B. A., Williams P. K.G., 2016, ApJ, 819, L25
Arcavi I. et al., 2014, ApJ, 793, 38Arnouts S., Cristiani S., Moscardini L., Matarrese S., Lucchin F., Fontana
A., Giallongo E., 1999, MNRAS, 310, 540Auchettl K., Guillochon J., Ramirez-Ruiz E., 2017, ApJ, 838, 149
Baldwin J. A., Ferland G. J., Korista K. T., Hamann F., LaCluyze A., 2004,ApJ, 615, 610
Bersten M. C., Benvenuto O. G., Orellana M., Nomoto K., 2016, ApJ, 817,L8
Berton M. et al., 2015, A&A, 578, A28Blagorodnova N. et al., 2017, ApJ, 844, 46Blanchard P. K. et al., 2017, ApJ, 843, 106Bloom J. S. et al., 2011, Science, 333, 203Boller T., Freyberg M. J., Trumper J., Haberl F., Voges W., Nandra K., 2016,
A&A, 588, A103Bolton J. G., Gardner F. F., Mackey M. B., 1964, Aust. J. Phys., 17, 340Bonnerot C., Lu W., 2019, preprint (arXiv:1906.05865)Boroson T. A., Green R. F., 1992, ApJS, 80, 109Brimacombe J. et al., 2018, Astron. Telegram, 12031Bruzual G., Charlot S., 2003, MNRAS, 344, 1000Burrows D. N. et al., 2005, Space Sci. Rev., 120, 165Buzzoni B. et al., 1984, Messenger, 38, 9Calzetti D., Armus L., Bohlin R. C., Kinney A. L., Koornneef J., Storchi-
Bergmann T., 2000, ApJ, 533, 682Cao R., Liu F. K., Zhou Z. Q., Komossa S., Ho L. C., 2018, MNRAS, 480,
2929Cenko S. B. et al., 2012, ApJ, 753, 77Chabrier G., 2003, PASP, 115, 763Chen S. et al., 2018, A&A, 615, A167Cutri R. M. et al., 2014, VizieR Online Data Catalog, p. II/328Dai L., McKinney J. C., Miller M. C., 2015, ApJ, 812, L39Dai L., McKinney J. C., Roth N., Ramirez-Ruiz E., Miller M. C., 2018, ApJ,
859, L20Dong X.-B., Ho L. C., Wang J.-G., Wang T.-G., Wang H., Fan X., Zhou H.,
2010, ApJ, 721, L143Dong X.-B., Wang J.-G., Ho L. C., Wang T.-G., Fan X., Wang H., Zhou H.,
Yuan W., 2011, ApJ, 736, 86Dong S. et al., 2016, Science, 351, 257Dressler A., Gunn J. E., 1983, ApJ, 270, 7Dwarkadas V. V., Gruszko J., 2012, MNRAS, 419, 1515Fabricius C. et al., 2016, A&A, 595, A3Foreman-Mackey D., Hogg D. W., Lang D., Goodman J., 2013, PASP, 125,
306French K. D., Arcavi I., Zabludoff A., 2016, ApJ, 818, L21Gaia Collaboration, 2016, A&A, 595, A1Gaia Collaboration, 2018, A&A, 616, A1Gallo L., 2018, Revisiting Narrow-line Seyfert 1 Galaxies and their Place
in the Universe. Padova Botanical Garden, Italy, p. 34Gehrels N. et al., 2004, ApJ, 611, 1005Generozov A., Mimica P., Metzger B. D., Stone N. C., Giannios D., Aloy
M. A., 2017, MNRAS, 464, 2481Gezari S. et al., 2008, ApJ, 676, 944Gezari S., Cenko S. B., Arcavi I., 2017, ApJ, 851, L47Godoy-Rivera D. et al., 2017, MNRAS, 466, 1428Graham M. J., Clowes R. G., Campusano L. E., 1996, MNRAS, 279, 1349Greiner J., Schwarz R., Zharikov S., Orio M., 2000, A&A, 362, L25Guillochon J., Ramirez-Ruiz E., 2015, ApJ, 809, 166Guillochon J., Manukian H., Ramirez-Ruiz E., 2014, ApJ, 783, 23Haring N., Rix H.-W., 2004, ApJ, 604, L89Hills J. G., 1975, Nature, 254, 295Hodgkin S. T., Wyrzykowski L., Blagorodnova N., Koposov S., 2013, Phil.
Trans. R. Soc. A, 371, 20120239Holoien T. W. S. et al., 2016a, MNRAS, 455, 2918Holoien T. W. S. et al., 2016b, MNRAS, 463, 3813Holoien T. W. S. et al., 2019, ApJ, 880, 120Horne K., 1986, PASP, 98, 609Hung T. et al., 2017, ApJ, 842, 29Hung T. et al., 2019, ApJ, 879, 119Ilbert O. et al., 2006, A&A, 457, 841Jansen F. et al., 2001, A&A, 365, L1Jiang N., Dou L., Wang T., Yang C., Lyu J., Zhou H., 2016, ApJ, 828, L14Kankare E. et al., 2017, Nat. Astron., 1, 865Kennicutt R. C., Jr., 1998, ARA&A, 36, 189
MNRAS 488, 4816–4830 (2019)
Dow
nloaded from https://academ
ic.oup.com/m
nras/article-abstract/488/4/4816/5536954 by Helsinki U
niversity of Technology Library user on 10 March 2020
Fe II emission in an X-ray bright TDE 4829
Kochanek C. S. et al., 2017, PASP, 129, 104502Komossa S., Bade N., 1999, A&A, 343, 775Kostrzewa-Rutkowska Z. et al., 2018, MNRAS, 481, 307Kovacevic J., Popovic L. C., Dimitrijevic M. S., 2010, ApJS, 189,
15Kwan J., Krolik J. H., 1981, ApJ, 250, 478Lawrence A., Saunders W., Rowan-Robinson M., Crawford J., Ellis R. S.,
Frenk C. S., Efstathiou G., Kaiser N., 1988, MNRAS, 235, 261Law N. M. et al., 2009, PASP, 121, 1395Leloudas G. et al., 2016, Nat. Astron., 1, 0002Leloudas G. et al., 2019, (arXiv: e-prints)Lindegren L. et al., 2018, A&A, 616, A2Liu F. K., Zhou Z. Q., Cao R., Ho L. C., Komossa S., 2017, MNRAS, 472,
L99Loeb A., Ulmer A., 1997, ApJ, 489, 573Margutti R. et al., 2017, ApJ, 836, 25Margutti R. et al., 2018, ApJ, 864, 45Marinello M., Rodrıguez-Ardila A., Garcia-Rissmann A., Sigut T. A. A.,
Pradhan A. K., 2016, ApJ, 820, 116Mattila S. et al., 2018, Science, 361, 482McMullin J. P., Waters B., Schiebel D., Young W., Golap K., 2007, in Shaw
R. A., Hill F., Bell D. J., eds, ASP Conf. Ser. Vol. 376, Astronomical DataAnalysis Software and Systems XVI. Astron. Soc. Pac., San Francisco,p. 127
Metzger B. D., Stone N. C., 2016, MNRAS, 461, 948Netzer H., Wills B. J., 1983, ApJ, 275, 445Osterbrock D. E., Pogge R. W., 1985, ApJ, 297, 166Pasham D. R., van Velzen S., 2018, ApJ, 856, 1Peterson B. M., 2011, in Narrow-Line Seyfert 1 Galaxies and their Place in
the Universe, Proceedings of Science, PoS(NLS1), p. 32Phinney E. S., 1989, in Morris M., ed., Proc. IAU Symp. 136, The Center
of the Galaxy. Kluwer, Dordrecht, p. 543Piran T., Svirski G., Krolik J., Cheng R. M., Shiokawa H., 2015, ApJ, 806,
164Planck Collaboration XVI, 2014, A&A, 571, A16Rakshit S., Stalin C. S., Chand H., Zhang X.-G., 2017, ApJS, 229, 39Rees M. J., 1988, Nature, 333, 523Roelofs G. H. A., Groot P. J., Marsh T. R., Steeghs D., Nelemans G., 2006,
MNRAS, 365, 1109Romero-Canizales C., Prieto J. L., Chen X., Kochanek C. S., Dong S.,
Holoien T. W.-S., Stanek K. Z., Liu F., 2016, ApJ, 832, L10Roming P. W. A. et al., 2005, Space Sci. Rev., 120, 95Roth N., Kasen D., 2018, ApJ, 855, 54Roth N., Kasen D., Guillochon J., Ramirez-Ruiz E., 2016, ApJ, 827, 3Savage A., Bolton J. G., Wright A. E., 1977, MNRAS, 179, 135
Saxton R. D., Read A. M., Komossa S., Lira P., Alexander K. D., WieringaM. H., 2017, A&A, 598, A29
Shappee B. J. et al., 2014, ApJ, 788, 48Shiokawa H., Krolik J. H., Cheng R. M., Piran T., Noble S. C., 2015, ApJ,
804, 85Sigut T. A. A., Pradhan A. K., 1998, ApJ, 499, L139Smartt S. J. et al., 2015, A&A, 579, A40Stern D. et al., 2012, ApJ, 753, 30Stone N., Sari R., Loeb A., 2013, MNRAS, 435, 1809Stone N. C., Generozov A., Vasiliev E., Metzger B. D., 2018, MNRAS, 480,
5060Stoughton C. et al., 2002, AJ, 123, 485Strubbe L. E., Quataert E., 2009, MNRAS, 400, 2070Ulmer A., 1999, ApJ, 514, 180van Velzen S. et al., 2011, ApJ, 741, 73van Velzen S. et al., 2016a, Science, 351, 62van Velzen S., Mendez A. J., Krolik J. H., Gorjian V., 2016b, ApJ, 829, 19van Velzen S. et al., 2019a, ApJ, 872, 198van Velzen S., Stone N. C., Metzger B. D., Gezari S., Brown T. M., Fruchter
A. S., 2019b, ApJ, 878, 82Veron-Cetty M. P., Veron P., 1983, A&AS, 53, 219Wang T.-G., Zhou H.-Y., Wang L.-F., Lu H.-L., Xu D., 2011, ApJ, 740, 85Wevers T., van Velzen S., Jonker P. G., Stone N. C., Hung T., Onori F.,
Gezari S., Blagorodnova N., 2017, MNRAS, 471, 1694Wevers T. et al., 2018, Astron. Telegram, 12040Wevers T. et al., 2019, MNRAS, 487, 4136Wu X.-B., Hao G., Jia Z., Zhang Y., Peng N., 2012, AJ, 144, 49Wyrzykowski Ł. et al., 2017, MNRAS, 465, L114Yang C.-W., Wang T.-G., Ferland G., Yuan W., Zhou H.-Y., Jiang P., 2013,
ApJ, 774, 46Zhang X.-G., Dultzin-Hacyan D., Wang T.-G., 2006, MNRAS, 372, L5
SUPPORTING INFORMATION
Supplementary data are available at MNRAS online.
AT2018fyk swift mrtable.txt
Please note: Oxford University Press is not responsible for thecontent or functionality of any supporting materials supplied bythe authors. Any queries (other than missing material) should bedirected to the corresponding author for the article.
APPENDIX A: SWIFT UVOT OBSERVATIONS
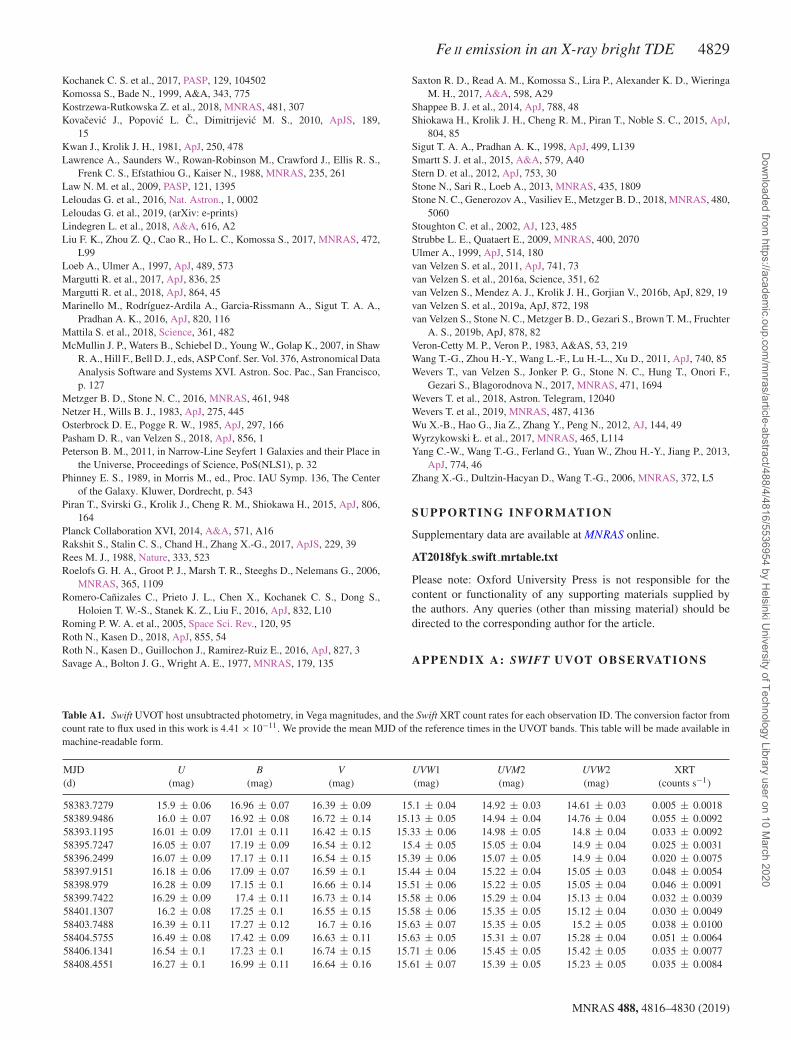
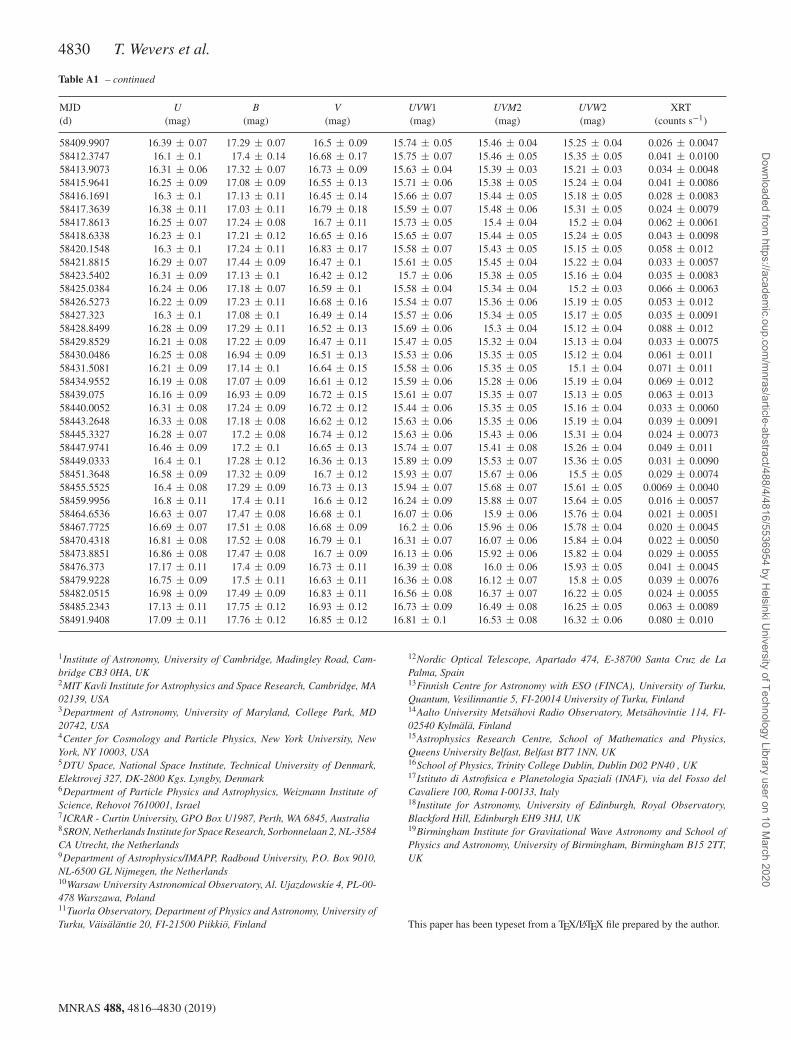
Table A1. Swift UVOT host unsubtracted photometry, in Vega magnitudes, and the Swift XRT count rates for each observation ID. The conversion factor fromcount rate to flux used in this work is 4.41 × 10⁻¹¹. We provide the mean MJD of the reference times in the UVOT bands. This table will be made available inmachine-readable form.
MJD U B V UVW1 UVM2 UVW2 XRT(d) (mag) (mag) (mag) (mag) (mag) (mag) (counts s−1)
58383.7279 15.9 ± 0.06 16.96 ± 0.07 16.39 ± 0.09 15.1 ± 0.04 14.92 ± 0.03 14.61 ± 0.03 0.005 ± 0.001858389.9486 16.0 ± 0.07 16.92 ± 0.08 16.72 ± 0.14 15.13 ± 0.05 14.94 ± 0.04 14.76 ± 0.04 0.055 ± 0.009258393.1195 16.01 ± 0.09 17.01 ± 0.11 16.42 ± 0.15 15.33 ± 0.06 14.98 ± 0.05 14.8 ± 0.04 0.033 ± 0.009258395.7247 16.05 ± 0.07 17.19 ± 0.09 16.54 ± 0.12 15.4 ± 0.05 15.05 ± 0.04 14.9 ± 0.04 0.025 ± 0.003158396.2499 16.07 ± 0.09 17.17 ± 0.11 16.54 ± 0.15 15.39 ± 0.06 15.07 ± 0.05 14.9 ± 0.04 0.020 ± 0.007558397.9151 16.18 ± 0.06 17.09 ± 0.07 16.59 ± 0.1 15.44 ± 0.04 15.22 ± 0.04 15.05 ± 0.03 0.048 ± 0.005458398.979 16.28 ± 0.09 17.15 ± 0.1 16.66 ± 0.14 15.51 ± 0.06 15.22 ± 0.05 15.05 ± 0.04 0.046 ± 0.009158399.7422 16.29 ± 0.09 17.4 ± 0.11 16.73 ± 0.14 15.58 ± 0.06 15.29 ± 0.04 15.13 ± 0.04 0.032 ± 0.003958401.1307 16.2 ± 0.08 17.25 ± 0.1 16.55 ± 0.15 15.58 ± 0.06 15.35 ± 0.05 15.12 ± 0.04 0.030 ± 0.004958403.7488 16.39 ± 0.11 17.27 ± 0.12 16.7 ± 0.16 15.63 ± 0.07 15.35 ± 0.05 15.2 ± 0.05 0.038 ± 0.010058404.5755 16.49 ± 0.08 17.42 ± 0.09 16.63 ± 0.11 15.63 ± 0.05 15.31 ± 0.07 15.28 ± 0.04 0.051 ± 0.006458406.1341 16.54 ± 0.1 17.23 ± 0.1 16.74 ± 0.15 15.71 ± 0.06 15.45 ± 0.05 15.42 ± 0.05 0.035 ± 0.007758408.4551 16.27 ± 0.1 16.99 ± 0.11 16.64 ± 0.16 15.61 ± 0.07 15.39 ± 0.05 15.23 ± 0.05 0.035 ± 0.0084
MNRAS 488, 4816–4830 (2019)
Dow
nloaded from https://academ
ic.oup.com/m
nras/article-abstract/488/4/4816/5536954 by Helsinki U
niversity of Technology Library user on 10 March 2020
4830 T. Wevers et al.
Table A1 – continued
MJD U B V UVW1 UVM2 UVW2 XRT(d) (mag) (mag) (mag) (mag) (mag) (mag) (counts s−1)
58409.9907 16.39 ± 0.07 17.29 ± 0.07 16.5 ± 0.09 15.74 ± 0.05 15.46 ± 0.04 15.25 ± 0.04 0.026 ± 0.004758412.3747 16.1 ± 0.1 17.4 ± 0.14 16.68 ± 0.17 15.75 ± 0.07 15.46 ± 0.05 15.35 ± 0.05 0.041 ± 0.010058413.9073 16.31 ± 0.06 17.32 ± 0.07 16.73 ± 0.09 15.63 ± 0.04 15.39 ± 0.03 15.21 ± 0.03 0.034 ± 0.004858415.9641 16.25 ± 0.09 17.08 ± 0.09 16.55 ± 0.13 15.71 ± 0.06 15.38 ± 0.05 15.24 ± 0.04 0.041 ± 0.008658416.1691 16.3 ± 0.1 17.13 ± 0.11 16.45 ± 0.14 15.66 ± 0.07 15.44 ± 0.05 15.18 ± 0.05 0.028 ± 0.008358417.3639 16.38 ± 0.11 17.03 ± 0.11 16.79 ± 0.18 15.59 ± 0.07 15.48 ± 0.06 15.31 ± 0.05 0.024 ± 0.007958417.8613 16.25 ± 0.07 17.24 ± 0.08 16.7 ± 0.11 15.73 ± 0.05 15.4 ± 0.04 15.2 ± 0.04 0.062 ± 0.006158418.6338 16.23 ± 0.1 17.21 ± 0.12 16.65 ± 0.16 15.65 ± 0.07 15.44 ± 0.05 15.24 ± 0.05 0.043 ± 0.009858420.1548 16.3 ± 0.1 17.24 ± 0.11 16.83 ± 0.17 15.58 ± 0.07 15.43 ± 0.05 15.15 ± 0.05 0.058 ± 0.01258421.8815 16.29 ± 0.07 17.44 ± 0.09 16.47 ± 0.1 15.61 ± 0.05 15.45 ± 0.04 15.22 ± 0.04 0.033 ± 0.005758423.5402 16.31 ± 0.09 17.13 ± 0.1 16.42 ± 0.12 15.7 ± 0.06 15.38 ± 0.05 15.16 ± 0.04 0.035 ± 0.008358425.0384 16.24 ± 0.06 17.18 ± 0.07 16.59 ± 0.1 15.58 ± 0.04 15.34 ± 0.04 15.2 ± 0.03 0.066 ± 0.006358426.5273 16.22 ± 0.09 17.23 ± 0.11 16.68 ± 0.16 15.54 ± 0.07 15.36 ± 0.06 15.19 ± 0.05 0.053 ± 0.01258427.323 16.3 ± 0.1 17.08 ± 0.1 16.49 ± 0.14 15.57 ± 0.06 15.34 ± 0.05 15.17 ± 0.05 0.035 ± 0.009158428.8499 16.28 ± 0.09 17.29 ± 0.11 16.52 ± 0.13 15.69 ± 0.06 15.3 ± 0.04 15.12 ± 0.04 0.088 ± 0.01258429.8529 16.21 ± 0.08 17.22 ± 0.09 16.47 ± 0.11 15.47 ± 0.05 15.32 ± 0.04 15.13 ± 0.04 0.033 ± 0.007558430.0486 16.25 ± 0.08 16.94 ± 0.09 16.51 ± 0.13 15.53 ± 0.06 15.35 ± 0.05 15.12 ± 0.04 0.061 ± 0.01158431.5081 16.21 ± 0.09 17.14 ± 0.1 16.64 ± 0.15 15.58 ± 0.06 15.35 ± 0.05 15.1 ± 0.04 0.071 ± 0.01158434.9552 16.19 ± 0.08 17.07 ± 0.09 16.61 ± 0.12 15.59 ± 0.06 15.28 ± 0.06 15.19 ± 0.04 0.069 ± 0.01258439.075 16.16 ± 0.09 16.93 ± 0.09 16.72 ± 0.15 15.61 ± 0.07 15.35 ± 0.07 15.13 ± 0.05 0.063 ± 0.01358440.0052 16.31 ± 0.08 17.24 ± 0.09 16.72 ± 0.12 15.44 ± 0.06 15.35 ± 0.05 15.16 ± 0.04 0.033 ± 0.006058443.2648 16.33 ± 0.08 17.18 ± 0.08 16.62 ± 0.12 15.63 ± 0.06 15.35 ± 0.06 15.19 ± 0.04 0.039 ± 0.009158445.3327 16.28 ± 0.07 17.2 ± 0.08 16.74 ± 0.12 15.63 ± 0.06 15.43 ± 0.06 15.31 ± 0.04 0.024 ± 0.007358447.9741 16.46 ± 0.09 17.2 ± 0.1 16.65 ± 0.13 15.74 ± 0.07 15.41 ± 0.08 15.26 ± 0.04 0.049 ± 0.01158449.0333 16.4 ± 0.1 17.28 ± 0.12 16.36 ± 0.13 15.89 ± 0.09 15.53 ± 0.07 15.36 ± 0.05 0.031 ± 0.009058451.3648 16.58 ± 0.09 17.32 ± 0.09 16.7 ± 0.12 15.93 ± 0.07 15.67 ± 0.06 15.5 ± 0.05 0.029 ± 0.007458455.5525 16.4 ± 0.08 17.29 ± 0.09 16.73 ± 0.13 15.94 ± 0.07 15.68 ± 0.07 15.61 ± 0.05 0.0069 ± 0.004058459.9956 16.8 ± 0.11 17.4 ± 0.11 16.6 ± 0.12 16.24 ± 0.09 15.88 ± 0.07 15.64 ± 0.05 0.016 ± 0.005758464.6536 16.63 ± 0.07 17.47 ± 0.08 16.68 ± 0.1 16.07 ± 0.06 15.9 ± 0.06 15.76 ± 0.04 0.021 ± 0.005158467.7725 16.69 ± 0.07 17.51 ± 0.08 16.68 ± 0.09 16.2 ± 0.06 15.96 ± 0.06 15.78 ± 0.04 0.020 ± 0.004558470.4318 16.81 ± 0.08 17.52 ± 0.08 16.79 ± 0.1 16.31 ± 0.07 16.07 ± 0.06 15.84 ± 0.04 0.022 ± 0.005058473.8851 16.86 ± 0.08 17.47 ± 0.08 16.7 ± 0.09 16.13 ± 0.06 15.92 ± 0.06 15.82 ± 0.04 0.029 ± 0.005558476.373 17.17 ± 0.11 17.4 ± 0.09 16.73 ± 0.11 16.39 ± 0.08 16.0 ± 0.06 15.93 ± 0.05 0.041 ± 0.004558479.9228 16.75 ± 0.09 17.5 ± 0.11 16.63 ± 0.11 16.36 ± 0.08 16.12 ± 0.07 15.8 ± 0.05 0.039 ± 0.007658482.0515 16.98 ± 0.09 17.49 ± 0.09 16.83 ± 0.11 16.56 ± 0.08 16.37 ± 0.07 16.22 ± 0.05 0.024 ± 0.005558485.2343 17.13 ± 0.11 17.75 ± 0.12 16.93 ± 0.12 16.73 ± 0.09 16.49 ± 0.08 16.25 ± 0.05 0.063 ± 0.008958491.9408 17.09 ± 0.11 17.76 ± 0.12 16.85 ± 0.12 16.81 ± 0.1 16.53 ± 0.08 16.32 ± 0.06 0.080 ± 0.010
1Institute of Astronomy, University of Cambridge, Madingley Road, Cam-bridge CB3 0HA, UK2MIT Kavli Institute for Astrophysics and Space Research, Cambridge, MA02139, USA3Department of Astronomy, University of Maryland, College Park, MD20742, USA4Center for Cosmology and Particle Physics, New York University, NewYork, NY 10003, USA5DTU Space, National Space Institute, Technical University of Denmark,Elektrovej 327, DK-2800 Kgs. Lyngby, Denmark6Department of Particle Physics and Astrophysics, Weizmann Institute ofScience, Rehovot 7610001, Israel7ICRAR - Curtin University, GPO Box U1987, Perth, WA 6845, Australia8SRON,Netherlands Institute for Space Research, Sorbonnelaan 2, NL-3584CA Utrecht, the Netherlands9Department of Astrophysics/IMAPP, Radboud University, P.O. Box 9010,NL-6500 GL Nijmegen, the Netherlands10Warsaw University Astronomical Observatory, Al. Ujazdowskie 4, PL-00-478 Warszawa, Poland11Tuorla Observatory, Department of Physics and Astronomy, University ofTurku, Vaisalantie 20, FI-21500 Piikkio, Finland
12Nordic Optical Telescope, Apartado 474, E-38700 Santa Cruz de LaPalma, Spain13Finnish Centre for Astronomy with ESO (FINCA), University of Turku,Quantum, Vesilinnantie 5, FI-20014 University of Turku, Finland14Aalto University Metsahovi Radio Observatory, Metsahovintie 114, FI-02540 Kylmala, Finland15Astrophysics Research Centre, School of Mathematics and Physics,Queens University Belfast, Belfast BT7 1NN, UK16School of Physics, Trinity College Dublin, Dublin D02 PN40 , UK17Istituto di Astrofisica e Planetologia Spaziali (INAF), via del Fosso delCavaliere 100, Roma I-00133, Italy18Institute for Astronomy, University of Edinburgh, Royal Observatory,Blackford Hill, Edinburgh EH9 3HJ, UK19Birmingham Institute for Gravitational Wave Astronomy and School ofPhysics and Astronomy, University of Birmingham, Birmingham B15 2TT,UK
This paper has been typeset from a TEX/LATEX file prepared by the author.
MNRAS 488, 4816–4830 (2019)
Dow
nloaded from https://academ
ic.oup.com/m
nras/article-abstract/488/4/4816/5536954 by Helsinki U
niversity of Technology Library user on 10 March 2020


![2000부 출력용 삼미 2018 카탈록 [원본]€¦ · ˜ tata steel uk ˜ tata steel velzen ˜ thyssenkrupp steel europe ag ˜ total ˜ valero pembroke refinery uk ˜ vost alpine](https://static.fdocuments.in/doc/165x107/5eaafb79455662589769af3b/2000e-oee-e-2018-fe-e-oe-tata-steel-uk-oe-tata-steel.jpg)


