WETTABILITY AND PREDICTION OF O R MODERN D COMPLETION FLUIDS
160
WETTABILITY AND PREDICTION OF OIL RECOVERY FROM RESERVOIRS DEVELOPED WITH MODERN DRILLING AND COMPLETION FLUIDS Final Report 1 October 2001 through 30 Sept 2005 Principal Investigator: Jill S. Buckley PRRC, New Mexico Institute of Mining and Technology Co-Investigator: Norman R. Morrow Dept. of Chemical & Petroleum Eng., University of Wyoming January 2006 DE-FC26-01BC15164 Submitted by: New Mexico Petroleum Recovery Research Center New Mexico Institute of Mining and Technology 801 Leroy Place Socorro NM 87801 Department of Chemical and Petroleum Engineering University of Wyoming P.O. Box 3295 Laramie, WY 82071-3295 PRRC 05-15
Transcript of WETTABILITY AND PREDICTION OF O R MODERN D COMPLETION FLUIDS

WETTABILITY AND PREDICTION OF OIL RECOVERY FROM RESERVOIRS DEVELOPED WITH MODERN DRILLING AND COMPLETION FLUIDS
Final Report
1 October 2001 through 30 Sept 2005
Principal Investigator: Jill S. Buckley PRRC, New Mexico Institute of Mining and Technology Co-Investigator: Norman R. Morrow Dept. of Chemical & Petroleum Eng., University of Wyoming
January 2006
DE-FC26-01BC15164
Submitted by:
New Mexico Petroleum Recovery Research Center New Mexico Institute of Mining and Technology
801 Leroy Place Socorro NM 87801
Department of Chemical and Petroleum Engineering
University of Wyoming P.O. Box 3295
Laramie, WY 82071-3295
PRRC 05-15

ii
List of Contributors New Mexico Petroleum Research Center New Mexico Institute of Mining and Petroleum Dr. Jill S. Buckley, Senior Scientist Co-Principal Investigator Dr. Jianxin Wang, Senior Research Associate Tianguang Fan, Research Chemist Dr. Robert Bowman, Professor, Hydrology Program, Dept.
of Earth & Environmental Science
Elizabeth Bryant, MS student in Hydrology Ratna Kumar Lekkala, MS student, in Petroleum Eng. Leila Skalli, MS student, in Petroleum Eng. Guangyu Chen, Visiting Scholar Department of Chemical and Petroleum Engineering University of Wyoming Dr. Norman R. Morrow, Professor Co-Principal Investigator Dr. David Bell, Associate Professor Zhengxin (Jason) Tong, PhD student in Petroleum Eng. Yongsheng Zhang, PhD student in Petroleum Eng.
iii
Disclaimer
This report was prepared as an account of work sponsored by an agency of the United States Government. Neither the United States Government nor any agency thereof, nor any of their employees, makes any warranty, express or implied, or assumes any legal liability or responsibility for the accuracy, completeness, or usefulness of any information, apparatus, product, or process disclosed, or represents that its use would not infringe privately owned rights. Reference herein to any specific commercial product, process, or service by trade name, trademark, manufacturer, or otherwise does not necessarily constitute or imply its endorsement, recommendation, or favoring by the United States Government or any agency thereof. The views and opinions of authors expressed herein do not necessarily state or reflect those of the United States Government or any agency thereof.

iv
Project Objectives The objectives of this project are:
1. to improve understanding of the wettability alteration of mixed-wet rocks that
results from contact with the components of synthetic oil-based drilling and
completion fluids formulated to meet the needs of arctic drilling;
2. to investigate cleaning methods to reverse the wettability alteration of mixed-wet
cores caused by contact with these SBM components; and
3. to develop new approaches to restoration of wetting that will permit the use of
cores drilled with SBM formulations for valid studies of reservoir properties.
v
Abstract The compositions of drilling fluids for wells drilled in sensitive and harsh
environments such as the arctic are dictated by considerations other than what might be
optimal with regard to determination of reservoir wettability. Both fluids and cores
recovered from such wells are therefore highly likely to be contaminated with a wide
variety of components from the drilling mud. Synthetic oil-based muds have many
advantages from both drilling and environmental perspectives. Their effects on the
wettability of recovered cores, however, can be drastic. In this project we have
endeavored to consider the effects of various components of oil-based—especially
synthetic oil-based—drilling fluids. Under what circumstances do they most strongly
interact with mineral surfaces? Can contaminated crude oil samples be identified? Can
cores be cleaned and restored to reservoir wetting conditions?
Several approaches were used in these studies to explore the effects of drilling
fluid components on fluid-fluid and fluid-solid interfaces. We expect surfactants to affect
the interfacial tension at oil-water interfaces, but interfacial tensions of crude oils have
not been well documented. An investigation of the interfacial properties of crude oils
with and without surfactant contamination provided fundamental data that can be used to
identify contaminated crude oil samples and to predict changes in interfacial tension with
changing conditions of the aqueous phase.
Wettability of smooth mineral surfaces was investigated for a wide range of
conditions including exposure to filtrates and centrifugates of field samples of synthetic
oil-based muds, commercial surfactant solutions, and solutions of surfactants of known
structure. The results of surfactant exposure depend on many variables and can be quite

vi
different for initially clean surfaces and those that have been previously exposed to crude
oil. In general, the most oil-wet conditions resulted from exposure first to crude oil, then
to the oil-soluble surfactants.
Tests of wettability in cores explored many of the same exposure scenarios as
those tested on smooth surfaces. In sandstone cores, as on mica surfaces, the greatest
effects of surfactant exposure were found for mixed-wet cores that were prepared by
exposure to crude oil. These observations suggest that significant changes in wetting
should be expected even with low surfactant concentrations in cores from mixed-wet
reservoirs. Further wetting alteration associated with destabilization of asphaltenes was
demonstrated to result from mixing of asphaltic crude oils with some of the synthetic
base oils currently in use to make up synthetic oil-based muds.
Finally we investigated cleaning of contaminated cores. Sequential treatment
with a sequence of solvents can effect substantial reversal of wetting changes toward
more water-wet conditions, but not without changes in core permeability.

vii
Table of Contents List of Contributors............................................................................................................. ii Project Objectives .............................................................................................................. iv Abstract............................................................................................................................... v Table of Contents.............................................................................................................. vii List of Figures..................................................................................................................... x List of Tables ................................................................................................................... xiv Executive Summary............................................................................................................ 1 1. Introduction.................................................................................................................... 4
1.1 Surfactants in porous media...................................................................................... 4 1.2 Components of SBM with potential to affect wettability ......................................... 5
1.2.1 Base oil............................................................................................................... 5 Some synthetic base oils ......................................................................................... 6 Asphaltene stability................................................................................................. 6
1.2.2 Surfactants.......................................................................................................... 6 Fatty acids and alcohols .......................................................................................... 7 Amines and other nitrogen compounds .................................................................. 8 Asphalt derivatives.................................................................................................. 8
1.3 Mixed wettability conditions in reservoir rocks ....................................................... 9 2. Experimental Materials and Methods .......................................................................... 10
2.1 Materials ................................................................................................................. 10 2.1.1 SBM and OBM components............................................................................ 10
Decane, base oils and mineral oils........................................................................ 10 Additives ............................................................................................................... 11 Mud fractions ........................................................................................................ 13
2.1.2 Crude oils ......................................................................................................... 13 2.1.3 Brines ............................................................................................................... 13 2.1.4 Mineral surfaces and surface treatments.......................................................... 14
Mica ...................................................................................................................... 14 2.1.5 Cores ................................................................................................................ 14
2.2 Methods................................................................................................................... 14 2.2.1 Interfacial tension (oil/water interfaces) .......................................................... 14
du Nouy ring ......................................................................................................... 15 Pendant drop ......................................................................................................... 15 Critical micelle concentration ............................................................................... 16
2.2.2 Contact angles (oil/water/solid interfaces)....................................................... 17 Clean mica. ........................................................................................................... 17
2.2.3 AFM................................................................................................................. 17 2.2.4 Preparation of MXW-F cores........................................................................... 17 2.2.5 Rate of spontaneous imbibition ....................................................................... 18
Reference curves for VSWW imbibition.............................................................. 18 2.2.6 Amott wettability indices................................................................................. 20 2.2.7 Asphaltene stability.......................................................................................... 21
3. Results and Discussion ................................................................................................ 23 3.1 Interfacial tensions (Bryant, Skalli, Fan, and Buckley) .......................................... 23

viii
3.1.1 Oil soluble surfactants and buffers .................................................................. 23 Polyethoxylated amines ........................................................................................ 23 Commercial surfactant mixtures ........................................................................... 24
3.1.2 Parametric study of crude oil/brine IFTs ......................................................... 29 Fluids..................................................................................................................... 30 Drop formation time ............................................................................................. 30 Measurement protocol and fits of IFT vs. time..................................................... 31 Low tension limit .................................................................................................. 32 An overview of IFT measurements for all crude oils and brines.......................... 32 Impact of pH on IFT of crude oil.......................................................................... 34 Comparison of IFT of different crude oils at constant pH.................................... 40
3.1.3 SBM/OBM surfactants in oil ........................................................................... 44 Surfactant in decane.............................................................................................. 44 Surfactant in crude oil ........................................................................................... 45 Contaminated crude oil ......................................................................................... 47
3.1.4 Summary of IFT results ................................................................................... 50 3.2 Surface wetting effects of field samples of SBM fluids (Lekkala and Buckley)... 51
3.2.1 Treatment and testing protocol ....................................................................... 51 3.2.2 COBR interactions with six crude oils............................................................. 52 3.2.3 Clean mica exposed to mud fractions .............................................................. 54 3.2.4 Effect of mud fractions on COBR-treated mica .............................................. 57 3.2.5 Cleaning ........................................................................................................... 62 3.2.6 Restoration of wettability................................................................................. 64
3.3 Surface wetting effects of polyethoxylated amines (Bryant, Bowman, and Buckley)....................................................................................................................................... 66
3.3.1 An overview of contact angles on mica surfaces exposed to polyethoxylated amines ....................................................................................................................... 66 3.3.2 Contact angles between surfactant solutions and water................................... 68 3.3.3 Decane/water contact angles after surfactant sorption..................................... 69 3.3.4 Atomic force microscopy................................................................................. 70 3.3.5 Discussion of wetting effects of polyethoxylated amines................................ 72 3.3.6 Summary of wetting effects of polyethoxylated amines.................................. 74
3.4 Surface effects of OBM and SBM surfactant (Skalli and Buckley) ....................... 75 3.4.1 Wetting alteration – surfactant only without crude oil .................................... 75
Conceptual Model................................................................................................. 75 Surfactant concentrations below CMC ................................................................. 76 Surfactant concentrations above CMC ................................................................. 77
3.4.2 Wetting alteration – surfactants and crude oils................................................ 85 3.5 Baseline study of MXW and MXW-F cores (Zhang and Morrow)........................ 90
3.5.1 Core treatments ................................................................................................ 90 3.5.2 Gullfaks oil....................................................................................................... 92 3.5.3 Minnelusa oil ................................................................................................... 93 3.5.4 Stability of MXW-F......................................................................................... 96 3.5.5 Effect of SBM components on MXW-F cores ................................................ 98
SBM base oil......................................................................................................... 98 SBM emulsifiers ................................................................................................... 99

ix
3.5.6 Summary of baseline core study ...................................................................... 99 3.6 Effect of SBM base oils on asphaltene stability and wetting in sandstone cores (Zhang, Morrow, Wang, and Buckley)....................................................................... 100
3.6.1 Background.................................................................................................... 100 Asphaltene stability............................................................................................. 101 Wettability alteration and assessment................................................................. 101 Surface precipitation ........................................................................................... 102
3.6.2 Experimental details....................................................................................... 103 Crude oils. ........................................................................................................... 103 Synthetic base oils and n-paraffins ..................................................................... 104
Trade name...................................................................................................... 105 Cores ................................................................................................................... 105
3.6.3 Results and discussion ................................................................................... 106 Asphaltene stability............................................................................................. 106 Alteration of wetting in cores ............................................................................. 107
3.6.4 Summary ........................................................................................................ 110 3.7 Alteration of wetting in cores with SBM/OBM surfactants (Zhang and Morrow)111
3.7.1 Spontaneous imbibition with and without added surfactants ........................ 111 3.7.2 Summary ....................................................................................................... 116
3.8 Cleaning Cores after Contamination with Synthetic Oil-based Mud Components (Zhang, Bell, Morrow, Buckley, and Chen) ............................................................... 117
3.8.1 Introduction................................................................................................... 117 3.8.2 Experimental details...................................................................................... 119
Cores ................................................................................................................... 119 Crude oils ............................................................................................................ 119 Brine.................................................................................................................... 120 Drilling mud formulation.................................................................................... 120 Contact angle measurements............................................................................... 120 Preparation of contaminated cores...................................................................... 120 Cleaning methods................................................................................................ 121 Sequence of cleaning solvents ............................................................................ 121
3.8.3 Results and discussion .................................................................................. 123 Three-step treatments with cyclohexane, toluene, and isopropanol ................... 123 Five-step treatments with cyclohexane, toluene, isopropanol, 1% NaOH in isopropanol, and isopropanol .............................................................................. 124 Effect of crude oil ............................................................................................... 126 Comparisons to single-step extraction ................................................................ 127
3.8.4 Summary ....................................................................................................... 129 4. Conclusions................................................................................................................ 130 Nomenclature.................................................................................................................. 132 References....................................................................................................................... 133 Appendix I. Summary of surfactant groups................................................................... 136 Appendix II. Crude oil properties .................................................................................. 138 Appendix III. Brine compositions ................................................................................. 140 Appendix IV. IFT measurements and fits to experimental data .................................... 141
x
List of Figures Figure 2.1.1-1. Chemical structures of the surfactants used in this study ....................... 12 Figure 2.2.5-1. Spontaneous imbibition characteristics for very strongly water-wet cores
with 0 % and 26 % initial water saturation. .............................................................. 19 Figure 2.2.5-2. Rim vs. tD for cores with different permeability at Swi = 0% ................... 20 Figure 3.1.1-1. Plots of interfacial tension (IFT) as a function of log concentration were
used to determine the CMC for a) CAM-2 b) TAM-2 and c) TAM-5 with pH 4 buffer......................................................................................................................... 24
Figure 3.1.1-2. Effective values of CMC for five commercial surfactant products as a function of pH. The products fall into two distinct groups, as shown. .................... 26
Figure 3.1.1-3. For Group 1 surfactants, IFT at the CMC concentration decreases monotonically with pH. Group 2 surfactants go through a maximum in the value of IFT at CMC at about pH 6. ....................................................................................... 26
Figure 3.1.1-4. For Group 2 surfactants, the main control over IFT at CMC is concentration; Group 1 surfactants have the lowest values of IFT at CMC when the pH is 8, regardless of concentration.......................................................................... 27
Figure 3.1.1-5. IFT decreases at over the range pH 5-7 for Group 1 mixtures above and below the CMC. Group 2 mixtures have lower values of IFT below pH 5 and above pH 6.5, with a plateau of higher values between these two pH conditions. ............. 28
Figure 3.1.1-6. Zeta potentials of silica flour before and after exposure to surfactants, as a function of pH (data from Menezes et al., 1989). .................................................. 29
Figure 3.1.2-1 Impact of drop formation time on IFT. .................................................... 31 Figure 3.1.2-2. C-F2-00 streaming upwards when emerging from needle into pH = 10.9
0.1M NaCl................................................................................................................. 32 Figure 3.1.2-3. Equilibrium IFT values correlate with pH of the aqueous phase, the
amount of n-C7 asphaltenes, acid number, base number, and viscosity of each oil. The p values represent the probability that a given variable is not correlated with IFT; values of p less that 0.05 indicate significant correlation. ........................................ 33
Figure 3.1.2-4. IFT as a function of pH for the low-acid-number crude oils. ................. 37 Figure 3.1.2-5. IFT as a function of pH for higher- acid-number crude oils. .................. 38 Figure 3.1.2-6. Summary of IFT(eq) data for crude oils measured against pH-adjusted
DDW and 0.1M NaCl solutions................................................................................ 39 Figure 3.1.2-7. At acidic conditions, the change in IFT with time correlates with log
(viscosity).................................................................................................................. 40 Figure 3.1.3-1. Impact of drilling mud additive on the IFT of decane. ............................ 45 Figure 3.1.3-2 Impact of drilling mud additive on the IFT of C-F-03 oil........................ 46 Figure 3.1.3-3. Interfacial tension measured by the pendent drop method and changes in
IFT with time. IFT is reported for drops that are more than 1 min, but less than 5 min old. Changes in tension were observed over 4-9 hours. ................................... 47
Figure 3.1.3-4. IFT of MY oils supplied by Rice University as a function of brine composition and pH. ................................................................................................. 49
Figure 3.1.3-5. pH6, 0.1M NaCl correlation showing that MY1-02 is an outlier. .......... 49 Figure 3.2.1-1. Outline of the test plan for SBM-fraction study...................................... 52 Figure 3.2.2-1. Results of standard COBR treatments with the WW oils. ...................... 53 Figure 3.2.2-2. Results of standard COBR treatments with the OW oils. ....................... 54

xi
Figure 3.2.3-1. Water advancing contact angles on mica surfaces exposed to synthetic oil-based mud fractions for 1 day, 7 days, and 21 days............................................ 55
Figure 3.2.3-2. Dry mica samples treated with drilling mud fractions were cleaned by washing with organic solvents. ................................................................................. 57
Figure 3.2.4-1. Effect of mud fractions on COBR-treated mica surfaces—WW oils and reservoir brines or synthetic sea water...................................................................... 59
Figure 3.2.4-2. Effect of mud fractions on COBR-treated mica surfaces—OW oils and pH4 buffer. ................................................................................................................ 59
Figure 3.2.4-3. Effect of mud fractions on COBR-treated mica surfaces—OW oils and SSW. ......................................................................................................................... 60
Figure 3.2.4-4. Extending the aging time in either mud fraction beyond one week has little further effect on the change in the water-advancing contact angle for a variety of combinations of oil and mud fraction, with or without brine. .............................. 60
Figure 3.2.4-5. Comparison of the effects of K-f filtrate and L-c centrifugate on COBR-treated mica samples. ................................................................................................ 61
Figure 3.2.6-1. Restoration of wettability by COBR interactions. Water-advancing angles are compared for mica surfaces treated by the standard COBR sequence to those obtained after exposure to drilling fluid fractions, washing, and repeated COBR exposures....................................................................................................... 64
Figure 3.3.1-1. Contact angle results for a) CAM-2 b) TAM-2 and c) TAM-5. Error bars are standard deviations of 18 replicate measurements.............................................. 67
Figure 3.3.3-1. TAM-5 pre-equilibrated with pH 8 brine measured in a) pH 4 brine and b) pH 8 brine. Error bars are standard deviations of 18 replicate measurements. ........ 70
Figure 3.3.4-1. Mica treated with a 5% by volume TAM-5/decane solution imaged under a) air b) water c) pH 8 buffer and d) pH 10 buffer. .................................................. 72
Figure 3.4.1-1. Schematic illustration of surfactant distribution in the oil/water/solid system at surfactant concentrations below and above CMC. ................................... 76
Figure 3.4.1-2. Contact angles as a function of contact time between water drop and mica surface for two concentrations of Ez Mul surfactant mixture in decane, above and below the CMC. The water phase was an unequilibrated drop of {pH 6, 0.1M} buffer......................................................................................................................... 77
Figure 3.4.1-3. Comparison of the contact angles on clean mica surfaces exposed for 1 hr to emulsifier solutions, 0.03% by volume of product. The probe water drop is {pH 6, 0.1M} buffer. The contact time between the water drop and mica surface is 2 min.................................................................................................................................... 78
Figure 3.4.1-4. Water-advancing contact angles on mica exposed to surfactant solutions for 1 hr. Contact angles were measured with a drop of {pH 6, 0.1M} buffer in decane solutions of each surfactant (0.03 vol%). Results are shown for contact times of 2, 5, and 10 minutes, during which the advanced aqueous drop remained stationary on the mica surface are shown. ................................................................ 79
Figure 3.4.1-5. Mica samples treated as in Fig. 10 above. After one hour, mica was removed from the surfactant solutions and submerged in decane for the contact angle measurements with {pH 6, 0.1M} buffer. Contact times between the water drop and mica surface were 2, 5, and 10 minutes. .................................................... 80
xii
Figure 3.4.1-6. Comparison of initial (2 min) and final (10 min) water-advancing angles for measurements in surfactant solution (SS) and in decane. Data are from Figs. 10 and 11 above. ............................................................................................................ 80
Figure 3.4.1-7. Mica surface aged for 1 hr in an 0.03 vol% solution of surfactant in decane. Contact angles measured in surfactant solution with {pH 6, 0.1M} buffer. Contact time between water drop and mica surface was 5 min. Before contact with mica, the water drop was allowed to equilibrate with the surfactant solution for up to 10 minutes................................................................................................................. 81
Figure 3.4.1-8. The effect of drop aging time illustrated in Fig. 13 was eliminated if the Ez Mul surfactant solution and aqueous buffer were pre-equilibrated for 4-12 days.................................................................................................................................... 82
Figure 3.4.1-9. Surfactant distribution in an oil/water/mica system with oil-soluble surfactant concentration greater than CMC, when the brine drop is allowed to equilibrate briefly with the surfactant solution before contact with the mica surface.................................................................................................................................... 83
Figure 3.4.1-10. Changes that occur with the time of contact between water drop and mica surface can be eliminated by preequilibration of the oleic and aqueous phases. Contact angles were measured in surfactant solution (SS = 0.03vol% Ez Mul in decane) or in decane alone with {pH 6, 0.1 M} buffer. Contact times between water drop and mica surface were 2, 5, and 10 minutes. .................................................... 84
Figure 3.4.1-11. Water advancing contact angles between decane and {pH 6, 0.1M} buffer. The results are indistinguishable regardless of whether the aqueous buffer used had been preequilibrated with surfactant solution (0.03vol% Ez Mul in decane) or not. ........................................................................................................................ 85
Figure 3.4.2-1. Decane/buffer contact angles for mica exposed to {pH 4, 0.01 M} buffer for 24 hrs, then to one of three crude oils for 21 days at ambient temperature. Crude oil was removed by rinsing with toluene. ................................................................. 86
Figure 3.4.2-2. Contact angles for mica surfaces aged in LB-03 crude oil to which varying amounts of Ez Mul were added. Mica was aged for 24 hrs in {pH 4, 0.01 M} buffer, 21 days in oil plus Ez Mul, rinsed with toluene, and submerged in decane. Contact angles were measured with decane and {pH 6, 0.1M} buffer..................... 87
Figure 3.4.2-3. Contact angles (water-advancing and receding) measured on mica surfaces exposed first to buffer, then to crude oil. Contact angles were measured between buffer and decane or decane solutions of emulsifier (0.03vol%). .............. 88
Figure 3.4.2-4. Adsorption of reverse micelles on the oil-treated mica surface would produce very oil-wet conditions................................................................................ 89
Figure 3.5.2-1. Comparison of spontaneous imbibition characteristics between Gullfaks MXW and MXW-F Berea 250 cores. ....................................................................... 92
Figure 3.5.2-2. Comparison between Gullfaks MXW and MXW-F Berea 90 cores........ 93 Figure 3.5.3-1. Comparison of imbibition rates between Minnelusa ’02 MXW and
MXW-F Berea 250 cores. ......................................................................................... 94 Figure 3.5.3-2. Comparison of imbibition between Minnelusa’98 MXW and MXW-F
Berea 90 cores........................................................................................................... 95 Figure 3.5.3-3. Comparison between Minnelusa’98 and Minnelusa’02 MXW-F Berea 90
cores. ......................................................................................................................... 96
xiii
Figure 3.5.4-1. The effect of base oil and addition of emulsifier (LE SUPERMUL) on imbibition for Minnelusa’98 MXW-F Berea 90 core. .............................................. 97
Figure 3.5.4-2. The effect of base oil and addition of emulsifier (EZ MUL®NT) on the imbibition of Minnelusa’98 MXW-F Berea 90 core. ............................................... 98
Figure 3.6.1-1. Cores are less water-wet, as indicated by slower imbibition if crude oil is displaced with a paraffinic oil (after Tie et al., 2003). The dimensionless time, tD, is defined by Eq. 1, below. ......................................................................................... 103
Figure 3.6.3-1. RI and PRI for the onset of asphaltene precipitation from Fuji crude oil at 20°C. ....................................................................................................................... 106
Figure 3.6.3-2. RI and PRI for the onset of asphaltene precipitation from Minnelusa crude oil at 60°C. .............................................................................................................. 107
Figure 3.6.3-3. Wetting conditions in Berea core after aging in Minnelusa crude oil are shown by the line labeled MXW. (Numbers beginning C5- identify specific cores; IFT is interfacial tension; Ta, Tf, and Tm are the aging, flushing, and measurement temperatures.) The other three curves show sea water imbibition rates after the crude oil was displaced by the products indicated.................................................. 108
Figure 3.6.3-4. Wetting conditions in Berea core after aging in Gullfaks crude oil are shown by the line labeled MXW. The other three curves show sea water imbibition rates after the crude oil was displaced by the products indicated. .......................... 108
Figure 3.6.3-5. Wetting conditions in Berea core after aging in Fuji crude oil are shown by the line labeled MXW. The other three curves show sea water imbibition rates after the crude oil was displaced by the products indicated.................................... 109
Figure 3.7.1-1. Effect of 0.005 vol% EzMul on wetting of Berea sandstone, with and without exposure of the core to Gullfaks-96 crude oil. .......................................... 112
Figure 3.7.1-2. Greater change in wetting is observed when the core is exposed to EzMul after treatment with crude oil to create MXW-F wetting conditions...................... 113
Figure 3.7.1-3. Comparison of the effects of two Group 1 surfactants: EzMul used in traditional oil-based muds and LeSupermul used in synthetic oil-based muds. ..... 114
Figure 3.7.1-4. Increasing concentrations of EzMul and Invermul both suppress the rate of imbibition of water. ............................................................................................ 115
Figure 3.8.3-1. Cores cleaned by three-step solvent sequence of cyclohexane, toluene, and isopropanol are weakly water-wet. There is little difference between flow-through and extraction applications of the solvents................................................ 124
Figure 3.8.3-2. Comparison of imbibition rates before and after cleaning by the five-step extraction process.................................................................................................... 125
Figure 3.8.3-3. Comparison of imbibition rates before and after cleaning by the five-step extraction process.................................................................................................... 126
Figure 3.8.3-4. Cleaning of SBM-contaminated cores with a sequential process including a high-pH step is efficient for cores whether they were very strongly water-wet or mixed-wet before exposure to SBM. ...................................................................... 127
Figure 3.8.3-5. Comparison of cleaning SBM-contaminated cores by single and multi-step processes. Cores were very strongly water-wet before exposure to SBM. .... 128
Figure 3.8.3-6. Comparison of cleaning SBM-contaminated cores by single and multi-step processes. Cores were mixed-wet before exposure to SBM. ......................... 128

xiv
List of Tables Table 2.1.1-1. SBM base oils and mineral oils (measurements all at 20°C) ................... 11 Table 2.2.2-1. Water-advancing angles on clean mica .................................................... 17 Table 2.2.6-1 Interpretation of Wettability Indices .......................................................... 21 Table 3.1.1-1. Effective CMC and IFT at CMC for commercial surfactants—effect of pH
................................................................................................................................... 25 Table 3.1.2-1. Properties of oils with low acid number and varying base number ......... 35 Table 3.1.2-2. Properties of oils with high acid and base numbers ................................. 35 Table 3.1.2-3. Summary of crude oils tested in each pH and brine composition subgroup
................................................................................................................................... 41 Table 3.1.2-4. Summary of pH and brine composition subgroup correlations with
standard variables...................................................................................................... 42 Table 3.1.2-5. Best correlations for pH and brine composition subgroups ..................... 43 Table 3.2.2-1. Contact Angles on COBR-Treated Mica Surfaces................................... 53 Table 3.2.3-1. Contact Angles for Dry Mica Samples Aged in Mud Fractions .............. 55 Table 3.2.3-2. Contact Angles on Initially Dry Mica Aged in Mud Fractions and Washed
with Solvents............................................................................................................. 56 Table 3.2.4-1. Contact Angles on Mica Aged in Brine for One Day and in Mud Fractions
for Seven Days.......................................................................................................... 57 Table 3.2.4-2. Effect of Mud Samples on COBR-Treated Mica ..................................... 58 Table 3.2.5-1. Advancing Angles (Decane/Water) for Washing Tests (COBR Mica
Samples Aged in RB, Oil and Mud Samples, then Washed as Indicated)................ 63 Table3.2.5-2. Advancing Angles (Decane/Water) for Washing Tests (COBR Mica
Samples Aged in pH 4 Buffer, Oil and Mud Samples, then Washed as Indicated).. 63 Table 3.2.5-3. Advancing Angles (Decane/Water) for Washing Tests (COBR Mica
Samples Aged in SSW, Oil and Mud Samples, then Washed as Indicated)............. 63 Table 3.2.6-1. Summary of the Decane/Water Contact Angles (Advancing) for Mica
Aged in Brine, Oil, Mud Sample, then Washed and Restored ................................. 65 Table 3.3.1-1. Summary of contact angle measurements for CAM-2, TAM-2 and TAM-5
................................................................................................................................... 66 Table 3.3.1-2. Summary of contact angle measurements for TAM-5 solutions that had
been pre-equilibrated with pH 8 buffer..................................................................... 68 Table 3.4.2-1. Test fluids for the contact angle measurements shown in Fig. 3.4.2-3 .... 87 Table 3.5.1-1. Properties of core samples used in spontaneous imbibition tests............. 91 Table 3.6.2-1. Properties of base oils and mineral oil ................................................... 105 Table 3.8.2-1. Properties of the oil and SBM-treated cores........................................... 121 Table 3.8.2-2. Solvents and sequences in which they are applied in single and multi-step
cleaning ................................................................................................................... 122 Table 3.8.3-1. Summary of core cleaning results .......................................................... 123

1
Executive Summary The compositions of drilling fluids for wells drilled in sensitive and harsh environments
such as the arctic are dictated by considerations such as drilling rate, lubrication, cost, and hole
stability. Synthetic oil-based muds have many advantages from both drilling and environmental
perspectives. However, fluids and cores recovered from wells drilled with oil-based or synthetic
oil-based muds are highly likely to be contaminated with a wide variety of components from the
drilling mud, some of which can alter wetting and make evaluation of the original wetting state
of the reservoir problematic. In this project we considered the effects of various components of
oil-based, especially synthetic oil-based, drilling fluids. For example, under what circumstances
do they most strongly interact with mineral surfaces? What specific drilling fluid components
are most responsible for wettability alteration? Can contaminated crude oil samples be identified?
Can cores be cleaned and restored to reservoir wetting conditions?
Several approaches were used in these studies to try to understand the effects of drilling
fluid components on fluid-fluid and fluid-solid interfaces. The main experimental approaches
included fluid-fluid interfacial tension (IFT) measurements by static and transient techniques,
contact angle measurements and atomic forces microscopy imaging of smooth mineral surfaces,
and wettability testing of porous media by measurements of Amott indices and rates of
spontaneous imbibition.
Although we expect surfactants to affect IFT at oil-water interfaces, it is difficult to
predict the range of their effects since IFTs of crude oils have not previously been well
documented. An investigation of the interfacial properties of crude oils with and without
surfactant contamination was undertaken to provide fundamental data that can be used to identify
contaminated crude oil samples and to predict changes in interfacial tension with changing

2
conditions of the aqueous phase. Measurements were made by both duNouy ring and pendant
drop techniques. In general, the effect of drilling mud surfactants on the IFT of crude oils is to
depress oil/water IFT although the actual values depend on identity of the crude oil, brine
composition and pH, as well as surfactant identity and concentration. The effect of surfactant is
less for crude oil than for comparable concentrations of the same surfactants added to a
paraffinic solvent in both relative and absolute terms.
Wettability of smooth mineral surfaces was investigated for a wide range of conditions
including exposure to filtrates and centrifugates of field samples of synthetic oil-based muds,
commercial surfactant solutions, and solutions of surfactants of known structure. The main
techniques used to assess wetting included a variety of contact angle measurements and imaging
with an atomic forces microscope. The results of surfactant exposure depend on many variables
including surfactant concentrations, treatment duration and temperature, and the order in which
treatments occur. Results can be quite different for initially clean surfaces and those that have
been previously exposed to crude oil. In general, the most oil-wet conditions resulted from
exposure first to crude oil, then to the oil-soluble surfactants, conditions analogous to the
alteration of wettability in a reservoir during drilling with oil-based or synthetic oil-based fluids.
Imbibition-based tests of wettability, including Amott-Harvey indices that compare
spontaneous and forced displacement and the rate of spontaneous imbibition, were used to judge
wetting changes in cores. Exposure sequences were analogous to those tested on smooth
surfaces. In sandstone cores, as on mica surfaces, the greatest effects of surfactant exposure
were found for mixed-wet conditions that were prepared by exposure to crude oil. These
observations suggest that significant changes in wetting should be expected even with low
surfactant concentrations in cores from mixed-wet reservoirs. Further wetting alteration
3
associated with destabilization of asphaltenes was demonstrated to result from mixing of
asphaltic crude oils with some of the synthetic base oils currently in use to make up synthetic oil-
based muds.
Several cleaning methods were tested on smooth surfaces and in oil- and surfactant-
contaminated cores. The most effective were found to be sequential treatments. Treatment with
a sequence of solvents can effect substantial reversal of wetting changes toward more water-wet
conditions and should be considered for wettability testing of cores obtained during coring with
oil-based or synthetic oil-based muds. There are, however, changes in core permeability
associated with such extensive cleaning.

4
1. Introduction
1.1 Surfactants in porous media
The oil industry uses surfactants in a variety of applications. Processes developed and
tested for enhanced oil recovery suffered from surfactant loss as the additives intended to reduce
interfacial tension or to stabilize foams were adsorbed onto rock surfaces. Similar phenomena
can occur when surfactants, included in drilling fluids to serve a wide variety of functions,
encounter mineral surfaces in the reservoir, in the pores of cuttings, and in cores recovered
during the drilling process. In the reservoir, the concentration of surface active material is likely
minimized by filtration through the filter cake; cuttings are exposed to higher concentrations.
Cores may experience levels of surfactants between these two extremes; the exact levels of
surface-active material that invade cores may be difficult to predict or to duplicate precisely in
laboratory studies. An alternative is to examine a range of concentrations spanning the
maximum to minimum expected values.
How exposure to surfactants will affect the wetting condition in cores is not obvious. In
most cases, existing wetting is mixed, with a pattern of more and less water-wet surfaces that
depend on the placement of water and oil in the pore space: more water-wet in corners and in
the smallest pores, less water-wet or even oil-wet in larger pores (Salathiel, 1973; Morrow, 1990).
Crude oil components are adsorbed or otherwise deposited on mineral surfaces to make those
surfaces, in most cases, less water-wet than they would have been originally (Anderson, 1986;
Buckley, 2001a; Buckley and Lord, 2003). How tightly they are bound to the surface varies
from case to case. The impact of surfactants from the drilling fluid might range from no effect to
wettability reversal from water-wet to oil-wet or even wettability reversal from oil-wet to water-
wet. The core would become more oil-wet if surfactants adsorbed in the water-wet small pores
5
and corners. Replacement of weakly bound oil components with more strongly adsorbed
surfactants is possible. Specific circumstances where surfactants make surfaces more water-wet,
either by removing adsorbed oil components through formation of ion pairs or by adsorbing over
oil components, increasing the hydrophilicity of the exposed outer layer of adsorbed material
have been demonstrated to occur in chalk (Standnes and Austad, 2000b).
1.2 Components of SBM with potential to affect wettability
Synthetic oil-based muds have been developed mainly to solve environmental problems.
The work reported in the literature on their formulation and testing is primarily intended to show
that they fulfill all the normal drilling and completion requirements while at the same time
reducing adverse environmental impact. Wettability issues are not considered in these
evaluations beyond maintaining oil-wet conditions for cuttings transport. The potential for
damage to well productivity due to creation of more oil-wet conditions near the wellbore is a
problem that has received little attention. The work on OBM wetting effects suggests that
wettability problems can be expected in cores recovered with SBM. The extent of damage and
potential for wettability restoration in either cores or in the near wellbore region are the focus of
this project.
1.2.1 Base oil
The base fluids now in use include a wide variety of synthetic oleic materials (Friedheim
and Conn, 1996; Patel, 1998). Aromatic compounds are rigorously excluded because of their
biotoxicity. In general, low temperature viscosities are higher for SBM than traditional OBM,
but there is also a greater decrease in viscosity with increasing temperature. At reservoir
temperatures the new and old formulations are more comparable. Pour points of the SBM base
oils are generally lower than those used in traditional OBM formulations—an important
6
consideration in arctic and sea-floor conditions. Flash points are higher—an important safety
consideration. Some of these materials can act as destabilizing agents for asphaltenes, which
would have implications for wettability alteration, although no consideration about the potential
for asphaltene destabilization appears in published evaluations of SBM base muds.
Some synthetic base oils
Esters have been favored from the standpoint of biodegradation, but the same ester
linkage that promotes biological breakdown lacks needed stability, especially at elevated pH and
temperature (Patel, 1999) and the byproducts (fatty acids and alcohols) may be more toxic than
the original ester. Other oxygenated base oils used are ethers and acetals. Olefins, e.g., linear
alpha-olefins (LAO), internal olefins (IO), and poly-alpha-olefins (PAO), are more stable, but
still have greater rates of biodegradation and lower viscosities than their saturated analogs.
Asphaltene stability
Asphaltenes are the material in crude oils that is insoluble in low molecular weight
paraffins. As oil from the formation mixes with the drilling fluid, the potential exists for
asphaltenes to be destabilized. When that happens, the asphaltenes exhibit an increased tendency
to adsorb on mineral surfaces and to alter their wetting properties (Al-Maamari and Buckley,
2003). While the stability of asphaltenes as a function of oil composition has been studied for
alkanes (Buckley and Wang, 2002), little is known about stability or instability in the synthetic
base oils now being used in drilling fluids.
1.2.2 Surfactants
With the development of synthetic base oils have come new surfactants and surfactant
mixtures. Fewer chemical details are available about the surfactant packages, as the identity of

7
the surfactants used is usually considered to be proprietary. However, it is possible to learn
generally about the families of compounds in use.
Drilling mud studies inevitably face problems because of the complexity of the whole
mud. Filtrate compositions are highly dependent on the filtration process. For systematic studies,
representative surfactants at known concentrations are preferable to complex mixtures. For
surfactants that form micelles, interactions with surfaces can be quite different above and below
the CMC. Mixtures of surfactants introduce additional complexity. Relating the results of
systematic studies to more realistic mud conditions is a significant problem.
The surface active materials likely to occur in an SBM formulation include the primary
emulsifiers and oil-wetting agents, as well as additives that might be used to modify low-shear
rate rheology, and the surfactants used to make fluid loss materials oil-wet.
Fatty acids and alcohols
Whether a fatty acid is classified as an emulsifier or a wetting agent depends on the
length of the hydrocarbon chain, which affects the behavior of these and related compounds at
interfaces (oil/air, oil/water, oil/solid). The calcium salts of fatty acids are made by mixing the
acid with lime (CaO) in the base oil. Oleic acid, an unsaturated fatty acid, has been used to form
dimers or trimers to adjust the low-shear viscosity of drilling fluids. Saturated and unsaturated
fatty acids are readily available in a range of molecular weights. As acids, the fatty acids
themselves should interact most strongly with carbonate minerals. Their impact on clean
sandstones should be less than in limestone, dolomite, or chalk cores unless carbonate cements
are significant. If cationic crude oil components are adsorbed, however, there is the possibility
that fatty acids, especially in their ionized form, might form ion-pairs with the adsorbed species,
removing them from the surface.

8
Derivatives of fatty acid are sometimes added as viscosifiers. These might be related to
12 hydroxystearic acid which can form a gel in mineral or synthetic oil. Either the monomer or
polymer might exhibit surface activity.
Alcohols, which can partition between oil and water, have some interfacial activity as well.
Amines and other nitrogen compounds
Amines are likely to adsorb on silicate mineral surfaces, and are used as wetting agents
for that reason. Clays are treated with amines to enhance their dispersal in the base oil to
increase the oil phase viscosity; some free amine might occur if the clay coating material is
removed from the clay, although this is unlikely to be as large a source of surface-active material
as the emulsifiers and wetting agents themselves. Primary amine analogs of the fatty acids are
available up to about C18, as are a wide variety of secondary and tertiary amines.
Another potential source of amines is the amine-treated lignite used to control fluid loss.
Like the clays, this is likely a minor source of amines, compared to the primary and secondary
emulsifiers.
In addition to the amines, there are polyamines and amides used as emulsifiers.
Derivatives of imidazolines are also used as emulsifiers. Members of this class of compounds
are also used as corrosion inhibitors because of their ability to adsorb on and protect steel
surfaces. Adsorption on mineral surfaces must also be considered.
Asphalt derivatives
Asphaltic material from the heavy ends of a crude oil is sometimes used as a viscosifier.
In crude oils, these are among the materials that adsorb on mineral surfaces and alter wetting,
especially near the onset of asphaltene instability. Although they are poorly defined and may
9
vary significantly from one source to another, they are interfacially active and should be included
in the overall consideration of potential effects of drilling mud components on wetting.
1.3 Mixed wettability conditions in reservoir rocks
It is increasingly believed that the wetting conditions of most hydrocarbon reservoirs are
mixed-wet (MXW). The MXW state is formed by adsorption of polar crude oil components onto
rock surfaces in the presence of initial formation water. MXW cores can be prepared for
laboratory study by aging core samples with initial water saturation in crude oil. MXW (film)
cores (MXW-F) can be prepared by displacing the crude oil in MXW cores with decalin
followed by injection of mineral oil (Tong et al., 2002, 2003a, and 2003b). Displacement tests
are then usually run with a refined mineral oil as the probe oil.

10
2. Experimental Materials and Methods
2.1 Materials
2.1.1 SBM and OBM components
Decane, base oils and mineral oils
Decane (>99.3% purity), used to dissolve oil-soluble surfactants, was purified by passing
through a column containing silica (grade 62, 60 – 200 mesh, Aldrich, Milwaukee, WI) and
alumina (80 – 200 mesh, Fisher Scientific). Silica was activated in an oven set at 200°C for at
least eight hours to remove any sorbed water.
Samples of oleic materials that are used as base oils for synthetic oil-based drilling fluids
have been obtained from a number of sources, as shown in Table 2.1.1-1. Experts were
consulted to determine which materials would be representative of different classes of base oils
that are in widespread use. Also included are decane and paraffinic mineral oils that were used
in some core tests. Polar contaminants were removed from mineral oils by passing the oil
through columns of alumina and activated silica as described above.

11
Table 2.1.1-1. SBM base oils and mineral oils (measurements all at 20°C)
Product designation Density (g/ml) Viscosity (cP) RI Supplied by Description
Accolade 0.8243 4.9 1.4424 Westport mixture of internal olefins and esters
Biobase 240 (C-14) 0.7712 2.1 1.4359 ChevronTexaco linear alpha olefin
Biobase 560 (LP) 0.7596 1.9 1.4278 ChevronTexaco linear paraffin
Decane 0.7303 1.4112 Fisher Scientific n-paraffin
EDC 99DW 0.8059 3.0 1.4463 M-I highly hydrogenated mineral oil
GOM 4 comp blend - IO 0.7845 3.5 1.4436 ChevronTexaco internal olefins
LVT 200 0.8177 2.9 1.4503 Halliburton paraffinic mineral oil
Petrofree 0.8581 7.6 1.4420 ChevronTexaco esters
Petrofree LV 0.8617 3.9 1.4354 ChevronTexaco esters
Petrofree SF 0.7847 3.6 1.4448 Halliburton probably olefin
SF Base 0.7852 3.6 1.4445 ChevronTexaco isomerized olefins
Soltrol 220 0.7833 3.8 1.4371 ChevronPhillips paraffinic mineral oil
XP-07 0.7617 2.3 1.4286 ChevronTexaco linear paraffin
Additives
The commercial emulsifier products tested are listed in Table 2.1.1-2.
Table 2.1.1-2. Emulsifiers tested.
Product Supplier Recommended use Chemical description Le Supermul Halliburton SBM emulsifier a polyaminated fatty acid
Ez Mul Halliburton OBM emulsifier equivalent to Le Supermul
Le Mul Halliburton SBM emulsifier blend of oxidized tall oil and polyaminated fatty acid
Invermul NT Halliburton OBM emulsifier equivalent to Le Mul
Versamul M-I (from ChevronTexaco) OBM emulsifier equivalent to Le Mul
Depending on the application, recommended amounts range from 1 to 20 pounds per
barrel, corresponding to percentages on a weight to volume basis of from a little less than 1 to
more than 5%. The concentrations that invade a core might be lower, if surfactant is adsorbed on
the filter cake, but in cases where crude oil samples are contaminated by the drilling mud, the
exposure to significant amounts of surfactant is likely.
12
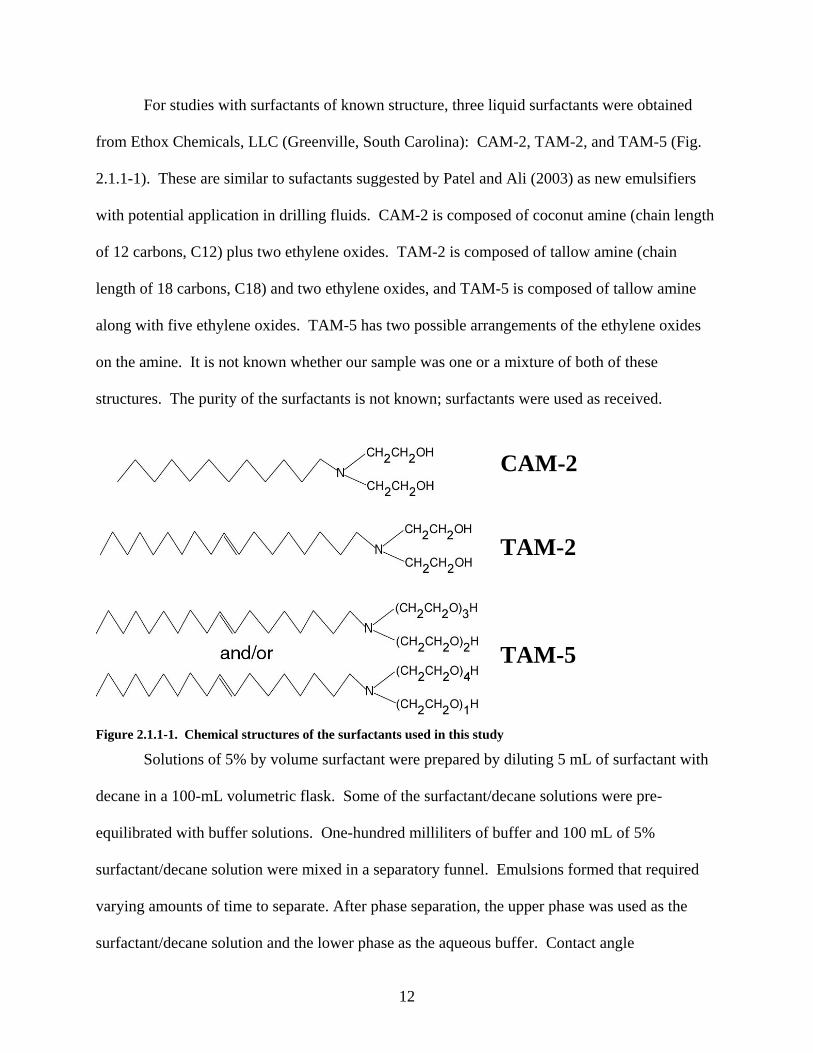
For studies with surfactants of known structure, three liquid surfactants were obtained
from Ethox Chemicals, LLC (Greenville, South Carolina): CAM-2, TAM-2, and TAM-5 (Fig.
2.1.1-1). These are similar to sufactants suggested by Patel and Ali (2003) as new emulsifiers
with potential application in drilling fluids. CAM-2 is composed of coconut amine (chain length
of 12 carbons, C12) plus two ethylene oxides. TAM-2 is composed of tallow amine (chain
length of 18 carbons, C18) and two ethylene oxides, and TAM-5 is composed of tallow amine
along with five ethylene oxides. TAM-5 has two possible arrangements of the ethylene oxides
on the amine. It is not known whether our sample was one or a mixture of both of these
structures. The purity of the surfactants is not known; surfactants were used as received.
Figure 2.1.1-1. Chemical structures of the surfactants used in this study
Solutions of 5% by volume surfactant were prepared by diluting 5 mL of surfactant with
decane in a 100-mL volumetric flask. Some of the surfactant/decane solutions were pre-
equilibrated with buffer solutions. One-hundred milliliters of buffer and 100 mL of 5%
surfactant/decane solution were mixed in a separatory funnel. Emulsions formed that required
varying amounts of time to separate. After phase separation, the upper phase was used as the
surfactant/decane solution and the lower phase as the aqueous buffer. Contact angle
CAM-2
TAM-2
TAM-5

13
measurements using pre-equilibrated fluids were indistinguishable from those with non-
equilibrated solutions. Since pre-equilibration does not appear to affect the results of this study,
distinction between equilibrated and non-equilibrated fluid results will be omitted in most cases.
Complete descriptions of the full suite of experiments are available elsewhere (Bryant, 2004).
Mud fractions
Two samples, obtained from synthetic oil-base drilling muds (SBMs) used in the wells
that produced oils C-K-01 and C-L-01, were used in this study. One was a filtered “end of run”
sample. The other was the supernatant from a centrifuged sample, referred to as K-f for the
filtrate and L-c for the centrifugate, respectively. Note that they are from different sources, not
simply from different separation processes.
A disadvantage of using these field samples is that little information was available about
the components of the two drilling fluids, nor were there details available regarding how the
filtrate and centrifugate were prepared. Nevertheless, the opportunity to test samples of real
synthetic drilling fluid fractions outweighed the scientific uncertainties, some of which are
addressed in later phases of this project. Additional measurements with fluids and cores from the
reservoirs represented by these mud fractions were presented recently (McCaffery et al., 2002).
2.1.2 Crude oils
More than 40 crude oil samples were used in various phases of this project. Details of
crude oil properties are summarized in Appendix II.
2.1.3 Brines
Brine recipes were selected to achieve pH buffering, varying levels of ionic strength, and
simulation of sea water and various reservoir brines. Brine recipes are given in Appendix III.
14
2.1.4 Mineral surfaces and surface treatments
Mica
Sheets of Muscovite mica were obtained from S & J Trading Inc. Large stacks of mica
were separated into samples a few layers thick. Sheets were cut into samples of about 1 cm by 2
cm for contact angle tests; a disc punch was used to cut circular samples with a diameter of 12.7
mm for AFM tests. Final cleaning was accomplished by pressing adhesive tape to top and
bottom layers and pulling apart slowly to expose two fresh surfaces.
2.1.5 Cores
Many oil recovery studies over the past 50 years have been made with a Berea sandstone
of about 500 md supplied by Cleveland Quarries. Results for this rock are designated Berea 500
in this report. Recently, rock ordered from this quarry has been in the range of 60 to 120md.
Other Berea samples on hand in our laboratory and some blocks supplied by industry provide a
wider range of permeability but still show distinct differences in properties to the Berea 500.
Properties of sandstones used in this project are summarized in each experimental section. In
addition to basic petrophysical properties, clay mineral types from x-ray analysis, BET surface
areas, and cation exchange capacities, are being determined for each rock.
2.2 Methods
2.2.1 Interfacial tension (oil/water interfaces)
Interfacial tension (IFT) measurements can be static, transient, or dynamic depending on
whether there are mass and surface area changes at the oil/brine interfaces with time (Ball et al.,
15
1996). Examples of static measurements are du Nouy ring and stationary Wilhelmy plate
methods, spinning and pendant drop methods are transient, and drop volume measurements are
an example of a dynamic measurement method. Two of these methods, the du Nouy ring and
pendant drop, have been used in this work.
du Nouy ring
The duNouy ring method (Adamson and Gast, 1997) was used with a Cahn balance
(DCA-312). Care must be taken to avoid contamination of the ring since a zero contact angle
between the two fluids at the interface is required for correct interpretation of the results. For
oil-soluble surfactant solutions, this means that the ring cannot pass through the oil phase before
the measurement, but must be lowered into the aqueous phase before the oil layer is added.
Minimum tensions that can be measured by this methods are about 1-2 mN/m.
Pendant drop
The pendant drop method was used to measure IFT between an aqueous phase and oil
(crude oil or oil plus oil-soluble surfactants) using an OCA20 pendant drop apparatus with
SCA20 analysis software (DataPhysics Instruments GmbH, Germany). In this system, a testing
liquid in a gas-tight needle syringe was delivered by electronic control through a connecting tube
and calibrated needle with a stepper motor. The liquid dosing system has a delivery range of
0.1-5µl/s. An image of the pendant drop formed at the tip of needle can be captured digitally and
then analyzed by the SCA 20 software (Dataphysics, 2003) and an interfaced computer. The high
speed CCD video camera system can do dynamic tracking analysis at a speed of 1 image/s. The
surface tension (SFT) or IFT was calculated by fitting the Laplace equation to the outline of the
drop (Adamson and Gast, 1997) using the following equation:
16
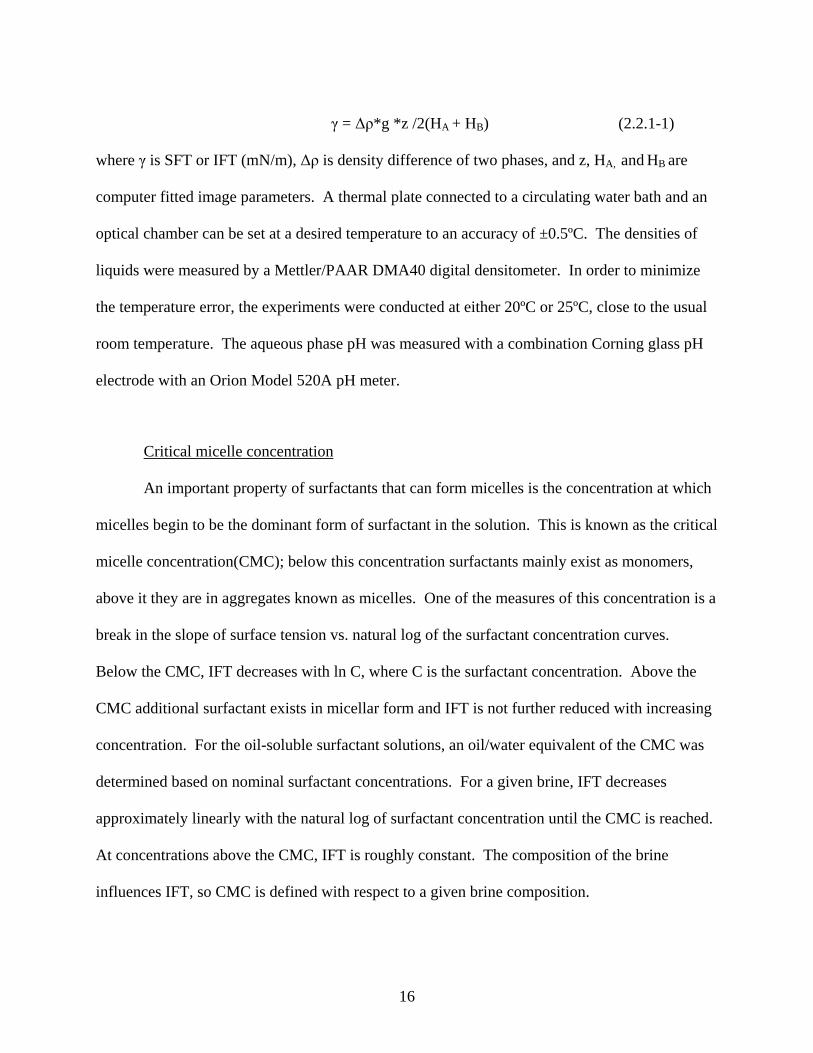
γ = ∆ρ*g *z /2(HA + HB) (2.2.1-1)
where γ is SFT or IFT (mN/m), ∆ρ is density difference of two phases, and z, HA, and HB are
computer fitted image parameters. A thermal plate connected to a circulating water bath and an
optical chamber can be set at a desired temperature to an accuracy of ±0.5ºC. The densities of
liquids were measured by a Mettler/PAAR DMA40 digital densitometer. In order to minimize
the temperature error, the experiments were conducted at either 20ºC or 25ºC, close to the usual
room temperature. The aqueous phase pH was measured with a combination Corning glass pH
electrode with an Orion Model 520A pH meter.
Critical micelle concentration
An important property of surfactants that can form micelles is the concentration at which
micelles begin to be the dominant form of surfactant in the solution. This is known as the critical
micelle concentration(CMC); below this concentration surfactants mainly exist as monomers,
above it they are in aggregates known as micelles. One of the measures of this concentration is a
break in the slope of surface tension vs. natural log of the surfactant concentration curves.
Below the CMC, IFT decreases with ln C, where C is the surfactant concentration. Above the
CMC additional surfactant exists in micellar form and IFT is not further reduced with increasing
concentration. For the oil-soluble surfactant solutions, an oil/water equivalent of the CMC was
determined based on nominal surfactant concentrations. For a given brine, IFT decreases
approximately linearly with the natural log of surfactant concentration until the CMC is reached.
At concentrations above the CMC, IFT is roughly constant. The composition of the brine
influences IFT, so CMC is defined with respect to a given brine composition.

17
2.2.2 Contact angles (oil/water/solid interfaces)
Clean mica.
To test the initial condition of mica, contact angles were measured with a captive drop of
double-distilled water on freshly cleaved mica submerged in purified decane. Contact angles
measured for water advancing against decane on clean mica surfaces that were aged for 24 hours
in selected brines were all less than 5°, as shown in Table 2.2.2-1.
Table 2.2.2-1. Water-advancing angles on clean mica
Water/decane advancing contact angles (°)
on mica substrates aged in:
Aging temperature pH 4, 0.01 M NaCl pH 8, 1 M NaCl SSW
ambient (~25°C) 3 1 2
60ºC 5 5 5
2.2.3 AFM
The AFM samples were imaged at ambient temperature in contact mode in air or under a
fluid (pH 8 brine, pH 10 brine, or water) using methods described by Lord and Buckley (2002).
The AFM used was a NanoScope IIIA (Veeco Instruments, Santa Barbara, CA), and the probes
used were Olympus Oxide-Sharpened Silicon Nitride (Model OTR4-35 100-µm cantilever,
Veeco Instruments, Santa Barbara, CA).
2.2.4 Preparation of MXW-F cores
Sandstone cores are initially very strongly water-wet (VSWW). Upon exposure to crude
oil, wettability can be altered to mixed-wet conditions (Morrow, 1990). In the studies presented

18
in this report, mixed-wet cores were prepared by equilibrating cores first with brine, then with
crude oil at an initial brine saturation (Swi). At this stage the wetting state is referred to as mixed-
wet (MXW). For the tests in these studies, crude oil was displaced with one of the following:
mineral oil, SBM base oil, or decalin followed by mineral oil. At this stage, a film of adsorbed
material determines core wetting, which is therefore referred to as MXW-F. Details of core
preparation influence the resulting wetting state and are presented in each of the core studies in
this report.
2.2.5 Rate of spontaneous imbibition
Results of spontaneous imbibition tests are presented as recovery vs. dimensionless time,
calculated using the following equation (Ma, et al., 1995, 1997):
2
1
cwoD L
kttµµ
σφ
= ……………………………… (2.2.5-1)
where cL is a characteristic length that compensates for sample size, shape and boundary
conditions; k is absolute permeability (md); σ is the oil/brine interfacial tension (mN/m); oµ is
the viscosity to oil (cp); wµ is the viscosity to brine (cp); φ is the porosity of rock sample and t
is the imbibition time (min). Temperature of measurement, Tm, for recovery of mineral oil by
spontaneous imbibition was ambient for all tests.
Reference curves for VSWW imbibition
The reference curve designated as Berea 250, Swi = 0% in Fig. 2.2.5-1 was obtained
based on the imbibition test results from two VSWW cores without initial water. The oil
recovery associated with this reference curve was calculated using the following equation
(Aronofsky et al., 1958):

19
)1( Dt
o eRR α−−= ……………………………….. (2.2.5-2) where 01881.0=α for the adopted experimental conditions and the tested core samples. The
other reference curve designated as Berea 250 Swi = 26 % is also presented in Fig. 2.2.5-1 for
comparison. An imbibition test was performed on core EV4-1 with an initial water saturation of
of 26 %. The Soltrol 220 /brine/ rock system for EV4-1 gave an Amott wettability index of 1, as
expected. Oil recovery reached almost 40% OOIP within 1 hour and increased by only 2%
thereafter. Although the wetting conditions associated with both curves shown in this figure
correspond to very strongly water-wet condition, compared to Berea 250, Swi = 0 % reference
curve, the Berea 250 Swi = 26% shows a shift toward slightly reduced rate and recovery. The
reduction in rate with the presence of initial water saturation is consistent with measurements for
Berea 500 reported by Viksund et al (1998).
0
10
20
30
40
50
60
70
80
90
100
1 10 100 1000 10000 100000tD
Rim
, %O
OIP
EV4-1 254 26EV4-6 188 0EV4-7 358 0reference curve
Core kg (md) Swi (%)
Soltrol 220Minnelusa RBTf = Tm = 21oC
Berea 250 Swi = 26 %
Berea 250 Swi = 0
Figure 2.2.5-1. Spontaneous imbibition characteristics for very strongly water-wet cores with 0 % and 26 % initial water saturation.

20
Figure 2.2.5-2 compares the three reference curves based on the cores with permeability
of about 90, 250 and 500 md. These curves are designated as Berea 90, Berea 250 and Berea
500 respectively. The Berea 500 reference curve is well separated from the curves for Berea 90
and Berea 250. However, the Berea 500 result agrees with a wide range of other rock types and
synthetic materials (Viksund et al., 1998).
0102030405060708090
100
1 10 100 1000 10000 100000
tD
Rim
, %O
OIP Berea 500 Swi = 0 %
Berea 90 Swi = 0 %
Berea 250 Swi = 0 %
Soltrol 220Tm = 21oC
Figure 2.2.5-2. Rim vs. tD for cores with different permeability at Swi = 0%
2.2.6 Amott wettability indices
After spontaneous imbibition the core was set in a core holder and the additional oil
recovery was given by forced displacement at 0.5 cc/min. As a check on determining that a
robust residual oil had been achieved the flow rate was increased in steps to 1.0cc/min, 2.0cc/min
and then 3.0 cc/min. If oil continued to be produced after the flow rate had been increased to
3.00 cc/min, the recovery after injection of 3 PV at this rate was used as the forced imbibition
end point. The Amott index to water was calculated using the following equation:

21
ofoi
oiw VV
VI
+= …………………………. (2.2.6-1)
where V is volume, subscript o is displaced oil, and subscripts i and f refer to displacement first
by spontaneous imbibition, then by forced displacement, respectively. Thus Voi is the volume of
oil displaced by spontaneous imbibition of water and Vof is the additional volume of oil produced
by forced displacement after imbibition. The Amott wettability index to oil was measured from
spontaneous and forced imbibition of oil and calculated using equation 2.2.6-2.
wiwf
wio VV
VI
+= ……………………………. (2.2.6-2)
where the volumes are analogous to those defined above except that water is being displaced by
oil.
A combined index, called the Amott-Harvey wettability index, HAI − , is ow II − (Boneau and
Clampitt, 1977). Cuiec (1990) suggested the classification of wettability from the Amott index
shown in Table 2.2.6-1.
Table 2.2.6-1 Interpretation of Wettability Indices
IAmott -1 -0.3 -0.1 +0.1 +0.3 +1
wettability oil wet slightly oil wet neutral slightly
water wet water wet
2.2.7 Asphaltene stability
Evaluation of asphaltene stability is needed to understand the effect that asphaltenes have
with regard to wetting and other interfacial phenomena. Microscopic observation of asphaltene
flocs is used to detect the onset of asphaltene instability in mixtures of crude oils with solvents.

22
Solvency is approximated by measurements of mixture refractive index, as described in detail
elsewhere (Buckley et al., 1998a; Wang, 2000; Wang and Buckley, 2001).

23
3. Results and Discussion
3.1 Interfacial tensions (Bryant, Skalli, Fan, and Buckley)
3.1.1 Oil soluble surfactants and buffers
IFTs of oil-soluble surfactant solutions were measured with either the duNouy ring or the
pendant drop technique. The lower limit of the ring method for measurements of IFT is in the
range of 1-2 dyn/cm. The lower limit of the pendant drop technique depends on needle diameter,
but it may be as low as 0.5 dyn/cm. Lower values of IFT should be considered to be estimates
and CMC values based on these low IFTs should be considered to be lower limits on the actual
CMC values.
Polyethoxylated amines
Figure 3.1.1-1 shows the results of pendant drop measurements of IFT as a function of
surfactant concentration. These results were used to determine an oil/water CMC of the three
polyethoxylated amine surfactants with pH 4 brine. The CMC with pH 4 was 0.20 mM (0.06%
by volume) for CAM-2, 0.04 mM (0.02% by volume) for TAM-2, and 0.0047 mM (0.003% by
volume) for TAM-5, where the molar concentrations were calculated assuming the surfactants
were pure as received. The CMCs for the surfactant/decane solution with pH 8 buffer or double-
distilled water were greater than the values reported here for pH 4 buffer (Bryant, 2004). The
concentration (5% by volume) of surfactant solution used for treatment of the mica was much
greater than the CMCs of the surfactants.

24
-4 -3 -2 -1 0 1log concentration (mM)
0
10
20
30
40
IFT
(mN
/m)
-4 -3 -2 -1 0 1log concentration (mM)
0
10
20
30
40
50
IFT
(mN
/m)
Figure 3.1.1-1. Plots of interfacial tension (IFT) as a function of log concentration were used to determine the CMC for a) CAM-2 b) TAM-2 and c) TAM-5 with pH 4 buffer.
Commercial surfactant mixtures
Mixtures of commercial OBM and SBM surfactants were prepared in decane.
Concentrations are nominal, based on the amount of surfactant product as received. Actual
-4 -3 -2 -1 0 1log concentration (mM)
0
10
20
30
40IF
T (n
M/m
)
CMC = 0.20 mM (0.06% by volume)
CMC = 0.04 mM (0.02% by volume)
CMC = 0.0047 mM (0.003% by volume)
a) b)
c)
CAM-2 TAM-2
TAM-5
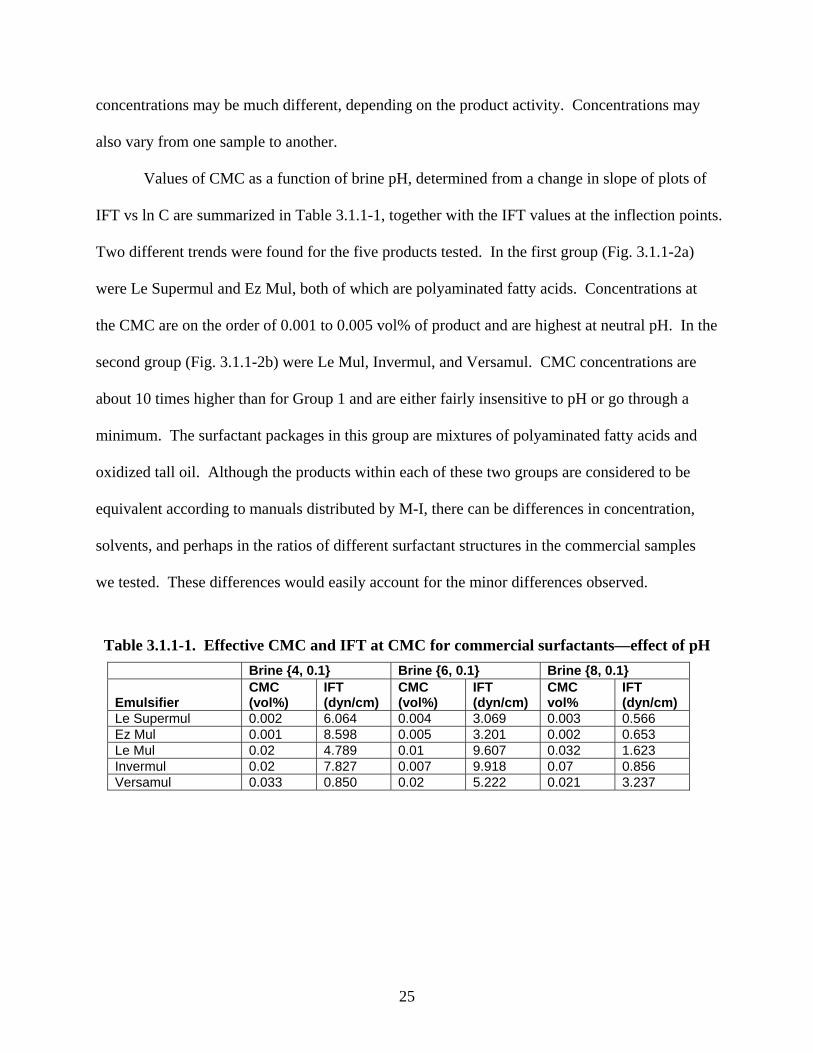
25
concentrations may be much different, depending on the product activity. Concentrations may
also vary from one sample to another.
Values of CMC as a function of brine pH, determined from a change in slope of plots of
IFT vs ln C are summarized in Table 3.1.1-1, together with the IFT values at the inflection points.
Two different trends were found for the five products tested. In the first group (Fig. 3.1.1-2a)
were Le Supermul and Ez Mul, both of which are polyaminated fatty acids. Concentrations at
the CMC are on the order of 0.001 to 0.005 vol% of product and are highest at neutral pH. In the
second group (Fig. 3.1.1-2b) were Le Mul, Invermul, and Versamul. CMC concentrations are
about 10 times higher than for Group 1 and are either fairly insensitive to pH or go through a
minimum. The surfactant packages in this group are mixtures of polyaminated fatty acids and
oxidized tall oil. Although the products within each of these two groups are considered to be
equivalent according to manuals distributed by M-I, there can be differences in concentration,
solvents, and perhaps in the ratios of different surfactant structures in the commercial samples
we tested. These differences would easily account for the minor differences observed.
Table 3.1.1-1. Effective CMC and IFT at CMC for commercial surfactants—effect of pH Brine {4, 0.1} Brine {6, 0.1} Brine {8, 0.1} Emulsifier
CMC (vol%)
IFT (dyn/cm)
CMC (vol%)
IFT (dyn/cm)
CMC vol%
IFT (dyn/cm)
Le Supermul 0.002 6.064 0.004 3.069 0.003 0.566 Ez Mul 0.001 8.598 0.005 3.201 0.002 0.653 Le Mul 0.02 4.789 0.01 9.607 0.032 1.623 Invermul 0.02 7.827 0.007 9.918 0.07 0.856 Versamul 0.033 0.850 0.02 5.222 0.021 3.237
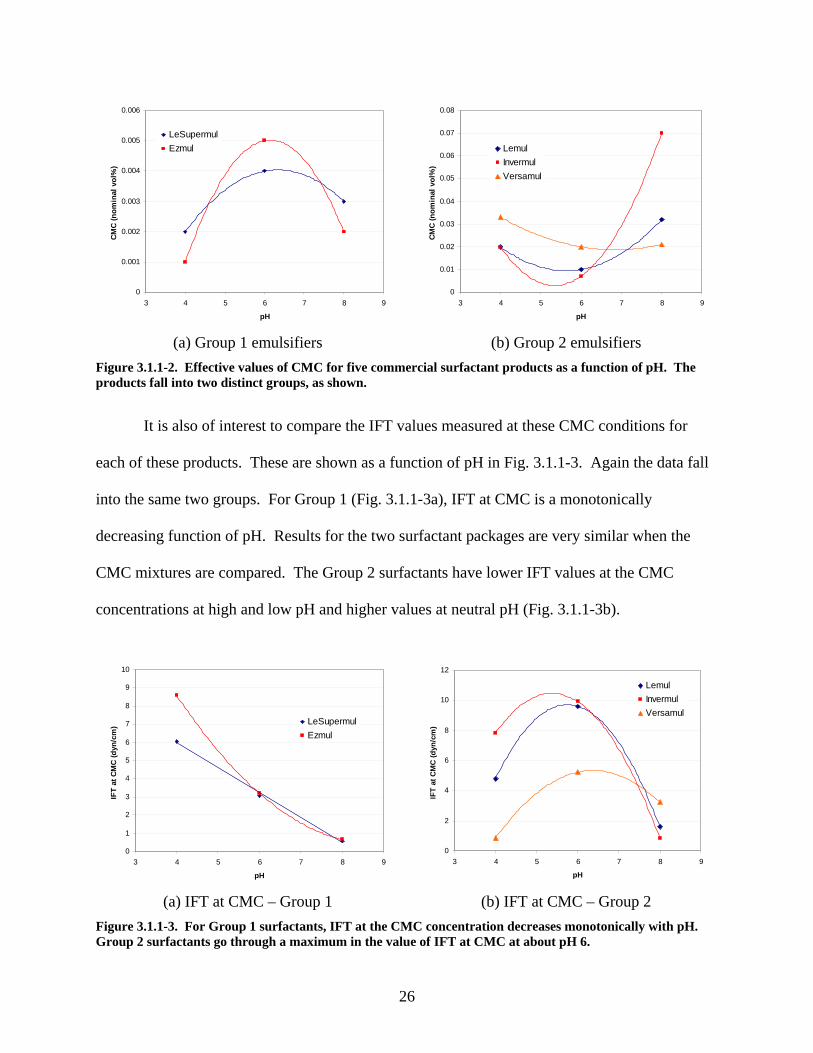
26
0
0.001
0.002
0.003
0.004
0.005
0.006
3 4 5 6 7 8 9
pH
CM
C (n
omin
al v
ol%
)
LeSupermulEzmul
0
0.01
0.02
0.03
0.04
0.05
0.06
0.07
0.08
3 4 5 6 7 8 9
pH
CM
C (n
omin
al v
ol%
)
LemulInvermulVersamul
(a) Group 1 emulsifiers (b) Group 2 emulsifiers
Figure 3.1.1-2. Effective values of CMC for five commercial surfactant products as a function of pH. The products fall into two distinct groups, as shown.
It is also of interest to compare the IFT values measured at these CMC conditions for
each of these products. These are shown as a function of pH in Fig. 3.1.1-3. Again the data fall
into the same two groups. For Group 1 (Fig. 3.1.1-3a), IFT at CMC is a monotonically
decreasing function of pH. Results for the two surfactant packages are very similar when the
CMC mixtures are compared. The Group 2 surfactants have lower IFT values at the CMC
concentrations at high and low pH and higher values at neutral pH (Fig. 3.1.1-3b).
0
1
2
3
4
5
6
7
8
9
10
3 4 5 6 7 8 9
pH
IFT
at C
MC
(dyn
/cm
) LeSupermulEzmul
0
2
4
6
8
10
12
3 4 5 6 7 8 9
pH
IFT
at C
MC
(dyn
/cm
)
LemulInvermulVersamul
(a) IFT at CMC – Group 1 (b) IFT at CMC – Group 2
Figure 3.1.1-3. For Group 1 surfactants, IFT at the CMC concentration decreases monotonically with pH. Group 2 surfactants go through a maximum in the value of IFT at CMC at about pH 6.

27
The two groups of surfactants show different behavior when IFT is plotted as a function
of concentration (Fig. 3.1.1-4), using the data plotted in Figs. 3.1.1-2 and 3.1.1-3 above. For
Group 2 (Fig. 3.1.1-4b), IFT appears to be generally a function of concentration whereas for
Group 1 (Fig. 3.1.1-4a), there appears to be a tendency toward lower IFT at pH 8, regardless of
concentration.
0
2
4
6
8
10
12
0 0.001 0.002 0.003 0.004 0.005 0.006
C (vol%)
IFT
(dyn
/cm
)
468
Group 1
0
2
4
6
8
10
12
0 0.02 0.04 0.06 0.08
C (vol%)
IFT
(dyn
/cm
)
468
Group 2
(a) IFT vs. concentration – Group 1 (b) IFT vs. concentration – Group 2
Figure 3.1.1-4. For Group 2 surfactants, the main control over IFT at CMC is concentration; Group 1 surfactants have the lowest values of IFT at CMC when the pH is 8, regardless of concentration.
Finally, IFTs of two of the surfactants, one from each group, were measured at constant
concentrations above and below CMC as a function of pH (Fig. 3.1.1-5). The Group 1 surfactant,
Le Supermul, was tested at 0.001 and 0.01 vol% (Fig. 3.1.1-5a). At the very low concentration
there was considerable scatter in the data, but in general IFT was lower above neutral pH and
higher below. The pattern of the Group 2 surfactant, Invermul, was clear for both the low
concentration (0.005%) and the high one (0.1%); IFT was highest at neutral pH and lower at both
low and high pH (Fig. 3.1.1-5b).
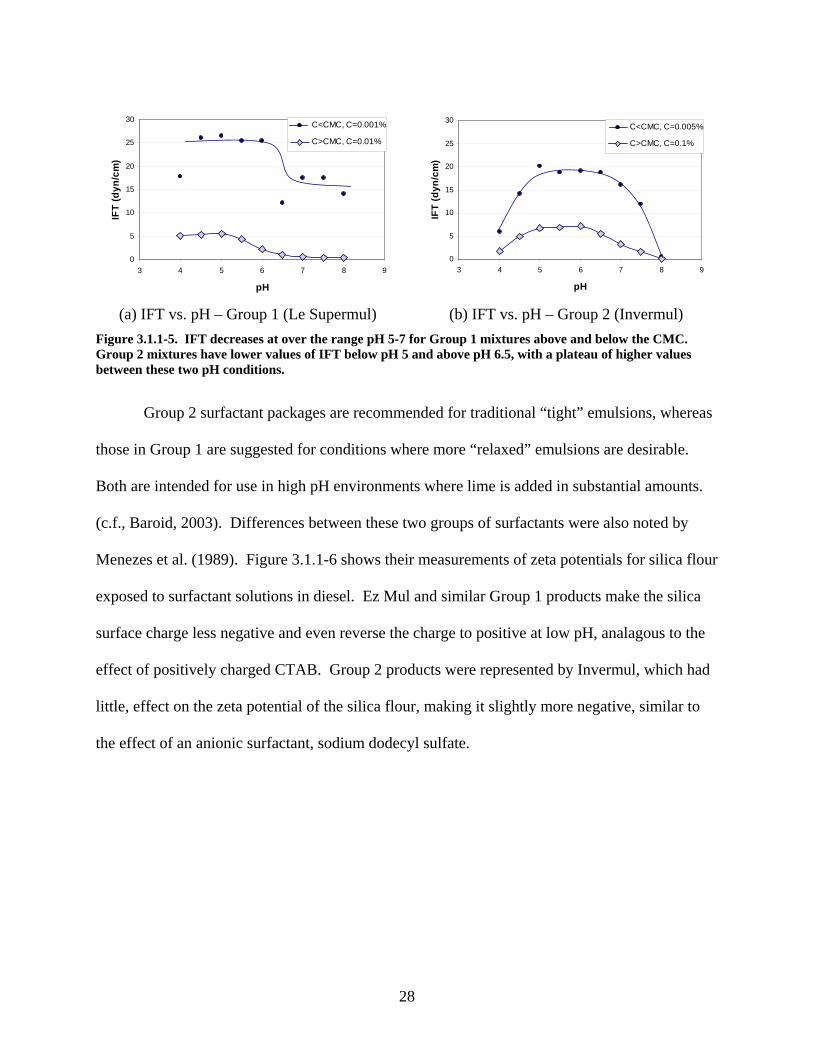
28
0
5
10
15
20
25
30
3 4 5 6 7 8 9
pH
IFT
(dyn
/cm
)C<CMC, C=0.001%
C>CMC, C=0.01%
0
5
10
15
20
25
30
3 4 5 6 7 8 9
pH
IFT
(dyn
/cm
)
C<CMC, C=0.005%
C>CMC, C=0.1%
(a) IFT vs. pH – Group 1 (Le Supermul) (b) IFT vs. pH – Group 2 (Invermul)
Figure 3.1.1-5. IFT decreases at over the range pH 5-7 for Group 1 mixtures above and below the CMC. Group 2 mixtures have lower values of IFT below pH 5 and above pH 6.5, with a plateau of higher values between these two pH conditions.
Group 2 surfactant packages are recommended for traditional “tight” emulsions, whereas
those in Group 1 are suggested for conditions where more “relaxed” emulsions are desirable.
Both are intended for use in high pH environments where lime is added in substantial amounts.
(c.f., Baroid, 2003). Differences between these two groups of surfactants were also noted by
Menezes et al. (1989). Figure 3.1.1-6 shows their measurements of zeta potentials for silica flour
exposed to surfactant solutions in diesel. Ez Mul and similar Group 1 products make the silica
surface charge less negative and even reverse the charge to positive at low pH, analagous to the
effect of positively charged CTAB. Group 2 products were represented by Invermul, which had
little, effect on the zeta potential of the silica flour, making it slightly more negative, similar to
the effect of an anionic surfactant, sodium dodecyl sulfate.
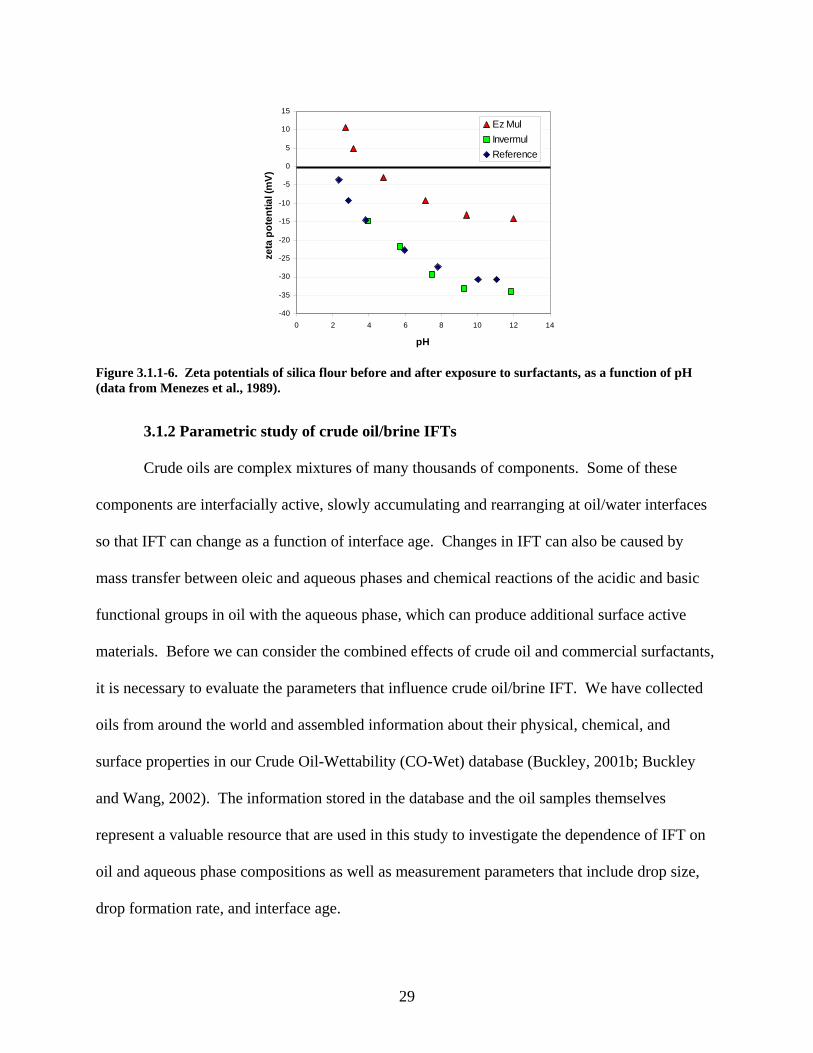
29
-40
-35
-30
-25
-20
-15
-10
-5
0
5
10
15
0 2 4 6 8 10 12 14
pH
zeta
pot
entia
l (m
V)
Ez MulInvermulReference
Figure 3.1.1-6. Zeta potentials of silica flour before and after exposure to surfactants, as a function of pH (data from Menezes et al., 1989).
3.1.2 Parametric study of crude oil/brine IFTs
Crude oils are complex mixtures of many thousands of components. Some of these
components are interfacially active, slowly accumulating and rearranging at oil/water interfaces
so that IFT can change as a function of interface age. Changes in IFT can also be caused by
mass transfer between oleic and aqueous phases and chemical reactions of the acidic and basic
functional groups in oil with the aqueous phase, which can produce additional surface active
materials. Before we can consider the combined effects of crude oil and commercial surfactants,
it is necessary to evaluate the parameters that influence crude oil/brine IFT. We have collected
oils from around the world and assembled information about their physical, chemical, and
surface properties in our Crude Oil-Wettability (CO-Wet) database (Buckley, 2001b; Buckley
and Wang, 2002). The information stored in the database and the oil samples themselves
represent a valuable resource that are used in this study to investigate the dependence of IFT on
oil and aqueous phase compositions as well as measurement parameters that include drop size,
drop formation rate, and interface age.

30
Fluids
Three aqueous phase compositions were selected for study: double-distilled water
(DDW), 0.1M NaCl, or synthetic sea-water (SSW). The pH of DDW and 0.1M NaCl solutions
were adjusted by addition of small amounts of HCl or NaOH. Two recipes were used for
synthetic seawater, differing only in the presence or absence of sodium bicarbonate.
A wide range of crude oil samples have been collected and characterized in previous
studies of the effects on reservoir wetting of crude oils and their asphaltene components
(Buckley, 2001b, Buckley and Wang, 2002). Most previous studies of crude oil interfacial
tensions focus on one or at most a few crude oil samples (e.g., Reisberg and Doscher, 1956;
Freer et al. 2003). Given the complexity of crude oil composition, physically meaningful
correlations to crude oil properties cannot be expected on the basis of studies of only a few
samples.
Drop formation time
Since IFT is expected to change with time, the effect of drop formation time was
considered. Figure 3.1.2-1 shows the effect of varying drop formation time on the initial and
final IFT measurements (designated IFT(0) and IFT (eq), respectively) for a drop of SQ-95 oil in
0.1M NaCl. Data recording began about 0.1 s after the drop reached a volume of 10 µl. When
the formation time was less than 3 s, IFT(0) was nearly constant at a value of 22.5mN/m;
however longer drop formation times resulted in lower initial estimates of IFT. IFT(eq) is the
IFT measured after 2000 s (about one-half hour). This value increased slightly with increasing
drop formation time, from about 12 to 13 mN/m.

31
IFT of SQ-95/0.1M NaCl
0
5
10
15
20
25
0 20 40 60 80 100
Drop Formation Time (s)
IFT
(mN/
m)
IFT (0)IFT(eq)
Figure 3.1.2-1 Impact of drop formation time on IFT.
Measurement protocol and fits of IFT vs. time
For the following studies of crude oil IFT, a needle with OD of 0.7 mm was used to form
a 10 µl drop. Drop formation time was 2 s. Data recording began immediately after drop
volume reached 10 µl and continued for 2000 seconds.
A model equation for IFT vs. time of asphaltene solutions was proposed by Jeribi et al.
(2002), based on similar phenomena of rapid diffusion to an interface, followed by slow
rearrangement reported for proteins. The data were fit to an equation of the form:
τγγγγ /)( teqoeq e−∗−+= 3.1.2-1
where γ is interfacial tension (mN/m) with subscripts eq=equilibrium, and o=zero time or initial,
t is time, τ is a characteristic time constant with the same units as time, t.
Equation 3.1.2-1 gives reasonable fits to data for a wide range of results. In many cases,
however, the first IFT measurement, recorded within one or two seconds of drop formation was

32
not well captured by fits to the rest of the interfacial tension vs. time data. In order to capture all
of the observations, data records include the first measured IFT value as well as the initial and
final (or equilibrium) values and τ from the best fits. Data are summarized in Appendix IV.
Low tension limit
The pendant drop method of IFT measurement requires that a stable drop be formed. At
tensions less than about 1 mN/m, oil streams continuously out of the drop-forming needle as
shown in Fig. 3.1.2-2. Accurate measurements can be made by other methods, such as the
spinning drop technique (Adamson and Gast, 1997), but such observations were beyond the
scope of the present study.
Figure 3.1.2-2. C-F2-00 streaming upwards when emerging from needle into pH = 10.9 0.1M NaCl.
An overview of IFT measurements for all crude oils and brines
Linear multivariate statistical analysis of all of the final or equilibrium IFT data in
Appendix IV produces the correlation shown in Fig. 3.1.2-3. Many crude oil properties
accumulated in the CO-Wet database were examined. Density, refractive index, amounts of
saturates, aromatics, and resins, and iso-electric point showed no significant correlation with IFT.
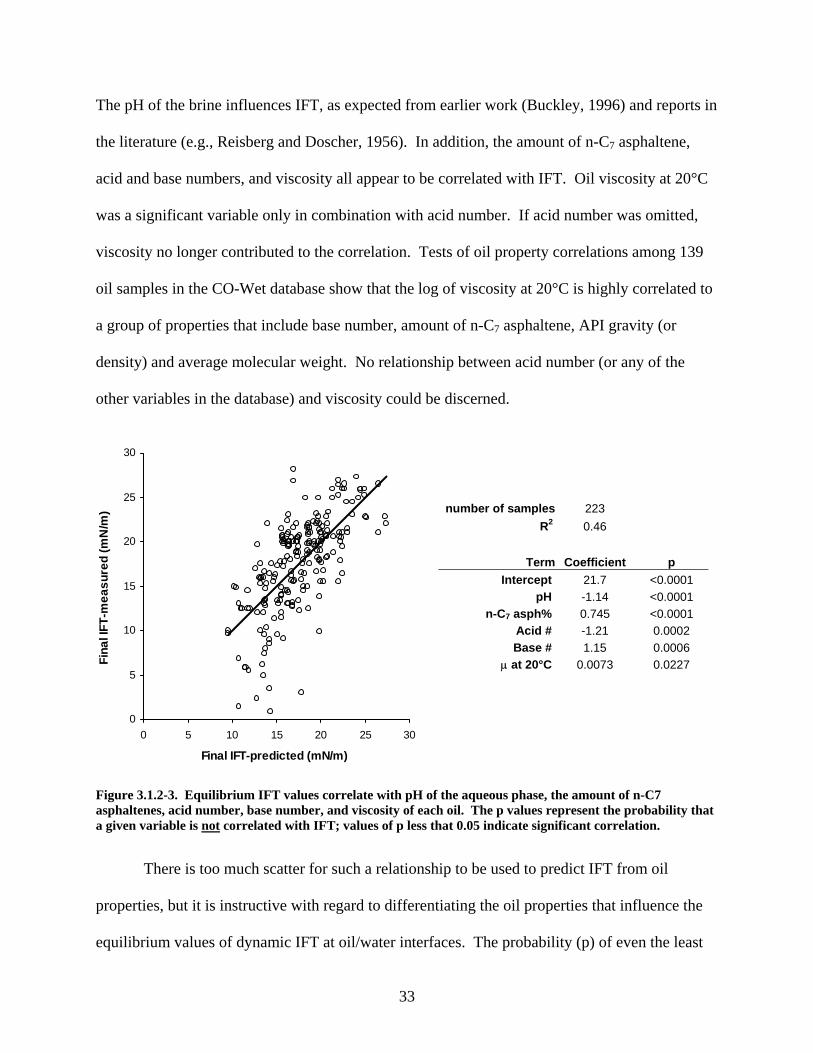
33
The pH of the brine influences IFT, as expected from earlier work (Buckley, 1996) and reports in
the literature (e.g., Reisberg and Doscher, 1956). In addition, the amount of n-C7 asphaltene,
acid and base numbers, and viscosity all appear to be correlated with IFT. Oil viscosity at 20°C
was a significant variable only in combination with acid number. If acid number was omitted,
viscosity no longer contributed to the correlation. Tests of oil property correlations among 139
oil samples in the CO-Wet database show that the log of viscosity at 20°C is highly correlated to
a group of properties that include base number, amount of n-C7 asphaltene, API gravity (or
density) and average molecular weight. No relationship between acid number (or any of the
other variables in the database) and viscosity could be discerned.
0
5
10
15
20
25
30
0 5 10 15 20 25 30
Final IFT-predicted (mN/m)
Fina
l IFT
-mea
sure
d (m
N/m
)
number of samples 223
R2 0.46
Term Coefficient p Intercept 21.7 <0.0001
pH -1.14 <0.0001 n-C7 asph% 0.745 <0.0001
Acid # -1.21 0.0002 Base # 1.15 0.0006
µ at 20°C 0.0073 0.0227
Figure 3.1.2-3. Equilibrium IFT values correlate with pH of the aqueous phase, the amount of n-C7 asphaltenes, acid number, base number, and viscosity of each oil. The p values represent the probability that a given variable is not correlated with IFT; values of p less that 0.05 indicate significant correlation.
There is too much scatter for such a relationship to be used to predict IFT from oil
properties, but it is instructive with regard to differentiating the oil properties that influence the
equilibrium values of dynamic IFT at oil/water interfaces. The probability (p) of even the least

34
significant variable (viscosity) not being correlated with IFT is less than 0.023, showing that all
the variables listed are significant. Increasing amount of n-C7 asphaltene, higher base number
and higher viscosity correspond to higher IFT with brine of a given pH. The correlation with pH
is negative because large decreases in IFT can occur at the highest pHs tested in this study. IFT
can also decrease at low pH, but over the range studied, this effect was much smaller. Increasing
acid number contributed to a decrease in IFT. There is some coupling between the significance
of viscosity and acid number; if acid number was omitted from the parameter set, viscosity was
not correlated significantly with IFT, although the reverse was not true. As might be expected,
correlation coefficients are low for any one variable with the highest being n-C7 asphaltene
amount (R2 = 0.23) and the acid number the lowest (R2 = 0.01). Better correlations can be
obtained by separating the data into different aqueous phase pH and composition ranges and
focusing on the effect of oil properties.
Impact of pH on IFT of crude oil
Two groups of seven crude oils each were selected for comparisons of the effect of pH on
magnitude of IFT. Oils in the first group have low acid numbers (less than 0.1 mg KOH/g oil)
and a typical range of base numbers. The second group contains oils with fairly high base and
acid numbers.
The seven crude oils with low acid numbers are listed in Table 3.1.2-1, acid numbers
ranged from 0.08 mg KOH/g oil to unmeasureable values (<0.01 mg KOH/g oil). Base numbers
range from 0.11 to 2.5. IFT(0) and IFT(eq) are plotted in Fig. 3.1.2-4a-g for DDW and for 0.1
M NaCl with pH adjusted by addition of NaOH or HCl.

35
Table 3.1.2-1. Properties of oils with low acid number and varying base number
Oil ID Acid # Base # n-C7 asphaltene (wt%)
Viscosity (cP) at 20°C
C-R-01 <0.01 0.40 1.30 17.8 Minnelusa-02 0.01 2.01 8.75 58.2 B-1-00 0.04 0.85 0.62 4.7 Cottonwood-03 0.04 1.87 2.51 26.1 C-Lb-01 0.05 2.50 1.60 22.6 P-VE-00 0.05 1.54 3.43 16.9 C-Br-01 0.08 0.11 0.05 1.2
All the low-acid-number oils have fairly constant IFT(0) and IFT(eq) when pH was lower
than 6.4. At pH 8.9 for oils C-R-01 and C-Br-01 and at pH 10.8 for the remainder of the oils, the
IFT(eq) decreased abruptly.
The seven high-acid number crude oils are listed in Table 3.1.2-2 in order of increasing
acid number. Plots of initial and equilibrium IFT as a function of pH in DDW and 0.1 M NaCl
are given in Fig. 3.1.2-5a-g.
Table 3.1.2-2. Properties of oils with high acid and base numbers
Oil ID Acid # Base # n-C7 asphaltene (wt%)
Viscosity (cP) at 20°C
C-F2-03 0.70 1.32 1.97 28.6 E-1XD-00 1.56 2.98 2.54 137.4 LB-03 1.57 0.59 0.07 13.1 GOM(2)-00 2.02 1.79 8.63 122.3 C-K-01 2.44 5.19 3.46 393.6 E-1XO-00 3.42 2.57 0.76 15.3 Mars-P 3.92 2.30 4.77 481.1
For all oils, the lowest IFT values were obtained with the highest pH brines. Equilibrium
IFT values are lower than initial IFTs. At the same pH, the IFT measured with 0.1 M NaCl were
equal to or less than the IFT with DDW.
Low-acid-number oils, had high-pH IFT values that were measurable by the pendant drop
technique, whereas for six of the seven oils with higher acid numbers, IFTs with the highest pH
aqueous solutions, whether DDW or NaCl, were so low that a stable drop could not be formed.

36
Additional comparisons are shown in Fig. 3.1.2-6 where the equilibrium IFT values for
each oil are replotted for low-acid-number (Fig. 9a for DDW and 9b for 0.1 M NaCl) and higher-
acid-number (Fig. 3.1.2-6c for DDW and 3.1.2-6d for 0.1 M NaCl) oils. It is difficult to see any
clear trends either among the oils in either of these groups or between the two groups. There are
oils whose IFT changes little with addition of NaCl in both groups (Minnelusa-02 in Fig. 3.1.2-
4b, B-1-00 in Fig. 3.1.2-4c, LB-03 in Fig 3.1.2-5c, E-1XO-00 in Fig. 3.1.2-5f, and Mars-P in Fig.
3.1.2-5g). The maximum and minimum equilibrated values of IFT at near-neutral pH are similar
for both groups, as are the differences between initial and equilibrated values of IFT. One
difference was observed: the value of IFT(0) – IFT(eq) at acidic conditions was found to be a
linear function of the log of viscosity, especially for Group 1 oils, as shown in Fig. 3.1.2-7.

37
(a) C-R-01
0
5
10
15
20
25
30
2 3 4 5 6 7 8 9 10 11 12
pH
IFT
(mN
/m)
(b) Minnelusa-02
0
5
10
15
20
25
30
2 3 4 5 6 7 8 9 10 11 12
pH
IFT
(mN/
m)
(c) B-1-00
0
5
10
15
20
25
30
2 3 4 5 6 7 8 9 10 11 12
Drop Age (s)
IFT
(mN/
m)
(d) Cottonwood-03
0
5
10
15
20
25
30
2 3 4 5 6 7 8 9 10 11 12
pH
IFT
(mN
/m)
(e) C-Lb-01
0
5
10
15
20
25
30
2 3 4 5 6 7 8 9 10 11 12
pH
IFT
(mN
/m)
(f) P-VE-00
0
5
10
15
20
25
30
2 3 4 5 6 7 8 9 10 11 12
pH
IFT
(mN
/m)
(g) C-Br-01
0
5
10
15
20
25
30
2 3 4 5 6 7 8 9 10 11 12
pH
IFT
(mN
/m)
IFT(0)-DDWIFT(eq)-DDWIFT(0)-NaClIFT(eq)-NaCl
Figure 3.1.2-4. IFT as a function of pH for the low-acid-number crude oils.
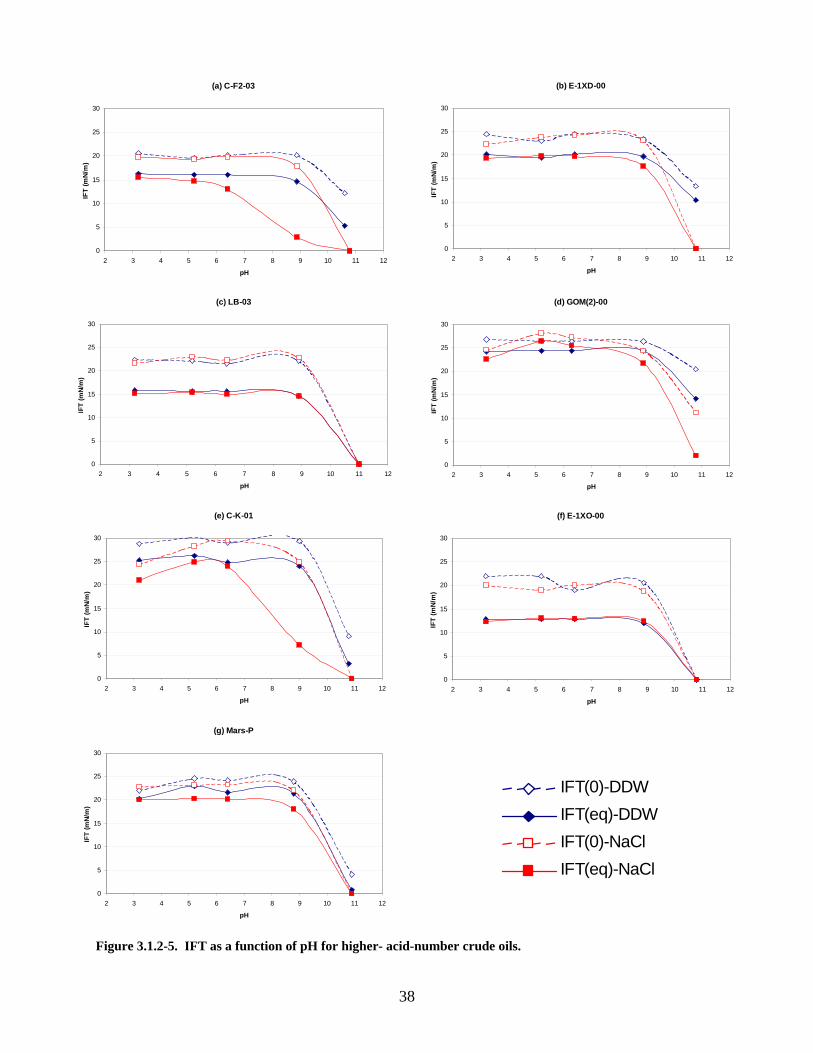
38
(a) C-F2-03
0
5
10
15
20
25
30
2 3 4 5 6 7 8 9 10 11 12
pH
IFT
(mN/
m)
(b) E-1XD-00
0
5
10
15
20
25
30
2 3 4 5 6 7 8 9 10 11 12
pH
IFT
(mN
/m)
(c) LB-03
0
5
10
15
20
25
30
2 3 4 5 6 7 8 9 10 11 12
pH
IFT
(mN
/m)
(d) GOM(2)-00
0
5
10
15
20
25
30
2 3 4 5 6 7 8 9 10 11 12
pH
IFT
(mN
/m)
(e) C-K-01
0
5
10
15
20
25
30
2 3 4 5 6 7 8 9 10 11 12
pH
IFT
(mN
/m)
(f) E-1XO-00
0
5
10
15
20
25
30
2 3 4 5 6 7 8 9 10 11 12
pH
IFT
(mN/
m)
(g) Mars-P
0
5
10
15
20
25
30
2 3 4 5 6 7 8 9 10 11 12
pH
IFT
(mN
/m)
IFT(0)-DDWIFT(eq)-DDWIFT(0)-NaClIFT(eq)-NaCl
Figure 3.1.2-5. IFT as a function of pH for higher- acid-number crude oils.

39
0
5
10
15
20
25
30
0 2 4 6 8 10 12 14
pH
IFT
(dyn
/cm
)
Minnelusa-02P-VE-00B-1-00Cottonwood-03C-Br-01C-R-01C-Lb-01
(a) Group 1 oils - DDW
0
5
10
15
20
25
30
0 2 4 6 8 10 12 14
pH
IFT
(dyn
/cm
)
(b) Group 1 oils - 0.1 M NaCl
0
5
10
15
20
25
30
- 2.0 4.0 6.0 8.0 10.0 12.0 14.0
pH
IFT
(dyn
/cm
)
C-K-01GOM(2)-00Mars-PE-1XD-00C-F2-03LB-03E-1XO-00
(c) Group 2 oils - DDW
0
5
10
15
20
25
30
0 2 4 6 8 10 12 14
pH
IFT
(dyn
/cm
)
(d) Group 2 oils - 0.1 M NaCl
Figure 3.1.2-6. Summary of IFT(eq) data for crude oils measured against pH-adjusted DDW and 0.1M NaCl solutions.

40
y = -1.2083Ln(x) + 6.4428R2 = 0.9902
0
1
2
3
4
5
6
7
1 10 100
Viscosity (cP) (Log)
IFT(
0)-IF
T(eq
)
0123456789
1 10 100 1000
viscosity (cP)(Ln)
IFT(
0)-IF
T(eq
)
(a) Group 1, low acid number oils (b) Group 2, higher acid and base number oils Figure 3.1.2-7. At acidic conditions, the change in IFT with time correlates with log (viscosity).
Comparison of IFT of different crude oils at constant pH
Three pH ranges were selected for examination. Within each range, the data were further
subdivided according to the composition of the aqueous phase, which falls into one of the
following three categories:
• distilled water to which small amounts of HCl or NaOH were added to adjust pH,
• 0.1M NaCl to which small amounts of HCl or NaOH were added to adjust pH, and
• synthetic sea water (at near-neutral conditions only).
Crude oils tested at each of these conditions are indicated in Table 3.1.2-3. Table 3.1.2-4
summarizes fits to all of the data in each subgroup. For comparison, the same set of variables (n-
C7 asphaltenes, acid number, base number, and viscosity) was used for all of these correlations,
although not all four of these variables are significant in every case. Values of p greater than
0.05 that indicate a higher probability of including that variable erroneously are indicated by the
shaded boxes. Removing those variables from the group would change the magnitudes of the
remaining coefficients somewhat, but in no case were the signs of those coefficients changed.

41
Table 3.1.2-3. Summary of crude oils tested in each pH and brine composition subgroup DDW 0.1M NaCl SSW 3 6 9 3 6 9 6 B-1-00 x x x x x x
C-A1-00 x x C-AG-03 x x C-AL-03 x x C-Br-01 x x x x x x C-F2-03 x x x x x x
C-GC-T1-03 x x C-K-01 x x x x x x
C-Lb-01 x x x x x x C-R-01 x x x x x x C-T-02 x x
Cottonwood-03 x x x x x x E-1XCO-01 x x
E-1XD-00 x x x x x x x E-1XFR-01 x x
E-1XO-00 x x x x x x x E-2XR-00 x x
E-8XFR-01 x x E-BL-00 x x
E-S1XCA-01 x x E-S1XG-01 x x E-S1XL-01 x x E-S3XR-01 x x GOM(2)-00 x x x x x x Gullfaks-96 x
LB-03 x x x x x x x Mars-P x x x x x x
Minnelusa-02 x x x x x x Minnelusa-03 x x
MY2-02 x x x x x x x MY3-02 x x x x x x x MY4-02 x x x x x x x P-VE-00 x x x x x x
SQ-95 x x x S-Ven-39 x x S-Ven-40 x x S-Ven-41 x x
Tensleep-99 x x x W-Br-03 x x W-Lo-03 x

42
Table 3.1.2-4. Summary of pH and brine composition subgroup correlations with standard variables
pH n R2 Intercept n-C7 asph% Acid # Base # µ at 20°C p value p value p value p value p value
DDW 3 19 0.54 17.9338 0.4118 -1.7064 0.7572 0.0165
<0.0001 0.0851 0.0136 0.2298 0.0242
6 43 0.46 18.2559 0.4609 -1.6492 0.8548 0.0114
<0.0001 0.0077 0.0009 0.0853 0.0103
9 23 0.48 13.8502 0.7058 -1.3953 1.5510 0.0138
<0.0001 0.0450 0.0784 0.0873 0.1206
0.1M NaCl 3 17 0.72 16.8837 0.6018 -1.2887 -0.0738 0.0145
<0.0001 0.0017 0.0075 0.8584 0.0056
6 20 0.69 11.5694 1.2503 -0.9129 2.0867 0.0017
<0.0001 0.0005 0.2543 0.0148 0.8431
9 15 0.48 6.3557 1.2070 0.6351 2.2863 -0.0037 0.0227 0.0306 0.6269 0.1820 0.7986
SSW 6 25 0.28 14.7631 0.5721 -2.0157 1.3697 0.0092
<0.0001 0.1405 0.0995 0.2555 0.3135
The best correlations with the standard group of oil properties were obtained for IFT
measured with 0.1M NaCl solutions at all three pH conditions. For synthetic seawater, none of
the standard variables were significant. The largest data sets were for measurements with
distilled water results. Despite the availability of more data, correlations at all three pH
conditions were not as good as those for the 0.1M NaCl solutions. Amount of n-C7 asphaltene
was below the p value threshold of 0.05 in five out of seven cases. In all cases, increasing acid
number decreased IFT while increasing base number had the opposite effect. Higher IFT values
were also associated with larger amounts of asphaltene and higher viscosities. Which variables
were most significant depended on the pH and brine composition. Table 3.1.2-5 summarizes the
coefficients calculated for the best fits with no variables included with p values greater than 0.09.

43
Table 3.1.2-5. Best correlations for pH and brine composition subgroups coefficients
Acid # Base # pH brine R2 intercept n-C7 asph wt% (mg KOH/g oil)
viscosity at 20°C (cP)
3 DDW 0.52 18.7368 0.4463 -1.6022 0.0199 3 NaCl 0.74 16.8001 0.5983 -1.2971 0.0142 6 DDW 0.46 18.2559 0.4609 -1.6492 0.8548 0.0114 6 NaCl 0.70 11.5666 1.2425 1.6910 9 DDW 0.42 13.1887 0.8981 1.4604 9 NaCl 0.56 6.3313 1.1645 2.5755 Acidic conditions (pH ~ 3): When the aqueous phase was acidic, amount of n-C7
asphaltene, acid number, and viscosity were the most significant variables. Base number was not
significant with or without added NaCl.
Near-neutral conditions (pH ~ 6): In NaCl solutions, base number and amount of n-C7
asphaltene were the only oil properties that contributed significantly to IFT. In distilled water at
near neutral pH, all the variables were significant at the p<0.1 level. Near-neutral DDW thus
seems intermediate between lower and higher pH conditions in that all four variables have some
influence. In synthetic seawater, the presence of divalent ions probably increases the importance
of specific interactions with the crude oil that are not well correlated with any of the oil
properties measured.
Basic conditions (pH ~ 9): In distilled water and NaCl solutions adjusted to pH 9, the
amount of n-C7 asphaltene and base numbers were the significant variables.
Basic conditions (pH 10 and above): Although numerical correlations cannot be made
from this study because of the limitation on low IFT measurements by the pendant drop method,
it is clear from comparison of Figs. 9b and 9d at high pH that acid numbers above those in Group
1 (i.e., above about 0.1 mg KOH/g oil) must be required to achieve very low tensions.

44
3.1.3 SBM/OBM surfactants in oil
Crude oil components affect interfacial and surface properties by adsorption on the solid
surfaces and accumulation at oil/brine interfaces. Added surfactants have the potential to affect
polar components on the surface, replacing or coadsorbing with material from the oil. They
might affect the oil/brine interfacial properties since they also accumulate at oil/brine interfaces.
Finally, they may interact with polar species in the bulk oil. Clementz and Gerbacia (1977)
showed a correlation between an oil’s base number and “deactivation” of petroleum sulfonate
surfactants. Standnes and Austad (2000a) postulated formation of ion pairs between surfactants
and adsorbed crude oil components to explain increased rates of imbibition of water into chalk in
the presence of cationic surfactants.
Surfactant in decane
Invermul is a blend of oxidized tall oil and polyaminated fatty acid surfactants that is
commonly added to oil-based drilling fluids to promote emulsification of water. Figure 3.1.3-1
shows a comparison of IFT measured against DDW of decane with and without the addition of
0.06 wt% Invermul. Addition of a small amount of Invermul to decane dramatically decreased
the both initial and final IFT.

45
0
10
20
30
40
50
60
0 500 1000 1500 2000
Drop Age (s)
IFT
(mN
/m)
purified decanedecane + 0.06% Invermul
Figure 3.1.3-1. Impact of drilling mud additive on the IFT of decane.
Surfactant in crude oil
The impact of drilling mud additive on IFT of a crude oil was similarly tested by adding
0.06% wt Invermul to C-F-03 crude oil. The IFT of C-F-03 in DDW with and without Invermul
is shown in Fig. 3.1.3-2. The IFT(0) were all about the same at 35mN/m for the three
measurements. The IFT(eq) for the sample with Invermul was about 3 mN/m lower than that of
the crude oil alone. The emulsifier had an impact on IFT but not as much as observed with
decane. There appears to be a “deactivation” effect of the polar constituents in the oil that
probably varies from one oil to another.

46
0
5
10
15
20
25
30
35
40
0 500 1000 1500 2000
Drop Age (s)
IFT
(mN
/m)
C-F-03
C-F-03 + 0.06% Invermul
Figure 3.1.3-2 Impact of drilling mud additive on the IFT of C-F-03 oil.
Figure 3.1.3-3 shows additional IFT data for decane and two crude oils in contact with a
pH 6 buffer with ionic strength adjusted with NaCl to 0.1M. The initial value of IFT is reported
after the first few minutes of equilibration. Also shown are trends of change in IFT over periods
up to several hours, during which the drop size was nearly constant. Small amounts of Invermul
(0.1%) mixed with decane and the two crude oils were also tested, as was a mixture of C-F-03
with 0.5% of a drilling fluid filtrate (supplied by ChevronTexaco).
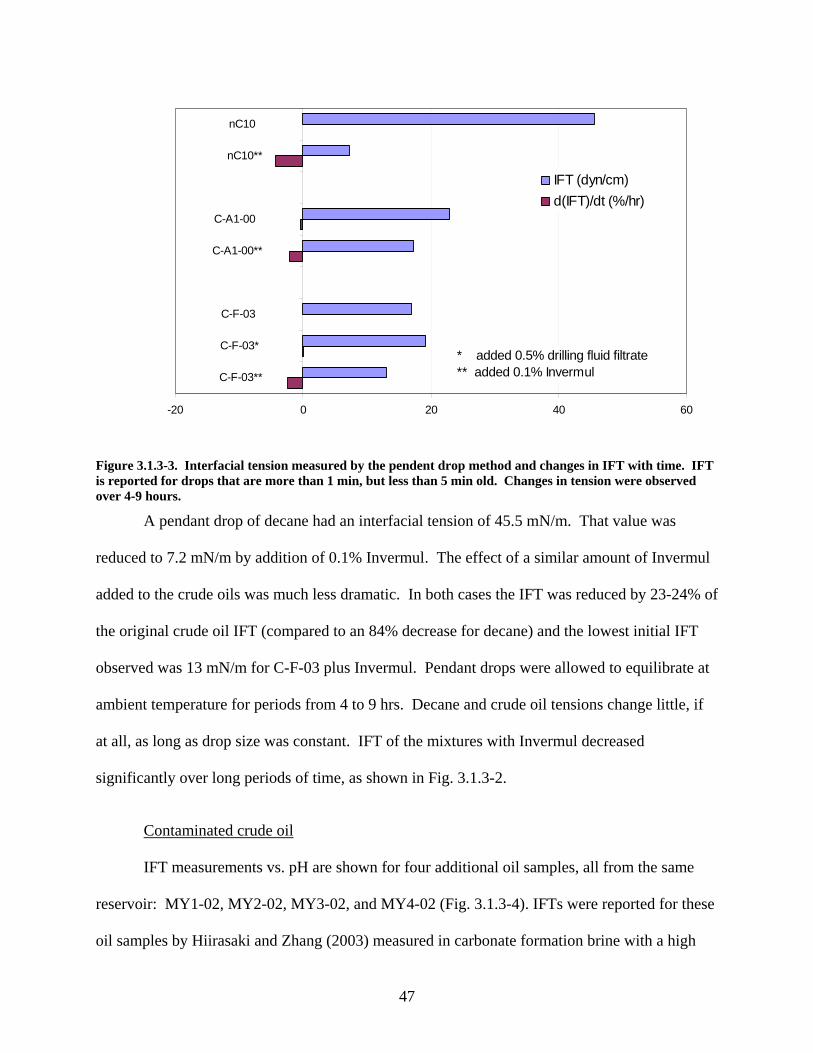
47
-20 0 20 40 60
C-F-03**
C-F-03*
C-F-03
C-A1-00**
C-A1-00
nC10**
nC10
IFT (dyn/cm)d(IFT)/dt (%/hr)
* added 0.5% drilling fluid filtrate** added 0.1% Invermul
Figure 3.1.3-3. Interfacial tension measured by the pendent drop method and changes in IFT with time. IFT is reported for drops that are more than 1 min, but less than 5 min old. Changes in tension were observed over 4-9 hours.
A pendant drop of decane had an interfacial tension of 45.5 mN/m. That value was
reduced to 7.2 mN/m by addition of 0.1% Invermul. The effect of a similar amount of Invermul
added to the crude oils was much less dramatic. In both cases the IFT was reduced by 23-24% of
the original crude oil IFT (compared to an 84% decrease for decane) and the lowest initial IFT
observed was 13 mN/m for C-F-03 plus Invermul. Pendant drops were allowed to equilibrate at
ambient temperature for periods from 4 to 9 hrs. Decane and crude oil tensions change little, if
at all, as long as drop size was constant. IFT of the mixtures with Invermul decreased
significantly over long periods of time, as shown in Fig. 3.1.3-2.
Contaminated crude oil
IFT measurements vs. pH are shown for four additional oil samples, all from the same
reservoir: MY1-02, MY2-02, MY3-02, and MY4-02 (Fig. 3.1.3-4). IFTs were reported for these
oil samples by Hiirasaki and Zhang (2003) measured in carbonate formation brine with a high

48
concentration of bicarbonate (35mmole/L). The IFT values reported after 30 min for these four
oil samples were about 8, 14, 27, and 27 mN/m, respectively. Based on these results, MY1-02
and MY2-02 were judged to be contaminated because of the low IFT values. Figure 3.1.3-4
shows the effect of varying pH on each of these oil samples measured with pH adjusted distilled
water and 0.1M NaCl. The decrease in equilibrium IFT of MY1-02 with increasing pH in 0.1M
NaCl, even at near-neutral conditions, is quite different from the behavior of the other three
samples. MY1-02 was an outlier in nearly all correlations, as shown in Fig. 3.1.3-5 for
measurements with near-neutral, 0.1M NaCl solutions. MY2-02 is much closer to the correlation
lines, suggesting that its IFT may have been lower than others in the Hirasaki and Zhang study
because of the sensitivity of IFT to high pH, whereas our data tend to support the conclusion that
MY1-02 contains surface-active contaminants. MY1-02 has therefore been excluded from all
the correlations reported here (except that in Fig. 3.1.3-5). If MY1-02 was removed from the
data set, the value of R2 increased to 0.7.

49
(a) MY1-02
05
1015202530
2 4 6 8 10 12pH
IFT
(mN/
m)
(b) MY2-02
05
1015202530
2 4 6 8 10 12pH
IFT
(mN
/m)
(c) MY3-02
0
5
10
15
20
25
30
2 4 6 8 10 12pH
IFT
(mN
/m)
IFT(0)-DDWIFT(eq)-DDWIFT(0)-NaClIFT(eq)-NaCl
(d) MY4-02
0
5
1015
20
25
30
2 4 6 8 10 12pH
IFT
(mN
/m)
Figure 3.1.3-4. IFT of MY oils supplied by Rice University as a function of brine composition and pH.
0
5
10
15
20
25
30
0 5 10 15 20 25 30
Final IFT-predicted (mN/m)
Fina
l IFT
-mea
sure
d (m
N/m
)
IFT = 10.8 + 1.27(n-C7 asph%) + 1.83(Base#)R2 = 0.59
MY1-02
Figure 3.1.3-5. pH6, 0.1M NaCl correlation showing that MY1-02 is an outlier.
50
3.1.4 Summary of IFT results
• Plots of IFT vs ln(surfactant concentration) are analogous to similar plots for surface tensions
and aqueous phase surfactants. There appears to be a critical micelle concentration that
varies with surfactant type, aqueous phase pH and ionic composition.
• IFT of crude oils varies predictably with pH and composition of the aqueous phase.
• Key oil properties that correlate with IFTs measured with pH-adjusted distilled water and
0.1M NaCl solutions are the amount of n-C7 asphaltenes, acid number, base number, and
viscosity. Different combinations of these variables dominate in acidic, near-neutral, weakly
basic, and high pH ranges.
• Amount of asphaltenes, as measured by precipitation with n-heptane, is an important
parameter at all conditions. IFT increases with increasing amount of asphaltene.
• Acid number and viscosity mainly affect IFT at acidic conditions. IFT decreases with higher
acid number and increases with higher viscosity.
• Base number affects IFT at near-neutral and weakly basic conditions. IFT increases with
increasing base number.
• Acid number is important in the very basic range above pH 10. Ultralow tensions are
achieved only if acid numbers exceed 0.1 mg KOH/g oil.
• Addition of surface-active contaminants reduces the IFT of both decane and crude oil, but the
effect is much more dramatic for decane.
• Judging by IFT vs pH trends and by multivariate statistical correlations, oil MY1-02
probably is contaminated with materials that affect its IFT.
51
3.2 Surface wetting effects of field samples of SBM fluids (Lekkala and Buckley)
3.2.1 Treatment and testing protocol
Clean mica surfaces were treated using the protocol developed in previous work on
wettability alteration by crude oils (e.g., Liu and Buckley, 1997, 1999), with the addition of steps
in which the samples were exposed to the mud fractions and to various cleaning agents. Unless
otherwise specified, mica was first equilibrated with brine for a period of one day. The samples
were then drained, but not dried, and exposed to crude oil for at least three weeks at room
temperature. To examine the surface, bulk crude oil was removed by rinsing the sample with a
small amount of toluene. Toluene is a good asphaltene solvent and thus does not cause
asphaltene precipitation from the bulk oil. Following the removal of bulk oil, the samples were
submerged in decane, a poor asphaltene solvent that minimizes further changes in the material
deposited on the mica surface. Samples treated by this sequence of brine and oil are termed
COBR samples since they mimic the sequence of crude oil/brine/rock interactions that occur in
an oil reservoir. Decane and water were used as probe fluids to examine the extent of wetting
alteration. An outline of this study is given in Fig. 3.2.1-1.
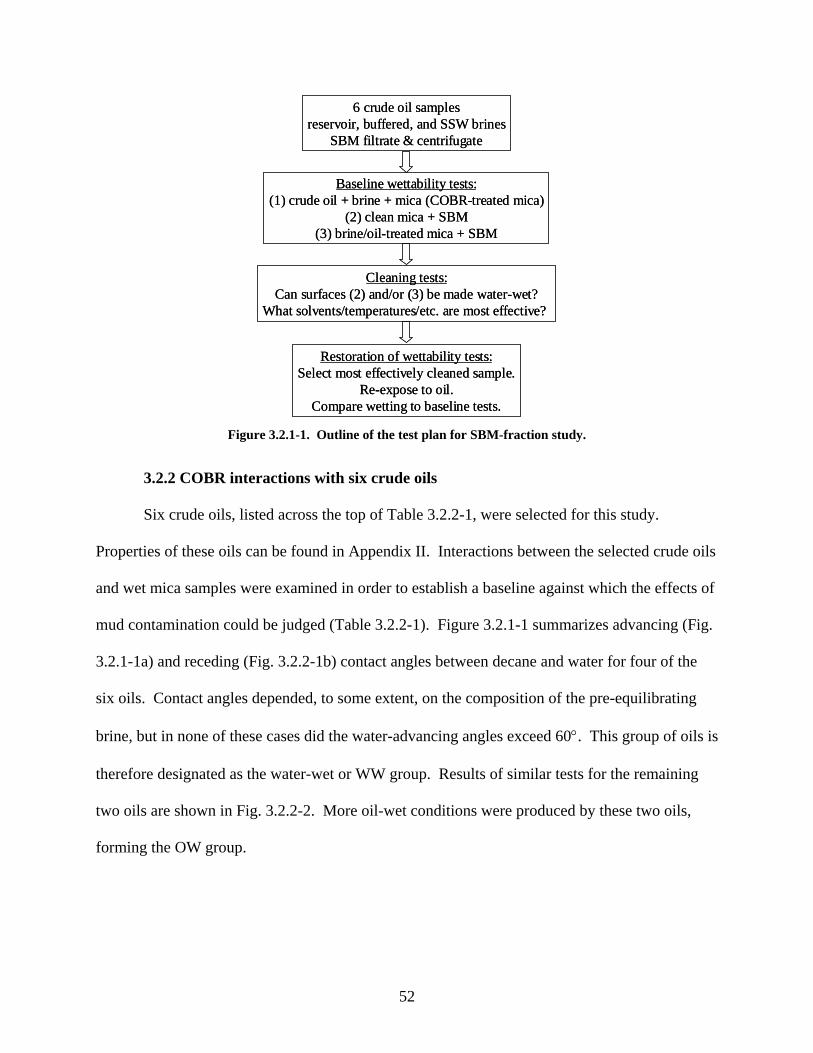
52
6 crude oil samplesreservoir, buffered, and SSW brines
SBM filtrate & centrifugate
Baseline wettability tests:(1) crude oil + brine + mica (COBR-treated mica)
(2) clean mica + SBM(3) brine/oil-treated mica + SBM
Cleaning tests:Can surfaces (2) and/or (3) be made water-wet?
What solvents/temperatures/etc. are most effective?
Restoration of wettability tests:Select most effectively cleaned sample.
Re-expose to oil.Compare wetting to baseline tests.
Figure 3.2.1-1. Outline of the test plan for SBM-fraction study.
3.2.2 COBR interactions with six crude oils
Six crude oils, listed across the top of Table 3.2.2-1, were selected for this study.
Properties of these oils can be found in Appendix II. Interactions between the selected crude oils
and wet mica samples were examined in order to establish a baseline against which the effects of
mud contamination could be judged (Table 3.2.2-1). Figure 3.2.1-1 summarizes advancing (Fig.
3.2.1-1a) and receding (Fig. 3.2.2-1b) contact angles between decane and water for four of the
six oils. Contact angles depended, to some extent, on the composition of the pre-equilibrating
brine, but in none of these cases did the water-advancing angles exceed 60°. This group of oils is
therefore designated as the water-wet or WW group. Results of similar tests for the remaining
two oils are shown in Fig. 3.2.2-2. More oil-wet conditions were produced by these two oils,
forming the OW group.

53
Table 3.2.2-1. Contact Angles on COBR-Treated Mica Surfaces
C-A2-00 C-B2-01 C-K-01 C-L-01 E-1XC0-01 S-Ven-41
Brine Decane – Water Contact Angles (°)
θA 51 + 4 44 + 3 30 + 5 54 + 4 136 + 5 128 + 5 pH 4, I=0.01M θR 23 + 4 8 + 3 16 + 1 24 + 3 61 + 3 55 + 3
θA 43 + 3 32 + 5 35 + 5 pH 8, I=1.0M
θR 12 + 1 14 + 2 15 + 2
θA 54 + 5 48 + 3 24 + 3 RB
θR 9 + 2 16 + 2 9 + 1
θA 49 + 3 143 + 6 133 + 5 SSW
θR 19 + 2 55 + 6 61 + 3
0
30
60
90
120
150
180
C-B2-01 C-K-01 C-L-01 C-A2-01
Crude Oil
deca
ne/w
ater
adv
anci
ng a
ngle
(°)
pH 4pH 8reservoir brine/SSW
0
30
60
90
120
150
180
C-B2-01 C-K-01 C-L-01 C-A2-01
Crude Oil
deca
ne/w
ater
rec
edin
g an
gle
(°) pH 4
pH 8reservoir brine/SSW
(a) water-advancing angles (b) water-receding angles
Figure 3.2.2-1. Results of standard COBR treatments with the WW oils.
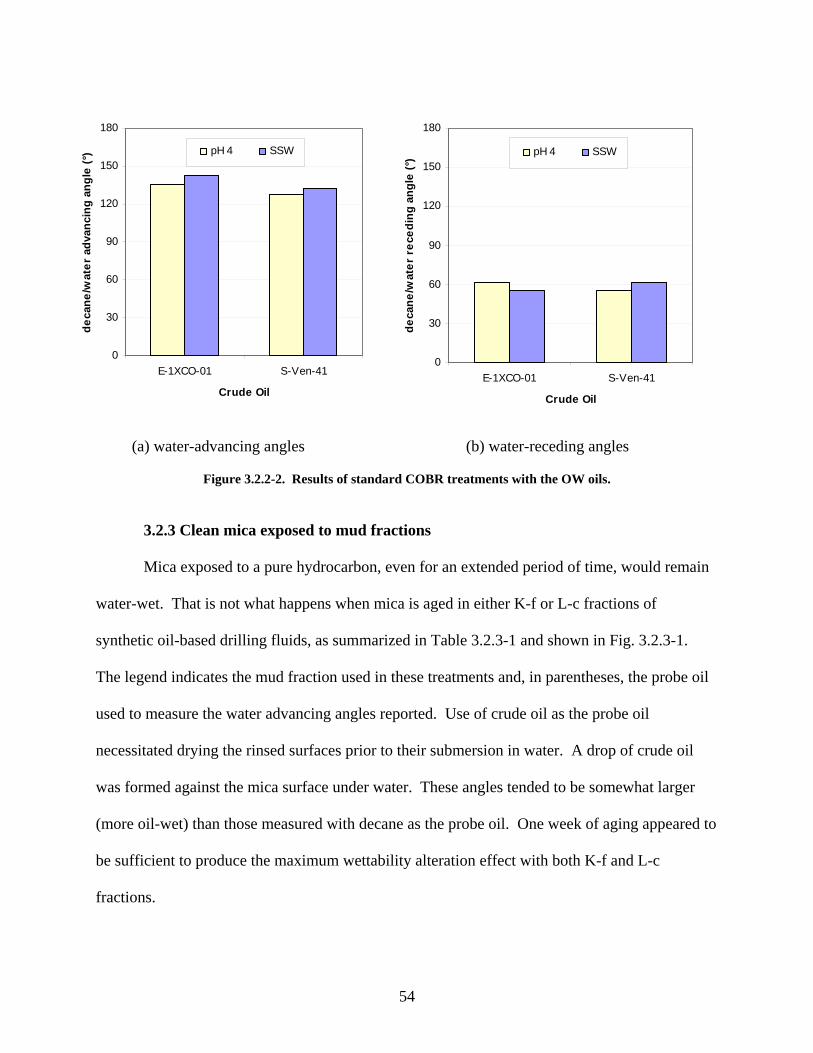
54
0
30
60
90
120
150
180
E-1XCO-01 S-Ven-41
Crude Oil
deca
ne/w
ater
adv
anci
ng a
ngle
(°) pH 4 SSW
0
30
60
90
120
150
180
E-1XCO-01 S-Ven-41
Crude Oilde
cane
/wat
er r
eced
ing
angl
e (°
) pH 4 SSW
(a) water-advancing angles (b) water-receding angles
Figure 3.2.2-2. Results of standard COBR treatments with the OW oils.
3.2.3 Clean mica exposed to mud fractions
Mica exposed to a pure hydrocarbon, even for an extended period of time, would remain
water-wet. That is not what happens when mica is aged in either K-f or L-c fractions of
synthetic oil-based drilling fluids, as summarized in Table 3.2.3-1 and shown in Fig. 3.2.3-1.
The legend indicates the mud fraction used in these treatments and, in parentheses, the probe oil
used to measure the water advancing angles reported. Use of crude oil as the probe oil
necessitated drying the rinsed surfaces prior to their submersion in water. A drop of crude oil
was formed against the mica surface under water. These angles tended to be somewhat larger
(more oil-wet) than those measured with decane as the probe oil. One week of aging appeared to
be sufficient to produce the maximum wettability alteration effect with both K-f and L-c
fractions.

55
Table 3.2.3-1. Contact Angles for Dry Mica Samples Aged in Mud Fractions
K-f filtrate L-c centrifugate
Aging time Decane – Water Contact Angles (°) oil drop in water or water drop in oil
θA 65 + 4 108 + 4 1 day
θR 15 + 2 24 + 2
θA 121 + 8 131 + 2 7 days
θR 32 + 2 30 + 2
θA 117 + 6 106 + 4 21 days
θR 29 + 2 27 + 3 Crude Oil – Water Contact Angles (°)
oil drop in water
θA 136 + 2 1 day
θR 31 + 2
θA 126 + 5 135 + 10 7 days
θR 36 + 3 30 + 2
θA 139 + 9 155 + 6 21 days
θR 31 + 3 33 + 2
0
30
60
90
120
150
180
1 day 7 days 21 daysAging time in mud fractions
wat
er-a
dvan
cing
ang
le (°
)
K-f (decane)K-f (C-K-01)L-c (decane)L-c (C-L-01)
mud fraction (probe oil)
Figure 3.2.3-1. Water advancing contact angles on mica surfaces exposed to synthetic oil-based mud fractions for 1 day, 7 days, and 21 days.

56
The high advancing angles measured after exposure of clean, dry mica to the two mud
fractions confirm that they contain surface active materials, despite the fact that they have both
been used in the field where surfactants would have adsorbed on cuttings and other solid surfaces
and in spite of further removal of surfactants during filtration of the K-f sample or removal of
adsorbed material with the solids separated in the centrifugation of the L-c sample. The results
in Fig. 3.2.3-1 also show that rinsing with toluene does not remove the adsorbed material.
Some of the surface-active material can be removed by further washing, as summarized
in Table 3.2.3-2 and shown in Fig. 3.2.3-2. Methanol was the most effective solvent of the three
organic compounds investigated and cleaning of the mica treated with K-f was more efficient
than cleaning of the L-c-treated mica. These results are consistent with the likely removal of the
most active surfactant materials remaining in the end-of-run mud during the filtration process. In
the centrifugate, surfactants in excess of those adsorbed on the solids existing in the mud, could
remain in the supernatant. Thus stronger interactions might be expected with the L-c mud
fraction than with K-f. There may also, however, be differences in original formulation and in
the changes that occurred during drilling that contribute to differences between these two mud
fractions.
Table 3.2.3-2. Contact Angles on Initially Dry Mica Aged in Mud Fractions and Washed with Solvents
Solvents used for washing Mica aged in K-f filtrate Mica aged in L-c centrifugate
θA (deg) θR (deg) θA (deg) θR (deg)
Methylene chloride 40 + 2 12 + 1 99 + 14 34 + 6
1- Propanol 29 + 2 10 + 2 64 + 2 25 + 1
Methanol 30 + 1 12 + 1 50 + 1 9 + 1
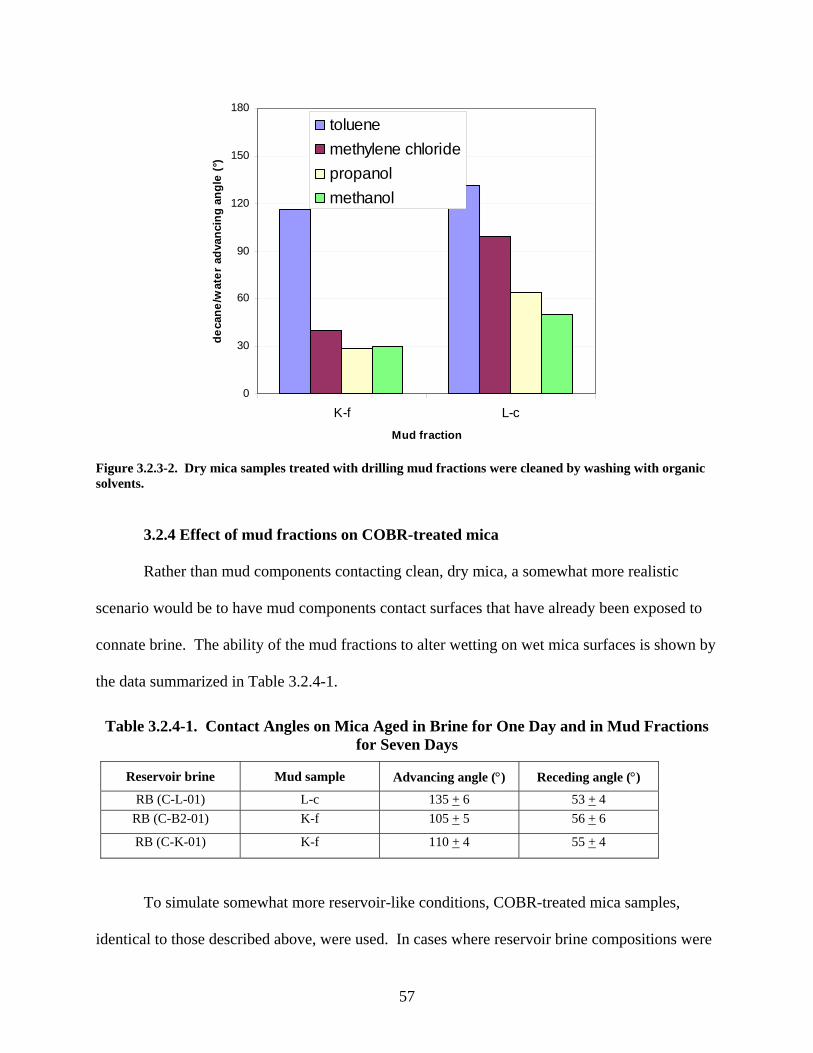
57
0
30
60
90
120
150
180
K-f L-cMud fraction
deca
ne/w
ater
adv
anci
ng a
ngle
(°)
toluenemethylene chloridepropanolmethanol
Figure 3.2.3-2. Dry mica samples treated with drilling mud fractions were cleaned by washing with organic solvents.
3.2.4 Effect of mud fractions on COBR-treated mica
Rather than mud components contacting clean, dry mica, a somewhat more realistic
scenario would be to have mud components contact surfaces that have already been exposed to
connate brine. The ability of the mud fractions to alter wetting on wet mica surfaces is shown by
the data summarized in Table 3.2.4-1.
Table 3.2.4-1. Contact Angles on Mica Aged in Brine for One Day and in Mud Fractions for Seven Days
Reservoir brine Mud sample Advancing angle (°) Receding angle (°)
RB (C-L-01) L-c 135 + 6 53 + 4 RB (C-B2-01) K-f 105 + 5 56 + 6
RB (C-K-01) K-f 110 + 4 55 + 4
To simulate somewhat more reservoir-like conditions, COBR-treated mica samples,
identical to those described above, were used. In cases where reservoir brine compositions were
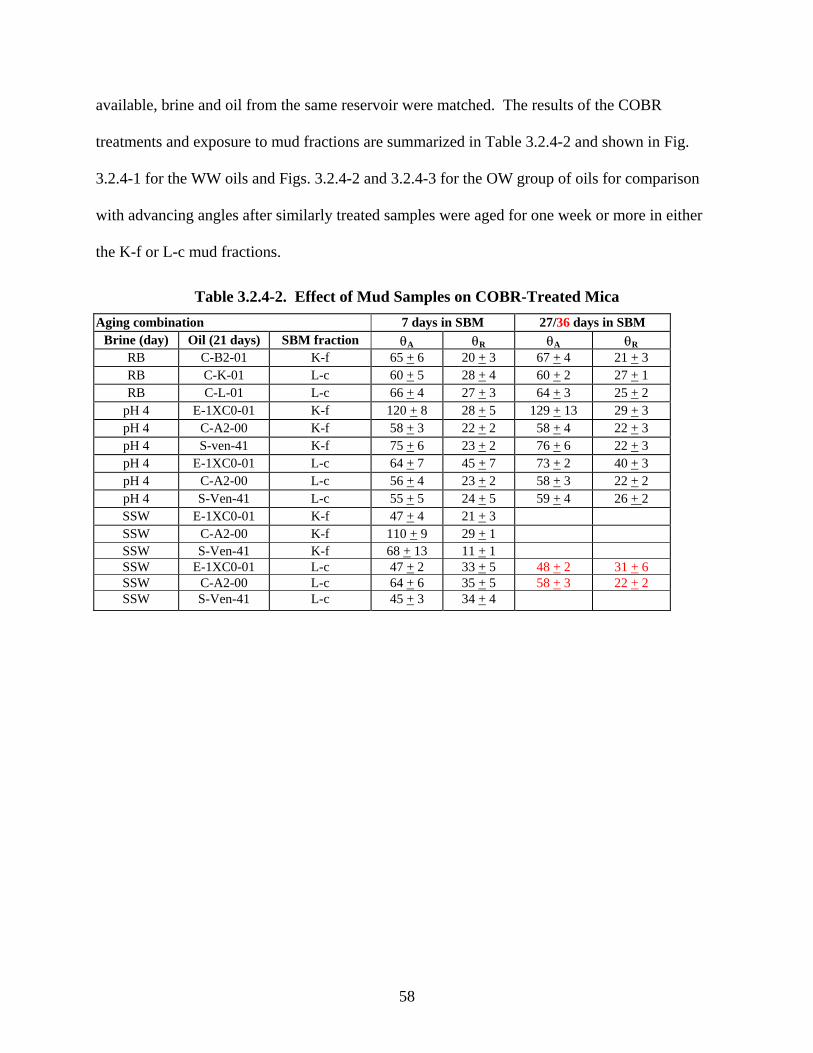
58
available, brine and oil from the same reservoir were matched. The results of the COBR
treatments and exposure to mud fractions are summarized in Table 3.2.4-2 and shown in Fig.
3.2.4-1 for the WW oils and Figs. 3.2.4-2 and 3.2.4-3 for the OW group of oils for comparison
with advancing angles after similarly treated samples were aged for one week or more in either
the K-f or L-c mud fractions.
Table 3.2.4-2. Effect of Mud Samples on COBR-Treated Mica Aging combination 7 days in SBM 27/36 days in SBM
Brine (day) Oil (21 days) SBM fraction θA θR θA θR RB C-B2-01 K-f 65 + 6 20 + 3 67 + 4 21 + 3 RB C-K-01 L-c 60 + 5 28 + 4 60 + 2 27 + 1 RB C-L-01 L-c 66 + 4 27 + 3 64 + 3 25 + 2
pH 4 E-1XC0-01 K-f 120 + 8 28 + 5 129 + 13 29 + 3 pH 4 C-A2-00 K-f 58 + 3 22 + 2 58 + 4 22 + 3 pH 4 S-ven-41 K-f 75 + 6 23 + 2 76 + 6 22 + 3 pH 4 E-1XC0-01 L-c 64 + 7 45 + 7 73 + 2 40 + 3 pH 4 C-A2-00 L-c 56 + 4 23 + 2 58 + 3 22 + 2 pH 4 S-Ven-41 L-c 55 + 5 24 + 5 59 + 4 26 + 2 SSW E-1XC0-01 K-f 47 + 4 21 + 3 SSW C-A2-00 K-f 110 + 9 29 + 1 SSW S-Ven-41 K-f 68 + 13 11 + 1 SSW E-1XC0-01 L-c 47 + 2 33 + 5 48 + 2 31 + 6 SSW C-A2-00 L-c 64 + 6 35 + 5 58 + 3 22 + 2 SSW S-Ven-41 L-c 45 + 3 34 + 4

59
0
30
60
90
120
150
180
brine/oil/mud fraction
deca
ne/w
ater
adv
anci
ng a
ngle
(°)
brine + oil
brine + oil + mud fraction
RBC-B2-01
K-f
RBC-K-01
K-f
RBC-L-01
L-c
SSWC-A2-01
K-f
SSWC-A2-01
L-c
Figure 3.2.4-1. Effect of mud fractions on COBR-treated mica surfaces—WW oils and reservoir brines or synthetic sea water.
0
30
60
90
120
150
180
pH4 buffer / oil / mud fraction
deca
ne/w
ater
adv
anci
ng a
ngle
(°)
brine + oil
brine + oil + mud fraction
E-1XCO-01K-f
S-Ven-41K-f
E-1XCO-01L-c
S-Ven-41L-c
Figure 3.2.4-2. Effect of mud fractions on COBR-treated mica surfaces—OW oils and pH4 buffer.

60
0
30
60
90
120
150
180
SSW / oil / mud fraction
deca
ne/w
ater
adv
anci
ng a
ngle
(°)
brine + oil
brine + oil + mud fraction
E-1XCO-01K-f
S-Ven-41K-f
E-1XCO-01L-c
S-Ven-41L-c
Figure 3.2.4-3. Effect of mud fractions on COBR-treated mica surfaces—OW oils and SSW.
Aging for more than seven days in the mud samples made little difference in the results,
as shown in Fig. 3.2.4-4.
0
30
60
90
120
150
180
7 days 27days
Aging time in mud fraction
deca
ne/w
ater
adv
anci
ng a
ngle
(°)
E-1XCO-01 C-A2-01 S-Ven-41
pH 4 bufferK-f
0
30
60
90
120
150
180
7 days 27days
Aging time in mud fraction
deca
ne/w
ater
adv
anci
ng a
ngle
(°)
E-1XCO-01 C-A2-01 S-Ven-41
pH 4 bufferL-c
0
30
60
90
120
150
180
7 days 27days
Aging time in mud fraction
deca
ne/w
ater
adv
anci
ng a
ngle
(°) C-B2-01 + K-f
C-K-01 + K-f
C-L-01 + L-c
RB
(a) pH 4, K-f (b) pH 4, L-c (c) RB
Figure 3.2.4-4. Extending the aging time in either mud fraction beyond one week has little further effect on the change in the water-advancing contact angle for a variety of combinations of oil and mud fraction, with or without brine.

61
In Fig. 3.2.4-5a, effects of K-f and L-c are compared for COBR-treated surfaces
produced by three different crude oils with pH 4 buffer. Figure 3.2.4-5b compares the same
oil/mud fraction combinations for surfaces initially exposed to SSW. Results in both cases are
similar.
0
30
60
90
120
150
180
E-1XCO-01 C-A2-01 S-Ven-41
Crude Oil
deca
ne/w
ater
adv
anci
ng a
ngle
(°)
brine + oil
brine + oil + K-f
brine + oil + L-c
0
30
60
90
120
150
180
E-1XCO-01 C-A2-01 S-Ven-41
Crude Oil
deca
ne/w
ater
adv
anci
ng a
ngle
(°)
brine + oil
brine + oil + K-f
brine + oil + L-c
(a) samples pretreated with pH4 buffer (b) samples pretreated with SSW
Figure 3.2.4-5. Comparison of the effects of K-f filtrate and L-c centrifugate on COBR-treated mica samples.
The effect of the brine used to pretreat mica during the COBR treatment sequence varies
with crude oil composition. For S-Ven-41, there appears to be little effect of brine composition
on the subsequent effect of exposure to either of the mud fractions. The changes in samples after
exposure to the mud samples were similar, regardless of the composition of the original brine.
For crude oil E-1XCO-01, the reduction in contact angles was greater for the surface treated first
with SSW, whereas for C-A2-00, the opposite trend was observed.

62
It is possible that these differences are related to the primary mechanisms of wetting
alteration (Buckley et al., 1998b), although an interpretation based on the limited amount of data
available must be regarded as speculative. S-Ven-41 is the most asphaltic of these three oils and
the one with the least stable asphaltenes. If interactions are dominated by surface precipitation,
brine composition would only be important if one of the brines produced stable wetting films. In
the case of E-1XCO-01, acid/base mechanisms may dominate, since contact angles are reduced
most dramatically for the SSW case and less change occurs with the pH4 brine. Finally, since
the SSW case is less affected (contact angles are actually higher after mud treatments) perhaps
C-A2-00 interacts with the surface through ion-binding mechanisms.
3.2.5 Cleaning
Since core is often exposed to drilling fluid components, it is essential that cleaning
methods be established that remove contaminants so that the cleaned surface can interact with
brine and crude oil to reproduce accurately the original wetting condition. Results of washing
with single organic solvents and with sequences of solvents are given in Tables 3.2.5-1 to 3.2.5-3.
The shaded cells indicate results for samples that were rinsed with toluene and submerged in
decane, but were not washed with any additional solvents. Table 3.2.5-1 contains results for
reservoir brine COBR-treated surfaces, pH 4 buffer COBR samples are in Table 3.2.4-2, and
SSW COBR samples are in Table 3.2.5-3. Results are mixed.
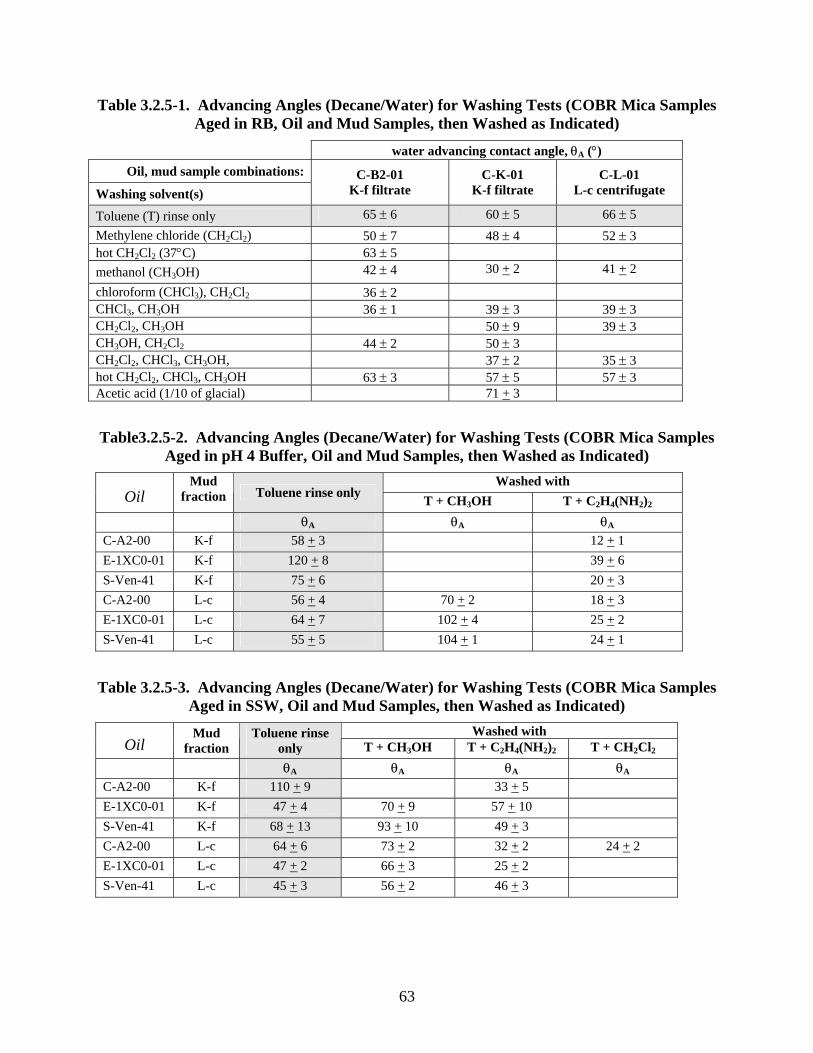
63
Table 3.2.5-1. Advancing Angles (Decane/Water) for Washing Tests (COBR Mica Samples Aged in RB, Oil and Mud Samples, then Washed as Indicated)
water advancing contact angle, θA (°) Oil, mud sample combinations:
Washing solvent(s) C-B2-01
K-f filtrate C-K-01
K-f filtrate C-L-01
L-c centrifugate
Toluene (T) rinse only 65 ± 6 60 ± 5 66 ± 5 Methylene chloride (CH2Cl2) 50 ± 7 48 ± 4 52 ± 3 hot CH2Cl2 (37°C) 63 ± 5 methanol (CH3OH) 42 ± 4 30 + 2 41 + 2
chloroform (CHCl3), CH2Cl2 36 ± 2 CHCl3, CH3OH 36 ± 1 39 ± 3 39 ± 3 CH2Cl2, CH3OH 50 ± 9 39 ± 3 CH3OH, CH2Cl2 44 ± 2 50 ± 3 CH2Cl2, CHCl3, CH3OH, 37 ± 2 35 ± 3 hot CH2Cl2, CHCl3, CH3OH 63 ± 3 57 ± 5 57 ± 3 Acetic acid (1/10 of glacial) 71 + 3
Table3.2.5-2. Advancing Angles (Decane/Water) for Washing Tests (COBR Mica Samples Aged in pH 4 Buffer, Oil and Mud Samples, then Washed as Indicated)
Washed with Oil
Mud fraction Toluene rinse only T + CH3OH T + C2H4(NH2)2
θA θA θA C-A2-00 K-f 58 + 3 12 + 1 E-1XC0-01 K-f 120 + 8 39 + 6 S-Ven-41 K-f 75 + 6 20 + 3 C-A2-00 L-c 56 + 4 70 + 2 18 + 3 E-1XC0-01 L-c 64 + 7 102 + 4 25 + 2 S-Ven-41 L-c 55 + 5 104 + 1 24 + 1
Table 3.2.5-3. Advancing Angles (Decane/Water) for Washing Tests (COBR Mica Samples Aged in SSW, Oil and Mud Samples, then Washed as Indicated)
Washed with Oil
Mud fraction
Toluene rinse only T + CH3OH T + C2H4(NH2)2 T + CH2Cl2
θA θA θA θA C-A2-00 K-f 110 + 9 33 + 5 E-1XC0-01 K-f 47 + 4 70 + 9 57 + 10 S-Ven-41 K-f 68 + 13 93 + 10 49 + 3 C-A2-00 L-c 64 + 6 73 + 2 32 + 2 24 + 2 E-1XC0-01 L-c 47 + 2 66 + 3 25 + 2 S-Ven-41 L-c 45 + 3 56 + 2 46 + 3

64
3.2.6 Restoration of wettability
Probably the most important question is whether the original wettability established by
COBR interactions can be reestablished in a cleaned core. The results of surface tests shown in
Fig. 3.2.6-1 and summarized in Table 3.2.6-1 are encouraging. Water advancing angles are
compared for surfaces treated by the standard COBR sequence (the initial brine and oil indicated
for each set of results) with similarly treated surfaces that were subsequently exposed to one of
the drilling fluid fractions, washed, and restored by a second exposure to crude oil. In all cases,
preferentially water-wet surfaces were returned to water-wet conditions and preferentially oil-
wet surfaces to oil-wet conditions. The contact angles after treatment were often somewhat
lower than on the original COBR-treated surfaces, but there are exceptions that make it difficult
to generalize about the effects of either the K-f or L-c fluids.
0
30
60
90
120
150
180
C-A2-01 C-A2-01 C-B2-01 C-K-01 C-L-01 E-1XCO-01 E-1XCO-01 S-Ven-41
deca
ne/w
ater
adv
anci
ng a
ngle
(°)
cobr anglerestored (after exposure to K-f)restored (after exposure to L-c)
pH 4 SSW RB RB RB pH 4 pH 4SSW
WW oils OW oils
Figure 3.2.6-1. Restoration of wettability by COBR interactions. Water-advancing angles are compared for mica surfaces treated by the standard COBR sequence to those obtained after exposure to drilling fluid fractions, washing, and repeated COBR exposures.

65
Table 3.2.6-1. Summary of the Decane/Water Contact Angles (Advancing) for Mica Aged in Brine, Oil, Mud Sample, then Washed and Restored
Step 1 Age for 1 day in brine
Step 2 Aged for 21 days in Oil
θA after Step 2
Step 3
Age for 7 days in mud fraction
θA after Step 3
Step 4
Wash and re age for 21 days in oil
θA after Step 4
pH 4 E-1XC0-01 136 + 5 K-f 120 + 8 E-1XC0-01 138 + 3 pH 4 C-A2-00 51 + 4 K-f 58 + 3 C-A2-00 56 + 3 pH 4 S-Ven-41 128 + 5 K-f 75 + 6 S-Ven-41 131 + 3 pH 4 E-1XC0-01 136 + 5 L-c 64 + 7 E-1XC0-01 110 + 4 pH 4 C-A2-00 51 + 4 L-c 56 + 4 C-A2-00 44 + 3 pH 4 S-Ven-41 128 + 5 L-c 55 + 5 S-Ven-41 124 + 4 SSW E-1XC0-01 143 + 6 K-f 47 + 4 E-1XC0-01 * SSW C-A2-00 49 + 3 K-f 110 + 9 C-A2-00 30 + 3 SSW S-Ven-41 133 + 5 K-f 68 + 13 S-Ven-41 * SSW E-1XC0-01 143 + 6 L-c 47 + 4 E-1XC0-01 130 + 5 SSW C-A2-00 49 + 3 L-c 64 + 6 C-A2-00 22 + 2 SSW S-Ven-41 133 + 5 L-c 45 + 3 S-Ven-41 * RB C-L-01 24 + 3 L-c 66 + 4 C-L-01 38 + 3 RB C-K-01 48 + 3 K-f 60 + 5 C-K-01 17 + 4 RB C-B2-01 54 + 5 K-f 65 + 6 C-B-01 31 + 3
* None of the “cleaned” samples were sufficiently water-wet to use in restoration tests.
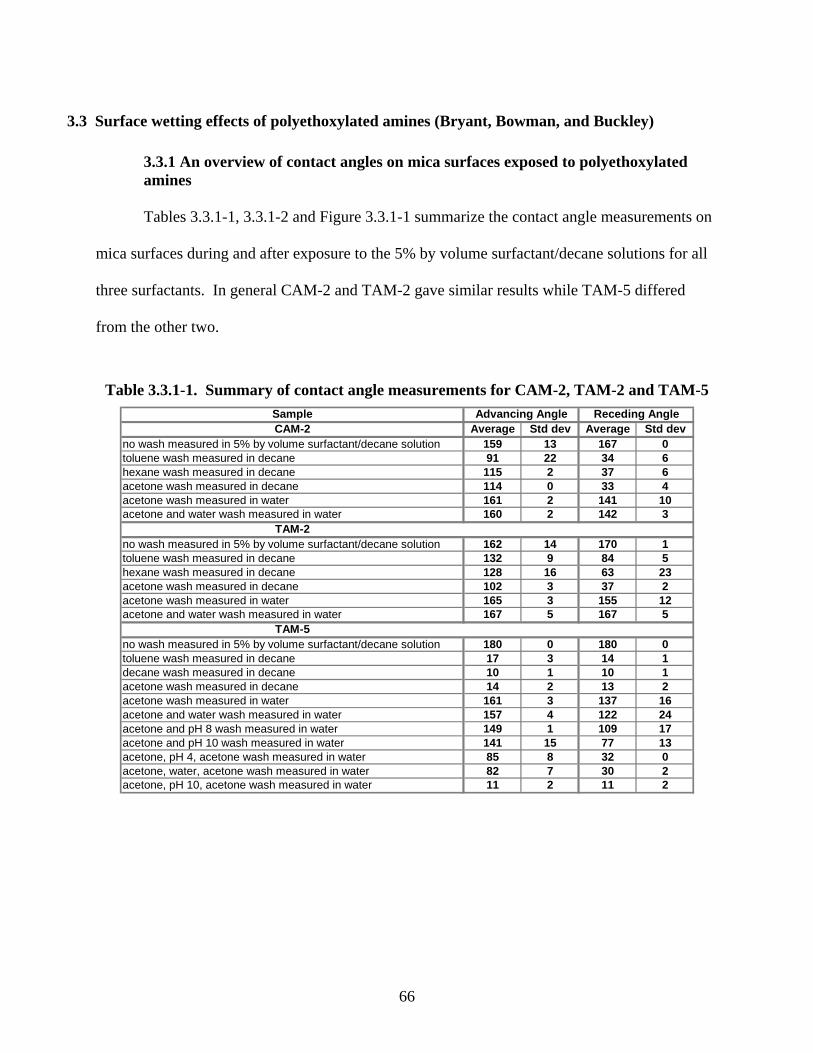
66
3.3 Surface wetting effects of polyethoxylated amines (Bryant, Bowman, and Buckley)
3.3.1 An overview of contact angles on mica surfaces exposed to polyethoxylated amines Tables 3.3.1-1, 3.3.1-2 and Figure 3.3.1-1 summarize the contact angle measurements on
mica surfaces during and after exposure to the 5% by volume surfactant/decane solutions for all
three surfactants. In general CAM-2 and TAM-2 gave similar results while TAM-5 differed
from the other two.
Table 3.3.1-1. Summary of contact angle measurements for CAM-2, TAM-2 and TAM-5 SampleCAM-2 Average Std dev Average Std dev
no wash measured in 5% by volume surfactant/decane solution 159 13 167 0toluene wash measured in decane 91 22 34 6hexane wash measured in decane 115 2 37 6acetone wash measured in decane 114 0 33 4acetone wash measured in water 161 2 141 10acetone and water wash measured in water 160 2 142 3
TAM-2no wash measured in 5% by volume surfactant/decane solution 162 14 170 1toluene wash measured in decane 132 9 84 5hexane wash measured in decane 128 16 63 23acetone wash measured in decane 102 3 37 2acetone wash measured in water 165 3 155 12acetone and water wash measured in water 167 5 167 5
TAM-5no wash measured in 5% by volume surfactant/decane solution 180 0 180 0toluene wash measured in decane 17 3 14 1decane wash measured in decane 10 1 10 1acetone wash measured in decane 14 2 13 2acetone wash measured in water 161 3 137 16acetone and water wash measured in water 157 4 122 24acetone and pH 8 wash measured in water 149 1 109 17acetone and pH 10 wash measured in water 141 15 77 13acetone, pH 4, acetone wash measured in water 85 8 32 0acetone, water, acetone wash measured in water 82 7 30 2acetone, pH 10, acetone wash measured in water 11 2 11 2
Advancing Angle Receding Angle

67
0
30
60
90
120
150
180
no wash toluenewash
hexanewash
acetonewash
acetonewash
acetoneand water
wash
contact angle
advancing receding
Measured in 5% by volume surfactant/decane
solutionMeasured in purified decane
Measured in water
0
30
60
90
120
150
180
no wash toluenewash
hexanewash
acetonewash
acetonewash
acetoneand water
wash
contact angle
advancing receding
Measured in 5% by volume surfactant/decane
solution Measured in purified decane Measured in water
0
30
60
90
120
150
180
no wash toluenewash
decanewash
acetonewash
acetonewash
acetoneand water
wash
acetoneand pH 8
wash
acetoneand pH 10
wash
acetone,pH 4,
acetonewash
acetone,water,
acetonewash
acetone,pH 10,
acetonewash
contact angle
advancing receding
Measured in purified decane
Measured in purified decaneMeasured in water
Measured in 5% by volume surfactant/decane
solution
Figure 3.3.1-1. Contact angle results for a) CAM-2 b) TAM-2 and c) TAM-5. Error bars are standard deviations of 18 replicate measurements.
a) CAM-2
b) TAM-2
c) TAM-5
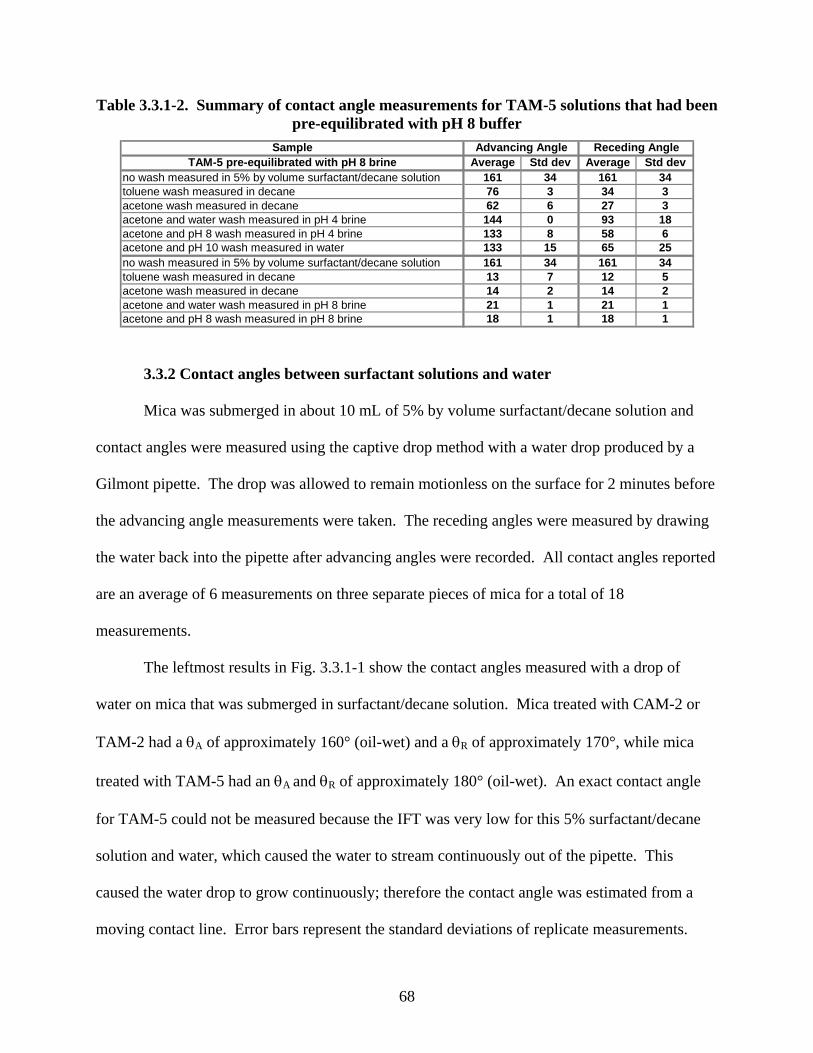
68
Table 3.3.1-2. Summary of contact angle measurements for TAM-5 solutions that had been pre-equilibrated with pH 8 buffer
SampleTAM-5 pre-equilibrated with pH 8 brine Average Std dev Average Std dev
no wash measured in 5% by volume surfactant/decane solution 161 34 161 34toluene wash measured in decane 76 3 34 3acetone wash measured in decane 62 6 27 3acetone and water wash measured in pH 4 brine 144 0 93 18acetone and pH 8 wash measured in pH 4 brine 133 8 58 6acetone and pH 10 wash measured in water 133 15 65 25no wash measured in 5% by volume surfactant/decane solution 161 34 161 34toluene wash measured in decane 13 7 12 5acetone wash measured in decane 14 2 14 2acetone and water wash measured in pH 8 brine 21 1 21 1acetone and pH 8 wash measured in pH 8 brine 18 1 18 1
Advancing Angle Receding Angle
3.3.2 Contact angles between surfactant solutions and water
Mica was submerged in about 10 mL of 5% by volume surfactant/decane solution and
contact angles were measured using the captive drop method with a water drop produced by a
Gilmont pipette. The drop was allowed to remain motionless on the surface for 2 minutes before
the advancing angle measurements were taken. The receding angles were measured by drawing
the water back into the pipette after advancing angles were recorded. All contact angles reported
are an average of 6 measurements on three separate pieces of mica for a total of 18
measurements.
The leftmost results in Fig. 3.3.1-1 show the contact angles measured with a drop of
water on mica that was submerged in surfactant/decane solution. Mica treated with CAM-2 or
TAM-2 had a θA of approximately 160° (oil-wet) and a θR of approximately 170°, while mica
treated with TAM-5 had an θA and θR of approximately 180° (oil-wet). An exact contact angle
for TAM-5 could not be measured because the IFT was very low for this 5% surfactant/decane
solution and water, which caused the water to stream continuously out of the pipette. This
caused the water drop to grow continuously; therefore the contact angle was estimated from a
moving contact line. Error bars represent the standard deviations of replicate measurements.
69
3.3.3 Decane/water contact angles after surfactant sorption
Mica was soaked in the 5% by volume surfactant/decane solution for 40 to 70 min. The
treated mica was then washed with one solvent or a sequence of solvents. The solvents tested
included toluene, hexane, decane, acetone, water, and pH 4, 8, and 10 buffers. Details of
washing sequences are included in Tables 3.3.1-1 and 3.3.1-2 above. For each solvent, mica was
washed by swirling it in the solvent three times followed by touching the edge of the mica with a
Kimwipe to remove excess solution. The washed mica was placed into either decane or water
and the contact angles were measured using the captive drop method as described above. If the
contact angles were measured in water, the fluid delivered by the pipette (i.e. the drop) was
decane.
When measured using purified decane, the contact angle of the mica tended to be
intermediate (CAM-2 and TAM-2, θA ~ 32-83°) to water-wet (TAM-5, θA ~ 10-18°) regardless
of the washing procedure. When the contact angle was measured in water, surfaces appeared to
be more oil-wet (θA ~ 141-167°) regardless of which solutions were used to wash the mica.
An additional set of contact angle measurements was made on TAM-5-treated surfaces
(using a decane surfactant solution that was pre-equilibrated with pH 8 buffer) with the water
phase replaced by pH 8 and pH 4 buffers. Figure 3.3.3-2a summarizes the contact angles for pH
4 brine while Figure 3.3.3-1b summarizes the results measured with the pH 8 brine. The pH 4
contact angle results were generally less water-wet than comparable measurements with pH 8.
The pH 4 measurements are comparable to similar measurements with double-distilled water.
With pH 8, the mica surface appeared to be water-wet, while with pH 4, the mica surface was
intermediate in wetting.

70
0
30
60
90
120
150
180
no wash toluene wash acetone wash acetone and waterwash
acetone and pH 8wash
acetone and pH 10wash
contact angle
advancing receding
Measured in purified decaneMeasured in pH 4 Measured in water
Measured in 5% by volume surfactant/decane solution
0
30
60
90
120
150
180
no wash toluene wash acetone wash acetone and waterwash
acetone and pH 8wash
contact angle
advancing receding
Measured in 5% by volume surfactant/decane solution Measured in purified decane
Measured in pH 8 Figure 3.3.3-1. TAM-5 pre-equilibrated with pH 8 brine measured in a) pH 4 brine and b) pH 8 brine. Error bars are standard deviations of 18 replicate measurements.
3.3.4 Atomic force microscopy
Mica was soaked in a 5% by volume surfactant/decane solution for approximately 45
minutes. Mica samples were removed from the surfactant solution and allowed to dry
a) TAM-5 measured in pH 4 brine
b) TAM-5 measured in pH 8 brine

71
thoroughly in air. The mica was then mounted onto an AFM magnetic puck using a small
amount of Super Glue Gel (Ace Hardware, Oak Brook, IL).
Figure 3.3.4-1 shows AFM images of mica treated with TAM-5. All images are of the
deflection signal and are 5-µm by 5-µm scans. Figure 3.3.4-1a shows the TAM-5-treated mica
surface imaged under air. The feature in the middle of the image was scraped by the tip during a
previous scan of a 1-µm by 1-µm area. Figure 3.3.4-1b was imaged under water. The features
on this surface were more stable than under air; a previous 1-µm by 1-µm scan produced no
scraping of the surface. Figure 3.3.4-1c was imaged under pH 8 brine. It appeared the pH 8
brine caused some of the features to coalesce into spheres that remained on the surface. Figure
3.3.4-1d was imaged under pH 10 brine; this image has the same appearance as clean mica.

72
a) imaged under air b) imaged under water
c) imaged under pH 8 buffer
d) imaged under pH 10 buffer
Figure 3.3.4-1. Mica treated with a 5% by volume TAM-5/decane solution imaged under a) air b) water c) pH 8 buffer and d) pH 10 buffer.
3.3.5 Discussion of wetting effects of polyethoxylated amines
The difference between CAM-2 and TAM-2 is their respective hydrocarbon chain lengths.
Surfaces of mica treated with CAM-2 and TAM-2 had contact angles that were very similar;
varying the chain length of the surfactant appeared to have little or no impact on surfactant
adsorption on the mica surface. TAM-5, which has the same hydrocarbon chain length as TAM-

73
2 but has five ethylene oxides attached to the nitrogen instead of two, adsorbed less efficiently on
mica. Changing the polar head groups does appear to affect adsorption of polyethoxylated amine
surfactants.
Exposure of dry mica to high concentrations these surfactants produced wetting changes
that were readily reversed by washing with any of the non-aqueous solvents, if followed by
immersion in decane. It appears that any surfactant remaining on the surface after washing can
diffuse back into the decane, in which it is quite soluble. Subsequent contact angle
measurements indicate water-wet to intermediate-wet surfaces.
If, however, the washed surface is immersed in an aqueous phase, the results can be quite
different. This can be seen in Fig. 3.3.1-1 by comparing acetone-washed surfaces immersed in
decane with acetone-washed surfaces immersed in water for subsequent contact angle
measurements. For all three surfactants, the contact angles measured under water are much
higher than those measured under decane. Apparently there is some surfactant remaining on the
acetone-washed surfaces. In the presence of water at low or neutral pH, the surfactant nitrogen is
protonated and can adsorb much more strongly on the negatively charged mica surface than did
the surfactant in a non-polar solution. Diethanol amine, a compound analogous to CAM-2 and
TAM-2 without the hydrocarbon chain, has a pKa (pH at which the concentrations of protonated
and neutral forms are equal) of 8.88 (Dean, 1999); the pKas of the surfactants tested here are
likely close to this value. The limited effect of increasing hydrocarbon chain length on the value
of pKa is demonstrated by a comparison of diethylamine (pKa = 10.8) and didodecylamine (pKa
= 10.99) (Dean, 1999). Sorption of the protonated forms of the surfactants produces
intermediate to oil-wet conditions. The neutral form of the surfactant that dominates at pH 10 has
much less ability to sorb strongly on the mica surface, producing water-wet conditions.

74
AFM generally confirms the interpretation derived from contact angle measurements. In
air, with no water to ionize the surfactant, surfactant is weakly adsorbed and easily moved by the
AFM tip. Imaged under water, surfactant adsorption appears much more stable. Imaging under
pH 8 starts the process of surfactant removal, while imaging under a pH 10 buffer—where the
surfactant is in its neutral form—completes the surfactant removal process.
Since water is present in oil reservoirs, adsorption of surfactants like the polyethoxylated
amines in this study is likely to occur in cores obtained with oil-based drilling fluids. The
possibility that adsorption of this class of surfactants might be reversible at high pH is
encouraging, however, and worthy of additional study.
3.3.6 Summary of wetting effects of polyethoxylated amines
Polyethoxylated amines adsorb to mica much more strongly in the presence of water
(below a pH of about 8 or 9) than in the absence of water. Changing the hydrocarbon chain
length from 12 to 18 had little effect on surfactant adsorption, whereas changing the extent of
ethoxylation from two to five significantly reduced adsorption. Above pH 10, the presence of
water inhibits or even reverses adsorption.
Microscopic AFM images obtained in contact mode on mica surfaces treated with
polyethoxylated amine surfactants under air, distilled water, pH 8 and pH 10 buffers were
qualitatively consistent with interpretations of macroscopic contact angle measurements.
75
3.4 Surface effects of OBM and SBM surfactant (Skalli and Buckley)
The surfactant packages recommended for use in SBM formulations are essentially the
same as those used previously in OBM recipes. They consist of acidic materials derived from
tall oils with average chain length of about 18 carbons and polyaminated and other products
produced from reactions with tall oils. Trade names provide little or no information about the
structures of surfactants in these mixtures. Materials for this study were solicited from contacts
in oil, chemical, and service companies. Experimental techniques were based on previous
experience with drilling mud filtrates.
3.4.1 Wetting alteration – surfactant only without crude oil
Conceptual Model
When the surfactant concentration is less than the CMC value, the surfactant exists
primarily in the form of monomers (Fig. 3.4.1-1a). Surfactant can accumulate at either the
oil/water interface or the oil/mica or both. Each of these interfaces will approach saturation or
monolayer coverage as the surfactant concentration increases to values approaching the CMC.
Assuming that the hydrophilic heads are oriented toward the mica surface, the surface should
appear fairly oil-wet to the approaching drop of water. When concentrations are above the CMC,
surfactant accumulation at the oil/brine and oil/mica interfaces should be sufficient to saturate
the interfaces, producing monolayer coverage. Excess surfactant exists in micelles, which are in
equilibrium with monomers in the bulk phase. Water solubility for the products used in these
tests is very low; it is unlikely that micelles can exist in the water phase. At equilibrium, the
surfactant distribution should approach the situation illustrated in Fig. 3.4.1-1b. Note that with

76
more surfactant in the system, a bilayer can form on the solid surface, reducing the contact angle
to a drop of water.
decane
water
mica
decane
water
mica
inverse micelleinverse micelle
(a) distribution of oil-soluble surfactants below CMC (b) distribution of oil-soluble surfactants above CMC
Figure 3.4.1-1. Schematic illustration of surfactant distribution in the oil/water/solid system at surfactant concentrations below and above CMC.
Surfactant concentrations below CMC
Contact angles for water-advancing conditions measured with a drop of {pH 6, 0.1M}
buffer under an 0.002 vol% solution of Ez Mul in decane are shown in Fig. 3.4.1-2. Contact
time refers to the length of time that the drop of buffer remained in contact with the mica surface
before the contact angle was recorded. Wetting conditions are very close to neutral for this low
concentration of the Ez Mul product.
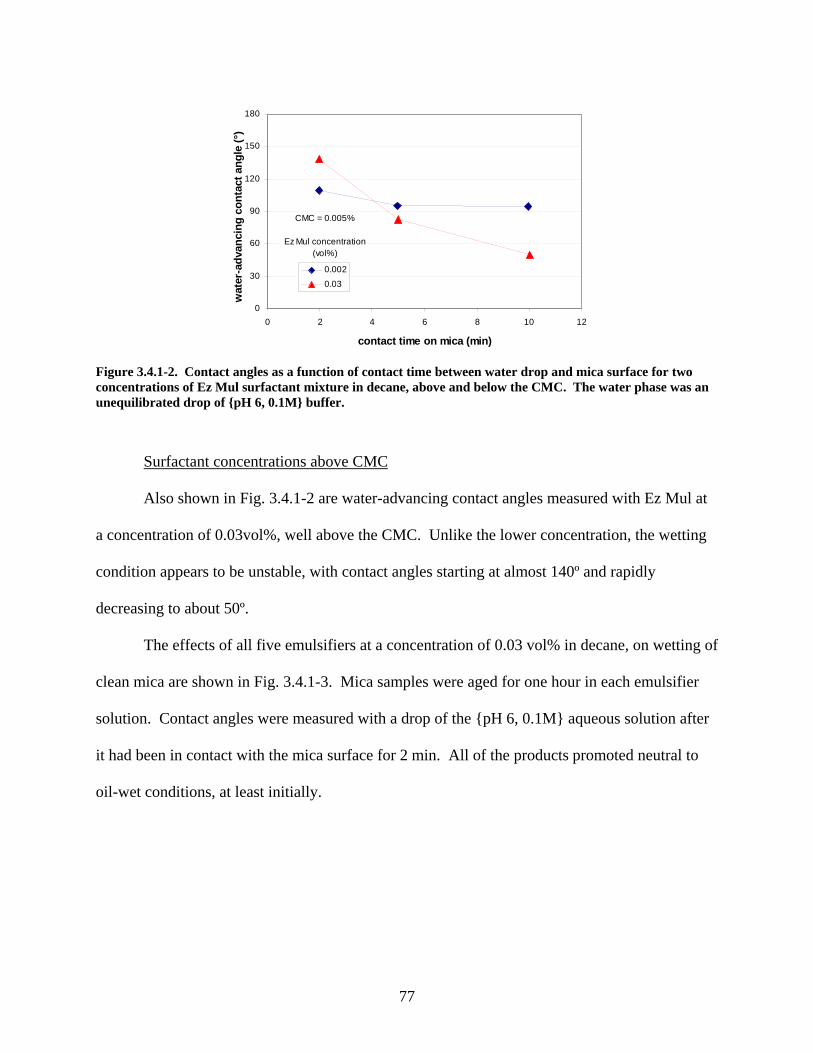
77
0
30
60
90
120
150
180
0 2 4 6 8 10 12
contact time on mica (min)
wat
er-a
dvan
cing
con
tact
ang
le (°
)
0.002
0.03
CMC = 0.005%
Ez Mul concentration(vol%)
Figure 3.4.1-2. Contact angles as a function of contact time between water drop and mica surface for two concentrations of Ez Mul surfactant mixture in decane, above and below the CMC. The water phase was an unequilibrated drop of {pH 6, 0.1M} buffer.
Surfactant concentrations above CMC
Also shown in Fig. 3.4.1-2 are water-advancing contact angles measured with Ez Mul at
a concentration of 0.03vol%, well above the CMC. Unlike the lower concentration, the wetting
condition appears to be unstable, with contact angles starting at almost 140º and rapidly
decreasing to about 50º.
The effects of all five emulsifiers at a concentration of 0.03 vol% in decane, on wetting of
clean mica are shown in Fig. 3.4.1-3. Mica samples were aged for one hour in each emulsifier
solution. Contact angles were measured with a drop of the {pH 6, 0.1M} aqueous solution after
it had been in contact with the mica surface for 2 min. All of the products promoted neutral to
oil-wet conditions, at least initially.

78
0 20 40 60 80 100 120 140 160
Ez Mul
Le Mul
Invermul
Versamul
Le Supermul
Surfazol
CA (degrees)
AdvRec
Figure 3.4.1-3. Comparison of the contact angles on clean mica surfaces exposed for 1 hr to emulsifier solutions, 0.03% by volume of product. The probe water drop is {pH 6, 0.1M} buffer. The contact time between the water drop and mica surface is 2 min.
It is not entirely clear, however, given the results in Fig. 3.4.1-2 above, how contact
angles should be measured in these systems. The results in Fig. 3.4.1-3 above were measured
with mica submerged in the surfactant/decane solution. This raises questions of kinetics of
surfactant/surface interactions (the total exposure time is the nominal aging time of 1 hour plus
the cumulative time over which measurements are proceeding). There are also questions about
the dynamic affects of forming and retracting a drop. In the measurements in Fig. 3.4.1-3, each
aqueous drop was formed and immediately contacted with the mica surface where it was allowed
to rest for two minutes. Fig. 3.4.1-4 shows changes in advancing contact angles that occur if the
drop is allowed to remain stationary on the surface for 5 or 10 minutes. For the Group 1
emulsifiers, substantial decreases in θA occur over the ten minute resting time. Much smaller
changes in the increasing direction can be seen for the Group 2 emulsifiers in Fig. 3.4.1-4.

79
0
30
60
90
120
150
180
LeSupermul
Ez Mul Le Mul Invermul Versamul
Wat
er-a
dvan
cing
ang
le (°
)
2 min5 min10 min
Contact angles measured with surfactant in decane
Figure 3.4.1-4. Water-advancing contact angles on mica exposed to surfactant solutions for 1 hr. Contact angles were measured with a drop of {pH 6, 0.1M} buffer in decane solutions of each surfactant (0.03 vol%). Results are shown for contact times of 2, 5, and 10 minutes, during which the advanced aqueous drop remained stationary on the mica surface are shown.
Another question is the persistence of these wetting changes. Surfactant-exposed mica
surfaces, analogous to the samples in Fig. 3.4.1-4 above, were transferred to fresh decane where
the contact angles were measured with no surfactant except that which remains adsorbed to the
mica surface (Fig. 3.4.1-5). Figure 3.4.1-6 compares the initial (2 min) and final (10 min) water-
advancing contact angles in surfactant solution (SS) and in decane. Group 1 contact angles start
high, but after 10 min are comparable to the measurements in decane. These changes are not due
to desorption, since surfactant is present in the decane phase. Desorption might account for the
differences observed with the Group 2 surfactants, all of which are stable in surfactant solution
and substantially lower in decane.

80
0
30
60
90
120
150
180
LeSupermul
Ez Mul Le Mul Invermul Versamul
Wat
er-a
dvan
cing
ang
le (°
)
2 min5 min10 min
Contact angles measured with decane only
Figure 3.4.1-5. Mica samples treated as in Fig. 10 above. After one hour, mica was removed from the surfactant solutions and submerged in decane for the contact angle measurements with {pH 6, 0.1M} buffer. Contact times between the water drop and mica surface were 2, 5, and 10 minutes.
0
30
60
90
120
150
180
LeSupermul
Ez Mul Le Mul Invermul Versamul
wat
er-a
dvan
cing
ang
le (°
)
SS-initialSS-finaldecane-initialdecane-final
Figure 3.4.1-6. Comparison of initial (2 min) and final (10 min) water-advancing angles for measurements in surfactant solution (SS) and in decane. Data are from Figs. 10 and 11 above.
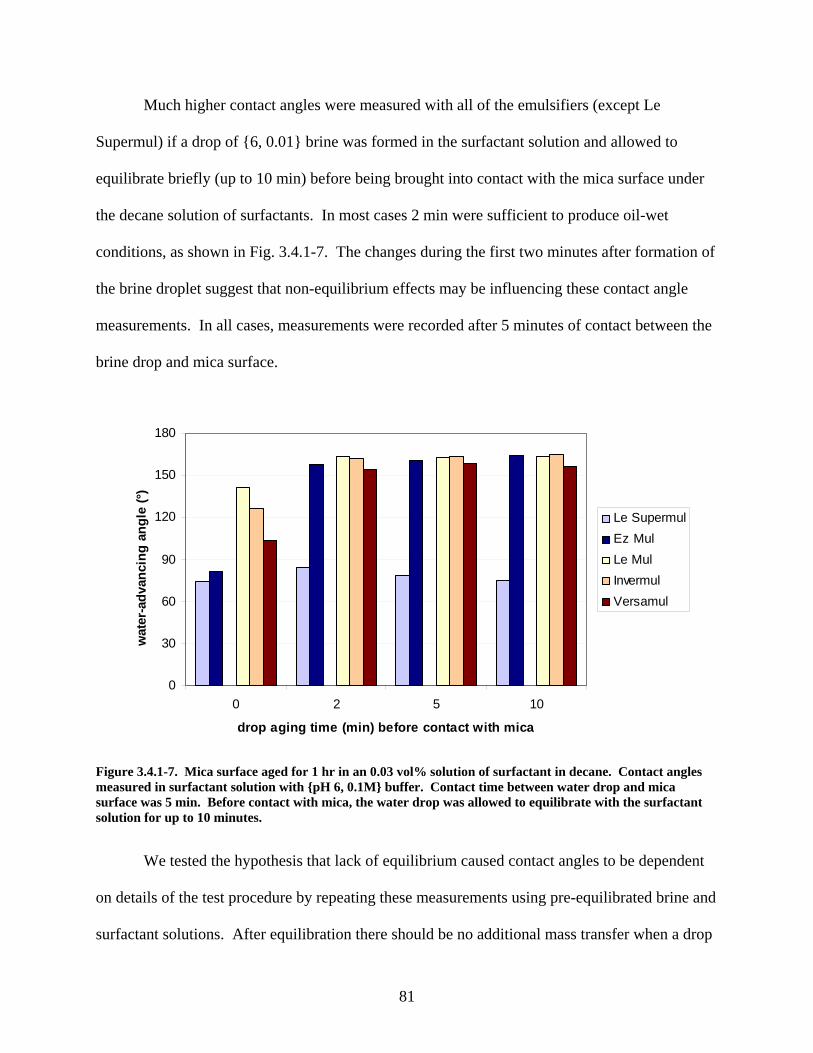
81
Much higher contact angles were measured with all of the emulsifiers (except Le
Supermul) if a drop of {6, 0.01} brine was formed in the surfactant solution and allowed to
equilibrate briefly (up to 10 min) before being brought into contact with the mica surface under
the decane solution of surfactants. In most cases 2 min were sufficient to produce oil-wet
conditions, as shown in Fig. 3.4.1-7. The changes during the first two minutes after formation of
the brine droplet suggest that non-equilibrium effects may be influencing these contact angle
measurements. In all cases, measurements were recorded after 5 minutes of contact between the
brine drop and mica surface.
0
30
60
90
120
150
180
0 2 5 10
drop aging time (min) before contact with mica
wat
er-a
dvan
cing
ang
le (°
)
Le SupermulEz MulLe MulInvermulVersamul
Figure 3.4.1-7. Mica surface aged for 1 hr in an 0.03 vol% solution of surfactant in decane. Contact angles measured in surfactant solution with {pH 6, 0.1M} buffer. Contact time between water drop and mica surface was 5 min. Before contact with mica, the water drop was allowed to equilibrate with the surfactant solution for up to 10 minutes.
We tested the hypothesis that lack of equilibrium caused contact angles to be dependent
on details of the test procedure by repeating these measurements using pre-equilibrated brine and
surfactant solutions. After equilibration there should be no additional mass transfer when a drop

82
of the brine is formed in the surfactant solution. Fig. 3.4.1-8 shows that the changes in contact
angles were eliminated when the fluids were mixed and allowed to separate for 4-12 days. All
measurements were made after 5 min of contact between brine droplet and the solid surface.
0
30
60
90
120
150
180
0 2 4 6 8 10 12
∆t from drop formation to contact with mica (min)
wat
er-a
dvan
cing
con
tact
ang
le (°
)
0
4
12
equilibration time(days)
Figure 3.4.1-8. The effect of drop aging time illustrated in Fig. 13 was eliminated if the Ez Mul surfactant solution and aqueous buffer were pre-equilibrated for 4-12 days.
Why the effect of non-equilibrium was so consistently to increase contact angles, making
the surface appear more oil-wet, we can only conjecture at this point. During this period,
surfactant must be accumulating at the newly formed oil/brine interface. Some surfactant may be
transferred into the brine phase although the amount is expected to be small. Since the surfactant
concentration is above CMC, the situation is similar to Fig. 3.4.1-1b above, except that the
equilibrium conditions of monolayer adsorption at the oil/brine interface have yet to be
established. Thus, the distribution of surfactants may resemble the situation illustrated in Fig.
3.4.1-9. Although there is a concentration of monomers, most of the surfactant is in the reverse
micelles with the polar heads shielded from contact with the new oil/water interface. In order to
satisfy the requirement for additional surfactant at the oil/water interface, some of the micelles

83
must release surfactant. One way they might do that is to divide into hemi-micelles, exposing
polar head groups that partition to the oil/water interface.
decane
water
mica Figure 3.4.1-9. Surfactant distribution in an oil/water/mica system with oil-soluble surfactant concentration greater than CMC, when the brine drop is allowed to equilibrate briefly with the surfactant solution before contact with the mica surface.
This hemi-micelle stage might well be a temporary one, with hemi-micelles replaced by
monomers as the surfactants disassociate. During the period when hemi-micelle accumulation
dominates, however, excess surfactant might be trapped between water and mica, producing
higher-than-equilibrium contact angles. Whether such trapped surfactant could eventually
diffuse away from the contact area or would remain trapped has not yet been investigated.
Figure 3.4.1-10 compares contact angles measured with unequilibrated fluids and those
measured with fluids that were mixed and allowed to separate for 4 days and for 12 days as a
function of contact time between the aqueous phase droplet and the mica surface. Equilibration
eliminates the changes that were observed for different contact times, and the angles approach
those measured on surfactant-treated mica measured in fresh decane. Ez Mul was used in all of
these experiments.

84
0
30
60
90
120
150
180
0 2 4 6 8 10 12
contact time on mica (min)
wat
er-a
dvan
cing
con
tact
ang
le (°
)0-SS4-SS
12-SS
0-decane
equilibration time(days)
Figure 3.4.1-10. Changes that occur with the time of contact between water drop and mica surface can be eliminated by preequilibration of the oleic and aqueous phases. Contact angles were measured in surfactant solution (SS = 0.03vol% Ez Mul in decane) or in decane alone with {pH 6, 0.1 M} buffer. Contact times between water drop and mica surface were 2, 5, and 10 minutes.
In the interests of reproducibility, preequilibrated fluids should be used for contact angle
experiments. However, it is worth considering that non-equilibrium conditions may prevail
during the drilling process and that surfaces may, at least temporarily, become quite oil-wet.
Whether surfactant can be trapped indefinitely is unclear. Perhaps with time, the excess
surfactant would diffuse away from the surface and contact angles would decrease.
We addressed the question of whether enough surfactant could partition into the aqueous
phase to alter wetting. Figure 3.4.1-11 shows that very water-wet conditions are produced,
comparable to those for clean surfaces with brine and decane, when contact angles are measured
using brine that was preequilibrated with a decane solution of surfactant. The differences are
within the accuracy of the contact angle measurements.

85
0
10
20
30
0 2 4 6 8 10 12
∆t from drop formation to contact with mica (min)
wat
er-a
dvan
cing
con
tact
ang
le (°
)
0
12
equilibration time(days)
Figure 3.4.1-11. Water advancing contact angles between decane and {pH 6, 0.1M} buffer. The results are indistinguishable regardless of whether the aqueous buffer used had been preequilibrated with surfactant solution (0.03vol% Ez Mul in decane) or not.
3.4.2 Wetting alteration – surfactants and crude oils
To study crude oil interactions with mineral surfaces in the presence of an aqueous phase,
we used previously established protocols (Liu and Buckley, 1997, 1999). Mica was equilibrated
with {pH 4, 0.01M} brine. Wet mica was aged in crude oil for 21 days, after which it was rinsed
with toluene and submerged in decane for contact angle measurements. Three oils were used in
this investigation: LB-03, C-AL-03, and Cottonwood-03 (Appendix II). Results are shown in
Fig. 3.4.2-1.

86
pH 4
0.0
30.0
60.0
90.0
120.0
150.0
180.0
LB- 03 C-AL-03 Cottonwood 03
cont
act a
ngle
(°)
advancingreceding
Figure 3.4.2-1. Decane/buffer contact angles for mica exposed to {pH 4, 0.01 M} buffer for 24 hrs, then to one of three crude oils for 21 days at ambient temperature. Crude oil was removed by rinsing with toluene.
Subtle changes in wetting were found when varying amounts of Ez Mul (0.005 – 1 vol%)
were added to the LB-03 crude oil, as shown in Fig. 3.4.2-2. Only the intermediate
concentrations (0.0025 – 0.01) gave contact angles that were distinctly different than the oil with
no added emulsifier and the differences were small (from a water advancing angle of 102° to a
maximum of 128° for the 0.0025% mixture). Above 0.01%, the contact angles were lower than
the maximum value and indistinguishable from the oil with no added Ez Mul.
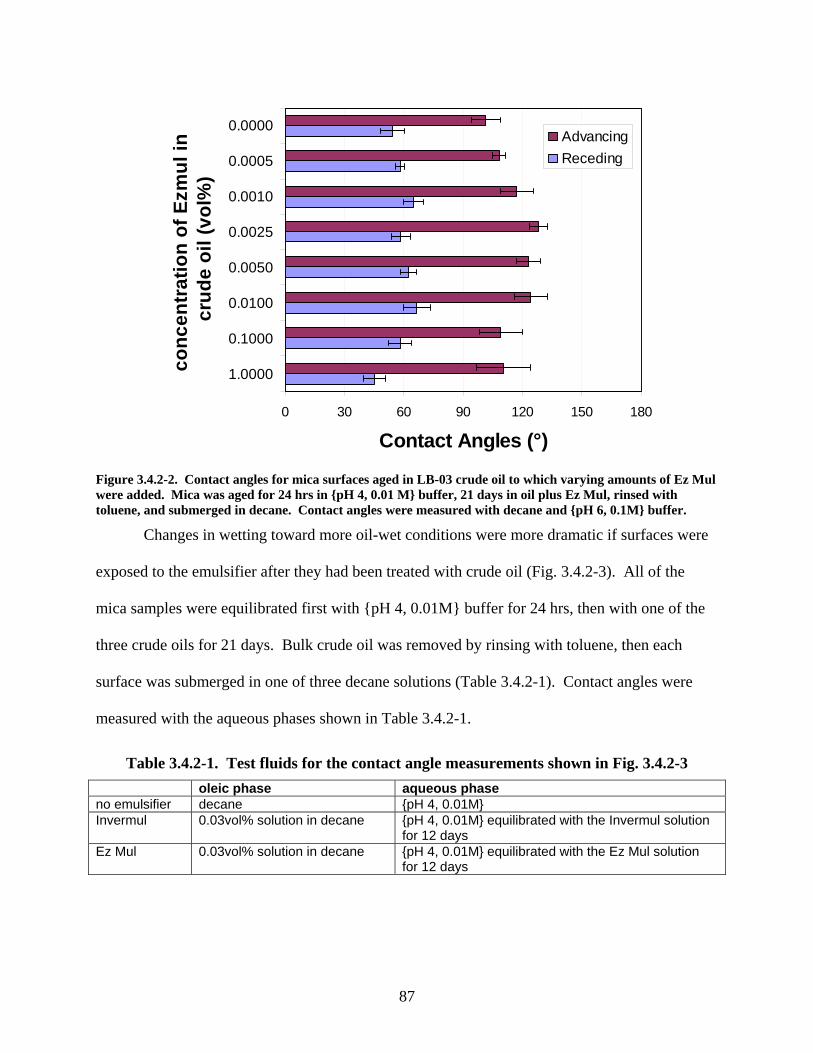
87
0 30 60 90 120 150 180
1.0000
0.1000
0.0100
0.0050
0.0025
0.0010
0.0005
0.0000
conc
entr
atio
n of
Ezm
ul in
cr
ude
oil (
vol%
)
Contact Angles (°)
AdvancingReceding
Figure 3.4.2-2. Contact angles for mica surfaces aged in LB-03 crude oil to which varying amounts of Ez Mul were added. Mica was aged for 24 hrs in {pH 4, 0.01 M} buffer, 21 days in oil plus Ez Mul, rinsed with toluene, and submerged in decane. Contact angles were measured with decane and {pH 6, 0.1M} buffer.
Changes in wetting toward more oil-wet conditions were more dramatic if surfaces were
exposed to the emulsifier after they had been treated with crude oil (Fig. 3.4.2-3). All of the
mica samples were equilibrated first with {pH 4, 0.01M} buffer for 24 hrs, then with one of the
three crude oils for 21 days. Bulk crude oil was removed by rinsing with toluene, then each
surface was submerged in one of three decane solutions (Table 3.4.2-1). Contact angles were
measured with the aqueous phases shown in Table 3.4.2-1.
Table 3.4.2-1. Test fluids for the contact angle measurements shown in Fig. 3.4.2-3 oleic phase aqueous phase no emulsifier decane {pH 4, 0.01M} Invermul 0.03vol% solution in decane {pH 4, 0.01M} equilibrated with the Invermul solution
for 12 days Ez Mul 0.03vol% solution in decane {pH 4, 0.01M} equilibrated with the Ez Mul solution
for 12 days

88
Crude oil: LB-03
0 30 60 90 120 150 180
Ezmul
Invermul
no emulsifier
Contact angles
AdvRec
(a) mica treated with {pH 4, 0.01 M} buffer (24 hrs) and LB-03 crude oil (21 days)
Crude oil: C-AL-03
0 30 60 90 120 150 180
Ezmul
Invermul
no emulsifier
Contact angles
AdvRec
(b) mica treated with {pH 4, 0.01 M} buffer (24 hrs) and C-AL-03 crude oil (21 days)
Crude oil: Cottonwood-03
0 30 60 90 120 150 180
Ezmul
Invermul
no emulsifier
Contact angles
AdvRec
(c) mica treated with {pH 4, 0.01 M} buffer (24 hrs) and Cottonwood-03 crude oil (21 days)
Figure 3.4.2-3. Contact angles (water-advancing and receding) measured on mica surfaces exposed first to buffer, then to crude oil. Contact angles were measured between buffer and decane or decane solutions of emulsifier (0.03vol%).

89
A suggested mechanism for producing very oil-wet conditions when oil-treated mica
surfaces are submerged in surfactant solutions is shown in Fig. 3.4.2-4. Components adsorbed
from the crude oil alter the surface properties. Polar head groups of monomers are not likely to
adsorb, nor is there any reason why surfactant tails should be adsorbed since that would produce
a region of head groups in the non-polar solvent. Instead, reverse micelles could adsorb, making
the oil-treated surfaces very oil-wet. Note that the coverage illustrated for the oil components is
less than complete, which might produce the weakly-water-wet and intermediate conditions
observed for two of the three crude oils (C-AL-03 and LB-03). Only with the added adsorption
of reverse micelles of surfactant does the surface become oil-wet in this scenario. A denser
coverage with oil components would produce the behavior observed with the Cottonwood oil.
decane
water
mica Figure 3.4.2-4. Adsorption of reverse micelles on the oil-treated mica surface would produce very oil-wet conditions.
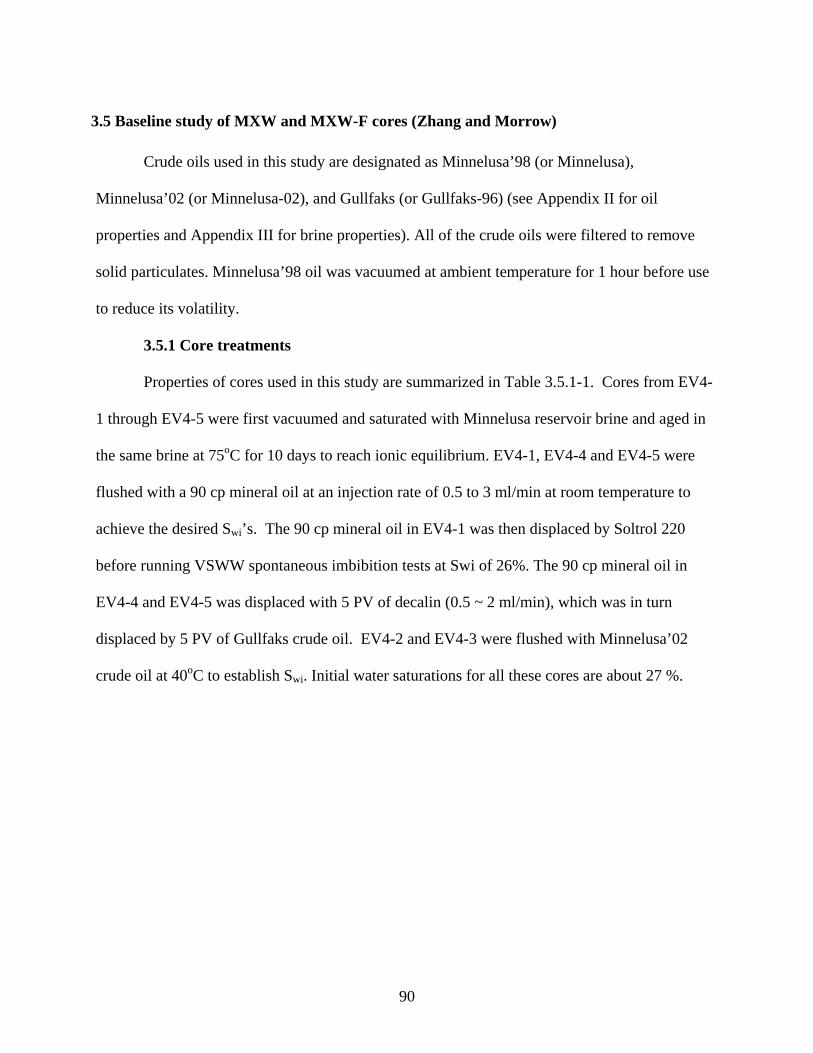
90
3.5 Baseline study of MXW and MXW-F cores (Zhang and Morrow)
Crude oils used in this study are designated as Minnelusa’98 (or Minnelusa),
Minnelusa’02 (or Minnelusa-02), and Gullfaks (or Gullfaks-96) (see Appendix II for oil
properties and Appendix III for brine properties). All of the crude oils were filtered to remove
solid particulates. Minnelusa’98 oil was vacuumed at ambient temperature for 1 hour before use
to reduce its volatility.
3.5.1 Core treatments
Properties of cores used in this study are summarized in Table 3.5.1-1. Cores from EV4-
1 through EV4-5 were first vacuumed and saturated with Minnelusa reservoir brine and aged in
the same brine at 75oC for 10 days to reach ionic equilibrium. EV4-1, EV4-4 and EV4-5 were
flushed with a 90 cp mineral oil at an injection rate of 0.5 to 3 ml/min at room temperature to
achieve the desired Swi’s. The 90 cp mineral oil in EV4-1 was then displaced by Soltrol 220
before running VSWW spontaneous imbibition tests at Swi of 26%. The 90 cp mineral oil in
EV4-4 and EV4-5 was displaced with 5 PV of decalin (0.5 ~ 2 ml/min), which was in turn
displaced by 5 PV of Gullfaks crude oil. EV4-2 and EV4-3 were flushed with Minnelusa’02
crude oil at 40oC to establish Swi. Initial water saturations for all these cores are about 27 %.
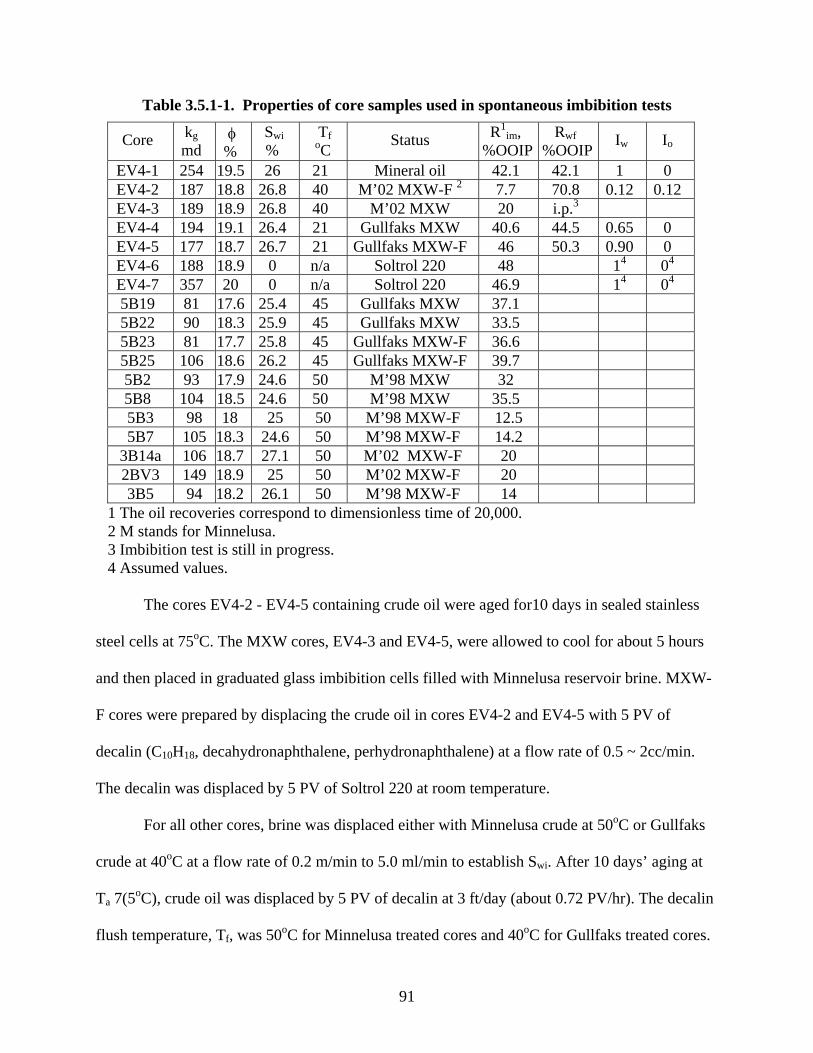
91
Table 3.5.1-1. Properties of core samples used in spontaneous imbibition tests
Core kg md
φ %
Swi %
Tf oC
Status R1im,
%OOIPRwf
%OOIP Iw Io
EV4-1 254 19.5 26 21 Mineral oil 42.1 42.1 1 0 EV4-2 187 18.8 26.8 40 M’02 MXW-F 2 7.7 70.8 0.12 0.12 EV4-3 189 18.9 26.8 40 M’02 MXW 20 i.p.3
EV4-4 194 19.1 26.4 21 Gullfaks MXW 40.6 44.5 0.65 0 EV4-5 177 18.7 26.7 21 Gullfaks MXW-F 46 50.3 0.90 0 EV4-6 188 18.9 0 n/a Soltrol 220 48 14 04 EV4-7 357 20 0 n/a Soltrol 220 46.9 14 04 5B19 81 17.6 25.4 45 Gullfaks MXW 37.1 5B22 90 18.3 25.9 45 Gullfaks MXW 33.5 5B23 81 17.7 25.8 45 Gullfaks MXW-F 36.6 5B25 106 18.6 26.2 45 Gullfaks MXW-F 39.7 5B2 93 17.9 24.6 50 M’98 MXW 32 5B8 104 18.5 24.6 50 M’98 MXW 35.5 5B3 98 18 25 50 M’98 MXW-F 12.5 5B7 105 18.3 24.6 50 M’98 MXW-F 14.2
3B14a 106 18.7 27.1 50 M’02 MXW-F 20 2BV3 149 18.9 25 50 M’02 MXW-F 20 3B5 94 18.2 26.1 50 M’98 MXW-F 14
1 The oil recoveries correspond to dimensionless time of 20,000. 2 M stands for Minnelusa. 3 Imbibition test is still in progress. 4 Assumed values.
The cores EV4-2 - EV4-5 containing crude oil were aged for10 days in sealed stainless
steel cells at 75oC. The MXW cores, EV4-3 and EV4-5, were allowed to cool for about 5 hours
and then placed in graduated glass imbibition cells filled with Minnelusa reservoir brine. MXW-
F cores were prepared by displacing the crude oil in cores EV4-2 and EV4-5 with 5 PV of
decalin (C10H18, decahydronaphthalene, perhydronaphthalene) at a flow rate of 0.5 ~ 2cc/min.
The decalin was displaced by 5 PV of Soltrol 220 at room temperature.
For all other cores, brine was displaced either with Minnelusa crude at 50oC or Gullfaks
crude at 40oC at a flow rate of 0.2 m/min to 5.0 ml/min to establish Swi. After 10 days’ aging at
Ta 7(5oC), crude oil was displaced by 5 PV of decalin at 3 ft/day (about 0.72 PV/hr). The decalin
flush temperature, Tf, was 50oC for Minnelusa treated cores and 40oC for Gullfaks treated cores.

92
Decalin was then displaced with 5 PV of mineral oil of selected viscosity at ambient temperature
(21oC).
3.5.2 Gullfaks oil
Imbibition rates for the Gullfaks core were initially slower than for the Berea 250, Swi =
0 % , reference curve and for the Berea 250, Swi = 26 % curve (see Fig. 3.5.2-1). At the late
stage of imbibition, recovery from the MXW-F core was higher than for the VSWW cores. The
small wettability change observed for the Gullfaks oil is consistent with previous observations
(Tong et al., 2002b).
0
10
20
30
40
50
60
70
80
90
100
1 10 100 1000 10000 100000tD
Rim
, %O
OIP
EV4-4(MXW) 194 26.4 0.91
EV4-5(MXW-F) 177 26.7 0.90
Core kg (md) Swi (%) IAmott
Gullfaks oilMinnelusa RBTa = 75oCTf = Tm = 21oC
Berea 250 Swi = 0 %
Berea 250 Swi = 26 %
Figure 3.5.2-1. Comparison of spontaneous imbibition characteristics between Gullfaks MXW and MXW-F Berea 250 cores.
Figure 3.5.2-2 shows the imbibition characteristics for duplicate tests of Gullfaks MXW
and MXW-F cores. The two curves for either MXW or MXW-F cores show good reproducibility.
93
0
1020
3040
50
6070
8090
100
1 10 100 1000 10000 100000 1000000tD
Rim
, %O
OIP
5B19 (MXW) 81 25.4 18.6 5B22 (MXW) 90 25.9 18.6 5B23 (MXW-F) 81 25.8 19.85B25 (MXW-F) 106 26.2 19.8
Core kg(md) S wi (%) µo(cp)
Berea 90 Swi = 0%Gullfaks oilseawaterTa = 75oCTf = 50oCTm = 21oC
Figure 3.5.2-2. Comparison between Gullfaks MXW and MXW-F Berea 90 cores.
The scaled imbibition curves in Fig. 3.5.2-2 are comparable to those shown in Fig. 3.5.2-
1. Both sets of tests show a crossover between the imbibition curves for MXW-F and MXW
cores at the late stage of imbibition. After about 8 days’ imbibition, the cores EV4-4 and EV4-5
(see Fig. 3.5.2-1) showed cessation of oil production, but the cores presented in Fig. 3.5.2-2
showed slow continued production of oil.
3.5.3 Minnelusa oil
Imbibition characteristics for cores prepared with Minnelusa ’02 are shown in Fig. 3.5.3-
1. Imbibition rates for the Minnelusa oil prepared cores were much slower than for the cores
treated with Gullfaks oil. The Amott wettability index for EV4-2 is 0.

94
0102030405060708090
100
1 10 100 1000 10000 100000tD
Rim
, %O
OIP
EV4-3(MXW) 189 26.8 i.p. i.p. i.p.EV4-2(MXW-F) 187 26.8 0.12 0.12 0
Berea 250 Swi = 0 %
Core kg(md) Swi (%) Iw Io IAmott
Minnelusa'02 oil & RBTa = 75oC Tf = 40oCTm = 21oC Berea 250 Swi = 26 %
Figure 3.5.3-1. Comparison of imbibition rates between Minnelusa ’02 MXW and MXW-F Berea 250 cores.
The cores used to obtain the results shown in Fig. 3.5.3-2 were from a different block of
Berea sandstone and treated using Minnelusa’98 oil. The imbibition results give close
reproducibility and are qualitatively similar to the comparison of MXW and MXW-F results
shown in Fig. 3.5.3-1. Both sets of tests indicate that MXW cores have higher imbibition rate
than for MXW-F cores.

95
0
10
20
30
40
50
60
70
80
90
100
1 10 100 1000 10000 100000 1000000tD
Rim
, %O
OIP
5B2 (MXW) 93 24.6 77.2 5B8 (MXW) 104 24.6 77.25B7 (MXW-F) 105 24.6 83.85B3 (MXW-F) 98 25.0 3.83B5 (MXW-F) 94 26.1 3.8
Berea 90 Swi = 0 %Minnelusa'98 oil Minnelusa RBTa = 75oCTf = 50oCTm = 21oC
Core kg(md) Swi (%) µo(cp)
Figure 3.5.3-2. Comparison of imbibition between Minnelusa’98 MXW and MXW-F Berea 90 cores.
Fig. 3.5.3-3 shows a comparison of MXW-F cores for Minnelusa’98 oil and
Minnelusa’02 oil. The dotted line is an average result obtained from the three MXW-F curves
shown in Fig. 3.5.3-2. The MXW-F cores prepared using Minnelusa’02 oil have a slightly higher
imbibition rate than the MXW-F cores prepared with Minnelusa’98 oil.

96
0
10
20
30
40
50
60
70
80
90
100
1 10 100 1000 10000 100000 1000000tD
Rim
, %O
OIP
3B14a (MXW-F) 106 26.82BV3 (MXW-F) 149 25.0
Berea 90 Swi = 0 %
Core kg(md) S wi (%)
Minnelusa'02 oilMinnelusa RBTa =75 oCTf =50 oCTm = 21 oC
Minnelusa'98 MXW-F
Minnelusa'02 MXW-F
Figure 3.5.3-3. Comparison between Minnelusa’98 and Minnelusa’02 MXW-F Berea 90 cores.
3.5.4 Stability of MXW-F
The stability of the organic film deposited on the on the rock surface was tested for
consecutive cycles of imbibition and drainage (Tong et al., 2002b and c). The results are shown
in Fig. 3.5.4-1. After the 1st cycle of imbibition, the brine in 5B7 was displaced by mineral oil at
room temperature to re-establish initial water saturation. The displacement rate ranged from 0.1
to 6.0 ml/min (about 0.36 to 22.5 PV/hr) based on the viscosity of the mineral oil and the desired
Swi. Five cycles of imbibition tests were performed on this core. The imbibition behavior shows
good reproducibility indicating that the film on the rock surface is stable.

97
0
10
20
30
40
50
60
70
80
90
100
1 10 100 1000 10000 100000 1000000
tD
Rim
, %O
OIP
1 24.6 83.8 2 23.7 83.83 22.6 83.84 22.6 83.85 22.1 83.86 22.0 83.8 7 22.0 (LVT 200, 2.9 cp)8 20.5 (0.015 vol% Le Supermul (3.7cp) in Soltrol 220)
Cycle S wi (%) µo(cp)
Berea 90 Swi = 0 %5B7 (105 md) MXW-FMinnelusa'98 oil & RBT a= 75oCT f = 50oCT m = 21oC
(after Swi aging)
Figure 3.5.4-1. The effect of base oil and addition of emulsifier (LE SUPERMUL) on imbibition for Minnelusa’98 MXW-F Berea 90 core.
The stability of the MXW-F was also tested on another MXW-F core (3B5). Oil recovery
versus dimensionless time is presented in Fig. 3.5.4-2. The close agreement in the first three
imbibition curves indicated that that wetting conditions for the core did not change significantly
during this series of tests.

98
0
10
20
30
40
50
60
70
80
90
100
1 10 100 1000 10000 100000 1000000tD
Rim
, %O
OIP
1 26.1 3.82 25.7 3.8 3 25.6 3.84 25.15 24.8 (0.015 vol% EzMul in Soltrol 220 )
Berea 90 Swi = 0 %3B5 (94 md) MXW-FMinnelusa'98 oil & RBT a = 75 oCT f = 50 oCT m = 21 oC
Cycle Swi (%) µo(cp)
(after Swi aging)(Petrofree SF, 3.4 cp)
Figure 3.5.4-2. The effect of base oil and addition of emulsifier (EZ MUL®NT) on the imbibition of Minnelusa’98 MXW-F Berea 90 core.
3.5.5 Effect of SBM components on MXW-F cores
SBM base oil
After the 5th imbibition into 5B7 and 2nd imbibition into 3B5, Swi was re-established by
displacement with viscous mineral oil, which was in turn displaced by oil of selected viscosity
(83.8 cp for 5B7 and 3.8 cp for 3B5). Then, the cores were aged for 10 days. The results shown
in Figs. 3.5.5-1 and 3.5.5-2 indicate that the re-aging at Swi had minor effect on wettability.
After the 6th imbibition, Swi was re-stored for the 5B7 core by flow of the heavy mineral
oil. The heavy oil was displaced with 5 PV of LVT 200 oil. Fig.8 shows that the scaled
imbibition behavior of 5B7 treated with LVT 200 oil (viscosity of 2.9 cp) is close to those
obtained for the previous six consecutive imbibition measurements made with reference mineral
oils.

99
Another SBM base oil designated as Petrofree®SF was also tested. Fig. 3.5.5-2 indicates
that this SBM base oil also has no significant effect on the imbibition behavior of the Minnelusa
MXW-F core.
SBM emulsifiers
After the 7th imbibition, Swi was restored by flow of heavy mineral oil which was then
replaced by injection of 5 PV of Soltrol 220 containing 0.015 vol % of LE SUPERMUL, an
emulsifier used in synthetic oil-based mud. The subsequent imbibition test run on this core
shows that the early stage imbibition rate was obviously suppressed because of exposure of the
core to the emulsifier. A second test was run for SBM emulsifier, EZ MUL®NT. After the 4th
imbibition cycle, Swi of 3B5 was restored again and then the viscous mineral oil was replaced
with 5 PV of Soltrol 220 containing 0.0015 vol % of EZ MUL®NT. The curve with respect to the
fifth cycle (see Fig. 3.5.5-2) shows significant suppression of spontaneous imbibition.
3.5.6 Summary of baseline core study
• A selection of crude oils rocks and base oils and additives for SBMs have been assembled.
Basic characterization of rocks and oils are being obtained.
• Baseline data for VSWW imbibition have been measured for a range of conditions.
• Mixed wettability cores have been prepared by adsorption from two distinctly different types
of crude oil. Results could be reproduced and the wetting states were stable with respect to
repeated imbibition cycles.
• Base oils for SBM muds had no significant effect on the wettability of MXW-F cores.
• SBM emulsifiers caused a significant reduction in imbibition rate for MXW-F cores.

100
3.6 Effect of SBM base oils on asphaltene stability and wetting in sandstone cores (Zhang,
Morrow, Wang, and Buckley)
3.6.1 Background
With the increasing use of oil-based drilling fluids, obtaining cores with wettability that is
representative of reservoir conditions is becoming more difficult. The surfactants used in oil-
based muds have long been suspected of affecting core wettability. They necessitate extensive
cleaning and wettability restoration that add to the uncertainty in the results of core studies. The
introduction of synthetic oil-based muds (SBM) has compounded the problem of wettability
alteration by raising the prospect of surface precipitation of asphaltenes.
In synthetic oil-based drilling fluids, diesel has been replaced, for environmental reasons,
by base oils that are very low in aromatic hydrocarbons. Several types of base oil are now in use.
They may be paraffinic or olefinic or they may consist of other organic compounds such as esters.
At sufficiently high concentration in mixtures with crude oils (for example in mixing zones
associated with displacement of crude oil), the paraffinic base oils are very likely to precipitate
asphaltenes. Simple tests of asphaltene onset conditions show that a variety of olefinic base oils
can also destabilize asphaltenes whereas ester products do not.
Asphaltenes are implicated in many undesirable phenomena including plugging, fouling,
emulsion stabilization, and wettability alteration. The extent to which asphaltenes create
problems is more closely related to their stability than to their amount in an oil. Asphaltenes can
be destabilized when oils are depressurized or when oils are mixed with injected or lift gas.
Synthetic oil-based drilling muds are a previously unrecognized source of potentially
destabilizing fluid.

101
Asphaltene stability
Asphaltenes, by definition, are the materials in a crude oil that are soluble in toluene and
insoluble in pentane, hexane, or heptane. They represent a range of materials, some of which are
insoluble in even higher molecular weight hydrocarbons such as pentadecane and more of which
are insoluble in propane, ethane, and methane. The most direct method to assess the potential for
any additive to destabilize asphaltenes is to add different amounts of additive to an oil and
observe the resulting mixtures after some time has elapsed. (Note that adding oil to additive can
result in locally high concentrations of additive and overestimation of the tendency for
flocculation to occur.) The amount of time allowed before observations should be determined by
the flocculation kinetics, which can sometimes be slow, on the order of days (Mason and Lin,
2003). The appearance of asphaltene aggregates in an initially clear mixture indicates instability.
The mixture with the smallest amount of additive in which aggregates appear is designated as the
onset mixture.
The solubility parameter of onset mixtures with n-paraffins can be estimated from
measurements of refractive index (RI) (Buckley et al., 1998a). For the synthetic base oils, there
is no simple conversion between RI and solubility parameter. Nevertheless, PRI (the RI of the
mixture at the onset of precipitation) can provide a relative indication of stability.
Wettability alteration and assessment
Contact with crude oil, bitumen, or their heavy products such as fuel oil, coal tar, or
creosote can alter the wetting of initially water-wet minerals through adsorption of polar
materials including asphaltenes (Buckley, 2001a, and references cited therein). The extent of
such wetting changes can be observed on smooth surfaces by measurements of contact angles

102
and in porous media by observing the rate and extent of spontaneous imbibition of water or oil
(Morrow, 1990; Morrow and Mason, 2001; Tong, 2003a).
Surface precipitation
The extent to which a particular crude oil alters wetting depends on many factors. These
include the nature of the polar fractions of the oil, the mineralogy of surfaces with which the oil
comes in contact, and the composition of the aqueous phase, if water is present. Buckley et al.
(1998b) demonstrated that adsorption mechanisms in the absence of water can be completely
different to those when water is present. In the latter case, there are several potential
mechanisms by which oil components adsorb on mineral surfaces including acid/base and ion-
binding interactions, and surface precipitation of asphaltenes. The potential for surface
precipitation depends on the existence of asphaltene components and on their stability. Al-
Maamari and Buckley (2003) demonstrated sharp increases in contact angles, indicating oil-wet
conditions, on mica surfaces aged in onset mixtures of crude oils and heptane, compared to mica
aged in the same crude oils without added heptane. It is likely that surface precipitation is
responsible for making Berea sandstone cores less water-wet when an asphaltic crude oil is
miscibly displaced by a paraffinic mineral oil. A comparison is shown in Fig. 3.6.1-1 (using data
from Tie et al., 2003) for Minnelusa crude oil, displaced by decalin (5 pore volumes) followed
by Soltrol 220 (a paraffinic mineral oil) and the same crude oil displaced directly by the mineral
oil. Slow and very limited extent of displacement of oil from Berea sandstone by spontaneous
imbibition of water after direct displacement by paraffinic mineral oil indicates that this core is
much less water-wet than a similarly treated core in which direct contact between crude and
mineral oils is avoided by displacement with decalin, an intermediate solvent.

103
0
10
20
1 10 100 1000 10000 100000 1000000tD, Dimensionless Time
Oil
Rec
over
y, %
OO
IP
Decalin/Soltrol 220
Soltrol 220
Minnelusa crude oil displaced with:
Figure 3.6.1-1. Cores are less water-wet, as indicated by slower imbibition if crude oil is displaced with a paraffinic oil (after Tie et al., 2003). The dimensionless time, tD, is defined by Eq. 1, below.
Tests of imbibition rates in Berea sandstone cores were used to examine the wettability
effects of displacement of crude oils with a number of synthetic base oils. In all cases examined
to date, the products that flocculated asphaltenes from crude oils also caused water-wet
sandstone cores to become markedly less water-wet or even oil-wet. Relatively minor effects on
wetting were observed with base oils that did not destabilize asphaltenes. A simple diagnostic
test of asphaltene stability can be used to identify specific crude oil/base oil pairs that precipitate
asphaltenes.
3.6.2 Experimental details
Crude oils.
Three crude oils were used in this study: Fuji (or C-F-03) from the Gulf of Mexico,
Gullfaks (or Gullfaks-96) from the North Sea, and Minnelusa from Wyoming. Properties of
104
these oils are summarized in Appendix II. They span a range of asphaltene content from 0.4 to
9%. The tendencies of Gullfaks and Minnelusa to alter the wetting of silicate surfaces has been
shown to be quite different (Xie et al., 2002). Strong wetting alteration of a quartz glass surface
was shown to be very stable to repeated measurement cycles of water advancing and receding for
Minnelusa crude oil, whereas the extent of wetting alteration induced by Gullfaks decreased with
each measurement cycle, returning the surface to more water-wet conditions.
Synthetic base oils and n-paraffins
Selected synthetic base oils were tested for their tendency to precipitate asphaltenes from
Fuji and Minnelusa crude oils. It is difficult to quantify the onset conditions in Gullfaks because
there is very little material in the asphaltene fraction (Table 3.6.2-1). Properties of the base oils
tested are summarized in Table 2, with density and viscosity data included for oils used in core
tests. Soltrol 220, a refined mineral oil composed of C13-C16 iso-alkanes, is not a synthetic base
oil, but is included in this study because it is frequently used in laboratory displacement tests,
including those shown in Fig. 3.6.1-1. Asphaltene stability was also tested with three n-
paraffins—n-heptane (n-C7), n-undecane (n-C11), and n-pentadecane (n-C15), all of which were
purchased from Fisher Scientific with greater than 99% purity—for comparison to the synthetic
base oils.

105
Table 3.6.2-1. Properties of base oils and mineral oil
Trade name Material description Density at 20°C (g/ml)
Viscosity at 20°C (mPa s)
Accolade blend of internal olefins and esters Biobase 240 linear alpha olefins Biobase 560 linear paraffins EDC 99DW highly hydrogenated mineral oil GOM 4 blend internal olefins
LVT 200 paraffins 0.8177 2.91
Petrofree (original) fatty acid esters Petrofree LV fatty acid esters 0.8617 3.86 Petrofree SF internal olefins 0.7847 3.64 SF Base internal olefins Soltrol 220 C13-C16 isoalkanes 0.7833 3.80 XP-07 linear paraffins
Cores
Berea sandstone core samples, 3.8 cm in diameter and 7.5 cm in length, were cut from
two blocks, identified as C4 and C5, with similar petrophysical properties. Their average air
permeability (kg) was about 80md and porosity was about 17%. Initially water-wet cores were
exposed first to synthetic seawater (containing 28,000 ppm NaCl, 935 ppm KCl, 5,365 ppm
MgCl2, 1,190 ppm CaCl2, and 100 ppm of NaN3 as biocide,with a total dissolved solids content
of 35,490 ppm), then flooded with viscous mineral oil to establish an initial water saturation (Swi).
The mineral oil was displaced by decalin which was in turn displaced by crude oil. Cores were
then aged at elevated temperature (75°C) for 10 days. The abbreviation MXW is used to denote
mixed-wet cores that contain connate water and crude oil. MXW-F denotes a core from which
the crude oil has been miscibly displaced to leave adsorbed films (F) that control the wetting
conditions.

106
3.6.3 Results and discussion
Asphaltene stability
Asphaltenes were destabilized by most of the synthetic base oils tested. Figure 3.6.3-1
summarizes asphaltene onset tests with Fuji crude oil at 20°C. The RI of each base oil is shown
next to the RI of the mixture at onset conditions (PRI). The onset conditions observed with
mixtures of Fuji and two n-paraffins, n-heptane and n-pentadecane, are included for comparison.
The PRI for Accolade was similar to that for n-heptane; for other base oils, PRI was closer to that
for n-pentadecane. No asphaltene onset was found with either Petrofree (original) or Petrofree
LV.
1.38
1.40
1.42
1.44
1.46
1.48
1.50
n-C7 Accolade n-C15 Biobase240 (C-14)
Biobase560 (LP)
EDC 99DW GOM 4blend - IO
SF Base XP-07 Petrofree(original)
PetrofreeLV
RI o
r PR
I
RI of base oil
PRI (RI at onset)
Onset from Fuji crude oil at 20°C
Figure 3.6.3-1. RI and PRI for the onset of asphaltene precipitation from Fuji crude oil at 20°C.
Minnelusa crude oil was tested at 60°C to avoid problems with existing asphaltene
aggregates in the stock tank oil. The results are summarized in Fig. 3.6.3-2. LVT 200
precipitates asphaltenes at solubility conditions that are intermediate between n-C7 and n-C11;
Soltrol 220 and Petrofree SF produce asphaltene aggregates at solubility conditions that are
closer to the n-C15 onset. No precipitation was observed in mixtures of Petrofree LV with
Minnelusa in any proportions.

107
1.38
1.40
1.42
1.44
1.46
1.48
1.50
n-C7 n-C11 n-C15 LVT 200 Soltrol 220 Petrofree SF
RI o
r PR
I
Onset from Minnelusa crude oil at 60°C
RI of base oilPRI (RI of onset mixture)
Figure 3.6.3-2. RI and PRI for the onset of asphaltene precipitation from Minnelusa crude oil at 60°C.
Alteration of wetting in cores
A reference curve for very strongly water-wet recovery of refined oil is included in Figs.
3.6.3-3, -4, and -5. Results for Minnelusa crude oil are shown in Fig. 3.6.3-3. Aging in
Minnelusa (MXW) resulted in significant change from the very strongly water-wet reference
curve. Displacement of the Minnelusa crude oil by any of the synthetic base oils resulted in
reduced rate of imbibition. Cores treated with Gullfaks (Fig. 3.6.3-4) are more water-wet, but
depressed rates were observed when oil was displaced by either the Petrofree SF (internal olefin)
or the LVT 200 (paraffinic oil). Similar results are shown for Fuji crude oil in Fig. 3.6.3-5.

108
0
10
20
30
40
50
60
70
80
90
100
1 10 100 1000 10000 100000Dimensionless time, tD
Rim
, %O
OIP
C5-15C5-9C5-22C5-18
Berea 90 Swi = 0 %Minnelusa'02sea waterTa = 75oCTf = 50oCTm = 22oC
Minnelusa'02 (MXW) 30.1 77 25.4fatty acid esters (MXW-F) 29.5 76 24.1 internal olefins (MXW-F) 18.1 70 25.6paraffins (MXW-F) 39.4 72 25.1
Core oil IFT, mN/m kg,md Swi,%
Figure 3.6.3-3. Wetting conditions in Berea core after aging in Minnelusa crude oil are shown by the line labeled MXW. (Numbers beginning C5- identify specific cores; IFT is interfacial tension; Ta, Tf, and Tm are the aging, flushing, and measurement temperatures.) The other three curves show sea water imbibition rates after the crude oil was displaced by the products indicated.
0
10
20
30
40
50
60
70
80
90
100
1 10 100 1000 10000 100000Dimensionless time, tD
Rim
, %O
OIP
C5-20C5-17C5-19C5-21
Berea 90 Swi = 0 %
Gullfaks oilsea waterTa = 75oCTf = 50oCTm = 22oC
Gullfaks oil (MXW) 20.2 74 25.4 fatty acid esters (MXW-F) 29.5 74 26.1 internal olefins (MXW-F) 18.1 72 25.4paraffins (MXW-F) 39.4 83 23.6
Core oil IFT, mN/m kg,md Swi,%
Figure 3.6.3-4. Wetting conditions in Berea core after aging in Gullfaks crude oil are shown by the line labeled MXW. The other three curves show sea water imbibition rates after the crude oil was displaced by the products indicated.

109
0
10
20
30
40
50
60
70
80
90
100
1 10 100 1000 10000 100000
Dimensionless time, tD
Rim
(%O
OIP
)
C4-6C4-4C4-5C4-3
Berea 90 Swi = 0 %
Core oil IFT, mN/m kg,md Swi,%
Fuji oil (MXW) 17.5 72 24.2 fatty acid esters (MXW-F) 29.5 74 24.3 internal olefins (MXW-F) 18.1 86 25.0paraffins (MXW-F) 39.4 78 24.0
Fuji oilsea waterTa = 75oCTf = 50oCTm = 22oC
Figure 3.6.3-5. Wetting conditions in Berea core after aging in Fuji crude oil are shown by the line labeled MXW. The other three curves show sea water imbibition rates after the crude oil was displaced by the products indicated.
The internal olefin base oils (Petrofree SF) and the paraffinic LVT 200 consistently
suppress the initial rate of imbibition, indicating less water-wet conditions are obtained when any
of these three crude oils is displaced with these synthetic base oils. Surface precipitation of
asphaltenes during the diplacement of crude oil by paraffinic or olefinic synthetic base oils must
be suspected as a cause of wettability change. The extent of change towards oil wetness will
depend on the crude oil/brine/rock combination. For the fatty acid esters (Petrofree LV), there
was no drastic reduction in water wetness. In one case imbibition was somewhat slower and in
the other two cases faster than imbibition into the MXW core.

110
3.6.4 Summary
• Paraffinic and olefinic synthetic base oils used in synthetic oil-based muds can destabilize
asphaltenes. The solubility conditions at the onset of asphaltene precipitation are comparable
to n-paraffins in the heptane to pentadecane range.
• Cores in which there was mixing of synthetic base oils with crude oil during displacement
became less water-wet, except in the case of exposure to a fatty acid ester. These results are
consistent with the surface precipitation mechanism of wetting alteration due to
destabilization of asphaltenes.
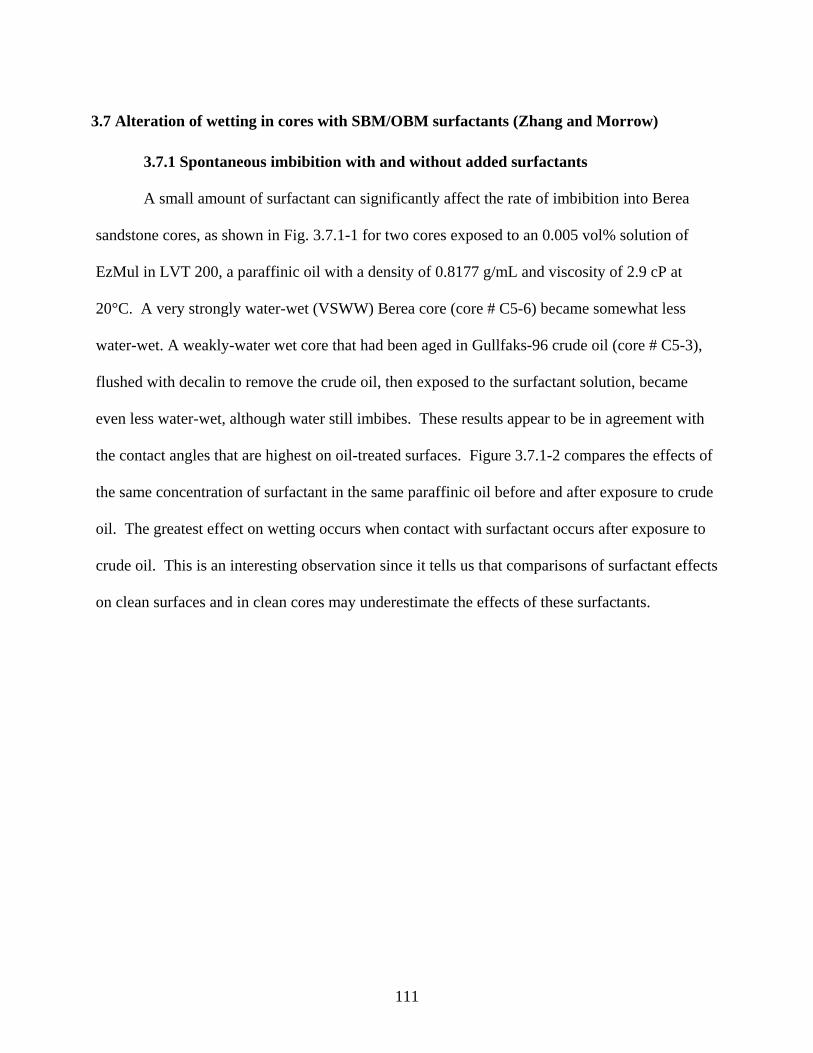
111
3.7 Alteration of wetting in cores with SBM/OBM surfactants (Zhang and Morrow)
3.7.1 Spontaneous imbibition with and without added surfactants
A small amount of surfactant can significantly affect the rate of imbibition into Berea
sandstone cores, as shown in Fig. 3.7.1-1 for two cores exposed to an 0.005 vol% solution of
EzMul in LVT 200, a paraffinic oil with a density of 0.8177 g/mL and viscosity of 2.9 cP at
20°C. A very strongly water-wet (VSWW) Berea core (core # C5-6) became somewhat less
water-wet. A weakly-water wet core that had been aged in Gullfaks-96 crude oil (core # C5-3),
flushed with decalin to remove the crude oil, then exposed to the surfactant solution, became
even less water-wet, although water still imbibes. These results appear to be in agreement with
the contact angles that are highest on oil-treated surfaces. Figure 3.7.1-2 compares the effects of
the same concentration of surfactant in the same paraffinic oil before and after exposure to crude
oil. The greatest effect on wetting occurs when contact with surfactant occurs after exposure to
crude oil. This is an interesting observation since it tells us that comparisons of surfactant effects
on clean surfaces and in clean cores may underestimate the effects of these surfactants.

112
0
10
20
30
40
50
60
70
80
90
100
1 10 100 1000 10000 100000Dimensionless time, tD
Rim
, %
OO
IP
C5-3C5-6
VSWW Berea 90 Swi = 0 %
sea waterbase oil: LVT 200emulsifier: Ez Mul NTconcentration: 0.005 vol%Ta = 75oCTf = 50oCTm = 22oC
Core kg(md) Swi (%)
VSWW treated with emulsifierGullfaks MXW-F treated with emulsifier 65 26.2
75 25.5
Gullfaks MXW-F
Figure 3.7.1-1. Effect of 0.005 vol% EzMul on wetting of Berea sandstone, with and without exposure of the core to Gullfaks-96 crude oil.

113
0
10
20
30
40
50
60
70
80
90
100
1 10 100 1000 10000 100000Dimensionless time, tD
Rim
, %O
OIP
C5-1C5-13C5-2
Berea 90 Swi = 0
Gullfaks MXW-Fsea waterTa = 75oCTf = 50oCTm = 22oC
only LVT 200 (MXW-F) 39.4 60 26.0LVT 200+Ez Mul (0.005vol%) 23.6 72 25.5 LVT 200+Ez Mul (0.005vol%) 23.6 65 25.4
Core oil IFT,mN/m kg,md Swi,%
Emulsifier contamination before Gullfaks aging
Emulsifier contamination after Gullfaks aging
Figure 3.7.1-2. Greater change in wetting is observed when the core is exposed to EzMul after treatment with crude oil to create MXW-F wetting conditions.
Figure 3.7.1-3 compares two Group 1 surfactants, both of which suppress the rate of
water imbibition at a nominal concentration of 0.005 vol%. The greater effect of EzMul
suggests that the sample of EzMul used in this test has a greater concentration of active
ingredients than does the LeSupermul sample.
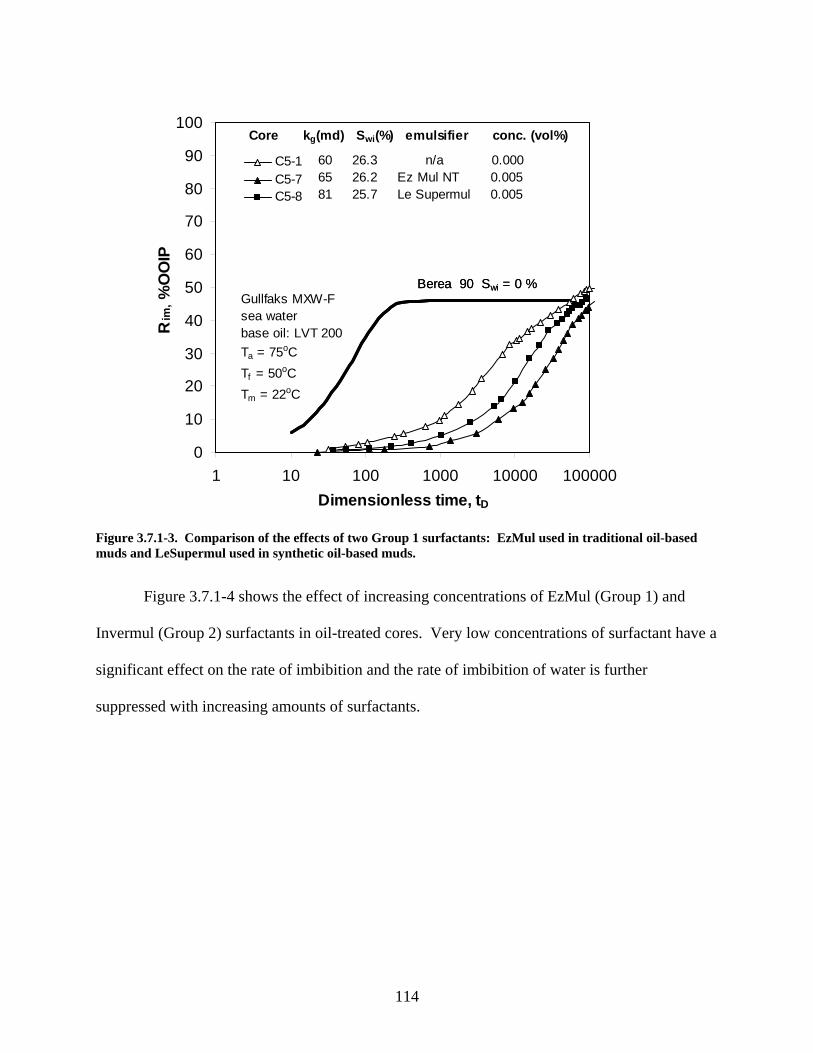
114
0
10
20
30
40
50
60
70
80
90
100
1 10 100 1000 10000 100000Dimensionless time, tD
Rim
, %
OO
IPC5-1C5-7C5-8
Berea 90 Swi = 0 %Berea 90 Swi = 0 %Gullfaks MXW-Fsea waterbase oil: LVT 200Ta = 75oCTf = 50oCTm = 22oC
Core kg(md) Swi(%) emulsifier conc. (vol%)
60 26.3 n/a 0.000 65 26.2 Ez Mul NT 0.005 81 25.7 Le Supermul 0.005
Figure 3.7.1-3. Comparison of the effects of two Group 1 surfactants: EzMul used in traditional oil-based muds and LeSupermul used in synthetic oil-based muds.
Figure 3.7.1-4 shows the effect of increasing concentrations of EzMul (Group 1) and
Invermul (Group 2) surfactants in oil-treated cores. Very low concentrations of surfactant have a
significant effect on the rate of imbibition and the rate of imbibition of water is further
suppressed with increasing amounts of surfactants.
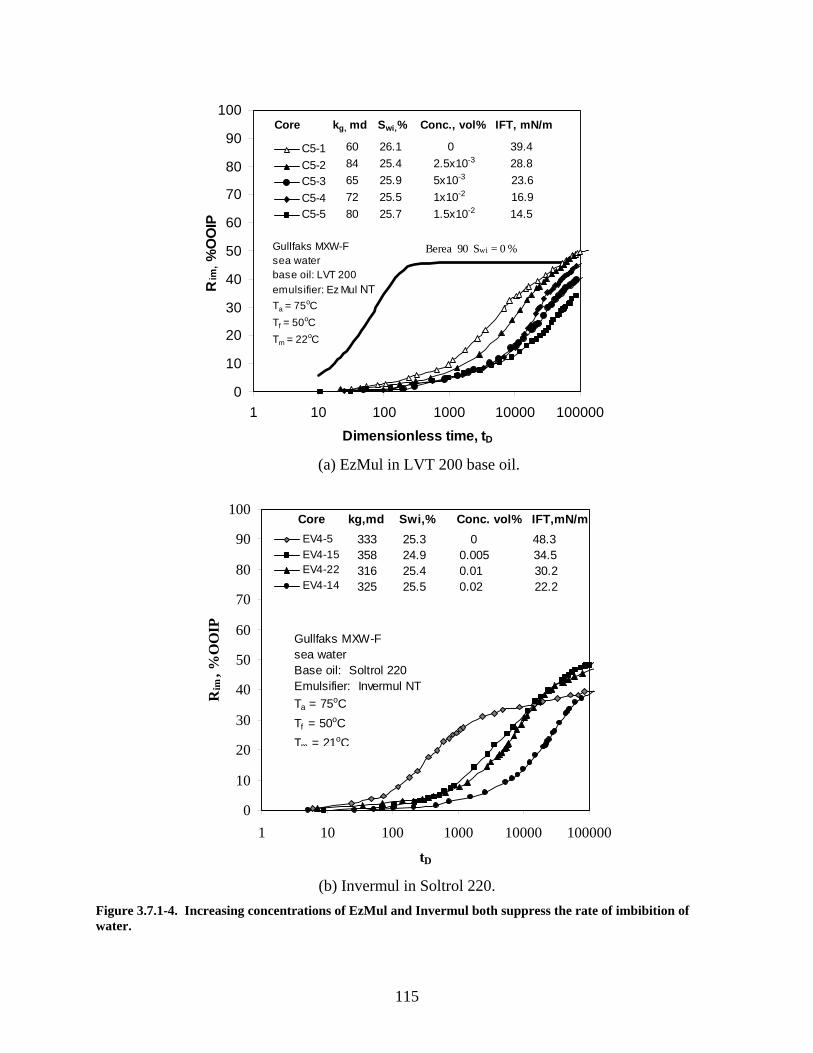
115
0
10
20
30
40
50
60
70
80
90
100
1 10 100 1000 10000 100000Dimensionless time, tD
Rim
, %
OO
IP
C5-1C5-2C5-3 C5-4 C5-5
Berea 90 Swi = 0 %Gullfaks MXW-Fsea waterbase oil: LVT 200emulsifier: Ez Mul NTTa = 75oCTf = 50oCTm = 22oC
Core kg, md Swi,% Conc., vol% IFT, mN/m
60 26.1 0 39.4 84 25.4 2.5x10⁻³ 28.8 65 25.9 5x10⁻³ 23.6 72 25.5 1x10⁻² 16.980 25.7 1.5x10⁻² 14.5
(a) EzMul in LVT 200 base oil.
0
10
20
30
40
50
60
70
80
90
100
1 10 100 1000 10000 100000
tD
Rim
, %O
OIP
EV4-5EV4-15EV4-22EV4-14
Gullfaks MXW-Fsea waterBase oil: Soltrol 220Emulsifier: Invermul NTTa = 75oC Tf = 50oCTm = 21oC
Core kg,md Swi,% Conc. vol% IFT,mN/m333 25.3 0 48.3358 24.9 0.005 34.5316 25.4 0.01 30.2 325 25.5 0.02 22.2
(b) Invermul in Soltrol 220.
Figure 3.7.1-4. Increasing concentrations of EzMul and Invermul both suppress the rate of imbibition of water.
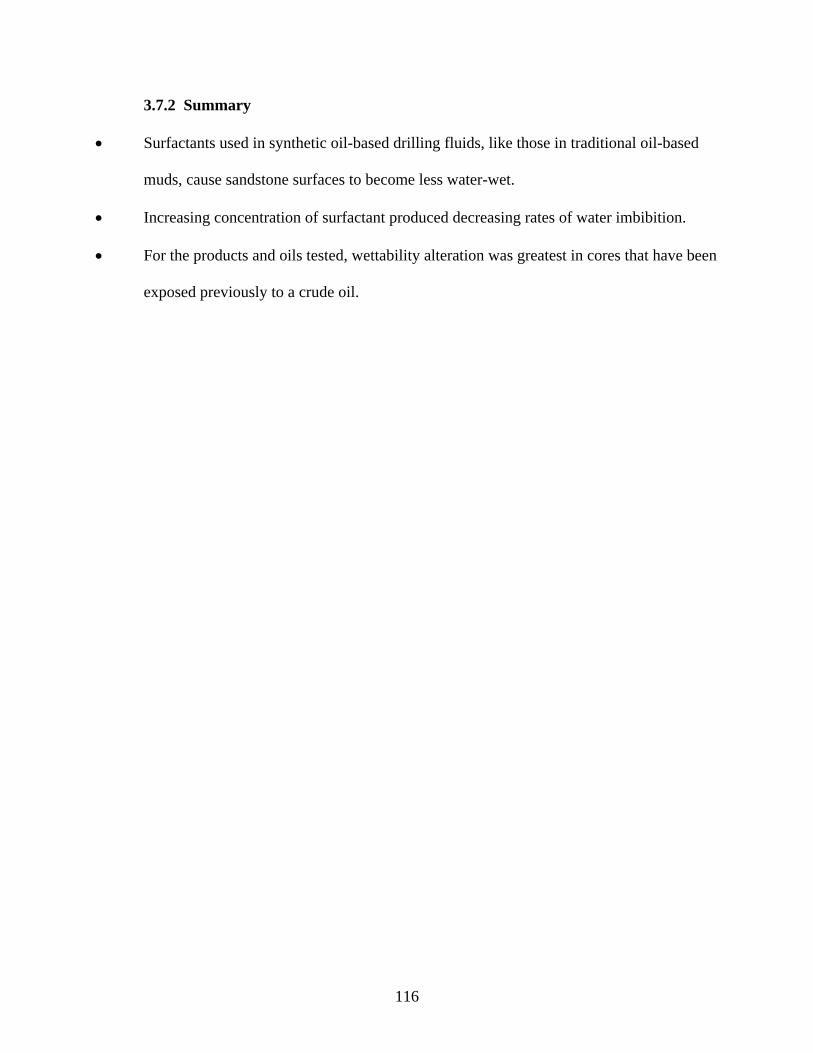
116
3.7.2 Summary
• Surfactants used in synthetic oil-based drilling fluids, like those in traditional oil-based
muds, cause sandstone surfaces to become less water-wet.
• Increasing concentration of surfactant produced decreasing rates of water imbibition.
• For the products and oils tested, wettability alteration was greatest in cores that have been
exposed previously to a crude oil.

117
3.8 Cleaning Cores after Contamination with Synthetic Oil-based Mud Components
(Zhang, Bell, Morrow, Buckley, and Chen)
3.8.1 Introduction
Drilling muds are used to lubricate drill bit and drill string, maintain formation pressure
to prevent blowouts, and transport drilled cuttings from borehole to the surface. A great number
of drilling muds have been developed to meet different drilling conditions. These drilling muds
can be classified into three categories: water-based muds (WBMs), oil-based muds (OBMs) that
often used diesel as a base oil, and synthetic oil-based muds in which diesel is replaced by a
variety of base oils that meet environmental regulations. OBMs are usually employed to replace
WBMs when water sensitive shale formations are being drilled. SBMs are frequently used for
drilling in environmentally sensitive areas such as the Gulf of Mexico, the North Sea and Arctic
regions where use of OBMs may pose serious environmental issues. While removal of aromatic
compounds decreases toxicity of the drilling mud, it can create asphaltene stability problems that
do not occur with diesel-based fluids.
During the drilling process, hydrostatic pressure in the borehole often exceeds that in the
penetrated formation, so that drilling fluid invades some of the pore space of recovered core.
Previous investigation (Sections 3.6 and 3.7) indicated that displacement of crude oils with SBM
base oils such as olefins tended to decrease the water-wet character of the tested cores even in
the absence of added emulsifiers and oil-wetting surfactants. This wetting alteration was ascribed
to surface precipitation of asphaltenes.
When drilling mud emulsifiers are involved, the emulsifiers can adsorb on the rock
surface and further increase the oil-wetness of the tested cores. Measurements of imbibition rate
as a function of emulsifier concentration showed that cores became less water-wet with increase
118
in emulsifier concentration (Section 3.7). The wetting change may be further aggravated when
the core is brought to the surface because of the loss of light ends or the deposition and oxidation
of heavy ends (Wendel et al., 1985).
Change in wettability of the recovered reservoir cores affects special core analysis
including capillary pressure, relative permeability, and waterflood recovery (Anderson, 1986,
Morrow,1990), leading to unreliable reservoir evaluation and prediction of waterflood
performance. One approach to using SBM contaminated cores is to clean the cores and restore
to the original reservoir wetting conditions by re-exposure to reservoir fluids. The efficacy of
cleaning processes has been studied for WBM and OBM-contaminated cores (e.g., Anderson,
1986; Cuiec, 1989), but studies of cleaning SBM-contaminated cores are limited (McCaffery et
al., 2002).
Gant and Anderson (1988) tested many common cleaning solvents and combinations of
solvents for cleaning cores contaminated with invert emulsion oil-based muds. The best results
in both sandstone and carbonate cores were achieved using a Dean-Stark extraction method with
either a 1:1 mixture of toluene and methanol or the same 1:1 mixture to which 1% NH4OH was
added. Cleaning was judged by USBM wettability index measurements (Donaldson et al., 1969).
The authors speculate that flow-through cleaning would be even more efficient than their
extraction process with the same solvents.
Hirasaki et al. (1990) tested flow-through cleaning of reservoir cores with several
sequences of solvents and solvent mixtures. Whether the cores were suspected of drilling fluid
contamination and what kind of drilling fluid was used in the coring program were not specified.
As a result of their tests, they recommended displacing oil with toluene or chloroform, followed
119
by tetrahydrofuran (THF) to remove adsorbed asphaltenes and waxes. The THF can also adsorb,
but is displaced along with water and salts by a final flush with methanol.
In this study, Berea sandstone cores were aged in either Gullfaks or Minnelusa crude oil
to generate mixed-wet conditions. Mixed-wet cores were then exposed to a simulated SBM. For
the simulated SBM, a base oil consisting of fatty acid esters that does not cause asphaltene
precipitation was chosen. To that base oil were added two commercial drilling mud surfactant
products, an emulsifier and a wetting agent. Wetting conditions were quantified by
measurements of the rate of spontaneous imbibition and by Amott indices relating the amount of
each fluid that imbibes spontaneously and the amount that can be moved in a forced
displacement. In all cases, the mixed-wet cores became preferentially oil-wet upon
contamination. Following SBM contamination, cores were cleaned by several techniques
including a newly developed sequential strategy that incorporates strongly alkaline conditions.
3.8.2 Experimental details
Cores
Berea sandstone cores, 3.8 cm in diameter and 7.5 cm long, were used in all tests.
Average core porosity was 17% and average air permeability was 75 md.
Crude oils
Two crude oils, Gullfaks (or Gullfaks-96) from the North Sea and Minnelusa-02 from
Wyoming, were used to create mixed-wet conditions in the Berea sandstone cores. These two
crude oils have much different asphaltene contents (properties of crude oils are summarized in
Appendix II).
120
Brine
The aqueous solution used in the initial saturation of cores was selected to simulate the
composition of sea water (SSW-Uwyo in Appendix III).
Drilling mud formulation
The simplified synthetic drilling fluid was prepared by mixing Petrofree LV with
0.37vol% Le Supermul and 0.24vol% Le Mul unless otherwise specified. The emulsifier
concentrations were one-tenth of the maximum concentrations recommended for use in drilling
industry. Petrofree LV is composed of fatty acid esters.
Contact angle measurements
Water-advancing and water-receding contact angles were measured with decane as the
probe oil on mica surfaces after exposure of the clean mica to brine, crude oil, SBM components,
and cleaning solvents, using the same fluids as those used in the core tests. Treatment and
measurement techniques have been described in detail previously (Liu and Buckley, 1997, 1999).
Preparation of contaminated cores
Core samples at initial water and oil saturations were aged in either Gullfaks oil or
Minnelusa oil at 75oC for 10 days. After injection of 5 PV of the synthetic drilling fluid, the
cores were left in the fluid overnight at 50oC. The properties of the treated cores including
Amott-Harvey wettability indices are listed in Table 3.8.2-1.

121
Table 3.8.2-1. Properties of the oil and SBM-treated cores Core kg, md Swi, %PV Aging oil IA-H C4-1 63 25.2 Minnelusa -
C4-10 75 25.8 Gullfaks -0.33 C4-11 63 25.2 Gullfaks -0.40 C4-14 69 25.5 Gullfaks -0.46 C4-15 74 25.8 Minnelusa -0.61 C4-16 74 24.6 Gullfaks -0.32 C4-17 75 25.8 Minnelusa -0.53 C4-19 61 25.7 no crude oil -0.40 C4-21 75 25.4 no crude oil -0.44
Cleaning methods
Two methods, flow through and extraction, were tested to compare their cleaning
efficiency. In the flow-through method, contaminated cores were mounted in a Hassler cell and
flushed at a flow rate of 3 ft/day with 10 PV of each solvent at 50oC. The direction of flow was
reversed midway through the flushing process for each solvent.
In cleaning tests by the second method, a Soxhlet extraction apparatus was used to flush
the cores for 24 hours with 300 ml of each solvent. Cores were inverted after 12 hours to
facilitate contact of solvent throughout the length of each core. If the extracting toluene became
very dark, indicating that a significant amount of material was removed by toluene, this step was
repeated with fresh toluene before introducing other solvents. After cleaning, the core was
allowed to dry at ambient conditions for about 5 hours, followed by drying in an oven at 110oC
for 24 hours.
Sequence of cleaning solvents
For mixed-wet cores, wettability alteration to more oil-wet conditions can occur if
connate water is disturbed while crude oil is in the core (Anderson, 1986). If toluene is used to
remove crude oil, water is also removed because it has significant solubility in hot toluene.
Refluxing in toluene has an even greater potential for removing water because at the boiling

122
point of toluene (110.8°C) water is vaporized. The choice of a solvent to remove bulk crude oil
is further complicated by the potential for wetting changes if asphaltenes are destabilized. In this
work we selected cyclohexane, which in most cases should not precipitate asphaltenes, as the
first solvent. Solubility of water is low in cyclohexane, and its boiling temperature (80.7°C) is
below the boiling point of water.
Once oil is removed, the subsequent solvents, toluene, isopropanol, and 1% wt/vol NaOH
dissolved in isopropanol, were chosen for their ability to dissolve asphaltenes, remove water, and
to cause polar material—from either oil or SBM components—to desorb from pore surfaces.
Three step treatments used cyclohexane followed by toluene, then by isopropanol. An even
more rigorous cleaning was attempted using a five-step or six-step sequence including 1% wt/vol
NaOH in isopropanol. Some single-step tests using the mixture recommended by Gant and
Anderson (1988) of 49.5% toluene, 49.5% methanol, and 1% wt/vol NH4OH, were included in
the extraction series for comparison to the multi-step processes introduced in this work. The
solvent sequence details, identified by the number of steps involved are summarized in Table
3.8.2-2. Note that the toluene step may be repeated in any of the multi-step treatments.
Table 3.8.2-2. Solvents and sequences in which they are applied in single and multi-step cleaning
Number of steps Solvents and sequence 1 a mixture of 49.5% toluene + 49.5% MeOH + 1% wt/vol NH4OH 3 c-C6 → toluene → IPA 5 c-C6 → toluene → IPA → 1% wt/vol NaOH in IPA → IPA
6 c-C6 → toluene → IPA → 1% NaOH in IPA → 1% wt/vol KCl in H2O → MeOH

123
3.8.3 Results and discussion
Results of core cleaning by the various techniques described above are summarized in
Table 3.8.3-1.
Table 3.8.3-1. Summary of core cleaning results
Core Cleaning process
change in kg (md)
IAH after cleaning
C4-1 1 -15 0.66 C4-14 3 -26 - C4-15 5 -24 0.93 C4-16 3* -48 0.33 C4-19 1 -25 0.82 C4-21 6 -38 0.89
* Flow-through cleaning (all others were cleaned by extraction
Three-step treatments with cyclohexane, toluene, and isopropanol
Mixed-wet cores C4-14 and C4-16 were preferentially oil-wet after exposure to SBM.
Neither core imbibed any water. Figure 3.8.3-1 shows the results of the three-step cleaning
procedures applied with both flow-through and Soxhlet extraction methods. The top curve in
this figure is the very strongly water-wet (VSWW) reference curve obtained from a core that was
treated only with brine and purified mineral oil with an initial water saturation of about 25 %.
After the three-step cleaning sequence, whether applied in flow-through or extraction mode, the
cores spontaneously imbibe water, indicating a return to preferentially water-wet conditions.
The rate and extent of imbibition, however, are less than the VSWW reference state, suggesting
the need for a more aggressive cleaning strategy for cores exposed to these surfactants.
Although in this case the two application methods gave similar results, it should be noted that
lower permeability cores might not be cleaned as well by extraction as by a flow-through
technique.

124
0
10
20
30
40
50
60
70
80
90
100
1 10 100 1000 10000 100000
tD
Rim
, %O
OIP
VSWW, Swi = 25%
C4-16 (Gullfaks) 3-step flow-through
C4-14 (Gullfaks) 3-step extraction
Figure 3.8.3-1. Cores cleaned by three-step solvent sequence of cyclohexane, toluene, and isopropanol are weakly water-wet. There is little difference between flow-through and extraction applications of the solvents.
Five-step treatments with cyclohexane, toluene, isopropanol, 1% NaOH in isopropanol, and isopropanol
A more rigorous cleaning procedure was tested in extraction mode with SBM
contaminated core C4-15, for which the Amott index indicated the most oil-wet conditions of
any of the contaminated cores. Figure 3.8.3-2 shows the results of the cleaning process both in
terms of imbibition rate and Amott number. Initial imbibition of water still trails that of the
strongly water-wet core, but the amount imbibed is higher and the Amott index is 0.92. Sodium
hydroxide appears to play an important role in removing drilling mud contaminants. It is possible
that NaOH might alter the surface chemistry of the core but previous investigation (Pashley,
1978) indicated that the effect would not be significant.

125
0
10
20
30
40
50
60
70
80
90
100
1 10 100 1000 10000 100000
tD
Rim
, %O
OIP
VSWW, Swi = 25%
C4-15 (Minnelusa) no cleaning
C4-15 (Minnelusa) 5-step extraction
kg, md IAmott
50 0.92
74 -0.61
Figure 3.8.3-2. Comparison of imbibition rates before and after cleaning by the five-step extraction process.
A similar solvent sequence was used to clean mica that had been exposed to SSW,
Minnelusa crude oil, and the synthetic SBM. Results are summarized in Fig. 3.8.3-3. Mica was
exposed first to SSW, then to Minnelusa crude oil either at ambient conditions for 21 days or at
75°C for 10 days. After rinsing briefly with toluene, contact angles were measured with decane
and water. Subsequent exposure to synthetic SBM made the wetting of the mica surfaces neutral.
Soaking in cyclohexane and toluene at room temperature reduced contact angles only slightly,
whereas soaking in a 1% wt/vol NaOH solution in IPA returned the surfaces to a preferentially
water-wet condition.

126
0
30
60
90
120
150
180
After aging in Minnelusacrude oil
After exposed to SBM3 After 10 minutes' soak incyclohexane
After 10 minutes' soak intoluene
After 10 minutes' soak inisopropanol/NaOH
cont
act a
ngle
s fo
r wat
er a
dvan
cing
aga
inst
dec
ane
(deg
rees
)
T=25T=25� , 21 days
T=75T=75� ,10 days
Figure 3.8.3-3. Comparison of imbibition rates before and after cleaning by the five-step extraction process.
Effect of crude oil
Effectiveness of extraction processes that included a high pH step was compared for two
cores, one of which was treated with crude oil before exposure to the synthetic SBM. The other
core was exposed to SBM only. The extraction processes were adapted for Core 4-21 after the
1% wt/vol NaCl in IPA step to include an aqueous flush followed by methanol because salt
crystals were observed. Cleaning was effective for both cores, as indicated by Amott indices of
0.89 and 0.93, but initial rate of imbibition was faster for the core that had not been exposed to
crude oil, as shown in Fig. 3.8.3-4.

127
0
10
20
30
40
50
60
70
80
90
100
1 10 100 1000 10000 100000
tD
Rim
, %O
OIP
VSWW, Swi = 25%
C4-21 (no crude oil) 6-step extraction
C4-15 (Minnelusa) 5-step extraction
kg, md IAmott
37 0.89
50 0.93
aged in crude oil
Figure 3.8.3-4. Cleaning of SBM-contaminated cores with a sequential process including a high-pH step is efficient for cores whether they were very strongly water-wet or mixed-wet before exposure to SBM.
Comparisons to single-step extraction
The chemistry of the solvents chosen for this study is similar to those recommended by
Gant and Anderson (1998), but there are some significant differences in the specific choices of
solvents, in their sequential method of application, and in the cleaning results obtained for SBM-
contaminated cores. Figure 3.8.3-5 compares rates of imbibition and Amott indices for cleaning
of SBM contaminated cores that had not been exposed to crude oil; Fig. 3.8.3-6 shows similar
results for initially mixed-wet cores. In both cases, the multi-step cleaning procedure was
significantly more effective than cleaning in a single-step using a mixture of solvents.

128
0
10
20
30
40
50
60
70
80
90
100
1 10 100 1000 10000 100000
tD
Rim
, %O
OIP
VSWW, Swi = 25%
C4-21 (no crude oil) 6-step extraction
C4-19 (no crude oil) 1-step extraction
kg, md IAmott
37 0.89
36 0.82
Figure 3.8.3-5. Comparison of cleaning SBM-contaminated cores by single and multi-step processes. Cores were very strongly water-wet before exposure to SBM.
0
10
20
30
40
50
60
70
80
90
100
1 10 100 1000 10000 100000
tD
Rim
, %O
OIP
VSWW, Swi = 25%
C4-15 (Minnelusa) 5-step extraction
C4-1 (Minnelusa) 1-step extraction
kg, md IAmott
48 -
50 0.93
Figure 3.8.3-6. Comparison of cleaning SBM-contaminated cores by single and multi-step processes. Cores were mixed-wet before exposure to SBM.

129
3.8.4 Summary
• Exposure to synthetic drilling fluid changed the wettability of Berea sandstone cores from
their original strongly water-wet condition to oil-wet. Adsorption of emulsifiers and wetting
agents added to the synthetic base oil are the major mechanisms for the wettability alteration.
• Little difference was discerned between extractive and flow-through applications of the same
solvent sequences.
• In tests with different sequences of solvents, those that included sodium hydroxide were
significantly more effective in removing drilling mud contaminants.
• The new sequential core cleaning procedure including a high pH step was more effective in
removing the wettability alteration materials from the rock surface than mixtures of similar
materials, applied in a single step. The core cleaned with the solvent sequence that included
NaOH showed very strong water-wetness, comparable to the uncontaminated cores.
130
4. Conclusions
In the course of this project, we have investigated a range of components of synthetic oil-
based drilling fluids interacting with crude oils, brines, mica surfaces, and sandstone cores.
Wetting of COBR, complicated even in undisturbed reservoir conditions, is further complicated
by interactions with surface-active SBM components. A less widely recognized cause of altered
wetting is asphaltene destabilization that can occur when crude oil mixes with the paraffinic and
olefinic base oils that replace diesel in synthetic oil-based drilling fluids to protect sensitive
environments. While this study is far from exhaustive, crude oils with a wide range of properties
were tested with different emulsifier preparations and base oils so that some general observations
and conclusions can be made.
Oil/water interfaces are affected by the presence of surface-active emulsifiers, as
expected. However the effects with crude oils are generally less dramatic than they are when the
oil-soluble emulsifiers are added to a refined oil. It can be difficult to identify contaminated
crude oil samples, but IFT measurements for a range of different aqueous phase compositions
have been compared to a database of oil properties. Correlations between oil properties and IFT
for a standard, near-neutral brine can highlight oils that deviate from the correlation because of
contamination with surface-active materials.
The most significant changes in wetting, both on mica surfaces and in sandstone cores,
occurred not when emulsifiers were mixed with crude oil, but when exposure to crude oil and
emulsifiers was sequential, a situation that is analogous to exposure around a wellbore. In
addition, transient effects were observed in surface tests that make it difficult to design
meaningful screening tests and may play a role when reservoir cores are recovered from a well
drilled with oil-based fluids.

131
Changes in wetting occurred even without added surfactants when crude oils were
displaced from a core by SBM base oils that can destabilize asphaltenes. The diesel used in
older oil-based mud formulation contained aromatic compounds that can have adverse
environmental effects. Those same aromatic compounds, however, are asphaltene solvents.
Their removal and replacement with paraffins or olefins can destabilize asphaltenes and cause
alteration of wetting to less water-wet or oil-wet conditions. Ester-based products that are used
less often because of their expense do not appear to be asphaltene precipitants and do not alter
wetting in cores by the asphaltene destabilization route.
Since wetting changes appear to be inevitable if cores are recovered with synthetic oil-
based muds, effective cleaning methods are essential if the core is to be used for testing at
wetting conditions that are relevant to the reservoir before disturbance by drilling. Core and
surface tests confirmed the efficacy of sequential treatments with a series of solvents, designed to
remove bulk oil before attacking adsorbed and/or deposited organic material from both crude oil
and drilling mud. Wettability restoration can therefore be achieved by standard methods,
although the uncertainties inherent in restored state core testing—such as whether the reservoir
fluids contain the appropriate oil components, how long should cores be aged, and at what water
saturation, etc.—remain to be addressed.

132
Nomenclature
wI wettability index to water;
oI wettability to oil;
HAI − Amott-Harvey wettability index (= Iw-Io); k air permeability, md; Lc characteristic length; R calculated oil recovery, fraction;
oR final oil recovery, fraction;
wiS initial water saturation, PV% t imbibition time, min;
Dt dimensionless time;
aT aging temperature, oC;
fT flooding temperature, oC;
mT measurement temperature, oC;
oiV oil production by spontaneous imbibition, ml;
ofV oil production by forced imbibition, ml;
wiV water production by spontaneous imbibition, ml;
wfV water production by forced imbibition, ml; α coefficient; φ porosity, fraction;
oµ oil viscosity, cp;
wµ water viscosity, cp; σ or γ interfacial tension between oil and brine, mN/m;

133
References Adamson, A.W. and Gast, A.P.: Physical Chemistry of Surfaces, 6th ed., John Wiley & Sons,
New York (1997) 784 pp. Al-Maamari, R.S.H. and Buckley, J.S.: "Asphaltene Precipitation and Alteration of Wetting: The
Potential for Wettability Changes during Oil Production," SPE REE (Aug. 2003). Amott, E.: “Observations Relating to the Wettability of Porous Rock,” Trans., AIME (1959)
216, 156-162. Anderson, W.G.: "Wettability Literature Survey—Part 1: Rock/Oil/Brine Interactions and the
Effects of Core Handling on Wettability," JPT (Oct. 1986) 38, No. 11, 1125-1144. Aronofsky, J.S., Masse, L. and Natanson, S.G.: “A model for the mechanism of oil recovery
from the porous matrix due to water invasion in fractured reservoirs,” Trans. AIME (1958) 213, 17-19.
Ball, S. D., Hornof, V., and Neale G. H., “Transient Interfacial Tension Behavior Between Acidic Oils and Alkaline Solutions”, Chem. Eng. Commun., 147, 145-156 (1996).
Ballard, T.J. and Dawe, R.A.: “Wettability Alteration Induced by Oil-Based Drilling Fluid,” paper SPE 17160 presented at the 1988 Symposium on Formation Damage Control, Bakersfield, Feb. 8-9.
Baroid Fluids Handbook & Product Data Sheets (2003) Halliburton. Bobek, J.E., Mattax, C.C., and Denekas, M.O.: “Reservoir Rock Wettability—Its Significance
and Evaluation,” Trans. AIME (1958) 213, 155-160. Boneau, D.F. and Clampitt, R.L.: “A Surfactant System for the Oil-Wet Sandstone of the North
Burbank Unit,” JPT (May, 1977) 501-506. Bryant, E.M.: “Adsorption and Desorption Studies of Some Model Surfactants from Oil-based
Drilling Fluids,” Unpublished Masters Thesis, New Mexico Institute of Mining and Technology, Socorro, NM (2004).
Buckley, J.S.: “Chemistry of the Crude Oil/Brine Interface,” Proc. 3rd International Symposium on Evaluation of Reservoir Wettability and Its Effect on Oil Recovery, Univ. of Wyoming, Laramie (1996) 33-38.
Buckley, J.S.: “Effective Wettability of Minerals Exposed to Crude Oil,” Current Opinion in Colloid & Interface Sci. (2001) 6, 191-196.
Buckley, J.S.: “Evaluation of Reservoir Wettability and its Effect on Oil Recovery,” Final Report, DOE Cooperative Agreement No. DE-FC22-96ID13421, July 1, 1996 - June 30, 2001.
Buckley, J.S. and Lord, D.L.: “Wettability and Morphology of Mica Surfaces after Exposure to Crude Oil,” J. Pet. Sci. Eng, (2003) 39, 261-273.
Buckley, J.S. and Wang, J.X.: “Crude Oil and Asphaltene Characterization for Prediction of Wetting Alteration,” J. Pet. Sci. Eng, (2002) 33, 195-202.
Buckley, J.S., Liu, Y., and Monsterleet, S.: "Mechanisms of Wetting Alteration by Crude Oils," SPEJ (1998) 13 (1), 54-61.
Buckley, J.S., Hirasaki, G.J., Liu, Y., Von Drasek, S., Wang, J.X., and Gill, B.S.: “Asphaltene Precipitation and Solvent Properties of Crude Oils,” Petroleum Science and Technology (1998a) 16, No. 3&4, 251-285.
Clementz, D.M. and Gerbacia, W.E.: “Deactivation of Petroleum Sulfonates by Crude Oil,” JPT (Sept. 1977) 1091-3.
Cuiec L. E.: “Evaluation of reservoir wettability and its effect on reservoir recovery”, Interfacial Phenomena in Oil Recovery, N. R. Morrow (ed), Marcel Dekker, New York City (1990)

134
Cuiec, L.: “Effect of Drilling Fluids on Rock Surface Properties,” SPE Formation Evaluation (March 1989) 38-44.
Dataphysics, “Operating Manual of OCA 20 Contact Angle System”, 2003. Dean, J.A.: Lange’s Handbook of Chemistry, 15th Ed., McGraw-Hill, New York (1999). Donaldson, E.C., Thomas, R.D., and Lorenz, P.B.: “Wettability Determination and Its Effect on
Recovery Efficiency,” SPEJ (Mar. 1969) 13-20. Freer, E.M., Svitova, T.F., and Radke, C.J.: “The role of interfacial rheology in reservoir mixed
wettability,” J. Pet. Sci. Eng. (2003) 39, 137-158. Friedheim, J.E. and Conn, H.L.: “Second Generation Synthetic Fluids in the North Sea: Are
They Better?,” paper IADC/SPE 35061 presented at the 1996 Drilling Conf., New Orleans, 12-15 Mar.
Gant, P. and Anderson, W.G.: “Core Cleaning for Restoration of Native Wettability,” SPE FE (Mar. 1988) 131-138.
Hirasaki, G. and Zhang, D. L., Surface Chemistry of Oil Recovery From Fractured, Oil-Wet, Carbonate Formation”, SPE International Symposium on Oilfield Chemistry , Houston, Texas, 5-8 Feb. 2003.
Hirasaki, G.J., Rohan, J.A., Dubey, S.T., and Niko, H.: “Wettability Evaluation during Restored State Core Analysis,” paper SPE 20506 presented at the 1990 ATCE, New Orleans, Sept. 23-26.
Jeribi, M., Almir-Assad, B., Langevin, D., Henault, I., and Argillier, J.F.: “Adsorption Kinetics of Asphaltenes at Liquid Interfaces,” J. Colloid Interface Sci. (2002) 256, 268-272.
Liu, L. and Buckley, J.S.: "Alteration of Wetting of Mica Surfaces," J. Pet. Sci. Eng. (1999) 24, 75-83.
Liu, Y. and Buckley, J.S.: "Evolution of Wetting Alteration by Adsorption from Crude Oil," SPE FE, (1997) 12 (1), 5-11.
Lord, D.L., and Buckley, J.S.: “An AFM Study of Morphological Features that Affect Wetting at Crude Oil-Water-Mica Interfaces,” Colloids and Surfaces A (2002) 206, 531-546.
Ma, S., Morrow, N.R., and Zhang, X.: “Generalized Scaling of Spontaneous Imbibition Data for Strongly Water-Wet Systems,” J. Petr. Sci. and Eng. (1997) 18, 165-178.
Ma, S., Zhang, X., and Morrow, N. R.: “Influence of fluid viscosity on mass transfer between rock matrix and fractures”, paper CIM 95-94, Proc. The CIM 46th Annual Technical Meeting, Banff, Alberta, Canada (May 14-17, 1995).
Mason, T.G. and Lin, M.Y.: “Time-resolved small angle neutron scattering measurements of asphaltene nanoparticle aggregation kinetics in incompatible crude oil mixtures,” J. Chem. Phys. (2003) 119, 565-571.
McCaffery, F., Buckley, J.S., Silveira, R., Lekkala, R.K., Goggin, D., and McCarty, A.: “Wettability and Water-Oil Displacement Investigations for Some High Permeability Turbidite Reservoirs,” paper 2002-32 presented at the International Symposium of the Society of Core Analysts, 23-25 Sept.
Menezes, J.L., Yan, J., and Sharma, M.M.: “The Mechanism of Wettability Alteration Due to Surfactants in Oil-Based Muds,” paper SPE 18460 presented at the 1989 Internat. Symp. on Oilfield Chem., Houston, Feb. 8-10.
Morrow, N.R.: "Wettability and Its Effect on Oil Recovery," JPT (Dec. 1990) 42, 1476-1484. Morrow, N.R. and Mason, G.: “Recovery of Oil by Spontaneous Imbibition,” Current Opinion
in Colloid and Interface Sci. (2001) 6, 321-337.
135
Pashley, R.M.: “Surface Forces in Thin Water Films on Smooth Quartz,” Ph.D Thesis, University of London, August 1978.
Patel, A.: “Choosing the Right Synthetic-Based Drilling Fluids: Drilling Performance Versus Environmental Impact,” paper SPE 39508 presented at the 1998 India Oil & Gas Conf., New Delhi, 17-19 Feb.
Patel, A.D.: “Negative Alkalinity Invert Emulsion Drilling Fluid Extends the Utility of Ester-Based Fluids,” paper SPE 56968 presented at the 1999 Offshore Europe Conf., Aberdeen, 7-9 Sept.
Patel, A. and Ali, S.: “New Opportunities for the Drilling Industry Through Innovative Emulsifier Chemistry,” paper SPE 80247 presented at the 2003 SPE International Symposium on Oilfield Chemistry, Houston, TX, 5-7 February.
Reisberg, J. and Doscher, T.M.: “Interfacial Phenomena In Crude-Oil-Water Systems,” Producers Monthly (Nov. 1956) 43-50.
Salathiel, R.A.: "Oil Recovery by Surface Film Drainage in Mixed-Wettability Rocks," J. Pet. Tech. (Oct. 1973) 25, 1216-24; Trans., AIME, 255.
Standnes, D.C. and Austad, T.: “Wettability Alteration in Chalk 1. Preparation of Core Material and Oil Properties,” J. Pet. Sci. Eng. (2000a) 28, 111-121.
Standnes, D.C. and Austad, T.: “Wettability Alteration in Chalk 2. Mechanism for Wettability Alteration from Oil-Wet to Water-Wet using Surfactants,” J. Pet. Sci. Eng. (2000b) 28, 123-143.
Tie, H., Tong, Z. and Morrow, N.R.: “The Effect of Different Crude Oil/Brine/Rock Combinations on Wettability through Spontaneous Imbibition,” paper SCA 2003-02 presented at the 2003 International Symposium, Pau, 21-24 Sept.
Tong, Z.X., Xie, X. and Morrow, N.R.: “Scaling Of Viscosity Ratio For Oil Recovery by Imbibition from Mixed-Wet Rocks”, Petrophysics, 43, 4, 2002, 332-340.
Tong, Z.X., Xie, X. and Morrow, N.R., “Crude oil composition and the stability of mixed wettability in sandstones” Petrophysics (2003a) 44, 233-242.
Tong, Z.X., Xie, X. and Morrow, N.R.: “Spontaneous Imbibition For Mixed-Wettability States In Sandstones Induced By Adsorption From Crude Oil”, J. Petrol. Sci. Eng. (2003b) 39, 351-361.
Viksund, B.G., Morrow, N.R., Ma, S., Wang, W., Graue, A.: “Initial Water Saturation and Oil Recovery From Chalk and Sandstone by Spontaneous Imbibition” Proceedings, 1998 International Symposium of Society of Core Analysts, The Hague, September 1998.
Wang, J.: “Predicting Asphaltene Flocculation in Crude Oils,” PhD Thesis, NMIMT, 2000. Wang, J.X. and Buckley, J.S.: "Procedure for Measuring the Onset of Asphaltene Flocculation,"
PRRC Report 01-18 (2001). Wendel, D.J.: Anderson, W.G., and Meyers, J.D., “Restored-State Core analysis for the Hutton
Reservoir,” SPE 14298, presented at the 60th Annual Technical Conference and Exhibition of the Society of Petroleum Engineers, Las Vegas, NV, Sept. 22-25, 1985.
Xie, X., Morrow, N.R., and Buckley, J.S.: “Contact Angle Hysteresis and the Stability of Wetting Changes Induced by Adsorption from Crude Oil,” J. Petrol. Sci. Eng. (2002) 33, 147-159.
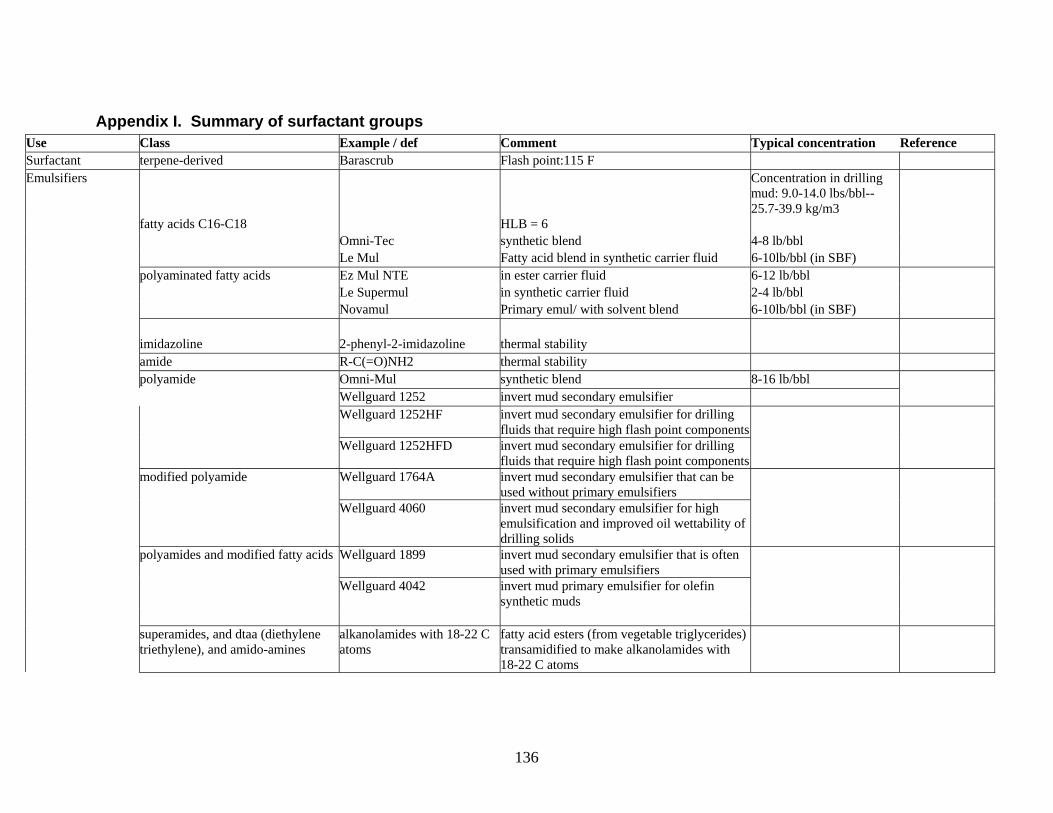
136
Appendix I. Summary of surfactant groups Use Class Example / def Comment Typical concentration Reference Surfactant terpene-derived Barascrub Flash point:115 F Emulsifiers Concentration in drilling
mud: 9.0-14.0 lbs/bbl-- 25.7-39.9 kg/m3
fatty acids C16-C18 HLB = 6 Omni-Tec synthetic blend 4-8 lb/bbl Le Mul Fatty acid blend in synthetic carrier fluid 6-10lb/bbl (in SBF) polyaminated fatty acids Ez Mul NTE in ester carrier fluid 6-12 lb/bbl Le Supermul in synthetic carrier fluid 2-4 lb/bbl Novamul Primary emul/ with solvent blend 6-10lb/bbl (in SBF) imidazoline 2-phenyl-2-imidazoline thermal stability amide R-C(=O)NH2 thermal stability polyamide Omni-Mul synthetic blend 8-16 lb/bbl Wellguard 1252 invert mud secondary emulsifier Wellguard 1252HF invert mud secondary emulsifier for drilling
fluids that require high flash point components
Wellguard 1252HFD invert mud secondary emulsifier for drilling fluids that require high flash point components
modified polyamide Wellguard 1764A invert mud secondary emulsifier that can be used without primary emulsifiers
Wellguard 4060 invert mud secondary emulsifier for high emulsification and improved oil wettability of drilling solids
polyamides and modified fatty acids Wellguard 1899 invert mud secondary emulsifier that is often used with primary emulsifiers
Wellguard 4042 invert mud primary emulsifier for olefin synthetic muds
superamides, and dtaa (diethylene
triethylene), and amido-amines alkanolamides with 18-22 C atoms
fatty acid esters (from vegetable triglycerides) transamidified to make alkanolamides with 18-22 C atoms
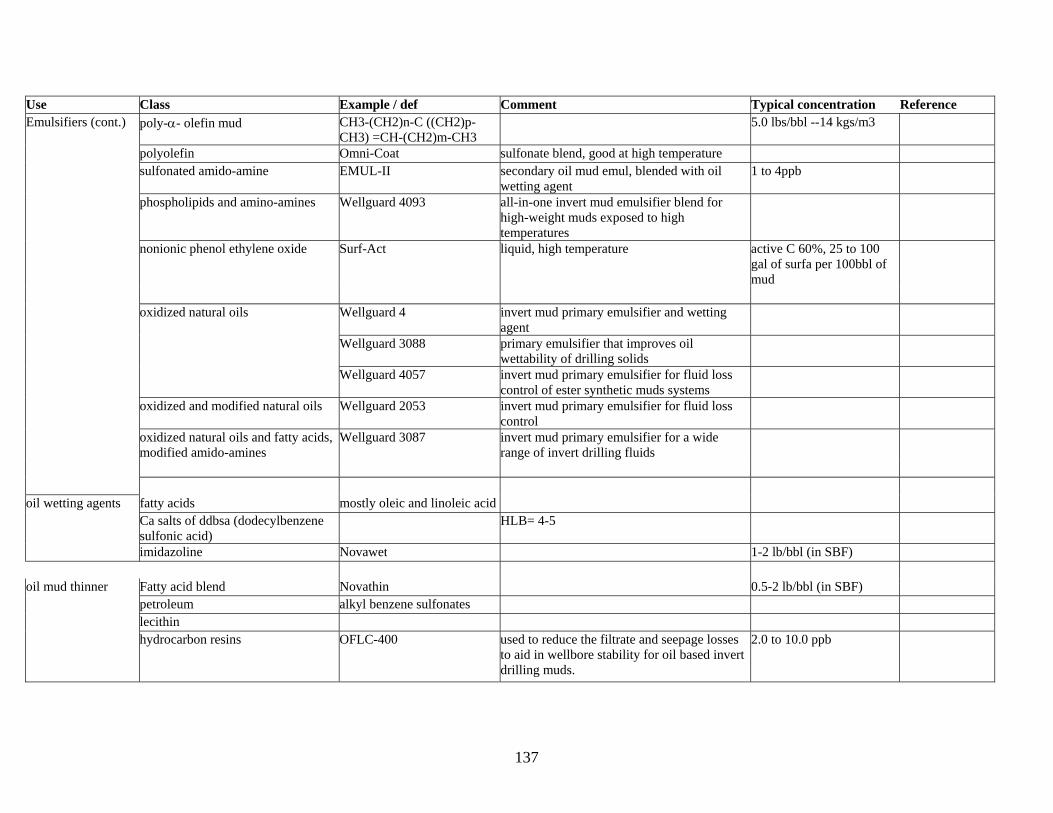
137
Use Class Example / def Comment Typical concentration Reference Emulsifiers (cont.) poly-α- olefin mud CH3-(CH2)n-C ((CH2)p-
CH3) =CH-(CH2)m-CH3 5.0 lbs/bbl --14 kgs/m3
polyolefin Omni-Coat sulfonate blend, good at high temperature sulfonated amido-amine EMUL-II secondary oil mud emul, blended with oil
wetting agent 1 to 4ppb
phospholipids and amino-amines Wellguard 4093 all-in-one invert mud emulsifier blend for high-weight muds exposed to high temperatures
nonionic phenol ethylene oxide Surf-Act liquid, high temperature active C 60%, 25 to 100 gal of surfa per 100bbl of mud
oxidized natural oils Wellguard 4 invert mud primary emulsifier and wetting
agent
Wellguard 3088 primary emulsifier that improves oil wettability of drilling solids
Wellguard 4057 invert mud primary emulsifier for fluid loss control of ester synthetic muds systems
oxidized and modified natural oils Wellguard 2053 invert mud primary emulsifier for fluid loss control
oxidized natural oils and fatty acids, modified amido-amines
Wellguard 3087 invert mud primary emulsifier for a wide range of invert drilling fluids
oil wetting agents fatty acids mostly oleic and linoleic acid Ca salts of ddbsa (dodecylbenzene
sulfonic acid) HLB= 4-5
imidazoline Novawet 1-2 lb/bbl (in SBF) oil mud thinner Fatty acid blend Novathin 0.5-2 lb/bbl (in SBF) petroleum alkyl benzene sulfonates lecithin hydrocarbon resins OFLC-400 used to reduce the filtrate and seepage losses
to aid in wellbore stability for oil based invert drilling muds.
2.0 to 10.0 ppb

138
Appendix II. Crude oil properties
Section 3. Oil ID °API avg MW RI@20°C P_ri nC7 asph ρ @20°C µ @20°C Acid# Base # Saturates Aromatics Resins n-C6 Asph 1 2 4 5 6 7 8 g/mole RI units % g/ml cP mg KOH/g oil % x B-1-00 37.1 186 1.4697 1.4339 0.62 0.8361 4.7 0.04 0.85 78.8 18.2 2.5 0.5 x C-A1-00 33.7 197 1.4816 1.4348 1.66 0.8536 10.6 0.34 3.44 68.8 12.2 16.5 2.5 x C-A2-00 22.7 306 1.5146 1.4368 4.34 0.9142 127.8 1.28 5.64 58.1 11.9 23.4 6.6 x C-AG-03 40.3 141 1.4535 0.14 0.8543 1.9 0.08 0.50 82.5 12.5 4.5 0.5 x x C-AL-03 18.7 484 1.5288 1.4198 2.40 0.9384 661.0 1.79 4.94 53.8 18.4 25.2 2.7 x C-B2-01 36.3 196 1.4732 1.4260 1.31 0.8380 6.5 0.50 2.67 68.5 17.5 12.7 1.3 x C-Br-01 48.0 148 1.4408 0.05 0.7855 1.2 0.08 0.11 74.8 24.5 0.7 0.1 x x C-F-03 29.5 282 1.4973 1.4403 5.96 0.8755 22.1 0.16 1.52 61.7 18.4 13.5 6.5 x C-F2-03 27.9 335 1.4993 1.4397 1.97 0.8847 28.6 0.70 1.32 63.2 17.9 16.2 2.7 x C-GC-T1-03 31.1 1.4875 4.56 0.8671 17.0 0.03 1.69 x x C-K-01 18.9 319 1.5287 1.4320 3.46 0.9374 396.0 2.44 5.19 52.8 19.0 24.8 3.3 x C-L-01 34.0 216 1.4779 1.4260 1.39 0.8515 19.1 0.21 2.30 66.3 16.7 13.2 3.9 x C-Lb-01 31.7 241 1.4858 1.60 0.8640 22.6 0.05 2.50 72.0 14.9 10.9 2.2 x x Cottonwood-03 26.4 262 1.5044 1.4412 2.51 0.8929 26.1 0.04 1.87 57.9 22.7 16.5 2.9 x C-R-01 31.1 254 1.4846 1.4446 1.30 0.8674 17.8 < 0.01 0.40 70.6 15.0 12.9 1.6 x C-T-02 34.2 214 1.4807 1.4211 1.36 0.8511 9.4 0.01 1.30 61.1 22.8 14.6 1.6 x x E-1XCO-01 33.8 218 1.4795 1.4163 0.65 0.8532 9.3 0.18 1.93 71.5 18.1 9.7 0.7 x E-1XD-00 22.3 287 1.5141 1.4336 2.54 0.9165 137.4 1.56 2.98 64.1 18.5 15.3 2.2 x E-1XFR-01 40.0 179 1.4667 1.4039 0.26 0.8223 3.7 0.16 0.65 70.6 21.5 7.6 0.3 x E-1XO-00 21.9 264 1.5139 1.4142 0.76 0.9191 15.3 3.42 2.57 57.8 22.1 19.4 0.7 x E-2XR-00 25.4 235 1.5040 1.4274 1.33 0.8983 47.0 0.91 2.46 65.7 18.4 14.9 1.1 x E-8XFR-01 38.6 189 1.4676 1.4020 0.30 0.8290 4.7 1.03 0.74 70.9 19.7 9.1 0.4 x E-BL-00 31.3 213 1.4896 1.4395 3.58 0.8651 23.4 0.17 1.33 66.3 21.2 9.5 3.0 x E-S1XCA-01 23.2 298 1.5123 1.4626 2.08 0.9115 80.6 0.48 3.42 60.7 19.1 18.3 2.0 x E-S1XG-01 33.3 237 1.4841 1.4681 0.54 0.8554 9.6 0.14 1.57 68.7 19.8 11.0 0.4 x E-S1XL-01 33.5 220 1.4800 1.4088 0.42 0.8543 10.3 0.48 1.83 71.5 19.3 8.9 0.3 x E-S3XR-01 30.0 251 1.4907 1.4238 0.92 0.8732 19.8 0.23 2.03 68.5 16.4 14.5 0.6 x GOM(2)-00 21.2 287 1.5075 1.4504 8.63 0.9228 122.3 2.02 1.79 55.6 15.4 19.1 9.9
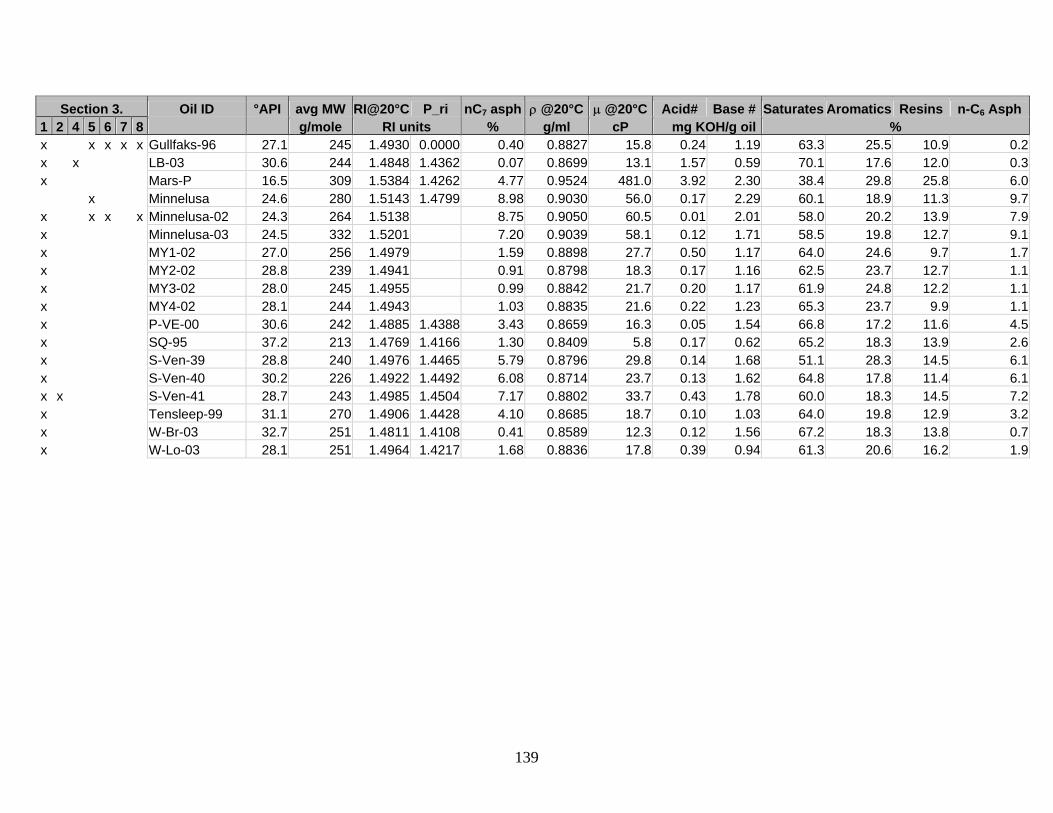
139
Section 3. Oil ID °API avg MW RI@20°C P_ri nC7 asph ρ @20°C µ @20°C Acid# Base # Saturates Aromatics Resins n-C6 Asph 1 2 4 5 6 7 8 g/mole RI units % g/ml cP mg KOH/g oil % x x x x x Gullfaks-96 27.1 245 1.4930 0.0000 0.40 0.8827 15.8 0.24 1.19 63.3 25.5 10.9 0.2 x x LB-03 30.6 244 1.4848 1.4362 0.07 0.8699 13.1 1.57 0.59 70.1 17.6 12.0 0.3 x Mars-P 16.5 309 1.5384 1.4262 4.77 0.9524 481.0 3.92 2.30 38.4 29.8 25.8 6.0 x Minnelusa 24.6 280 1.5143 1.4799 8.98 0.9030 56.0 0.17 2.29 60.1 18.9 11.3 9.7 x x x x Minnelusa-02 24.3 264 1.5138 8.75 0.9050 60.5 0.01 2.01 58.0 20.2 13.9 7.9 x Minnelusa-03 24.5 332 1.5201 7.20 0.9039 58.1 0.12 1.71 58.5 19.8 12.7 9.1 x MY1-02 27.0 256 1.4979 1.59 0.8898 27.7 0.50 1.17 64.0 24.6 9.7 1.7 x MY2-02 28.8 239 1.4941 0.91 0.8798 18.3 0.17 1.16 62.5 23.7 12.7 1.1 x MY3-02 28.0 245 1.4955 0.99 0.8842 21.7 0.20 1.17 61.9 24.8 12.2 1.1 x MY4-02 28.1 244 1.4943 1.03 0.8835 21.6 0.22 1.23 65.3 23.7 9.9 1.1 x P-VE-00 30.6 242 1.4885 1.4388 3.43 0.8659 16.3 0.05 1.54 66.8 17.2 11.6 4.5 x SQ-95 37.2 213 1.4769 1.4166 1.30 0.8409 5.8 0.17 0.62 65.2 18.3 13.9 2.6 x S-Ven-39 28.8 240 1.4976 1.4465 5.79 0.8796 29.8 0.14 1.68 51.1 28.3 14.5 6.1 x S-Ven-40 30.2 226 1.4922 1.4492 6.08 0.8714 23.7 0.13 1.62 64.8 17.8 11.4 6.1 x x S-Ven-41 28.7 243 1.4985 1.4504 7.17 0.8802 33.7 0.43 1.78 60.0 18.3 14.5 7.2 x Tensleep-99 31.1 270 1.4906 1.4428 4.10 0.8685 18.7 0.10 1.03 64.0 19.8 12.9 3.2 x W-Br-03 32.7 251 1.4811 1.4108 0.41 0.8589 12.3 0.12 1.56 67.2 18.3 13.8 0.7 x W-Lo-03 28.1 251 1.4964 1.4217 1.68 0.8836 17.8 0.39 0.94 61.3 20.6 16.2 1.9

140
Appendix III. Brine compositions
Section 3. Buffers Concentration (moles/L) 1 2 3 4 NaCl NaHCO3 Na Acetate Glacial Acetic Acid Na2HPO4 NaH2PO4 NaOH x x x {pH4, 0.01M NaCl} 9.00E-03 4.10E-02 x x {pH4, 0.1M NaCl} 6.40E-02 3.60E-02 6.40E-02 x x {pH6, 0.1M NaCl} 1.23E-02 8.77E-02 x x {pH8, 0.1M NaCl} 4.38E-02 2.65E-03 x x {pH8, 1M NaCl} 8.05E-01 9.47E-02 5.30E-03 x {pH10,0.1M NaCl} 6.43E-02 2.50E-02 1.07E-02
Section 3. Unbuffered solutions Concentration (moles/L)
1 2 5 6 7 8 NaCl KCl CaCl2 MgCl2 NaHCO3 Na2SO4 MgSO4 NaN3 HCl NaOHx double distilled water (DDW) varies* varies*x 0.1%NaCl 1.71E-02 Reservoir brines x RB-C-B2 x RB-C-K x RB-C-L x RB-Minnelusa 5.10E-01 1.90E-02 4.16E-02 7.00E-03 Synthetic sea water recipes x SSW 4.11E-01 9.98E-03 5.23E-02 2.25E-02 x x SSW+HCO3 4.11E-01 9.98E-03 5.23E-02 4.60E-04 2.25E-02 x x x x SSW-Uwyo 4.79E-01 1.25E-02 1.07E-02 5.63E-02 1.54E-03
* add to achieve desired pH
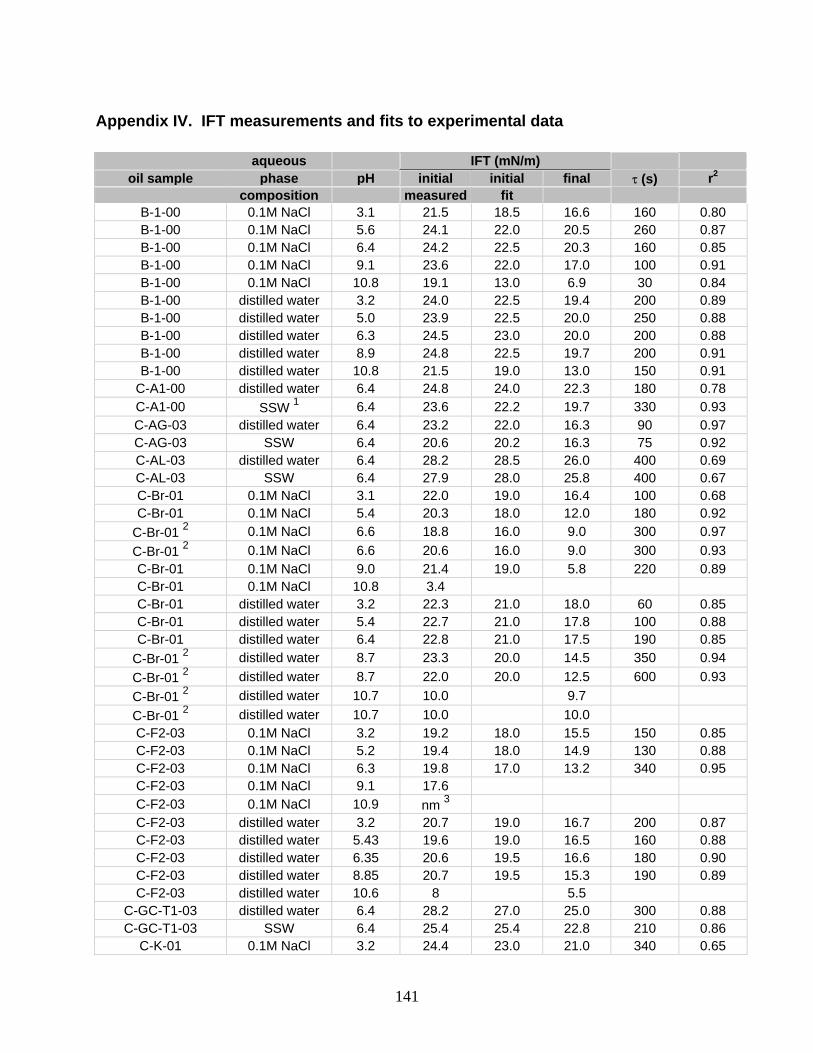
141
Appendix IV. IFT measurements and fits to experimental data
aqueous IFT (mN/m) oil sample phase pH initial initial final τ (s) r2
composition measured fit
B-1-00 0.1M NaCl 3.1 21.5 18.5 16.6 160 0.80 B-1-00 0.1M NaCl 5.6 24.1 22.0 20.5 260 0.87 B-1-00 0.1M NaCl 6.4 24.2 22.5 20.3 160 0.85 B-1-00 0.1M NaCl 9.1 23.6 22.0 17.0 100 0.91 B-1-00 0.1M NaCl 10.8 19.1 13.0 6.9 30 0.84 B-1-00 distilled water 3.2 24.0 22.5 19.4 200 0.89 B-1-00 distilled water 5.0 23.9 22.5 20.0 250 0.88 B-1-00 distilled water 6.3 24.5 23.0 20.0 200 0.88 B-1-00 distilled water 8.9 24.8 22.5 19.7 200 0.91 B-1-00 distilled water 10.8 21.5 19.0 13.0 150 0.91
C-A1-00 distilled water 6.4 24.8 24.0 22.3 180 0.78 C-A1-00 SSW 1 6.4 23.6 22.2 19.7 330 0.93 C-AG-03 distilled water 6.4 23.2 22.0 16.3 90 0.97 C-AG-03 SSW 6.4 20.6 20.2 16.3 75 0.92 C-AL-03 distilled water 6.4 28.2 28.5 26.0 400 0.69 C-AL-03 SSW 6.4 27.9 28.0 25.8 400 0.67 C-Br-01 0.1M NaCl 3.1 22.0 19.0 16.4 100 0.68 C-Br-01 0.1M NaCl 5.4 20.3 18.0 12.0 180 0.92
C-Br-01 2 0.1M NaCl 6.6 18.8 16.0 9.0 300 0.97 C-Br-01 2 0.1M NaCl 6.6 20.6 16.0 9.0 300 0.93 C-Br-01 0.1M NaCl 9.0 21.4 19.0 5.8 220 0.89 C-Br-01 0.1M NaCl 10.8 3.4 C-Br-01 distilled water 3.2 22.3 21.0 18.0 60 0.85 C-Br-01 distilled water 5.4 22.7 21.0 17.8 100 0.88 C-Br-01 distilled water 6.4 22.8 21.0 17.5 190 0.85
C-Br-01 2 distilled water 8.7 23.3 20.0 14.5 350 0.94 C-Br-01 2 distilled water 8.7 22.0 20.0 12.5 600 0.93 C-Br-01 2 distilled water 10.7 10.0 9.7 C-Br-01 2 distilled water 10.7 10.0 10.0 C-F2-03 0.1M NaCl 3.2 19.2 18.0 15.5 150 0.85 C-F2-03 0.1M NaCl 5.2 19.4 18.0 14.9 130 0.88 C-F2-03 0.1M NaCl 6.3 19.8 17.0 13.2 340 0.95 C-F2-03 0.1M NaCl 9.1 17.6 C-F2-03 0.1M NaCl 10.9 nm 3 C-F2-03 distilled water 3.2 20.7 19.0 16.7 200 0.87 C-F2-03 distilled water 5.43 19.6 19.0 16.5 160 0.88 C-F2-03 distilled water 6.35 20.6 19.5 16.6 180 0.90 C-F2-03 distilled water 8.85 20.7 19.5 15.3 190 0.89 C-F2-03 distilled water 10.6 8 5.5
C-GC-T1-03 distilled water 6.4 28.2 27.0 25.0 300 0.88 C-GC-T1-03 SSW 6.4 25.4 25.4 22.8 210 0.86
C-K-01 0.1M NaCl 3.2 24.4 23.0 21.0 340 0.65

142
aqueous IFT (mN/m) oil sample phase pH initial initial final τ (s) r2
composition measured fit
C-K-01 0.1M NaCl 5.2 27.7 27.0 25.0 250 0.15 C-K-01 0.1M NaCl 6.3 29.5 28.0 24.5 320 0.51 C-K-01 0.1M NaCl 9.1 21.3 C-K-01 0.1M NaCl 10.9 nm C-K-01 distilled water 3.2 29.5 29.0 26.5 250 0.56 C-K-01 distilled water 5.3 30.6 30.0 27.3 400 0.62 C-K-01 distilled water 6.5 29.8 29.0 26.0 400 0.69 C-K-01 distilled water 9.1 30.5 29.0 25.0 600 0.84 C-K-01 distilled water 10.8 7.7 7.0 3.0 60 0.93 C-Lb-01 0.1M NaCl 3.1 20.7 19.0 17.9 100 0.78 C-Lb-01 0.1M NaCl 5.4 23.6 21.5 20.0 200 0.58 C-Lb-01 0.1M NaCl 6.2 23.5 22.0 20.0 350 0.86 C-Lb-01 0.1M NaCl 8.6 22.7 22.0 14.5 350 0.90 C-Lb-01 0.1M NaCl 10.8 4.3 C-Lb-01 distilled water 3.2 23.6 22.0 20.6 200 0.78 C-Lb-01 distilled water 5.2 23.9 23.0 21.3 180 0.76 C-Lb-01 distilled water 6.3 23.9 23.0 21.0 120 0.80 C-Lb-01 distilled water 8.9 23.5 22.0 20.5 200 0.79 C-Lb-01 distilled water 10.8 16.8 15.0 5.0 200 0.90 C-R-01 0.1M NaCl 3.1 19.6 19.0 18.2 80 0.59 C-R-01 0.1M NaCl 5.4 19.3 18.0 15.6 80 0.82 C-R-01 0.1M NaCl 6.6 17.7 17.5 13.9 220 0.93 C-R-01 0.1M NaCl 9.1 13.0 10.0 2.4 60 0.96 C-R-01 0.1M NaCl 10.9 8.2 9.0 1.5 9 0.99 C-R-01 distilled water 3.1 20.2 20.0 19.0 40 0.61 C-R-01 distilled water 5.0 20.2 20.0 18.8 40 0.63 C-R-01 distilled water 5.2 20.0 20.0 18.9 40 0.48 C-R-01 distilled water 6.5 19.6 19.0 17.2 150 0.84 C-R-01 distilled water 8.8 19.2 17.0 10.0 100 0.98 C-R-01 distilled water 10.8 12.1 C-T-02 distilled water 6.4 32.1 31.0 28.2 270 0.85 C-T-02 SSW 6.4 29.4 29.5 26.9 250 0.87
Cottonwood-03 0.1M NaCl 3.1 21.5 21.5 20.0 100 0.89 Cottonwood-03 0.1M NaCl 5.5 23.6 23.5 22.2 100 0.54 Cottonwood-03 0.1M NaCl 6.4 24.6 24.0 21.8 100 0.68
Cottonwood-03 2 0.1M NaCl 9.0 21.0 20.0 14.0 100 0.77 Cottonwood-03 2 0.1M NaCl 9.0 21.0 20.0 14.8 60 0.89 Cottonwood-03 0.1M NaCl 10.8 11.9 Cottonwood-03 distilled water 3.2 23.7 23.0 21.0 220 0.75 Cottonwood-03 distilled water 5.2 24.6 24.0 22.0 240 0.74 Cottonwood-03 distilled water 6.3 25.0 24.0 22.0 200 0.49 Cottonwood-03 distilled water 8.9 24.8 23.5 21.5 400 0.75 Cottonwood-03 distilled water 10.8 20.0 18.0 12.0 150 0.93 Cottonwood-03 RB-Minnelusa 6.4 24.4 23.5 18.5 300 0.95
E-1XCO-01 distilled water 6.4 25.6 25.5 21.6 45 0.87
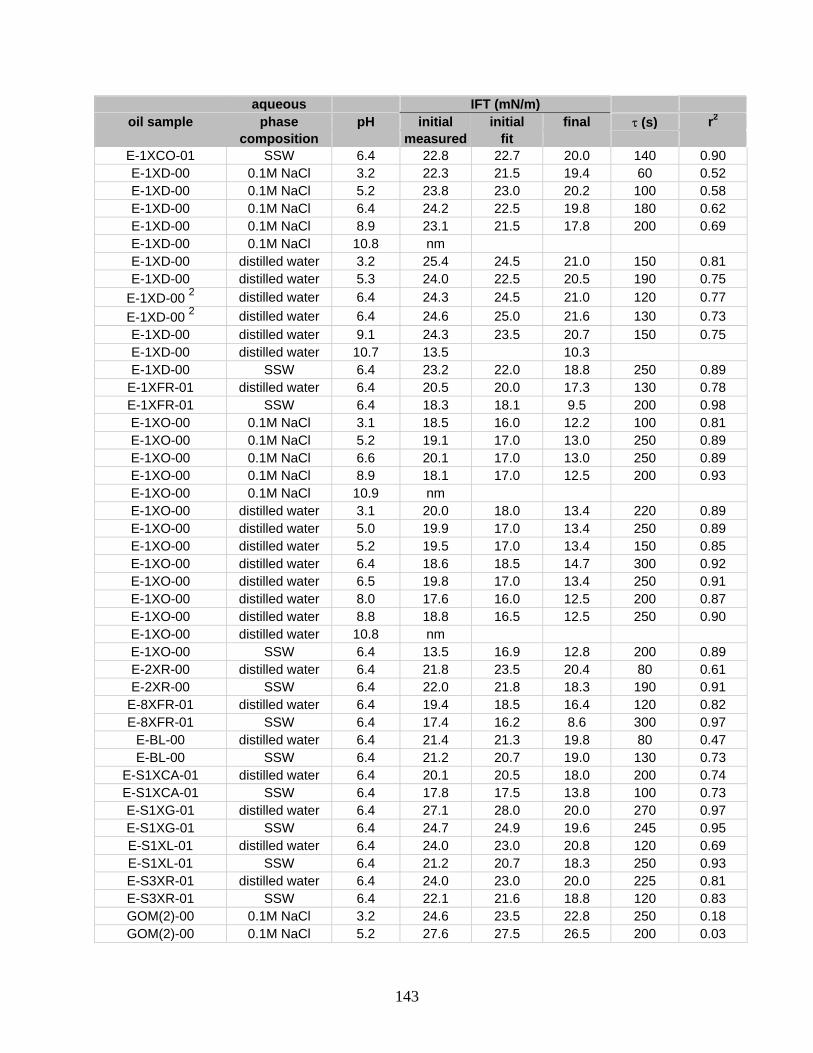
143
aqueous IFT (mN/m) oil sample phase pH initial initial final τ (s) r2
composition measured fit
E-1XCO-01 SSW 6.4 22.8 22.7 20.0 140 0.90 E-1XD-00 0.1M NaCl 3.2 22.3 21.5 19.4 60 0.52 E-1XD-00 0.1M NaCl 5.2 23.8 23.0 20.2 100 0.58 E-1XD-00 0.1M NaCl 6.4 24.2 22.5 19.8 180 0.62 E-1XD-00 0.1M NaCl 8.9 23.1 21.5 17.8 200 0.69 E-1XD-00 0.1M NaCl 10.8 nm E-1XD-00 distilled water 3.2 25.4 24.5 21.0 150 0.81 E-1XD-00 distilled water 5.3 24.0 22.5 20.5 190 0.75
E-1XD-00 2 distilled water 6.4 24.3 24.5 21.0 120 0.77 E-1XD-00 2 distilled water 6.4 24.6 25.0 21.6 130 0.73 E-1XD-00 distilled water 9.1 24.3 23.5 20.7 150 0.75 E-1XD-00 distilled water 10.7 13.5 10.3 E-1XD-00 SSW 6.4 23.2 22.0 18.8 250 0.89
E-1XFR-01 distilled water 6.4 20.5 20.0 17.3 130 0.78 E-1XFR-01 SSW 6.4 18.3 18.1 9.5 200 0.98 E-1XO-00 0.1M NaCl 3.1 18.5 16.0 12.2 100 0.81 E-1XO-00 0.1M NaCl 5.2 19.1 17.0 13.0 250 0.89 E-1XO-00 0.1M NaCl 6.6 20.1 17.0 13.0 250 0.89 E-1XO-00 0.1M NaCl 8.9 18.1 17.0 12.5 200 0.93 E-1XO-00 0.1M NaCl 10.9 nm E-1XO-00 distilled water 3.1 20.0 18.0 13.4 220 0.89 E-1XO-00 distilled water 5.0 19.9 17.0 13.4 250 0.89 E-1XO-00 distilled water 5.2 19.5 17.0 13.4 150 0.85 E-1XO-00 distilled water 6.4 18.6 18.5 14.7 300 0.92 E-1XO-00 distilled water 6.5 19.8 17.0 13.4 250 0.91 E-1XO-00 distilled water 8.0 17.6 16.0 12.5 200 0.87 E-1XO-00 distilled water 8.8 18.8 16.5 12.5 250 0.90 E-1XO-00 distilled water 10.8 nm E-1XO-00 SSW 6.4 13.5 16.9 12.8 200 0.89 E-2XR-00 distilled water 6.4 21.8 23.5 20.4 80 0.61 E-2XR-00 SSW 6.4 22.0 21.8 18.3 190 0.91
E-8XFR-01 distilled water 6.4 19.4 18.5 16.4 120 0.82 E-8XFR-01 SSW 6.4 17.4 16.2 8.6 300 0.97
E-BL-00 distilled water 6.4 21.4 21.3 19.8 80 0.47 E-BL-00 SSW 6.4 21.2 20.7 19.0 130 0.73
E-S1XCA-01 distilled water 6.4 20.1 20.5 18.0 200 0.74 E-S1XCA-01 SSW 6.4 17.8 17.5 13.8 100 0.73 E-S1XG-01 distilled water 6.4 27.1 28.0 20.0 270 0.97 E-S1XG-01 SSW 6.4 24.7 24.9 19.6 245 0.95 E-S1XL-01 distilled water 6.4 24.0 23.0 20.8 120 0.69 E-S1XL-01 SSW 6.4 21.2 20.7 18.3 250 0.93 E-S3XR-01 distilled water 6.4 24.0 23.0 20.0 225 0.81 E-S3XR-01 SSW 6.4 22.1 21.6 18.8 120 0.83 GOM(2)-00 0.1M NaCl 3.2 24.6 23.5 22.8 250 0.18 GOM(2)-00 0.1M NaCl 5.2 27.6 27.5 26.5 200 0.03

144
aqueous IFT (mN/m) oil sample phase pH initial initial final τ (s) r2
composition measured fit
GOM(2)-00 0.1M NaCl 6.3 27.3 26.5 25.9 150 0.00 GOM(2)-00 0.1M NaCl 8.8 24.3 24.0 21.6 150 0.26 GOM(2)-00 0.1M NaCl 10.9 11.2 GOM(2)-00 distilled water 3.2 27.0 26.5 25.3 100 0.33 GOM(2)-00 distilled water 5.4 27.5 26.5 26.0 250 0.13 GOM(2)-00 distilled water 6.4 27.5 26.5 25.0 1000 0.43 GOM(2)-00 distilled water 9.1 27.1 26.0 25.0 250 0.02 GOM(2)-00 distilled water 10.7 15.0 20.0 Gullfaks-96 distilled water 6.4 23.4 22.0 19.8 200 0.82 Gullfaks-96 RB-Minnelusa 6.4 21.2 19.4 9.1 230 0.95 Gullfaks-96 SSW-HCO3
4 7.8 20.0 18.2 3.5 60 0.96 LB-03 0.1M NaCl 3.2 21.4 19.5 15.5 150 0.90 LB-03 0.1M NaCl 5.2 21.4 19.5 15.5 150 0.93 LB-03 0.1M NaCl 6.4 21.7 19.5 15.3 150 0.93 LB-03 0.1M NaCl 8.9 21.6 19.5 14.8 150 0.94 LB-03 0.1M NaCl 11.0 nm LB-03 distilled water 3.4 22.2 19.5 16.2 330 0.94 LB-03 distilled water 5.1 22.0 19.5 16.0 330 0.94 LB-03 distilled water 6.5 21.8 19.5 16.0 300 0.95 LB-03 distilled water 9.1 22.7 19.0 15.0 250 0.95 LB-03 distilled water 10.8 0.00 LB-03 SSW 6.4 21.4 20.7 15.8 150 0.97 Mars-P 0.1M NaCl 3.2 22.1 23.0 21.0 50 0.01 Mars-P 0.1M NaCl 5.2 23.2 23.0 20.7 100 0.27 Mars-P 0.1M NaCl 6.4 19.4 22.0 20.0 250 0.19 Mars-P 0.1M NaCl 8.8 17.5 21.5 18.0 200 0.51 Mars-P 0.1M NaCl 10.9 nm Mars-P distilled water 3.2 22.8 22.5 21.5 300 0.24 Mars-P distilled water 5.1 26.1 25.0 23.4 300 0.47 Mars-P distilled water 6.2 25.6 25.0 23.2 150 0.42 Mars-P distilled water 9.1 24.8 24.5 22.4 300 0.38 Mars-P distilled water 10.8 4.3 4.5 0.9 25 0.99
Minnelusa-02 0.1M NaCl 3.1 24.0 23.8 22.0 100 0.55 Minnelusa-02 0.1M NaCl 5.2 28.5 28.0 26.0 100 0.16 Minnelusa-02 0.1M NaCl 6.4 25.9 26.0 24.5 100 0.18 Minnelusa-02 0.1M NaCl 8.9 22.5 23.0 22.0 100 0.11 Minnelusa-02 0.1M NaCl 10.7 20.7 20.0 12.5 20 0.83 Minnelusa-02 distilled water 3.2 24.9 24.0 22.8 100 0.37 Minnelusa-02 distilled water 5.0 24.2 23.5 22.7 100 0.36 Minnelusa-02 distilled water 6.4 22.2 24.0 23.0 100 0.09 Minnelusa-02 distilled water 9.0 25.0 24.5 22.8 100 0.54 Minnelusa-02 distilled water 10.7 20.0 17.5 Minnelusa-03 distilled water 6.4 29.9 29.0 27.0 500 0.87 Minnelusa-03 RB-Minnelusa 6.4 28.5 28.0 26.4 300 0.56 Minnelusa-03 SSW 6.4 27.2 26.7 25.3 500 0.52

145
aqueous IFT (mN/m) oil sample phase pH initial initial final τ (s) r2
composition measured fit
MY1-02 0.1M NaCl 3.2 16.3 15.1 13.6 110 0.85 MY1-02 0.1M NaCl 5.0 15.0 13.6 8.3 100 0.77 MY1-02 0.1M NaCl 6.0 13.7 11.7 5.4 400 0.97 MY1-02 0.1M NaCl 9.0 13.3 11.7 2.5 100 0.99 MY1-02 0.1M NaCl 10.7 nm MY1-02 distilled water 3.2 19.3 18.0 16.2 150 0.87 MY1-02 distilled water 5.4 18.2 17.5 16.0 100 0.73 MY1-02 distilled water 6.4 18.7 17.0 15.1 320 0.90 MY1-02 distilled water 8.8 18.0 16.0 8.0 400 0.96 MY1-02 distilled water 10.8 nm MY1-02 SSW 6.4 8.8 7.5 2.4 220 0.97 MY2-02 0.1M NaCl 3.2 21.9 20.9 17.9 350 0.90 MY2-02 0.1M NaCl 5.0 20.9 19.5 15.8 300 0.91 MY2-02 0.1M NaCl 6.4 21.0 20.0 14.5 300 0.91 MY2-02 0.1M NaCl 8.7 19.9 18.5 7.4 500 0.98 MY2-02 0.1M NaCl 10.7 nm MY2-02 distilled water 3.2 23.7 22.0 19.0 250 0.85 MY2-02 distilled water 5.4 24.1 23.0 19.4 300 0.88 MY2-02 distilled water 6.4 24.0 22.0 19.4 250 0.86 MY2-02 distilled water 8.8 23.3 22.0 16.0 500 0.96 MY2-02 distilled water 10.8 nm MY2-02 SSW 6.4 21.5 20.5 13.0 300 0.94 MY3-02 0.1M NaCl 3.2 23.8 22.4 19.7 190 0.80 MY3-02 0.1M NaCl 5.0 23.4 20.9 17.5 250 0.88
MY3-02 2 0.1M NaCl 6.1 22.1 20.4 15.6 300 0.91 MY3-02 2 0.1M NaCl 6.1 22.8 20.0 15.6 400 0.79 MY3-02 0.1M NaCl 8.8 22.7 19.0 9.5 550 0.97 MY3-02 0.1M NaCl 10.7 nm MY3-02 distilled water 3.2 25.2 23.5 21.0 300 0.89 MY3-02 distilled water 5.4 24.4 23.5 20.5 200 0.78 MY3-02 distilled water 6.4 24.4 24.5 21.0 130 0.78 MY3-02 distilled water 8.7 24.7 23.0 16.6 500 0.98 MY3-02 distilled water 10.7 nm MY3-02 SSW 6.4 21.9 20.5 14.3 350 0.96 MY4-02 0.1M NaCl 3.2 22.6 20.4 17.6 300 0.88 MY4-02 0.1M NaCl 5.0 20.6 19.0 14.5 250 0.92
MY4-02 2 0.1M NaCl 6.0 20.4 18.5 12.7 450 0.94 MY4-02 2 0.1M NaCl 6.0 19.8 18.5 12.8 500 0.95 MY4-02 0.1M NaCl 9.0 20.4 17.5 6.2 350 0.99 MY4-02 0.1M NaCl 10.8 nm MY4-02 distilled water 3.2 24.4 23.0 20.0 300 0.89 MY4-02 distilled water 5.4 26.7 24.0 20.7 300 0.89
MY4-02 2 distilled water 6.4 25.4 23.5 20.0 400 0.91 MY4-02 2 distilled water 6.4 25.9 23.5 20.0 350 0.87 MY4-02 distilled water 9.1 25.2 23.0 16.0 400 0.96

146
aqueous IFT (mN/m) oil sample phase pH initial initial final τ (s) r2
composition measured fit
MY4-02 distilled water 9.2 25.4 23.0 17.5 350 0.91 MY4-02 distilled water 10.7 nm MY4-02 SSW 6.4 21.5 20.0 13.0 300 0.96 P-VE-00 0.1M NaCl 3.1 16.1 17.5 16.4 120 0.79 P-VE-00 0.1M NaCl 5.2 23.3 22.5 21.0 100 0.54 P-VE-00 0.1M NaCl 6.4 23.8 23.0 20.8 150 0.71 P-VE-00 0.1M NaCl 8.9 19.0 P-VE-00 0.1M NaCl 10.7 20.3 18.0 8.0 50 0.87 P-VE-00 distilled water 3.2 23.2 22.5 20.5 100 0.83 P-VE-00 distilled water 5.1 24.6 23.5 21.7 200 0.83 P-VE-00 distilled water 6.4 24.8 23.5 21.6 320 0.90 P-VE-00 distilled water 9.0 24.5 24.0 20.7 200 0.97 P-VE-00 distilled water 10.7 22.4 20.0 13.5 190 0.90 S-Ven-39 distilled water 6.4 20.8 22.5 20.6 200 0.63 S-Ven-39 SSW 6.4 20.7 20.6 18.2 400 0.87 S-Ven-40 distilled water 6.4 23.4 23.0 21.2 350 0.76 S-Ven-40 SSW 6.4 21.6 22.1 18.3 600 0.92 S-Ven-41 distilled water 6.4 24.6 22.5 20.6 250 0.75 S-Ven-41 SSW 6.4 20.5 21.6 18.8 500 0.79 S-Ven-41 SSW-HCO3 7.8 13.3 19.7 9.9 300 0.96
SQ-95 distilled water 3.2 23.8 23.5 22.0 120 0.60 SQ-95 distilled water 5.2 24.4 23.5 22.0 120 0.62 SQ-95 distilled water 6.5 24.3 23.0 20.0 120 0.62 SQ-95 distilled water 8.0 24.6 23.5 22.0 150 0.76 SQ-95 distilled water 9.0 24.0 23.0 12.0 160 0.97 SQ-95 distilled water 10.3 16.4 16.0 5.8 19 0.98 SQ-95 distilled water 10.9 8.0
Tensleep-99 distilled water 3.5 21.0 19.5 15.5 330 0.98 Tensleep-99 distilled water 5.2 20.3 19.0 15.5 300 0.97 Tensleep-99 distilled water 6.5 20.5 19.0 15.0 280 0.96 Tensleep-99 distilled water 9.0 20.7 18.0 11.5 160 0.96 Tensleep-99 distilled water 11.0 15.5
W-Br-03 distilled water 6.4 24.3 24.5 23.0 80 0.40 W-Br-03 SSW 6.4 17.6 23.8 20.0 350 0.90 W-Br-03 SSW-HCO3 7.8 20.9 22.8 11.4 300 0.98 W-Lo-03 distilled water 6.4 19.8 21.5 19.7 120 0.76
1 SSW = synthetic sea water (see Table 1) 2 duplicate measurements 3 nm = not measureable 4 SSW-HCO3 = synthetic sea water recipe with sodium bicarbonate (see Table 1)