
Kristen Mitsch - Visual Pedagogy Project: Visual Book Report
Wetlands, Carbon and Climate Change
William J. Mitsch Everglades Wetland Research Park,
Florida Gulf Coast University, Naples Florida
with collaboration of: Blanca Bernal, Amanda M. Nahlik, Ulo Mander, Li Zhang,
Christopher Anderson, Sven E. Jørgensen, and Hans Brix Florida Gulf Coast University (USA), U.S. EPA, Tartu University (Estonia), Auburn University (USA), Copenhagen University (Denmark), and Aarhus
University (Denmark)

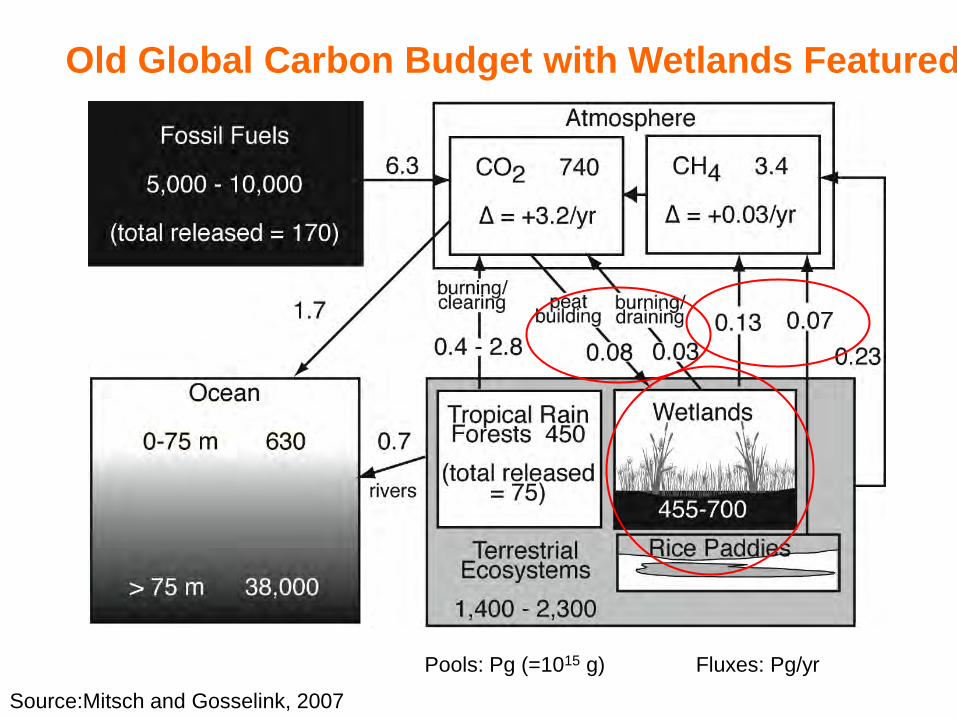
Source:Mitsch and Gosselink, 2007
Fluxes: Pg/yr Pools: Pg (=1015 g)
Old Global Carbon Budget with Wetlands Featured
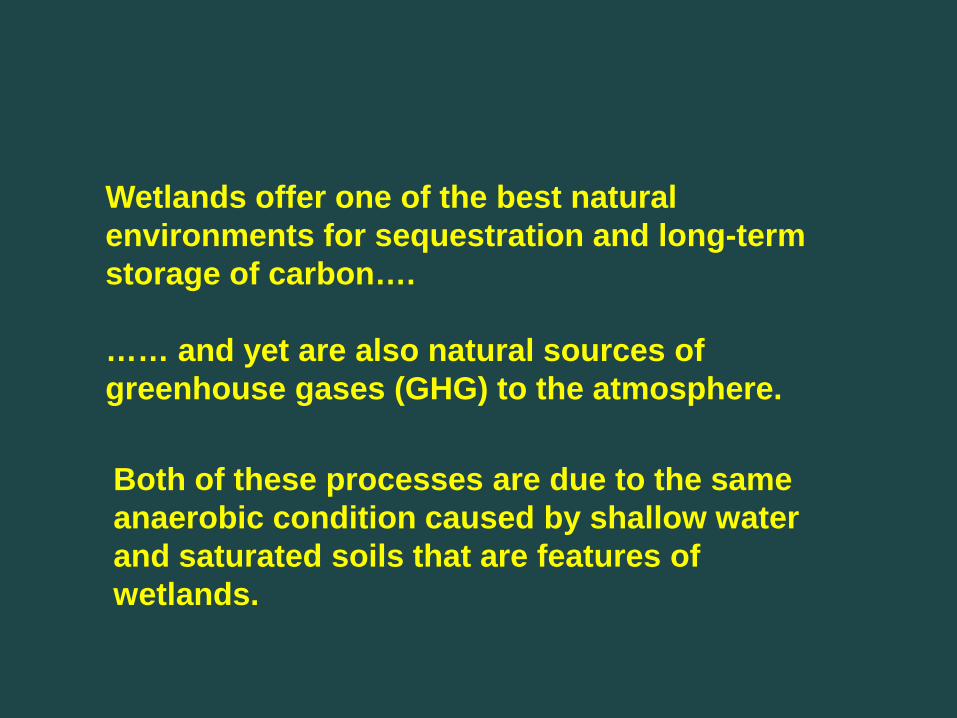
Wetlands offer one of the best natural environments for sequestration and long-term storage of carbon…. …… and yet are also natural sources of greenhouse gases (GHG) to the atmosphere.
Both of these processes are due to the same anaerobic condition caused by shallow water and saturated soils that are features of wetlands.
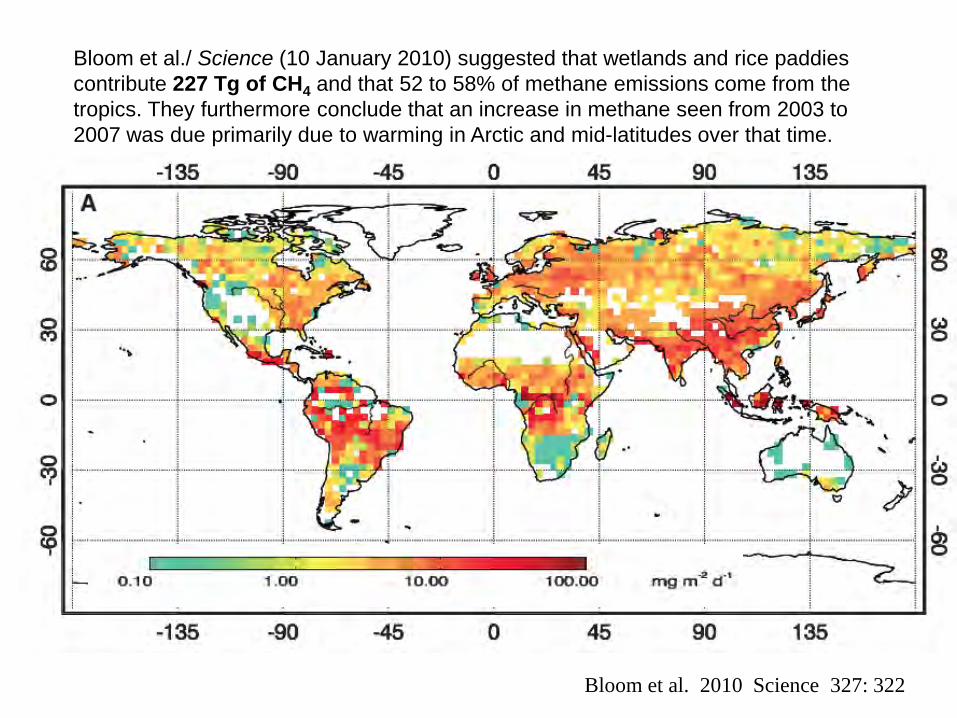
Bloom et al. 2010 Science 327: 322
Bloom et al./ Science (10 January 2010) suggested that wetlands and rice paddies contribute 227 Tg of CH4 and that 52 to 58% of methane emissions come from the tropics. They furthermore conclude that an increase in methane seen from 2003 to 2007 was due primarily due to warming in Arctic and mid-latitudes over that time.
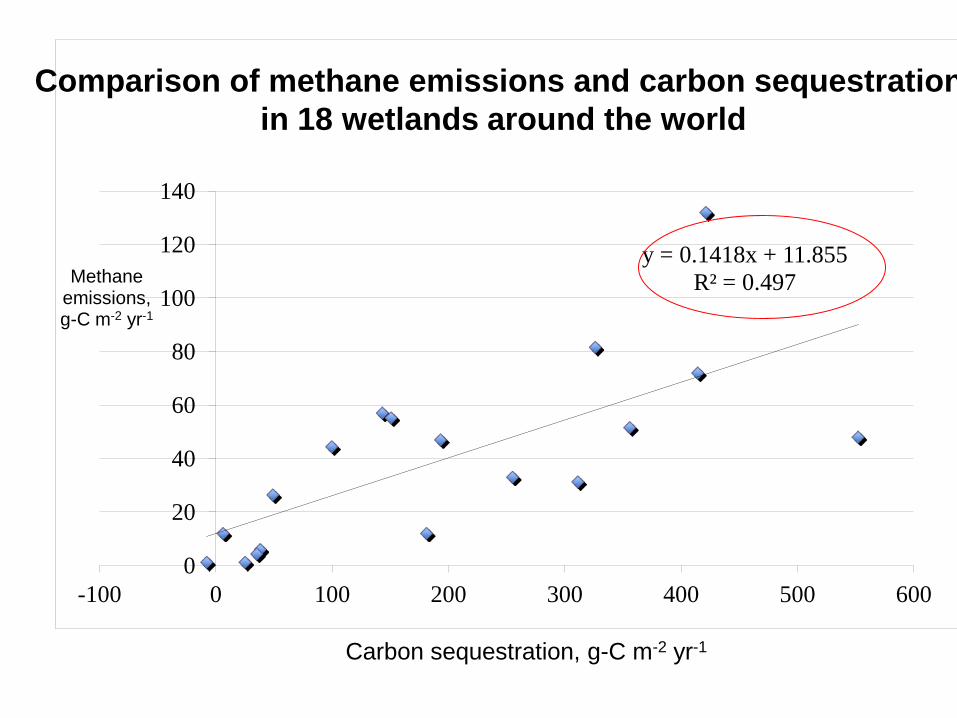
Carbon sequestration, g-C m-2 yr-1
y = 0.1418x + 11.855 R² = 0.497
0
20
40
60
80
100
120
140
-100 0 100 200 300 400 500 600
Methane emissions, g-C m-2 yr-1
Comparison of methane emissions and carbon sequestration in 18 wetlands around the world
• On average, methane emitted from wetlands, as carbon, is 14% of the wetland’s carbon sequestration. • This 7.1:1 (sequestration/methane) carbon ratio is equivalent to 19:5 as CO2 /CH4 • The standard global warming potential (GWPM) used by the International Panel on Climate Change (IPCC, 2007) and others to compare methane and carbon dioxide is now 25:1 • It could be concluded from this simple comparison that the world’s wetlands are net sources of radiative forcing on climate.
Our Initial Investigation
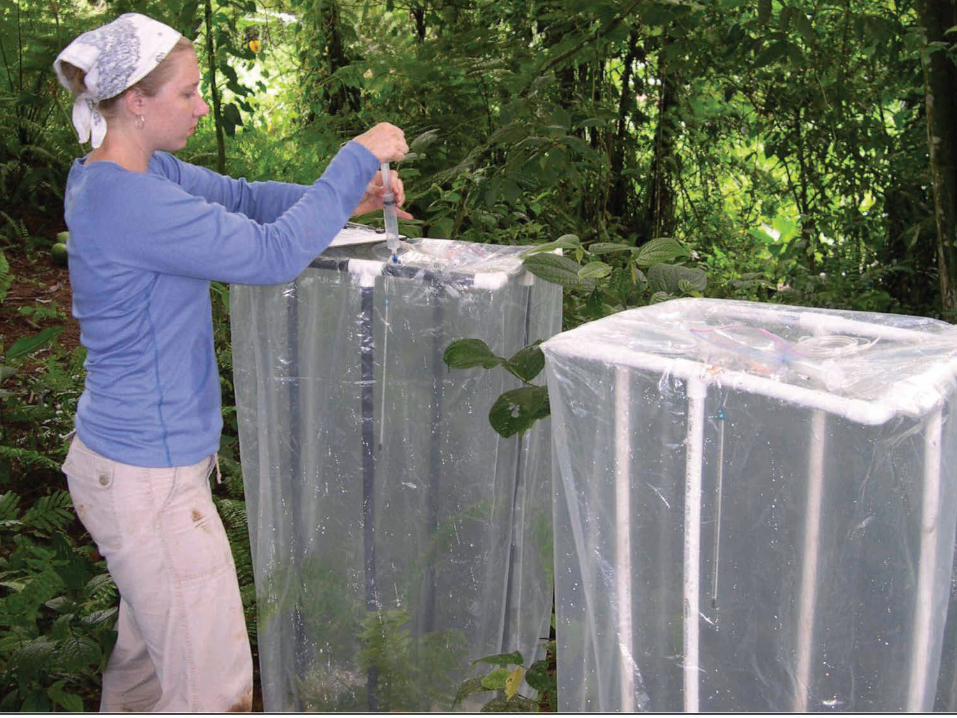
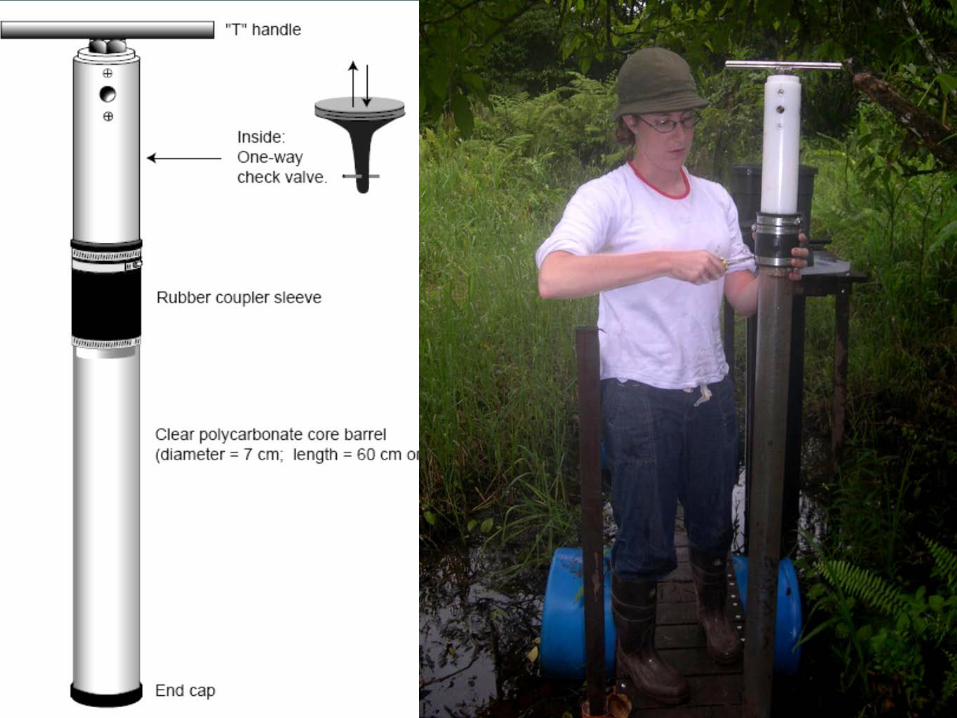
Comparison of carbon sequestration and methane emissions at three temperate and
one tropical wetlands
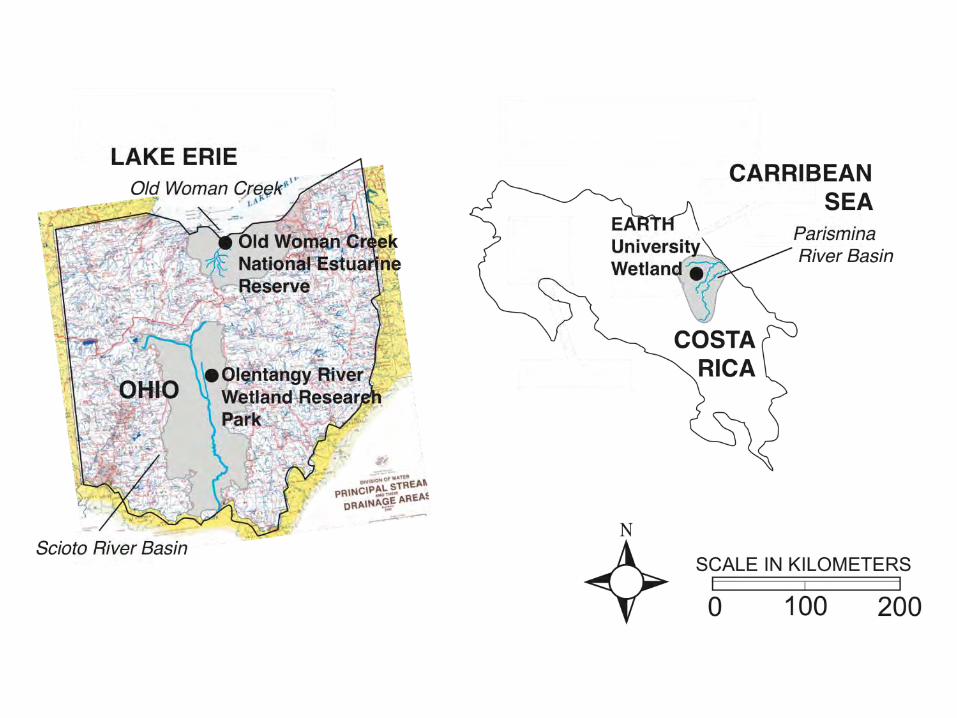
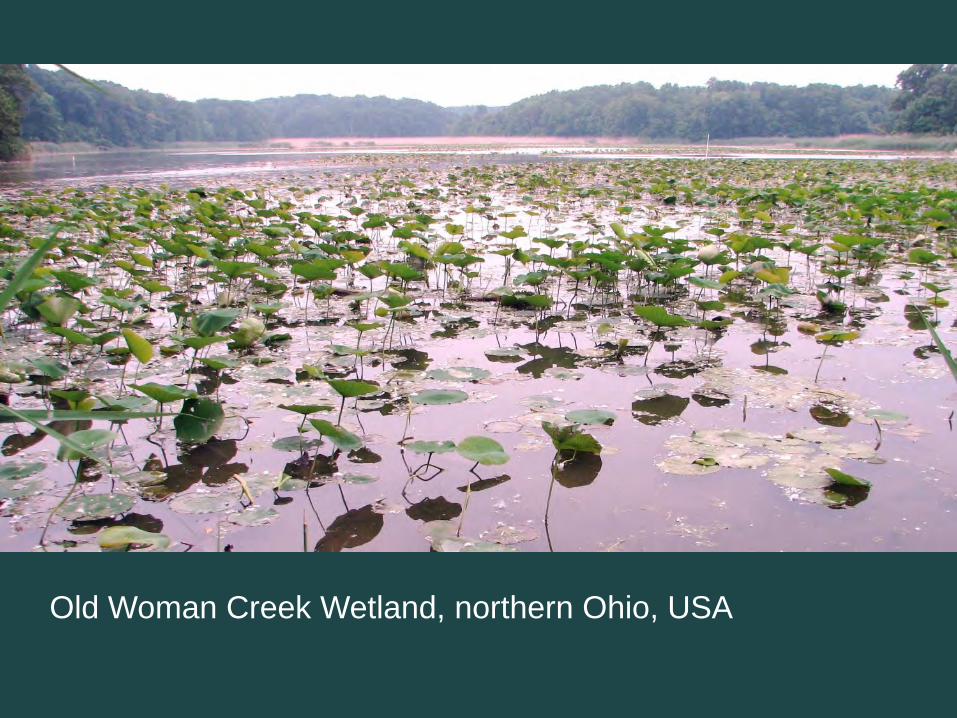
Old Woman Creek Wetland, northern Ohio, USA
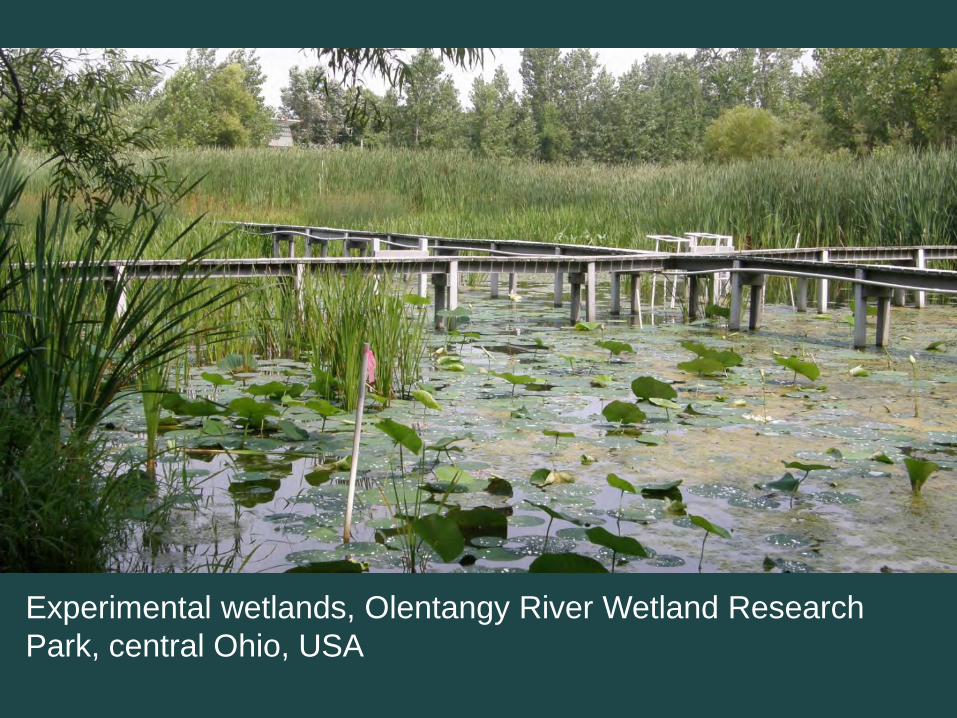
Experimental wetlands, Olentangy River Wetland Research Park, central Ohio, USA

Raphia taedigera (swamp palm) La Reserva wetland, EARTH University, northeastern Costa Rica
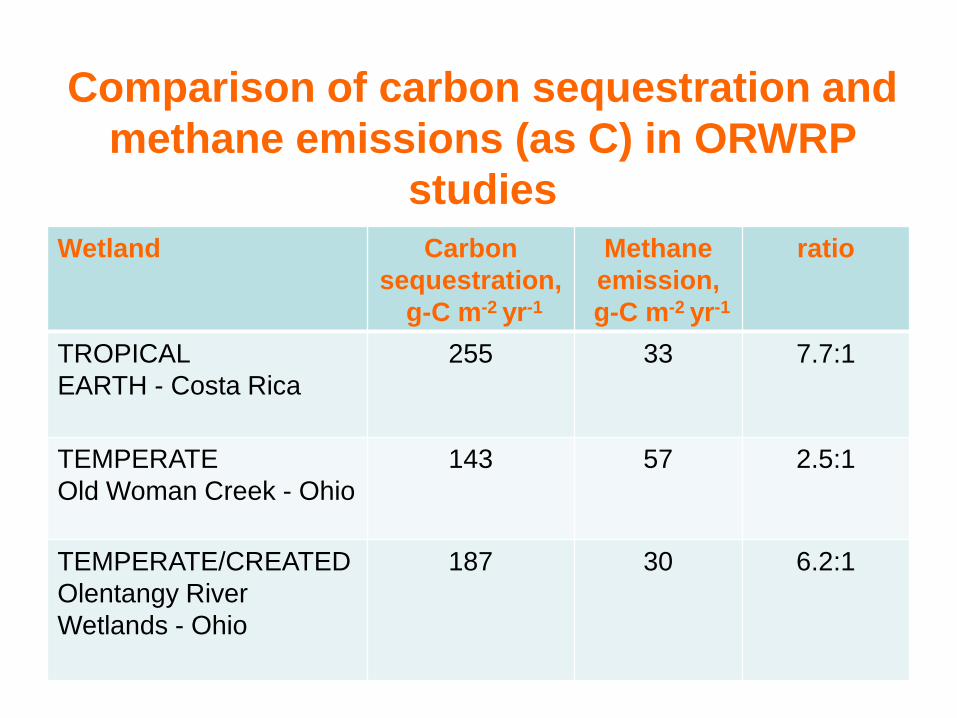
Wetland Carbon sequestration,
g-C m-2 yr-1
Methane emission,
g-C m-2 yr-1
ratio
TROPICAL EARTH - Costa Rica
255 33 7.7:1
TEMPERATE Old Woman Creek - Ohio
143 57 2.5:1
TEMPERATE/CREATED Olentangy River Wetlands - Ohio
187 30 6.2:1
Comparison of carbon sequestration and methane emissions (as C) in ORWRP
studies
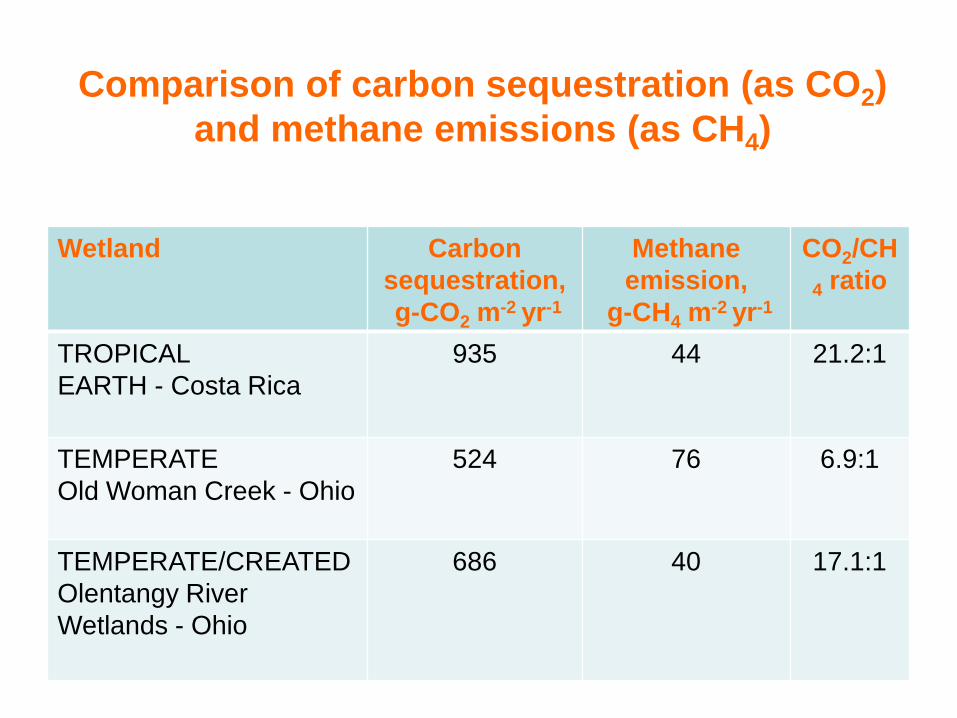
Wetland Carbon sequestration, g-CO2 m-2 yr-1
Methane emission,
g-CH4 m-2 yr-1
CO2/CH4 ratio
TROPICAL EARTH - Costa Rica
935 44 21.2:1
TEMPERATE Old Woman Creek - Ohio
524 76 6.9:1
TEMPERATE/CREATED Olentangy River Wetlands - Ohio
686 40 17.1:1
Comparison of carbon sequestration (as CO2) and methane emissions (as CH4)
Source: Mitsch et al. 2012. Landacape Ecology
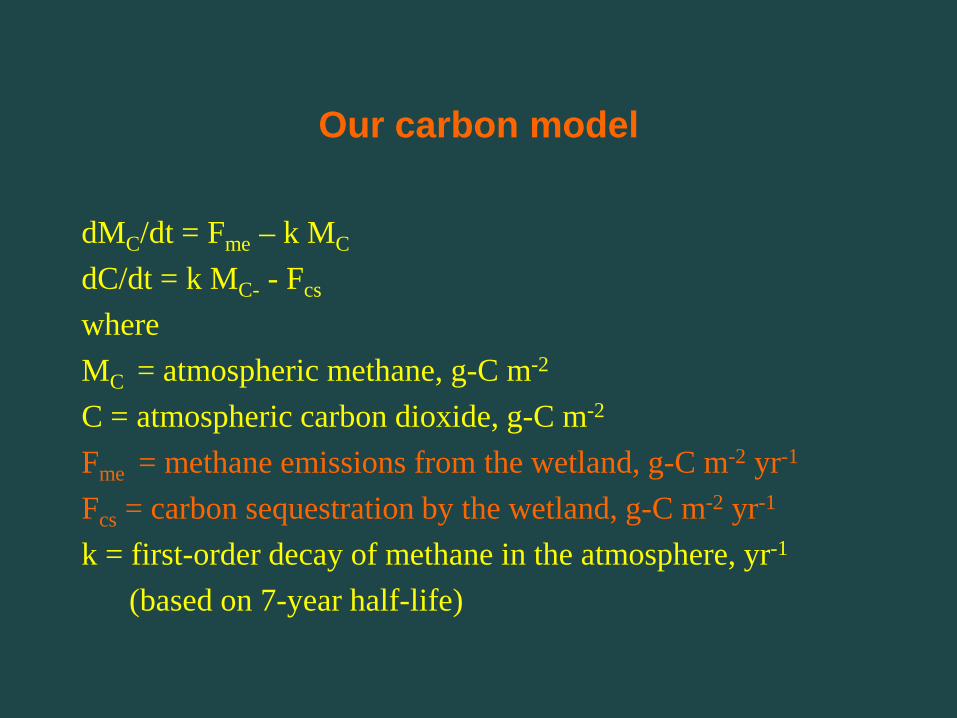
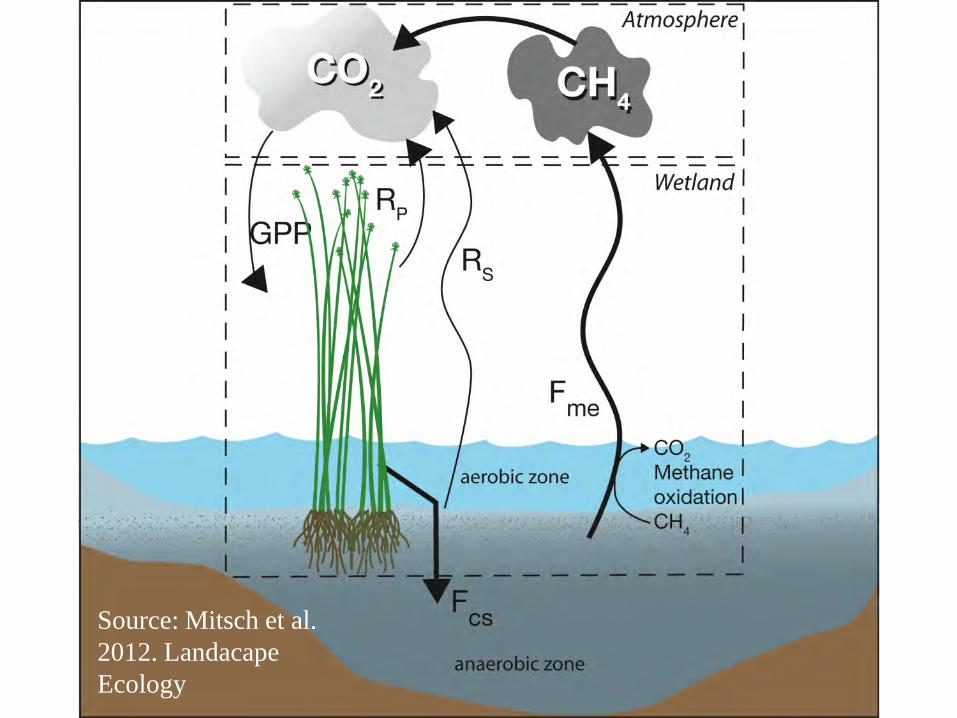
Our carbon model
dMC/dt = Fme – k MC dC/dt = k MC- - Fcs where MC
= atmospheric methane, g-C m-2 C = atmospheric carbon dioxide, g-C m-2 Fme
= methane emissions from the wetland, g-C m-2 yr-1 Fcs = carbon sequestration by the wetland, g-C m-2 yr-1 k = first-order decay of methane in the atmosphere, yr-1 (based on 7-year half-life)
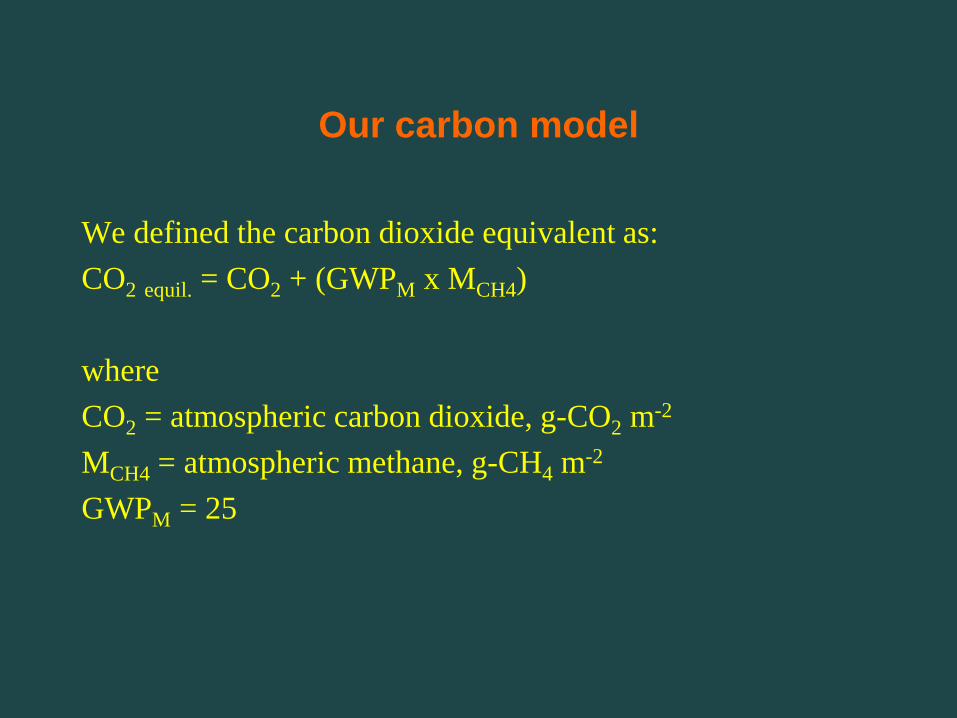
We defined the carbon dioxide equivalent as: CO2 equil. = CO2 + (GWPM x MCH4) where CO2 = atmospheric carbon dioxide, g-CO2 m-2 MCH4 = atmospheric methane, g-CH4 m-2 GWPM = 25
Our carbon model
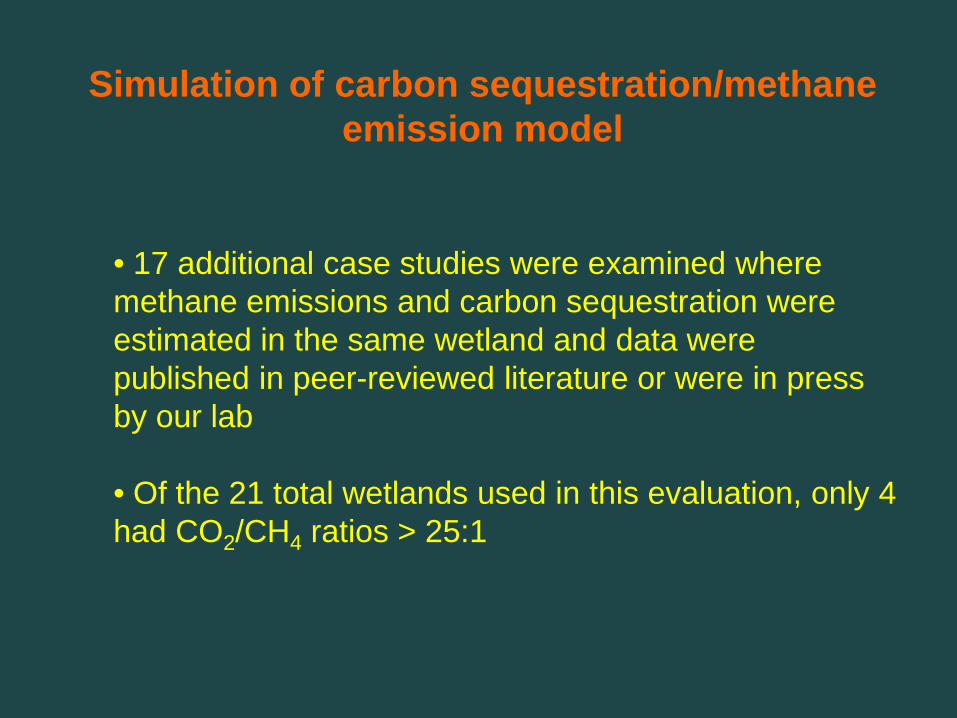
• 17 additional case studies were examined where methane emissions and carbon sequestration were estimated in the same wetland and data were published in peer-reviewed literature or were in press by our lab
• Of the 21 total wetlands used in this evaluation, only 4 had CO2/CH4 ratios > 25:1
Simulation of carbon sequestration/methane emission model
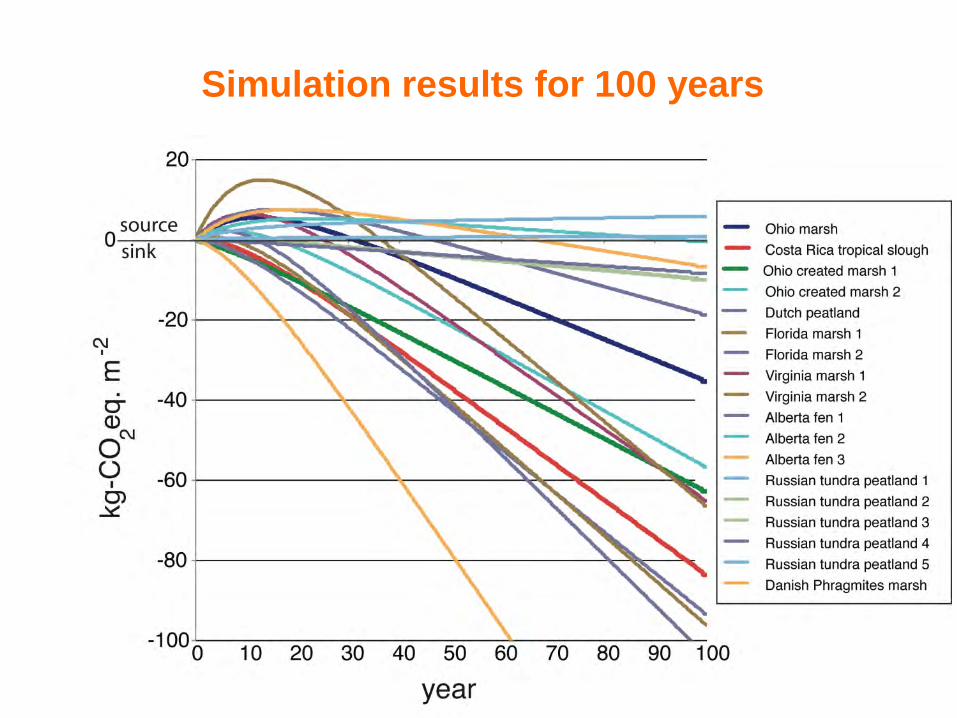
Simulation results for 100 years
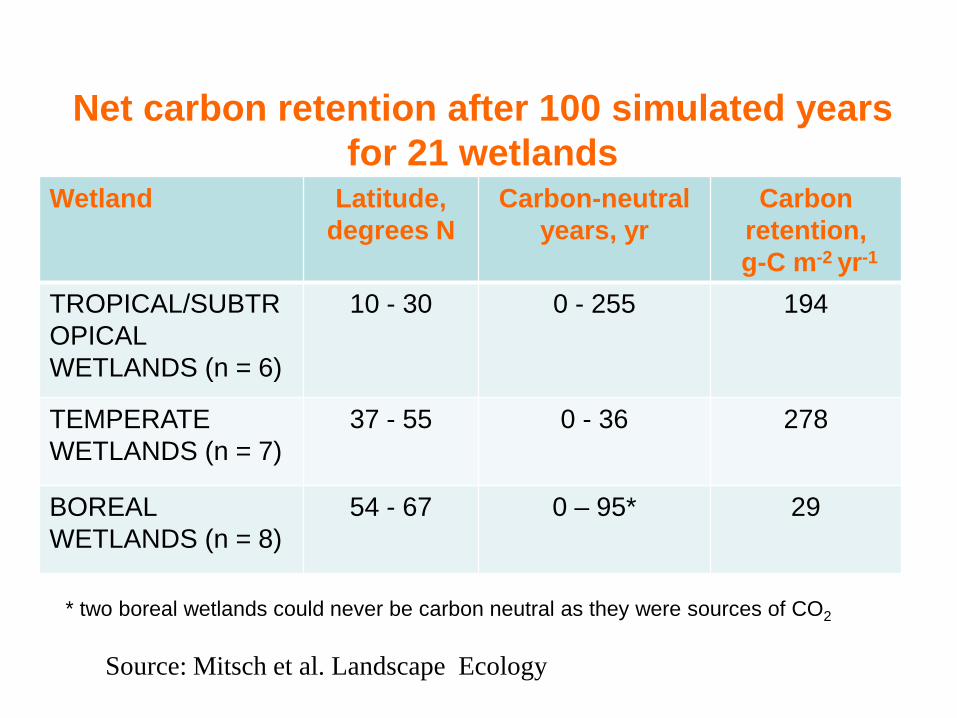
Wetland Latitude, degrees N
Carbon-neutral years, yr
Carbon retention,
g-C m-2 yr-1 TROPICAL/SUBTROPICAL WETLANDS (n = 6)
10 - 30 0 - 255 194
TEMPERATE WETLANDS (n = 7)
37 - 55 0 - 36 278
BOREAL WETLANDS (n = 8)
54 - 67 0 – 95* 29
Net carbon retention after 100 simulated years for 21 wetlands
* two boreal wetlands could never be carbon neutral as they were sources of CO2
Source: Mitsch et al. Landscape Ecology
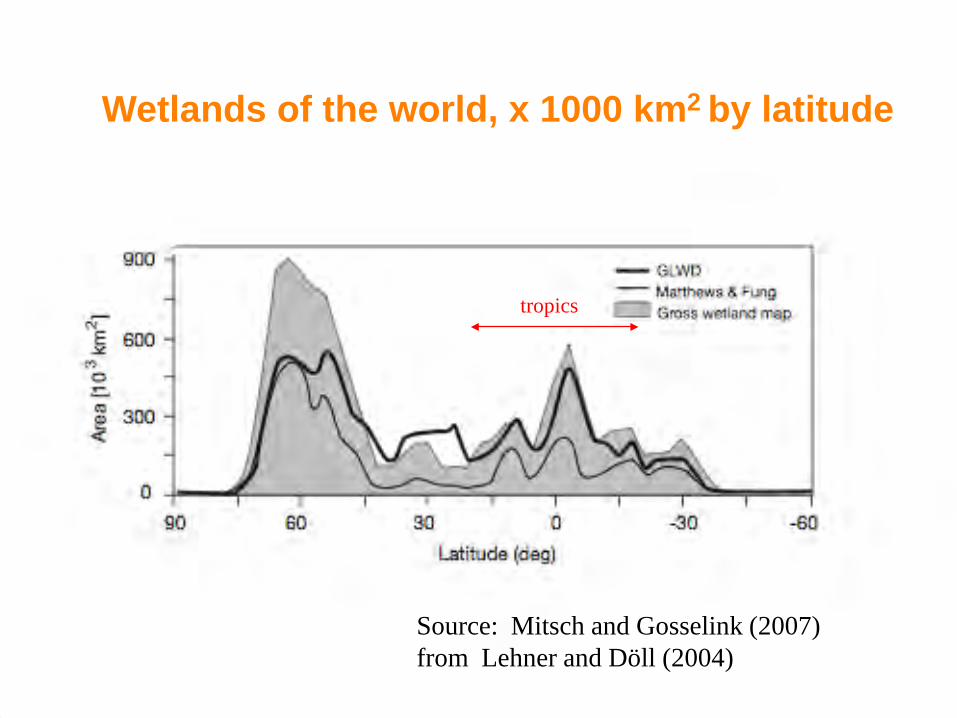
tropics
Source: Mitsch and Gosselink (2007) from Lehner and Döll (2004)
Wetlands of the world, x 1000 km2 by latitude
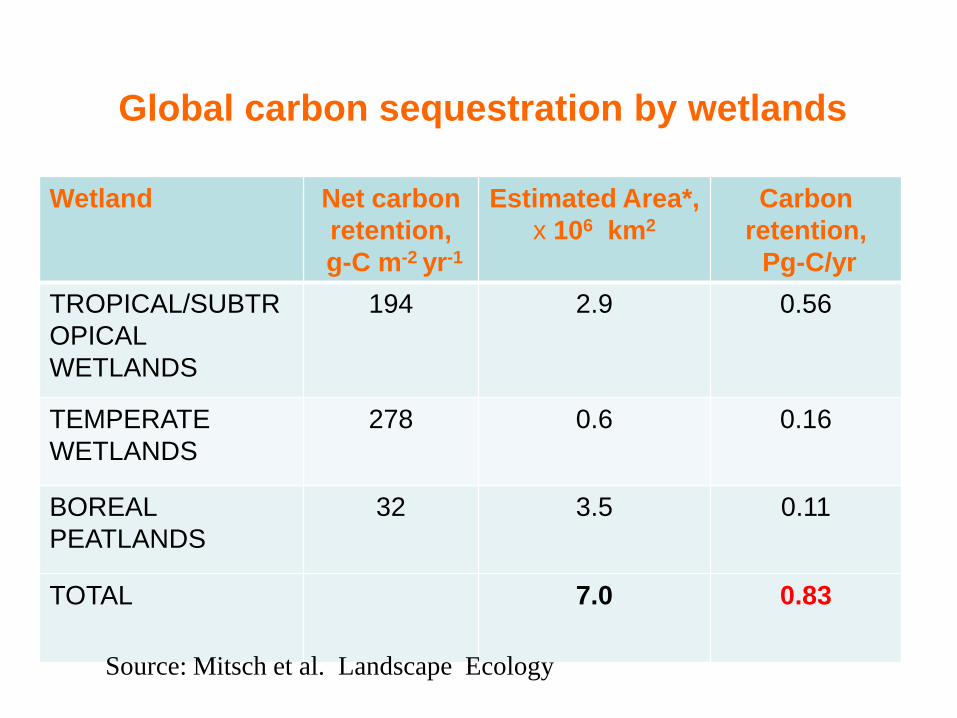
Wetland Net carbon retention,
g-C m-2 yr-1
Estimated Area*, x 106 km2
Carbon retention, Pg-C/yr
TROPICAL/SUBTROPICAL WETLANDS
194 2.9 0.56
TEMPERATE WETLANDS
278 0.6 0.16
BOREAL PEATLANDS
32 3.5 0.11
TOTAL 7.0 0.83
Global carbon sequestration by wetlands
Source: Mitsch et al. Landscape Ecology
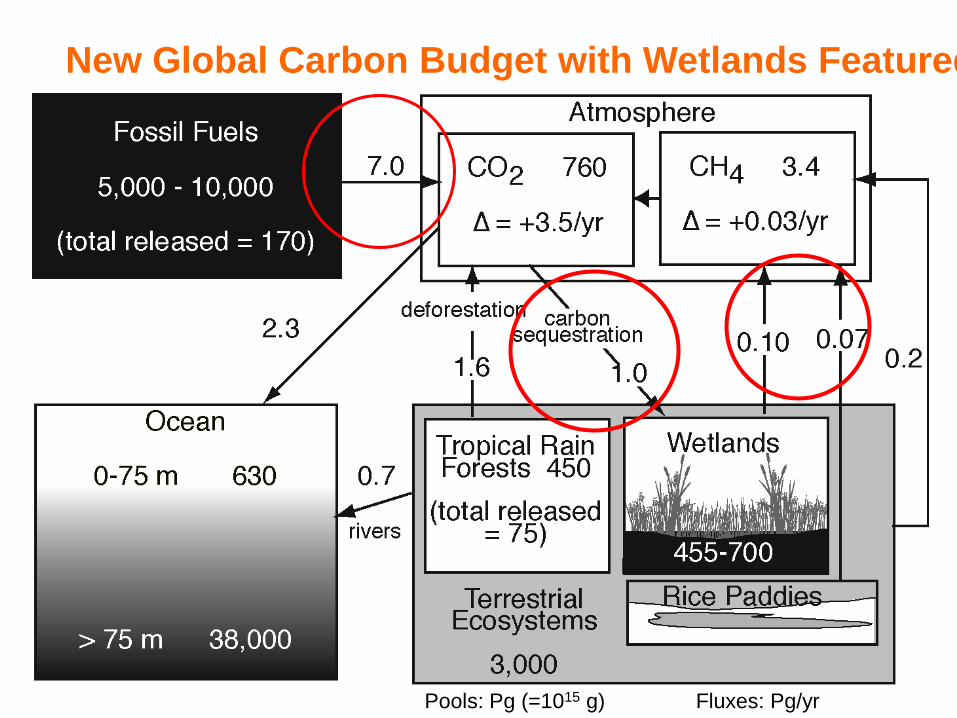
Fluxes: Pg/yr Pools: Pg (=1015 g)
New Global Carbon Budget with Wetlands Featured

Conclusions
• Most wetlands, if evaluated with the simple 25:1 methane : carbon dioxide ratio used by climate change policy makers, are net sources of radiative forcing and hence bad for climate.
• Most wetlands are net sinks of radiative forcing on climate well within 100 to 200 years when the decay of methane in the atmosphere is factored in.
Conclusions
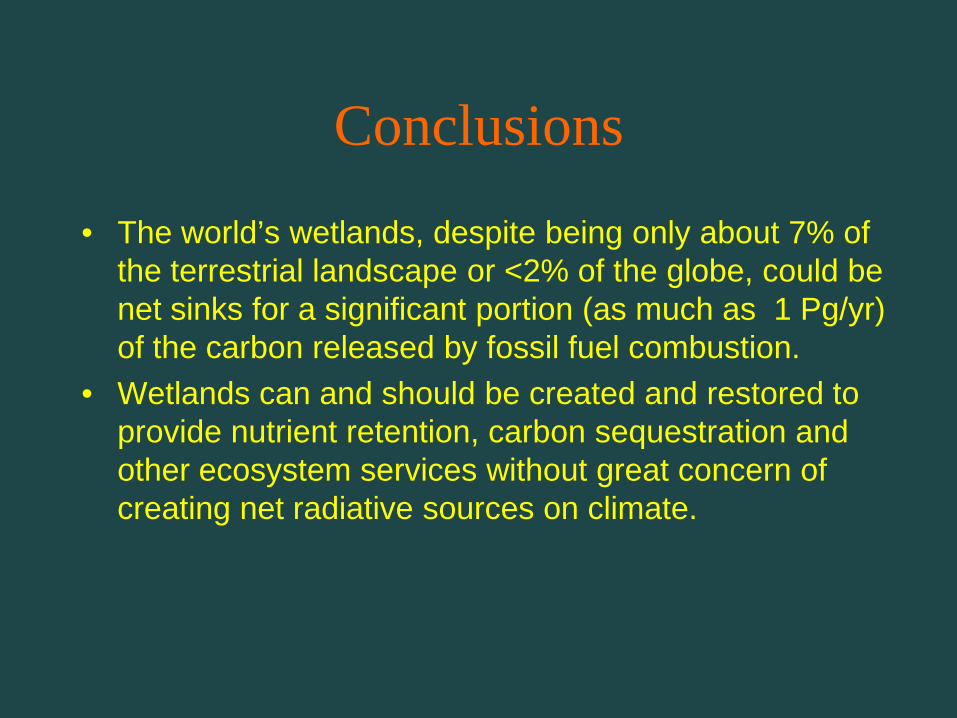
• The world’s wetlands, despite being only about 7% of the terrestrial landscape or <2% of the globe, could be net sinks for a significant portion (as much as 1 Pg/yr) of the carbon released by fossil fuel combustion.
• Wetlands can and should be created and restored to provide nutrient retention, carbon sequestration and other ecosystem services without great concern of creating net radiative sources on climate.