Wetland Ecosystem Services Protocol (WESP) Paul Adamus, Ph.D. Graduate Faculty, Water Resources...
65
Wetland Ecosystem Services Protocol (WESP) Paul Adamus, Ph.D. Graduate Faculty, Water Resources Graduate Program Oregon State University and Adamus Resource Assessment, Inc. [email protected] in collaboration with: Nova Scotia Environment – John Brazner -- A Short Course Halifax, NS August 13-15, 2013
-
Upload
harry-boone -
Category
Documents
-
view
228 -
download
0
Transcript of Wetland Ecosystem Services Protocol (WESP) Paul Adamus, Ph.D. Graduate Faculty, Water Resources...
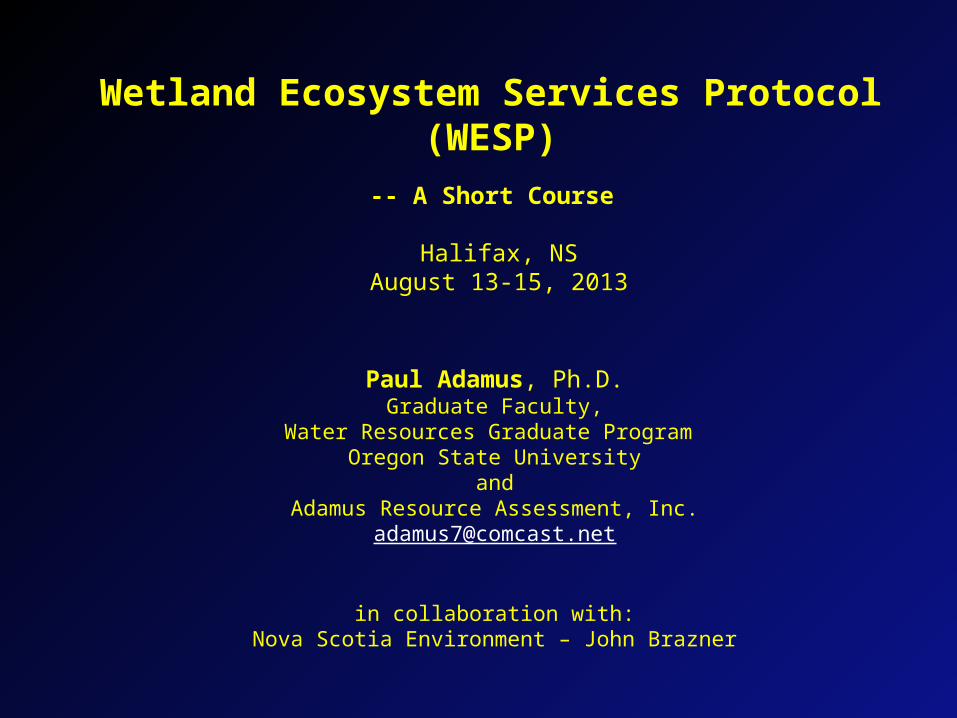
Wetland Ecosystem Services Protocol(WESP)
Paul Adamus, Ph.D.Graduate Faculty,
Water Resources Graduate Program Oregon State University
andAdamus Resource Assessment, Inc.
in collaboration with:Nova Scotia Environment – John Brazner
-- A Short Course
Halifax, NSAugust 13-15, 2013
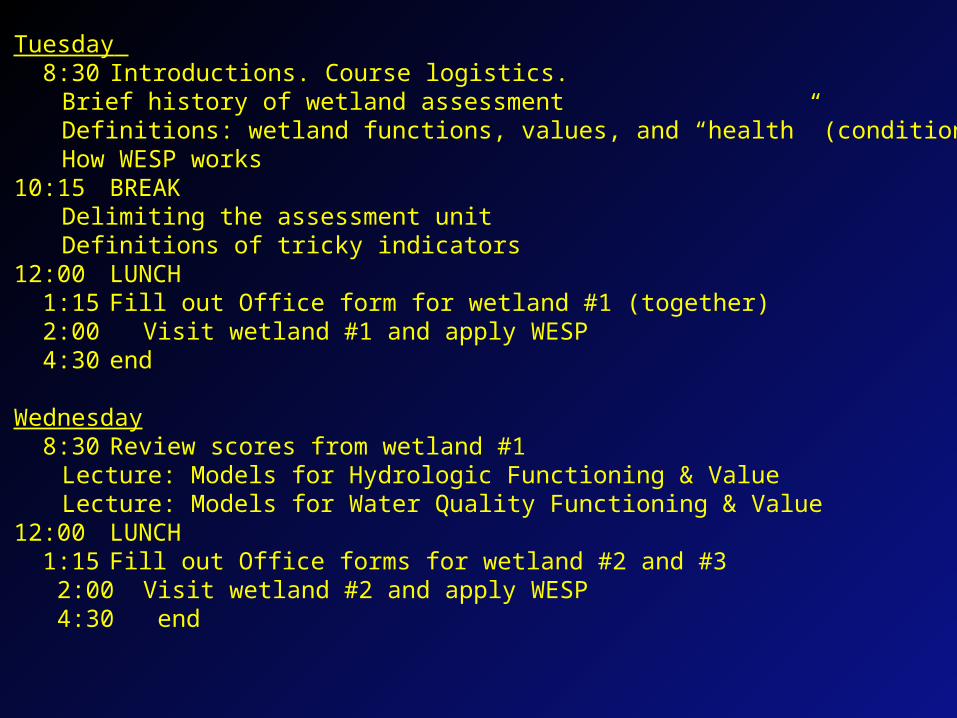
Tuesday 8:30 Introductions. Course logistics.
Brief history of wetland assessmentDefinitions: wetland functions, values, and “health” (condition)How WESP works
10:15 BREAKDelimiting the assessment unitDefinitions of tricky indicators
12:00 LUNCH 1:15 Fill out Office form for wetland #1 (together) 2:00 Visit wetland #1 and apply WESP 4:30 end Wednesday 8:30 Review scores from wetland #1
Lecture: Models for Hydrologic Functioning & ValueLecture: Models for Water Quality Functioning & Value
12:00 LUNCH 1:15 Fill out Office forms for wetland #2 and #3 2:00 Visit wetland #2 and apply WESP 4:30 end
Thursday 8:30 Visit and assess wetland #3 11:45 LUNCH1:15 Review scores from wetlands #2 and #3
Lecture: Models for Habitat Functions & Values2:30 BREAK
Using WESP for estimating compensation – some optionsGeneral discussion and feedback
4:30 end
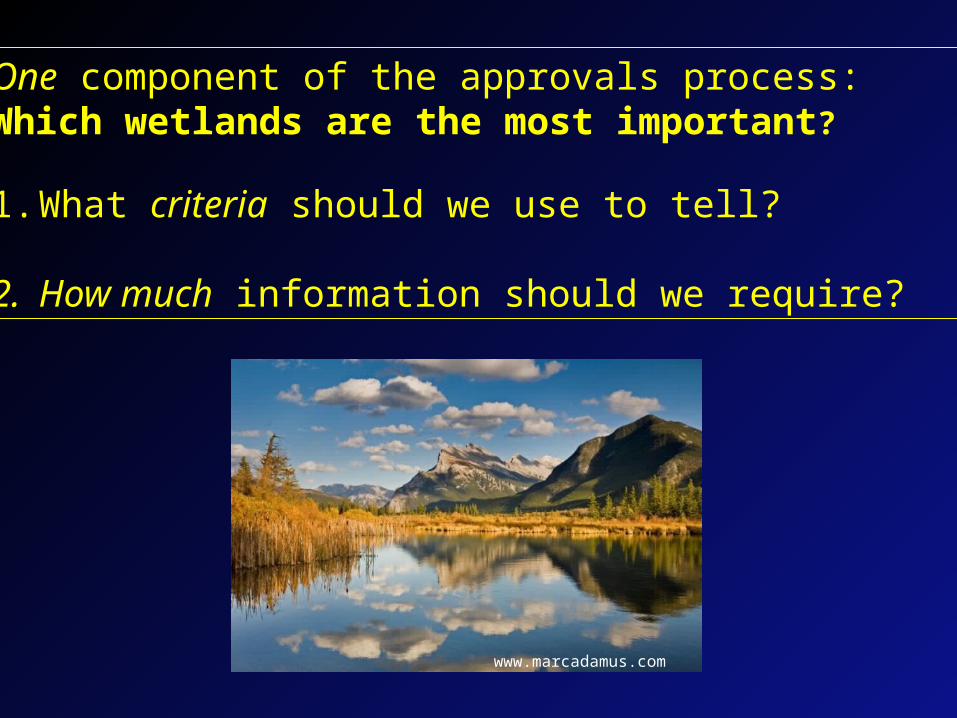
One component of the approvals process:Which wetlands are the most important?
1. What criteria should we use to tell?
2. How much information should we require?
www.marcadamus.com
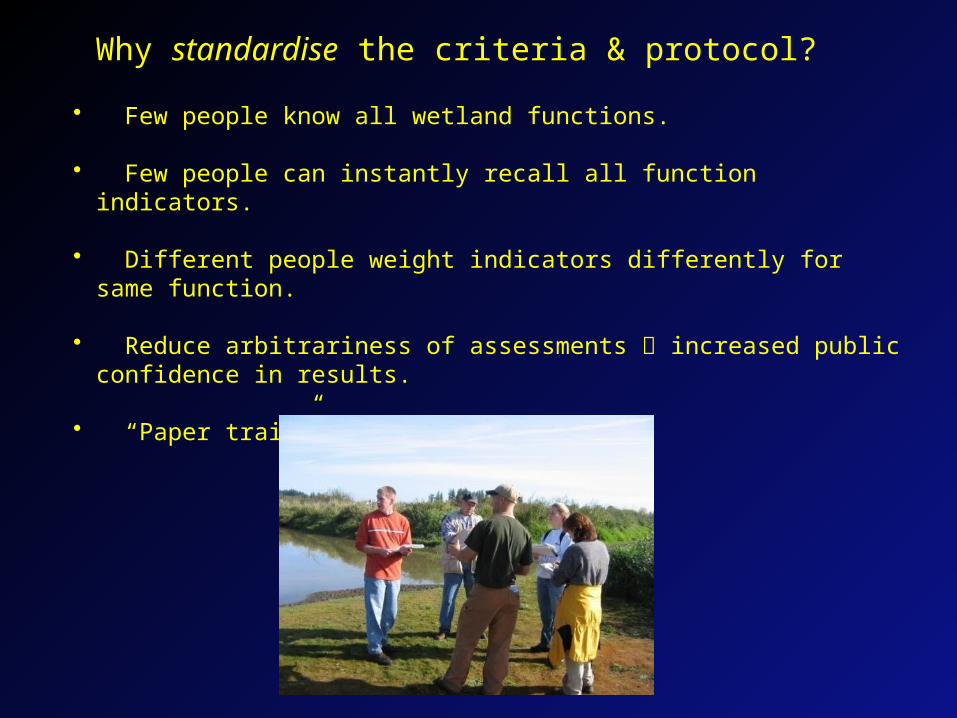
Why standardise the criteria & protocol?
• Few people know all wetland functions.
• Few people can instantly recall all function indicators.
• Different people weight indicators differently for same function.
• Reduce arbitrariness of assessments increased public confidence in results.
• “Paper trail” useful for legal.
Definitions:• Delineating• Classifying• Scoring• Rating (Categorizing)
7
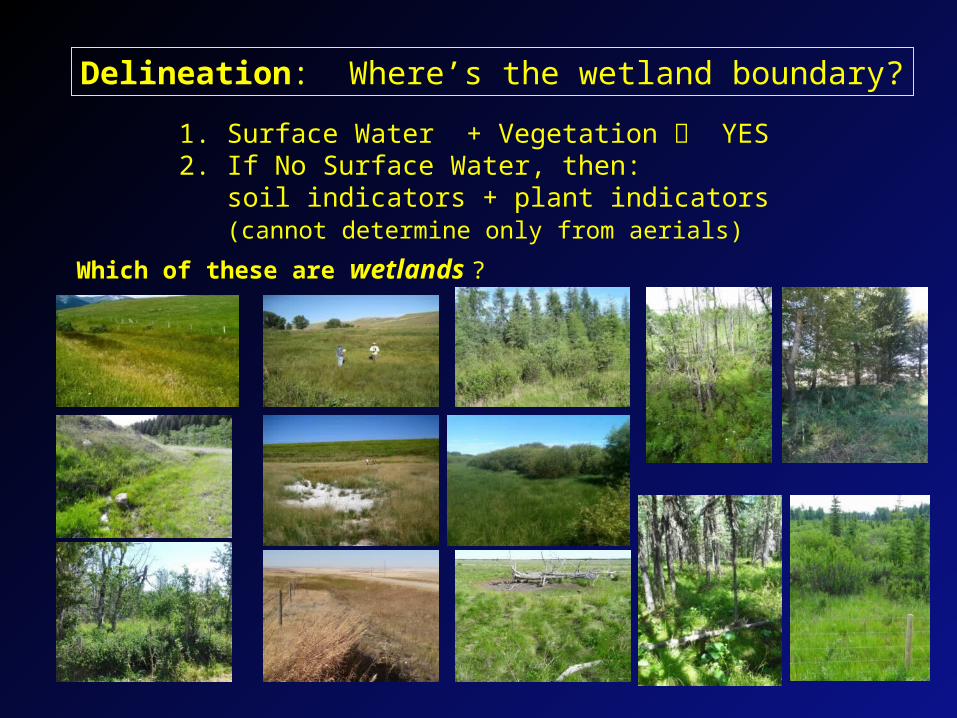
Delineation: Where’s the wetland boundary?
1. Surface Water + Vegetation YES2. If No Surface Water, then:
soil indicators + plant indicators(cannot determine only from aerials)
Which of these are wetlands ?
8
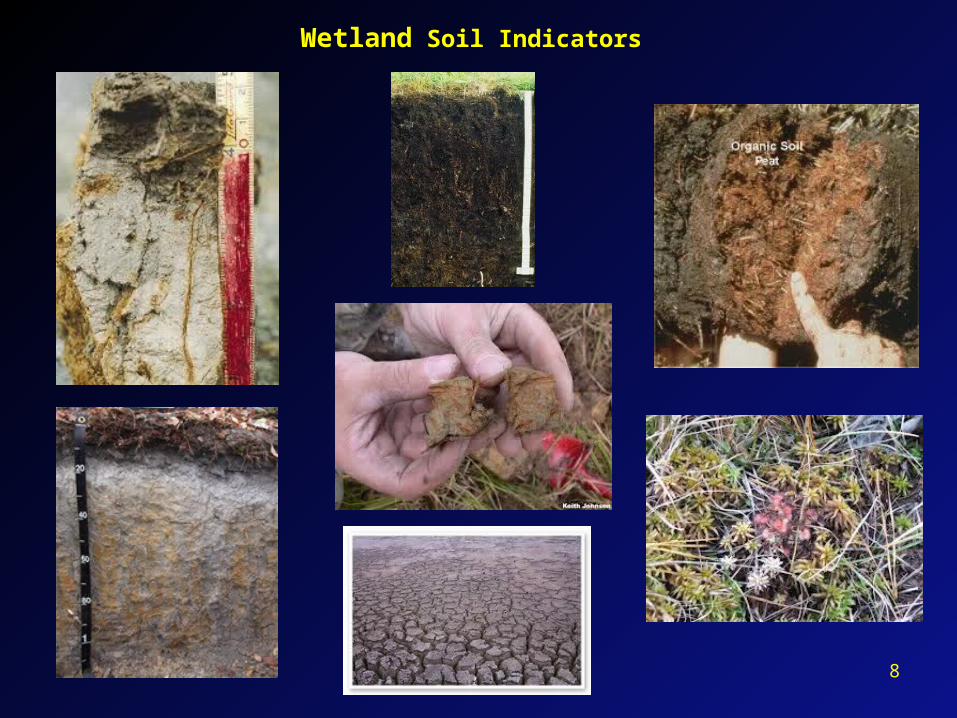
Wetland Soil Indicators
9
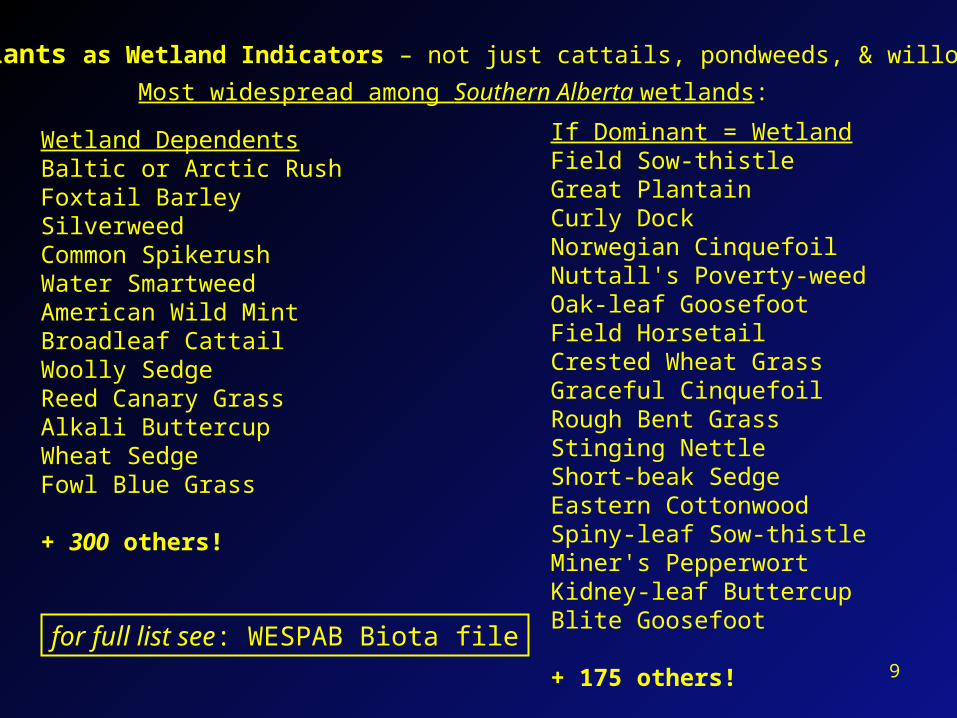
Plants as Wetland Indicators – not just cattails, pondweeds, & willows!
Most widespread among Southern Alberta wetlands:
Wetland DependentsBaltic or Arctic RushFoxtail BarleySilverweedCommon SpikerushWater SmartweedAmerican Wild MintBroadleaf CattailWoolly SedgeReed Canary GrassAlkali ButtercupWheat SedgeFowl Blue Grass
+ 300 others!
If Dominant = WetlandField Sow-thistleGreat PlantainCurly DockNorwegian CinquefoilNuttall's Poverty-weedOak-leaf GoosefootField HorsetailCrested Wheat GrassGraceful CinquefoilRough Bent GrassStinging NettleShort-beak SedgeEastern CottonwoodSpiny-leaf Sow-thistleMiner's PepperwortKidney-leaf ButtercupBlite Goosefoot
+ 175 others!
for full list see: WESPAB Biota file
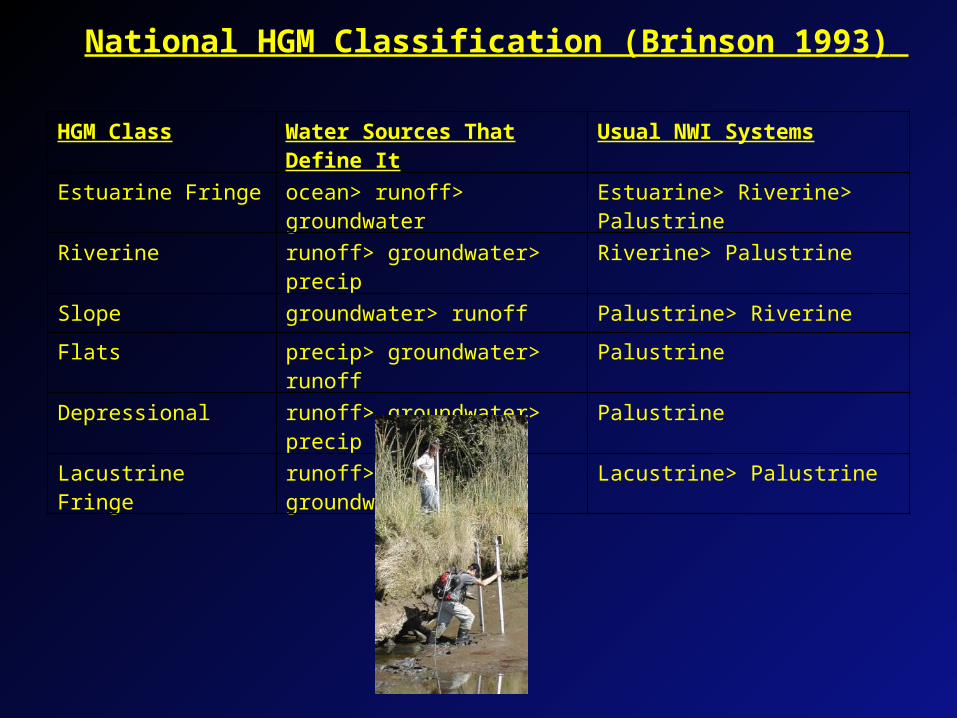
National HGM Classification (Brinson 1993)
HGM Class Water Sources That Define It Usual NWI Systems
Estuarine Fringe ocean> runoff> groundwater Estuarine> Riverine> Palustrine
Riverine runoff> groundwater> precip Riverine> Palustrine
Slope groundwater> runoff Palustrine> Riverine
Flats precip> groundwater> runoff Palustrine
Depressional runoff> groundwater> precip Palustrine
Lacustrine Fringe runoff> precip> groundwater Lacustrine> Palustrine
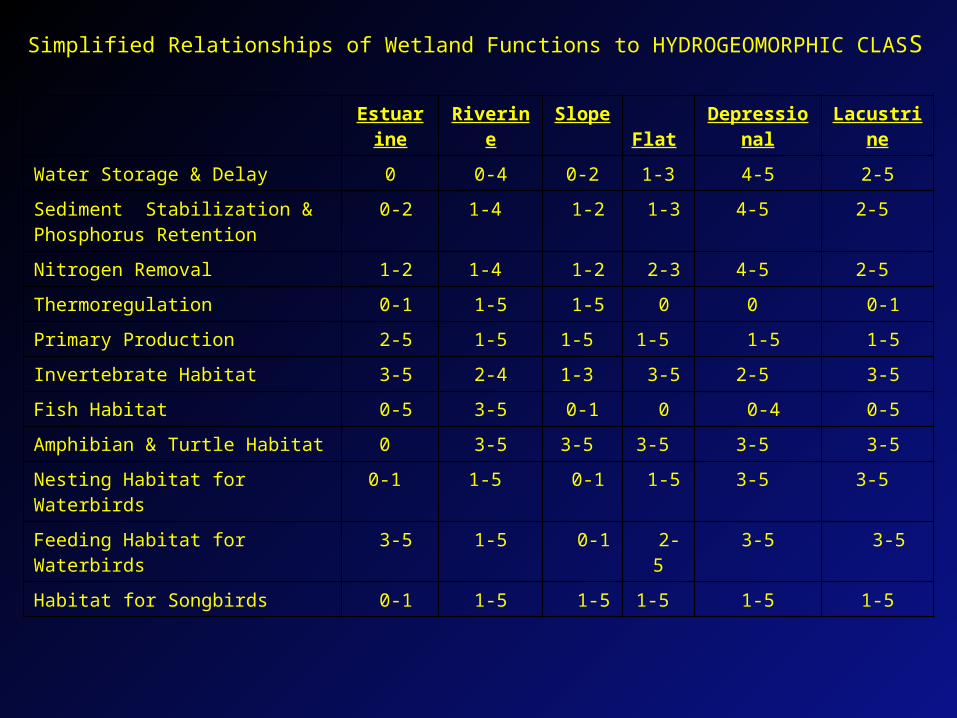
Estuarine
Riverine Slope Flat Depressional Lacustrine
Water Storage & Delay 0 0-4 0-2 1-3 4-5 2-5
Sediment Stabilization & Phosphorus Retention
0-2 1-4 1-2 1-3 4-5 2-5
Nitrogen Removal 1-2 1-4 1-2 2-3 4-5 2-5
Thermoregulation 0-1 1-5 1-5 0 0 0-1
Primary Production 2-5 1-5 1-5 1-5 1-5 1-5
Invertebrate Habitat 3-5 2-4 1-3 3-5 2-5 3-5
Fish Habitat 0-5 3-5 0-1 0 0-4 0-5
Amphibian & Turtle Habitat 0 3-5 3-5 3-5 3-5 3-5
Nesting Habitat for Waterbirds 0-1 1-5 0-1 1-5 3-5 3-5
Feeding Habitat for Waterbirds 3-5 1-5 0-1 2-5 3-5 3-5
Habitat for Songbirds 0-1 1-5 1-5 1-5 1-5 1-5
Simplified Relationships of Wetland Functions to HYDROGEOMORPHIC CLASS
Scoring Wetlands – gives relative numeric estimates
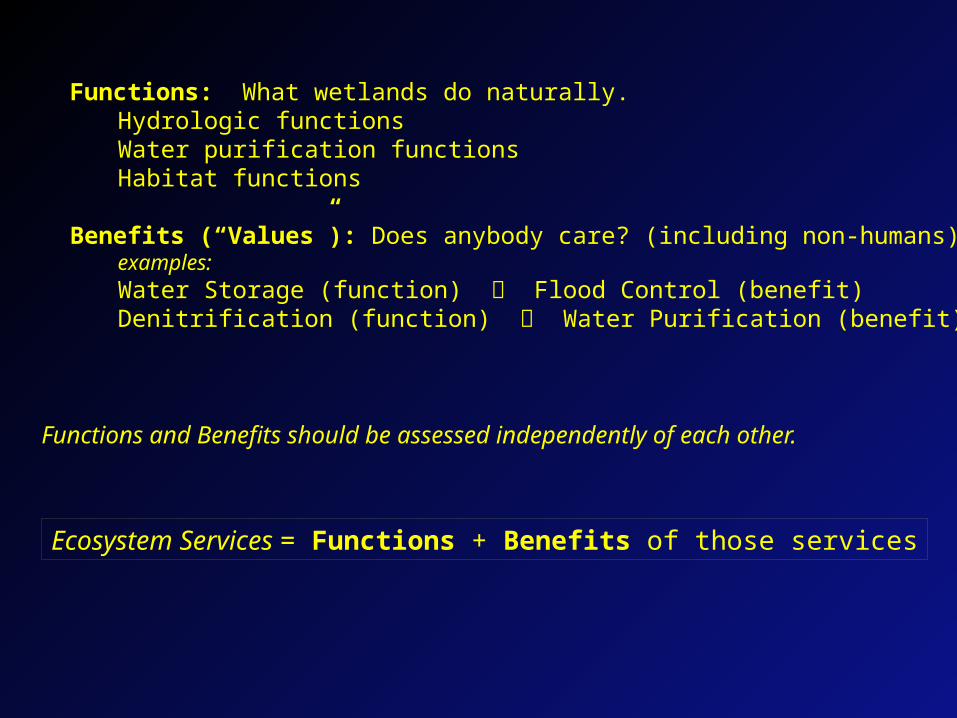
Functions: What wetlands do naturally.Hydrologic functionsWater purification functionsHabitat functions
Benefits (“Values”): Does anybody care? (including non-humans)examples:Water Storage (function) Flood Control (benefit)Denitrification (function) Water Purification (benefit)
Ecosystem Services = Functions + Benefits of those services
Functions and Benefits should be assessed independently of each other.
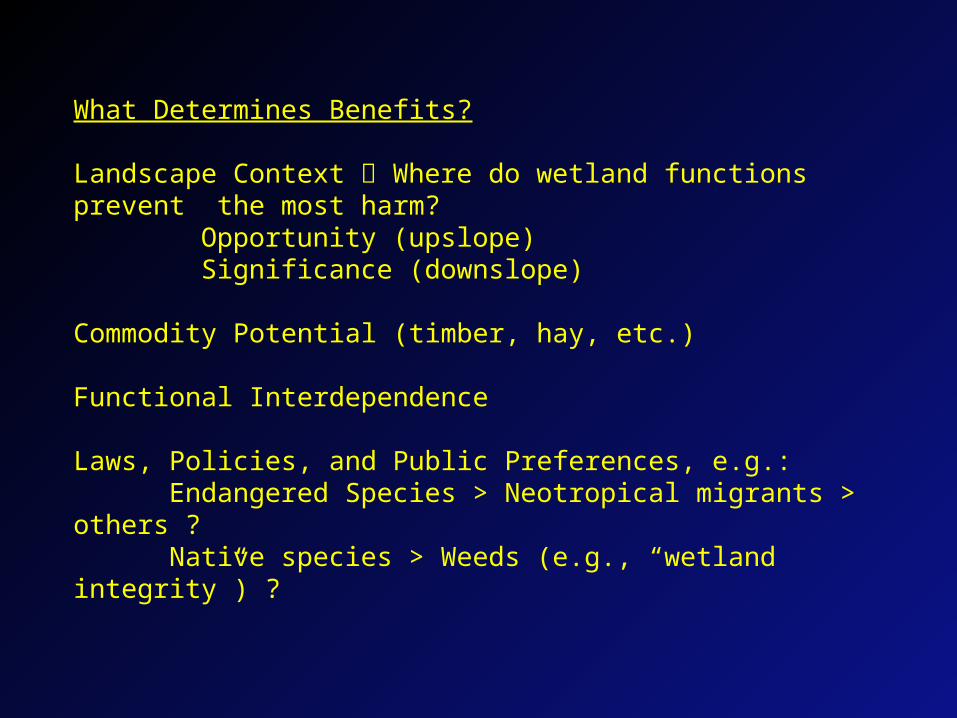
What Determines Benefits?
Landscape Context Where do wetland functions prevent the most harm? Opportunity (upslope) Significance (downslope)
Commodity Potential (timber, hay, etc.)
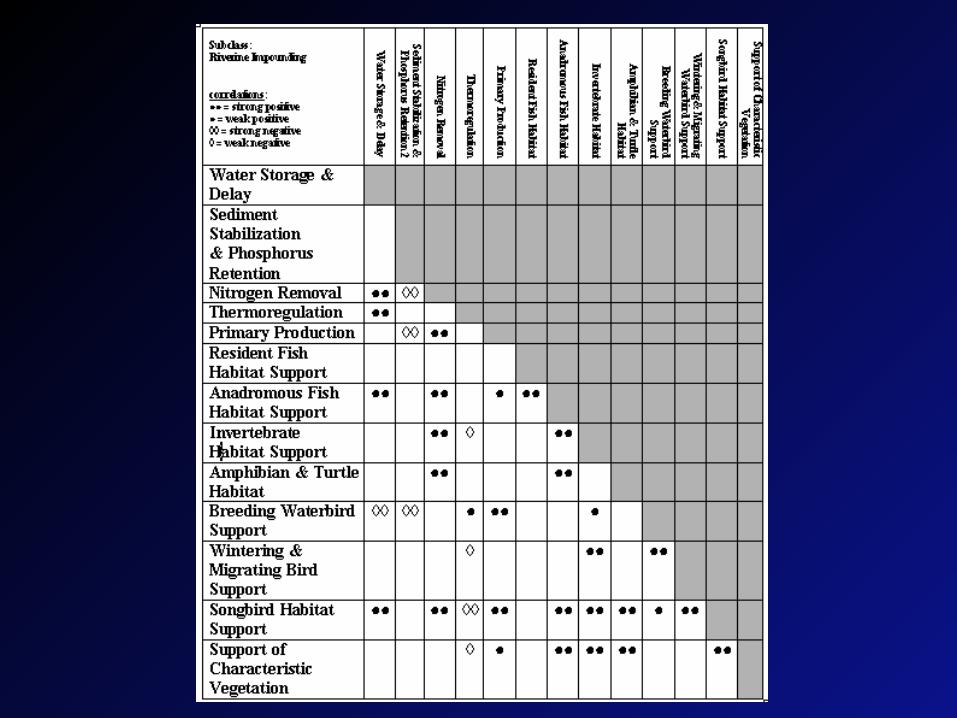
Functional Interdependence
Laws, Policies, and Public Preferences, e.g.: Endangered Species > Neotropical migrants > others ? Native species > Weeds (e.g., “wetland integrity”) ?
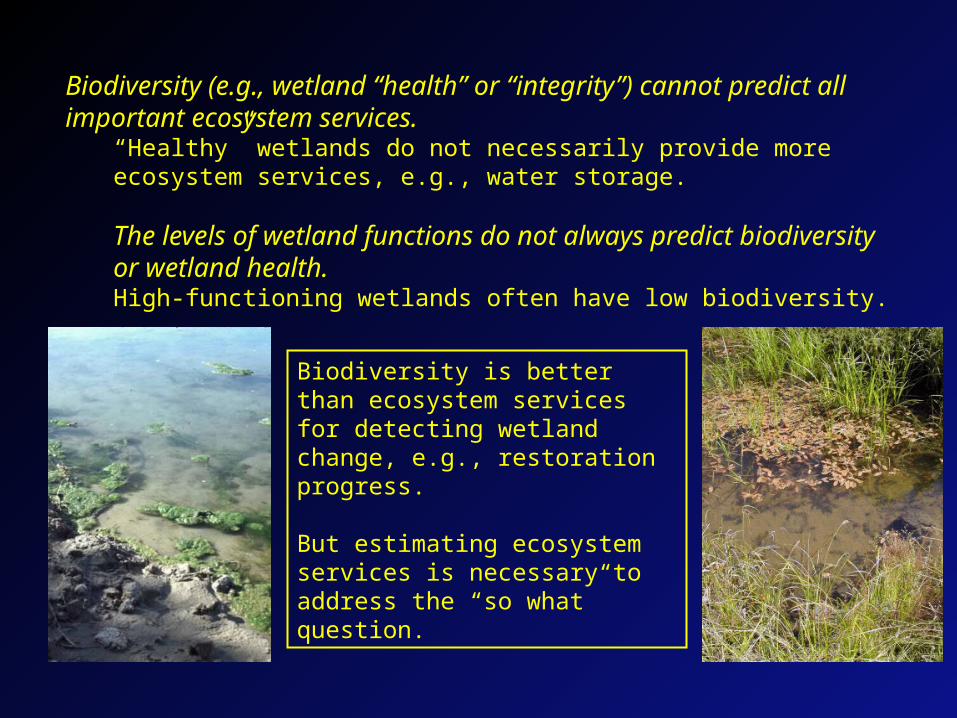
Biodiversity (e.g., wetland “health” or “integrity”) cannot predict all important ecosystem services.
“Healthy” wetlands do not necessarily provide more ecosystem services, e.g., water storage.
The levels of wetland functions do not always predict biodiversity or wetland health.High-functioning wetlands often have low biodiversity.
Biodiversity is better than ecosystem services for detecting wetland change, e.g., restoration progress.
But estimating ecosystem services is necessary to address the “so what” question.
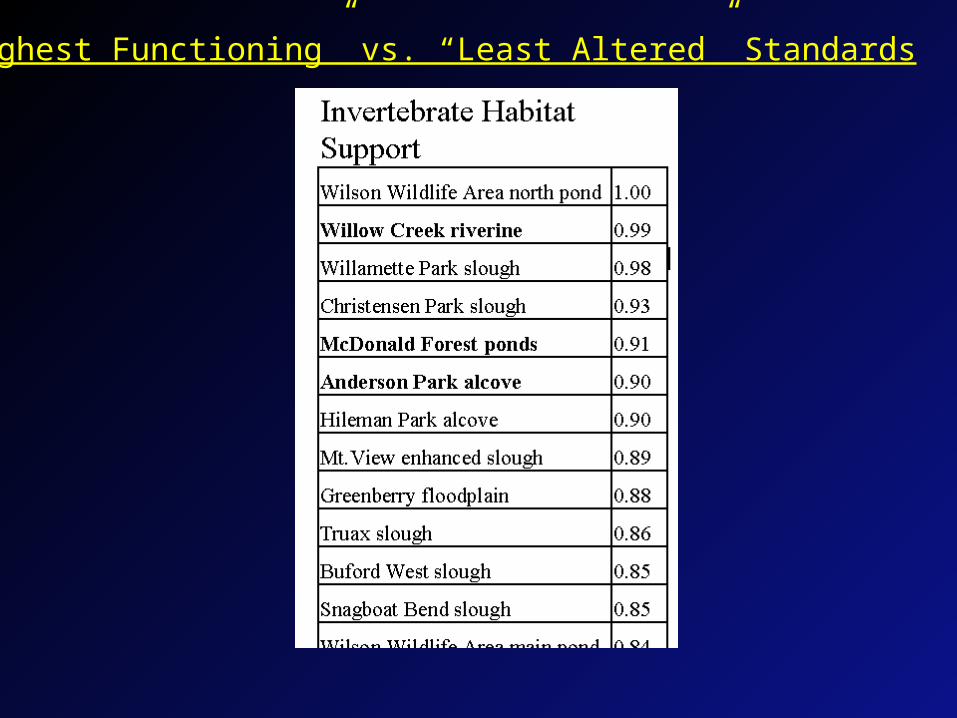
“Highest Functioning” vs. “Least Altered” Standards
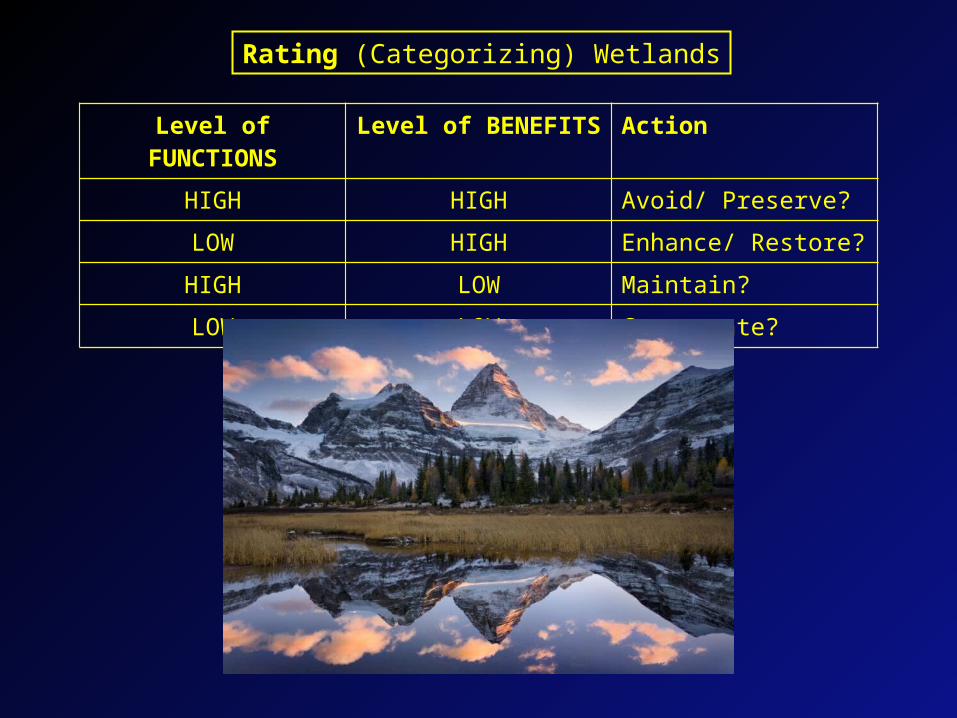
Level of FUNCTIONS Level of BENEFITS ActionHIGH HIGH Avoid/ Preserve?
LOW HIGH Enhance/ Restore?
HIGH LOW Maintain?
LOW LOW Compensate?
Rating (Categorizing) Wetlands
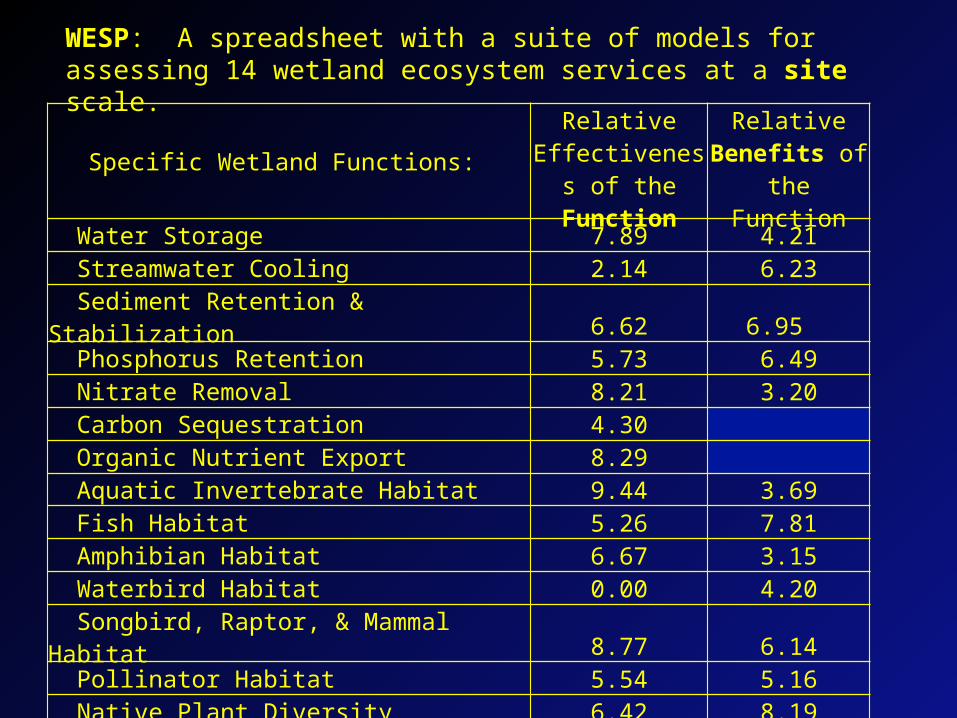
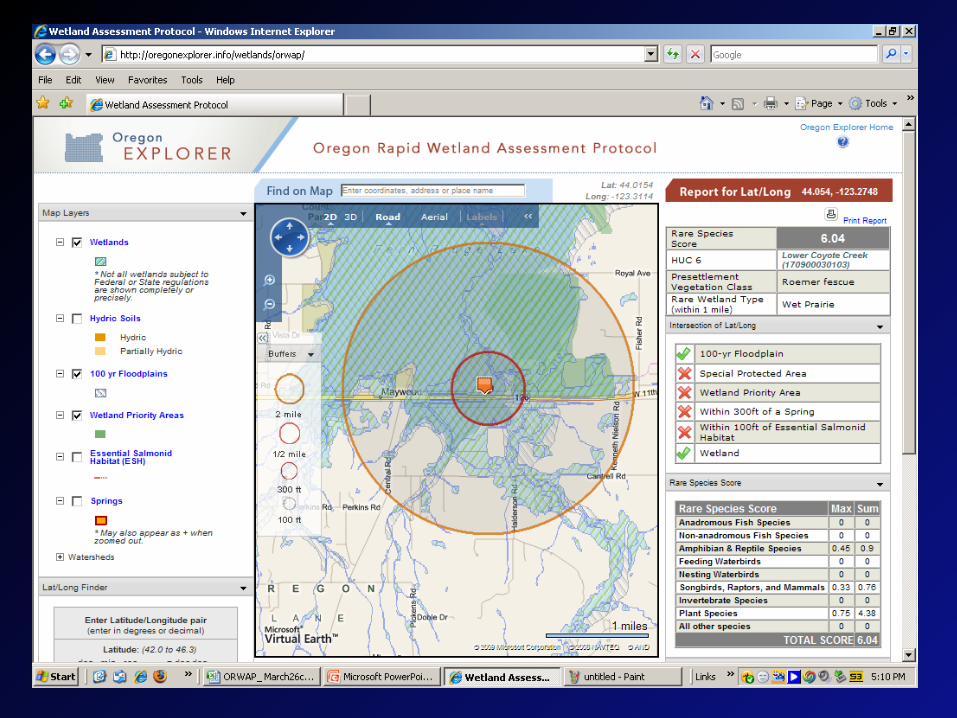
WESP: A spreadsheet with a suite of models for assessing 14 wetland ecosystem services at a site scale.
Specific Wetland Functions: Relative
Effectiveness of the Function
Relative Benefits of the
Function Water Storage 7.89 4.21 Streamwater Cooling 2.14 6.23 Sediment Retention & Stabilization 6.62 6.95 Phosphorus Retention 5.73 6.49 Nitrate Removal 8.21 3.20 Carbon Sequestration 4.30 Organic Nutrient Export 8.29 Aquatic Invertebrate Habitat 9.44 3.69 Fish Habitat 5.26 7.81 Amphibian Habitat 6.67 3.15 Waterbird Habitat 0.00 4.20 Songbird, Raptor, & Mammal Habitat 8.77 6.14 Pollinator Habitat 5.54 5.16 Native Plant Diversity 6.42 8.19 Public Use & Recognition 6.67
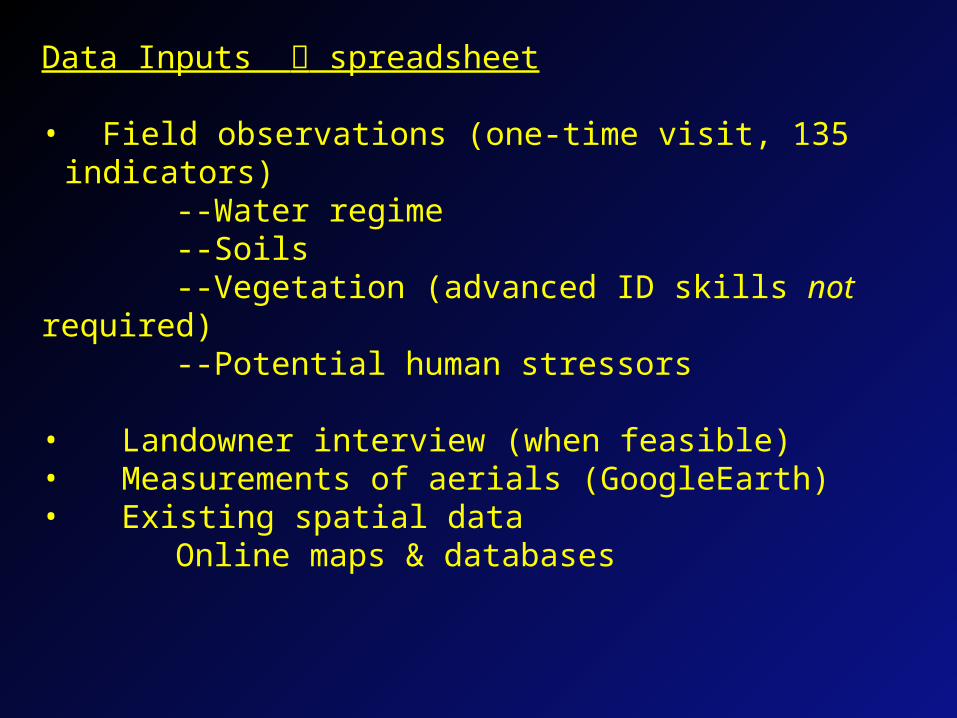
Data Inputs spreadsheet
• Field observations (one-time visit, 135 indicators) --Water regime --Soils --Vegetation (advanced ID skills not required) --Potential human stressors
• Landowner interview (when feasible)• Measurements of aerials (GoogleEarth)• Existing spatial data Online maps & databases
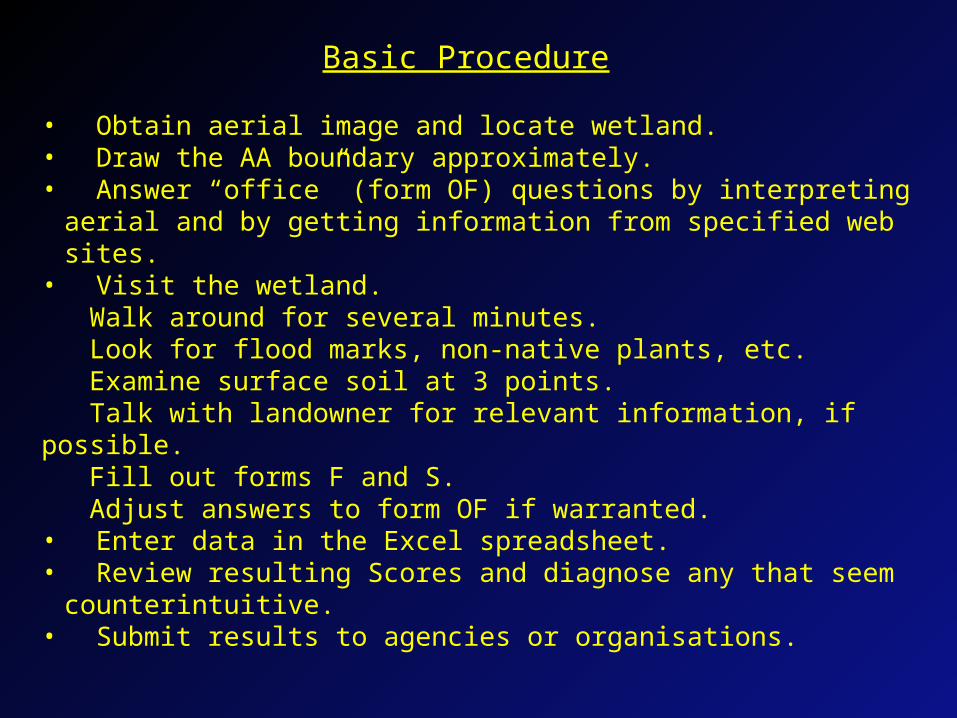
Basic Procedure
• Obtain aerial image and locate wetland.• Draw the AA boundary approximately.• Answer “office” (form OF) questions by interpreting aerial and
by getting information from specified web sites.• Visit the wetland.
Walk around for several minutes.Look for flood marks, non-native plants, etc.Examine surface soil at 3 points.Talk with landowner for relevant information, if possible.Fill out forms F and S.Adjust answers to form OF if warranted.
• Enter data in the Excel spreadsheet.• Review resulting Scores and diagnose any that seem
counterintuitive.• Submit results to agencies or organisations.
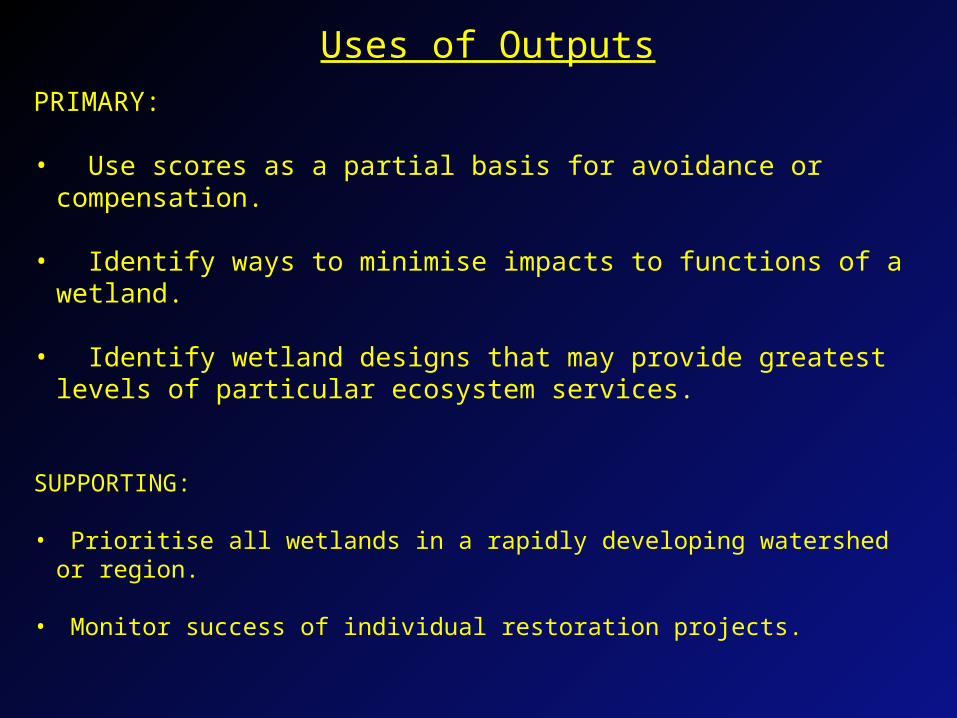
Uses of OutputsPRIMARY:
• Use scores as a partial basis for avoidance or compensation.
• Identify ways to minimise impacts to functions of a wetland.
• Identify wetland designs that may provide greatest levels of particular ecosystem services.
SUPPORTING:
• Prioritise all wetlands in a rapidly developing watershed or region.
• Monitor success of individual restoration projects.
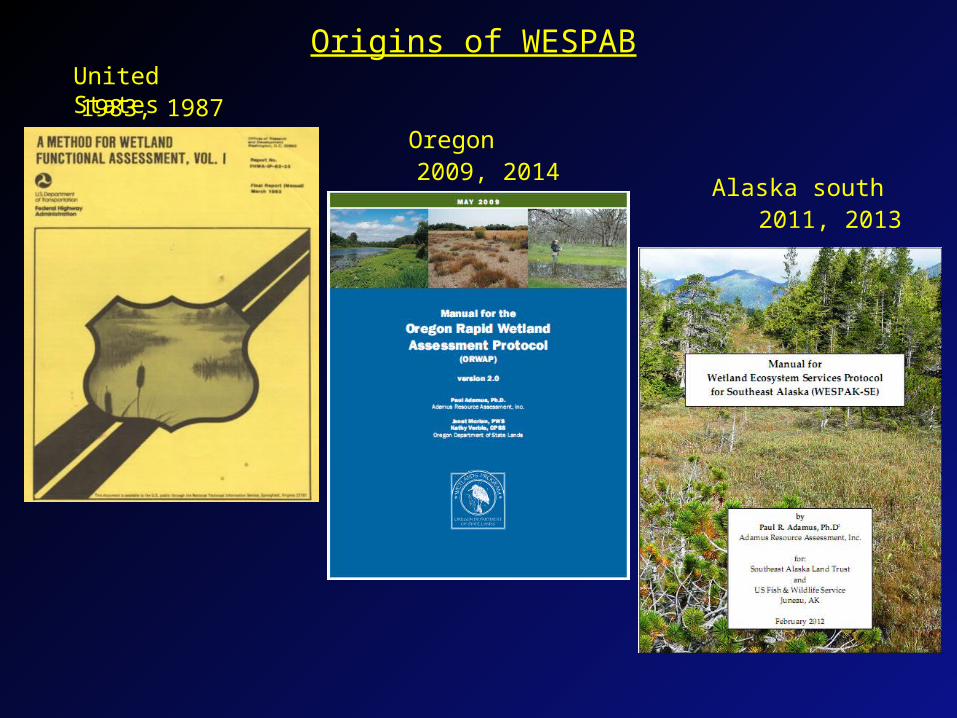
2009, 2014
2011, 2013
Oregon
Alaska south
United States1983, 1987
Origins of WESPAB
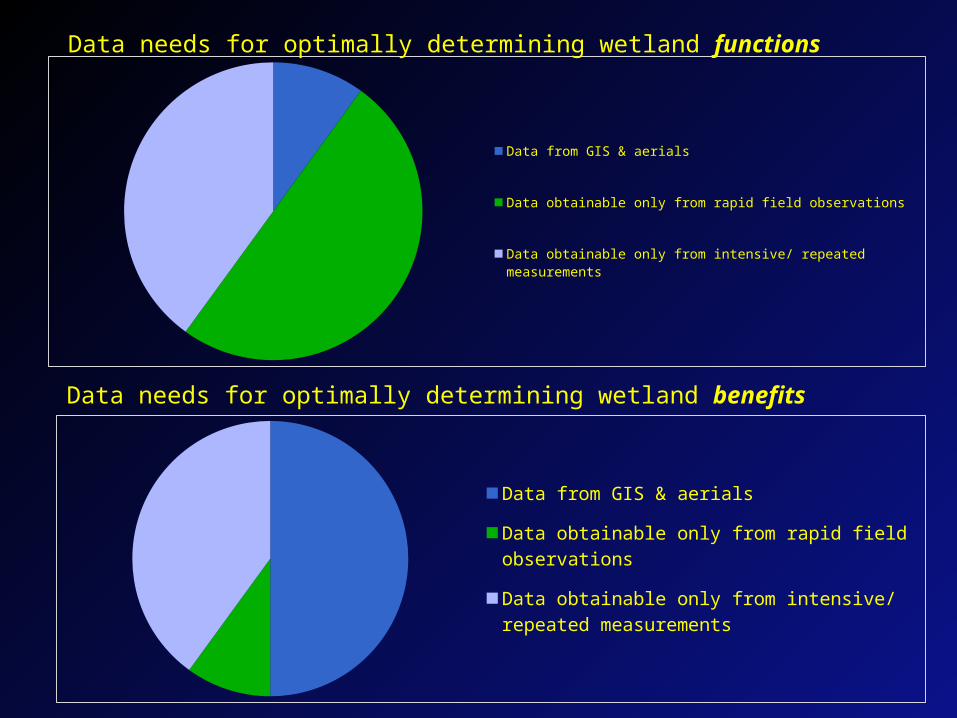
Data from GIS & aerials
Data obtainable only from rapid field observations
Data obtainable only from intensive/ repeated measurements
Data needs for optimally determining wetland functions
Data needs for optimally determining wetland benefits
Data from GIS & aerials
Data obtainable only from rapid field observations
Data obtainable only from intensive/ repeated measurements
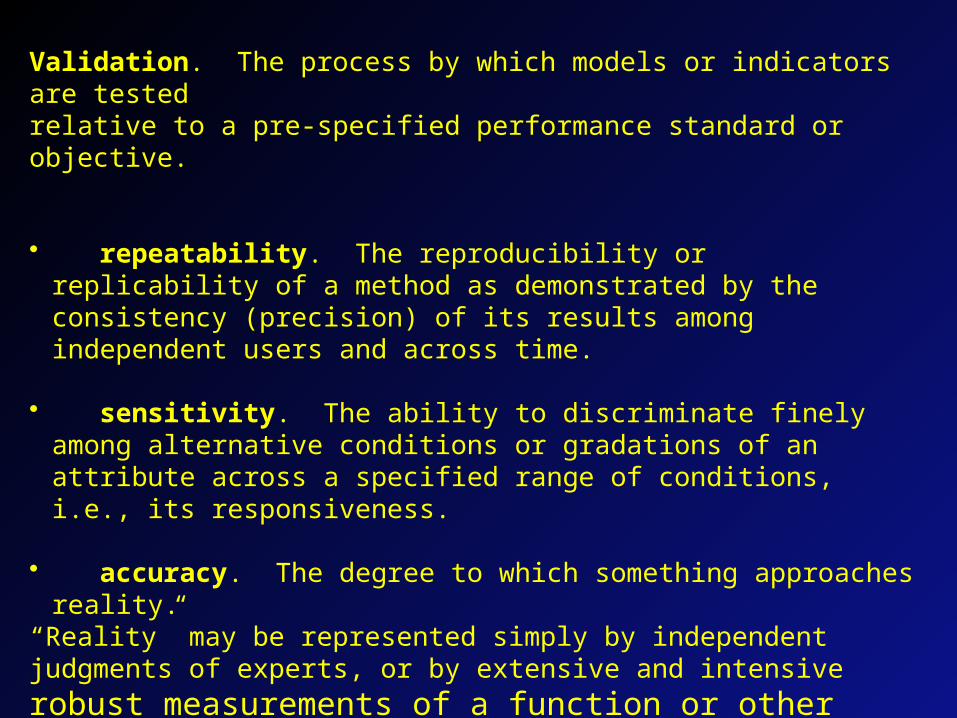
Validation. The process by which models or indicators are tested relative to a pre-specified performance standard or objective.
• repeatability. The reproducibility or replicability of a method as demonstrated by the consistency (precision) of its results among independent users and across time.
• sensitivity. The ability to discriminate finely among alternative conditions or gradations of an attribute across a specified range of conditions, i.e., its responsiveness.
• accuracy. The degree to which something approaches reality.
“Reality” may be represented simply by independent judgments of experts, or by extensive and intensive robust measurements of a function or other attribute.
[Tour of the WESP Calculator Spreadsheet]
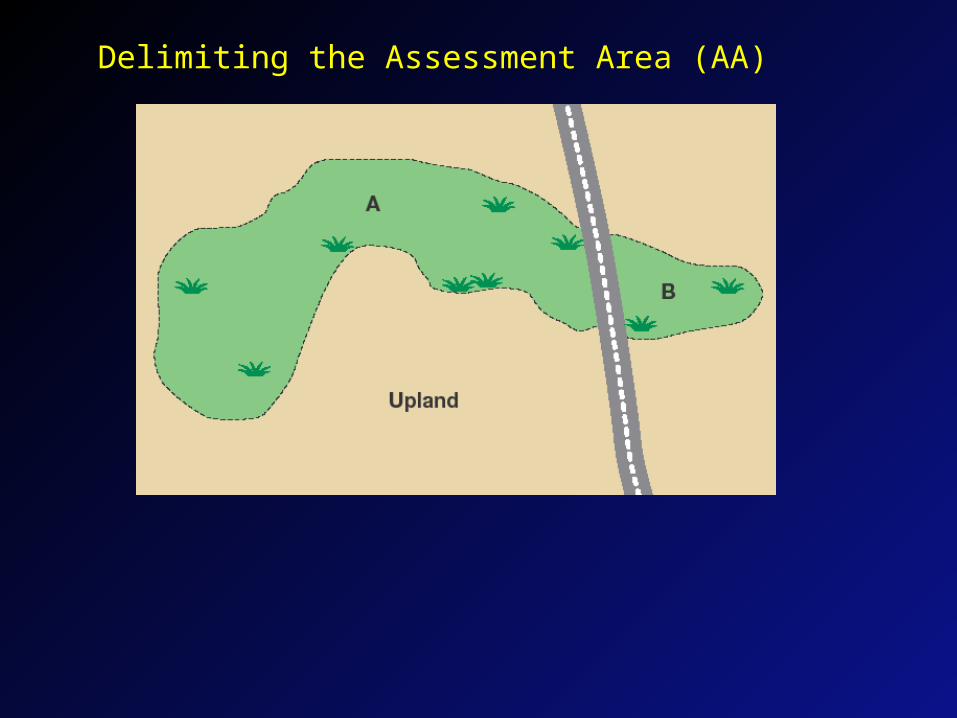
Delimiting the Assessment Area (AA)
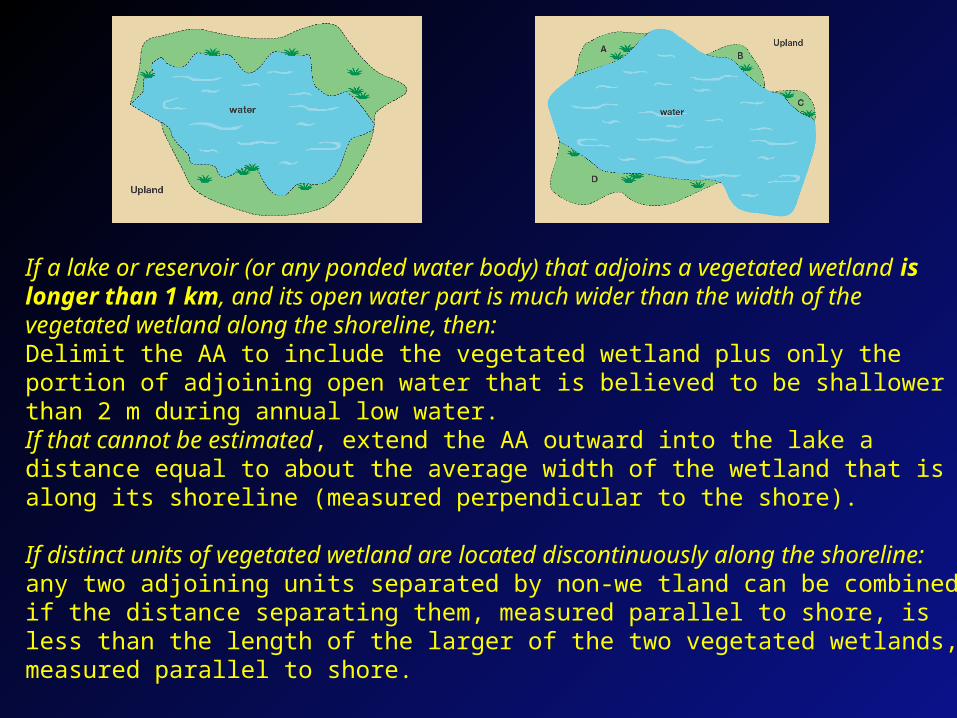
If a lake or reservoir (or any ponded water body) that adjoins a vegetated wetland is longer than 1 km, and its open water part is much wider than the width of the vegetated wetland along the shoreline, then:Delimit the AA to include the vegetated wetland plus only the portion of adjoining open water that is believed to be shallower than 2 m during annual low water. If that cannot be estimated, extend the AA outward into the lake a distance equal to about the average width of the wetland that is along its shoreline (measured perpendicular to the shore). If distinct units of vegetated wetland are located discontinuously along the shoreline: any two adjoining units separated by non-we tland can be combined if the distance separating them, measured parallel to shore, is less than the length of the larger of the two vegetated wetlands, measured parallel to shore.
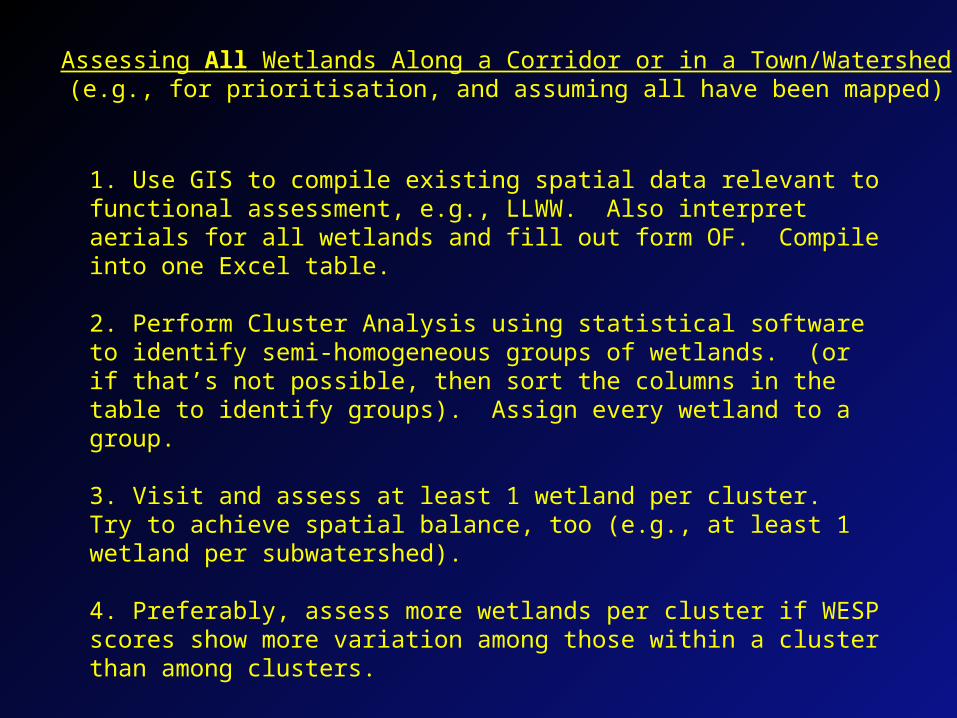
Assessing All Wetlands Along a Corridor or in a Town/Watershed(e.g., for prioritisation, and assuming all have been mapped)
1. Use GIS to compile existing spatial data relevant to functional assessment, e.g., LLWW. Also interpret aerials for all wetlands and fill out form OF. Compile into one Excel table.
2. Perform Cluster Analysis using statistical software to identify semi-homogeneous groups of wetlands. (or if that’s not possible, then sort the columns in the table to identify groups). Assign every wetland to a group.
3. Visit and assess at least 1 wetland per cluster. Try to achieve spatial balance, too (e.g., at least 1 wetland per subwatershed).
4. Preferably, assess more wetlands per cluster if WESP scores show more variation among those within a cluster than among clusters.
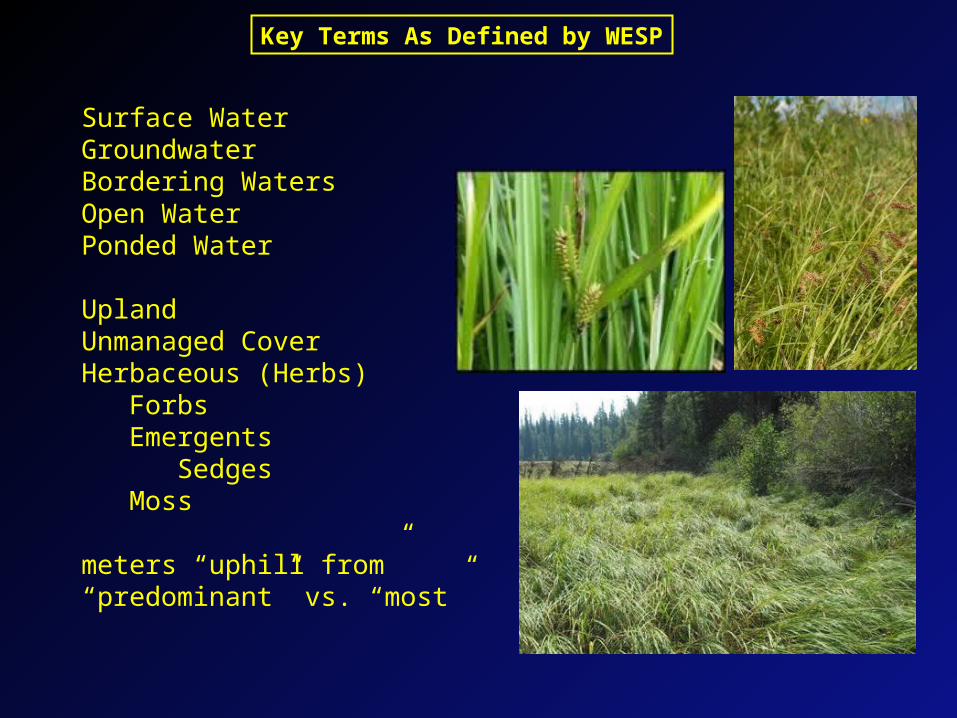
Key Terms As Defined by WESP
Surface WaterGroundwaterBordering WatersOpen WaterPonded Water
Upland Unmanaged CoverHerbaceous (Herbs)
ForbsEmergents
SedgesMoss
meters “uphill from”“predominant” vs. “most”
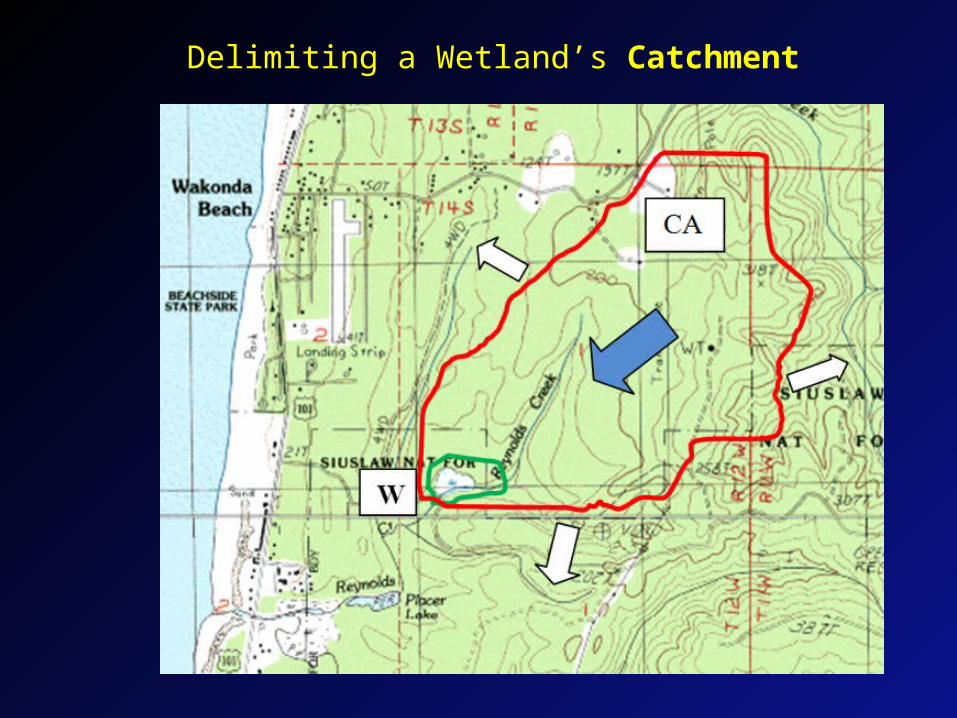
Delimiting a Wetland’s Catchment
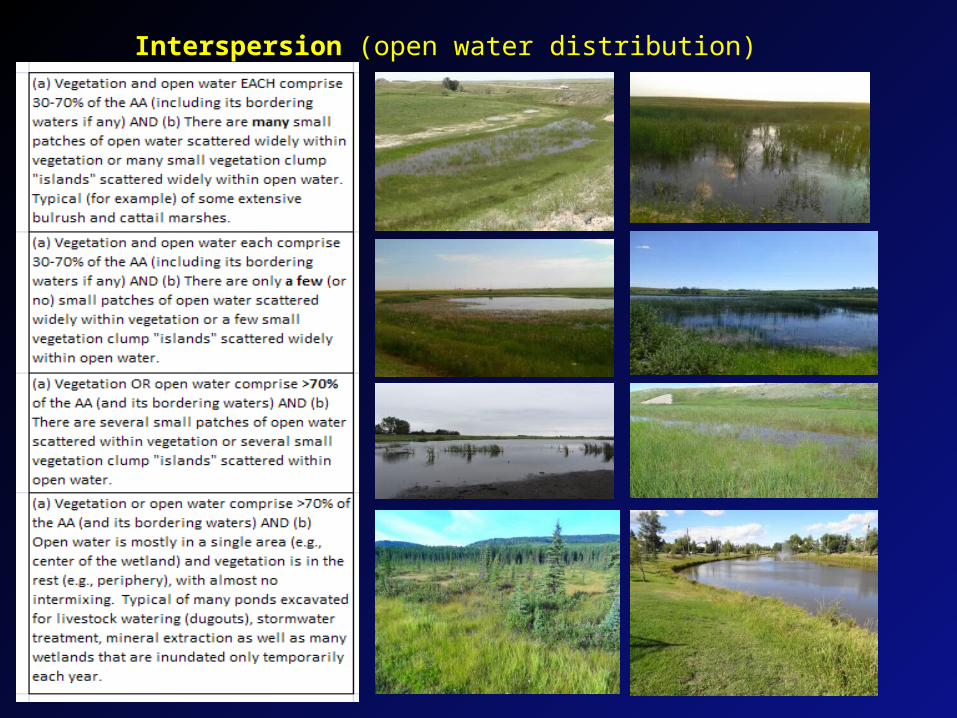
Interspersion (open water distribution)
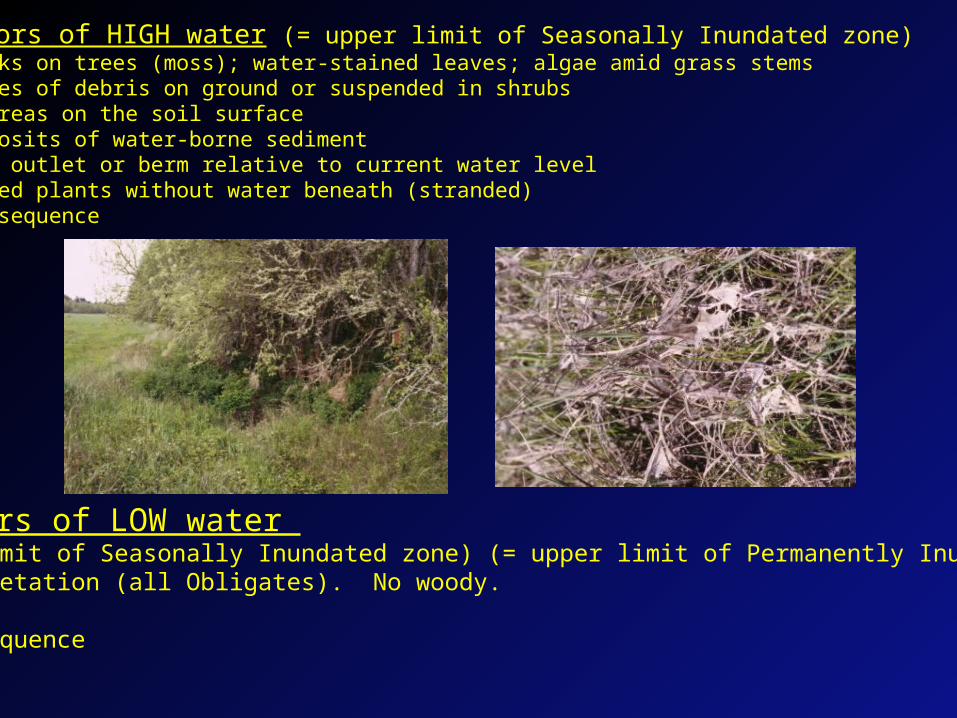
Indicators of HIGH water (= upper limit of Seasonally Inundated zone)Water marks on trees (moss); water-stained leaves; algae amid grass stemsDrift lines of debris on ground or suspended in shrubs Scoured areas on the soil surfaceFresh deposits of water-borne sedimentHeight of outlet or berm relative to current water levelAquatic bed plants without water beneath (stranded)Airphoto sequence
Indicators of LOW water (= lower limit of Seasonally Inundated zone) (= upper limit of Permanently Inundated zone)Minimal vegetation (all Obligates). No woody.TopographyAirphoto sequence
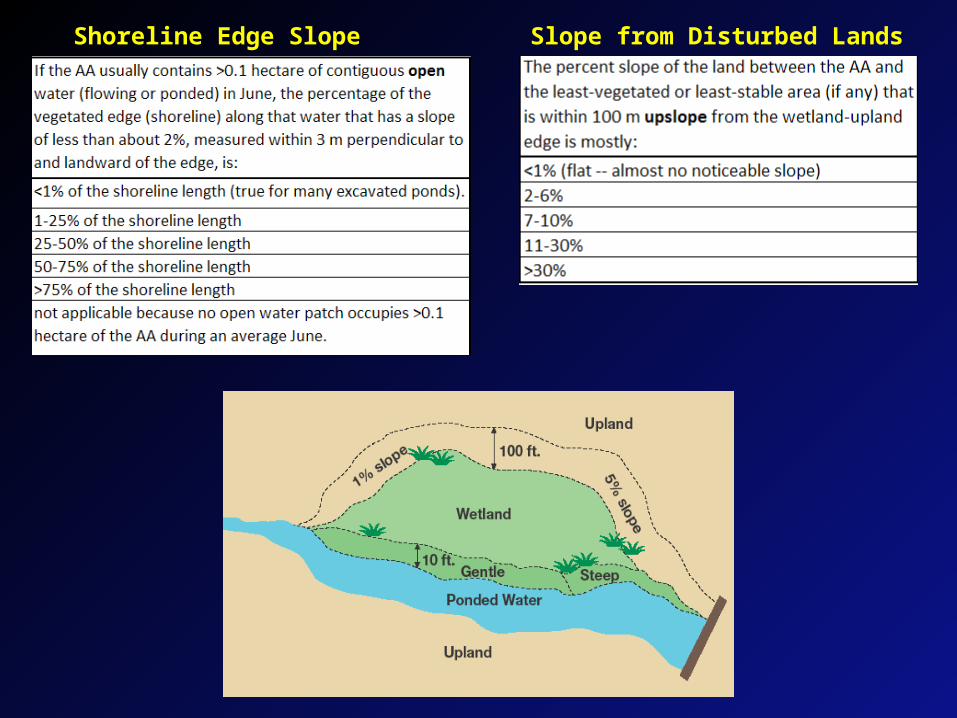
Shoreline Edge Slope Slope from Disturbed Lands
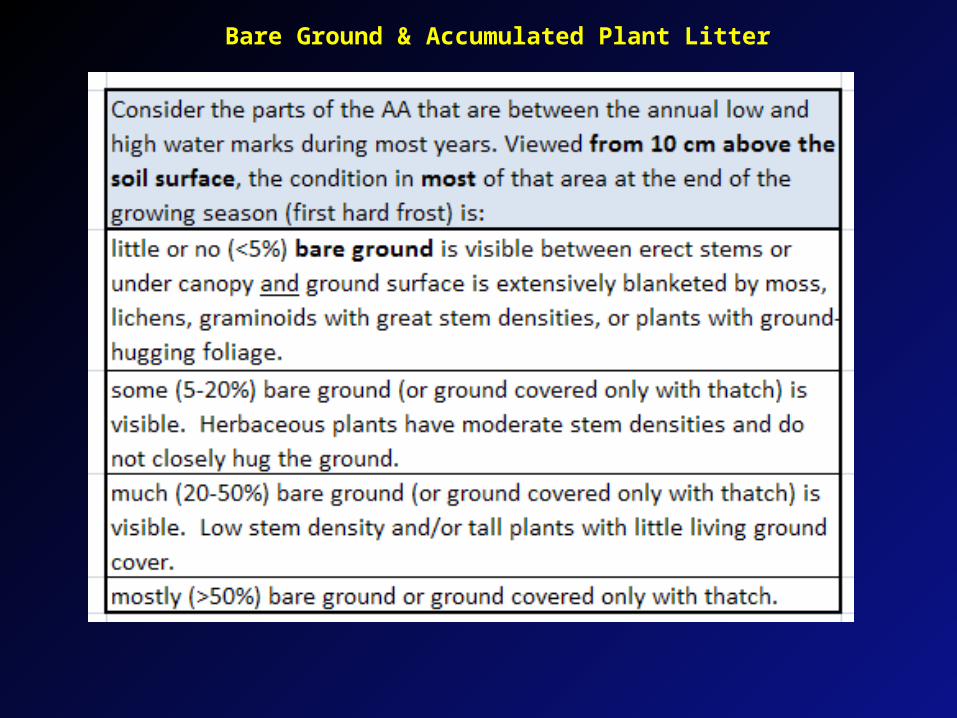
Bare Ground & Accumulated Plant Litter
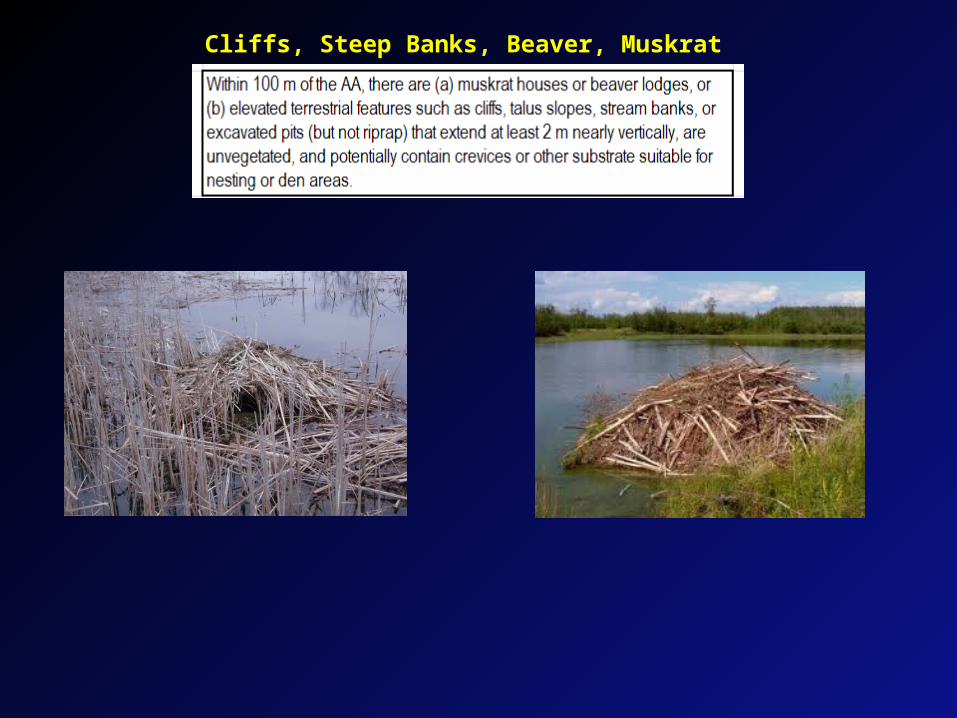
Cliffs, Steep Banks, Beaver, Muskrat
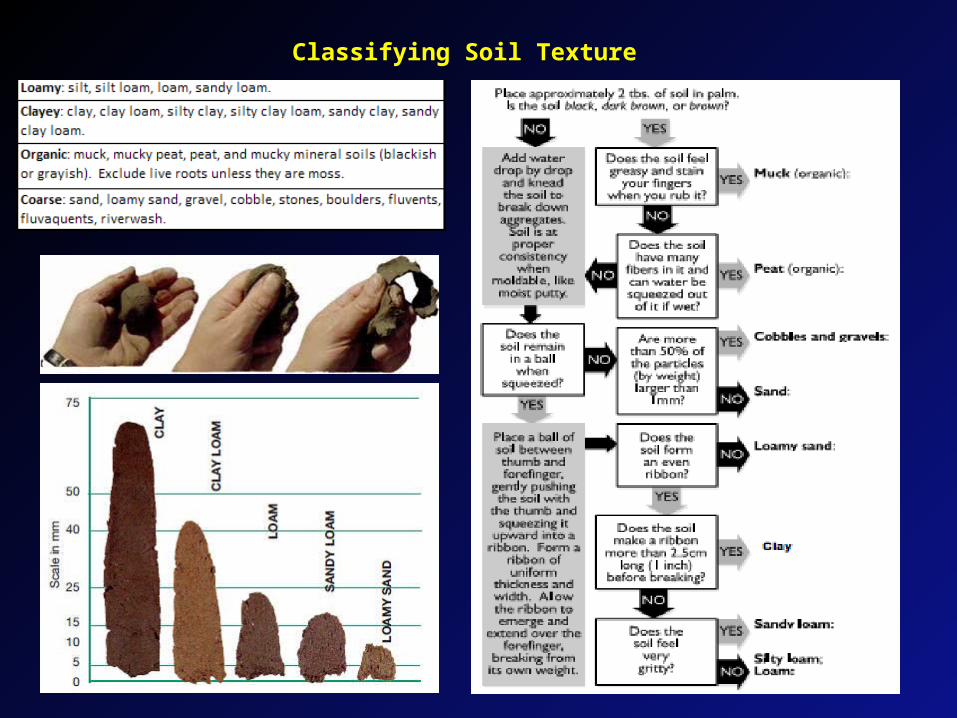
Classifying Soil Texture
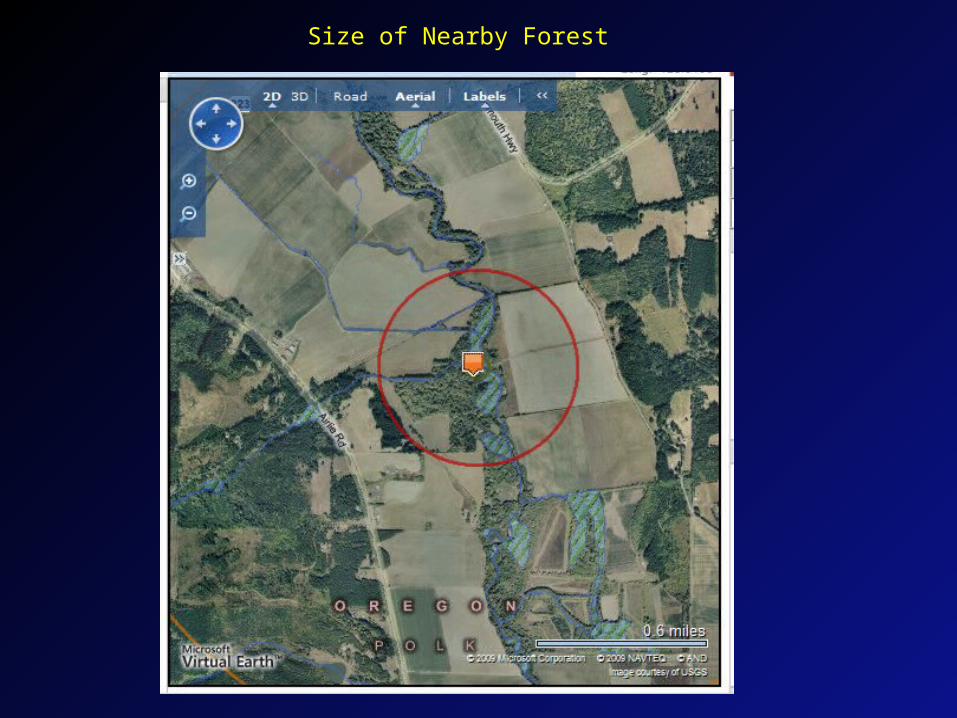
Size of Nearby Forest
[WESPAB Appendix A – other illustrations]
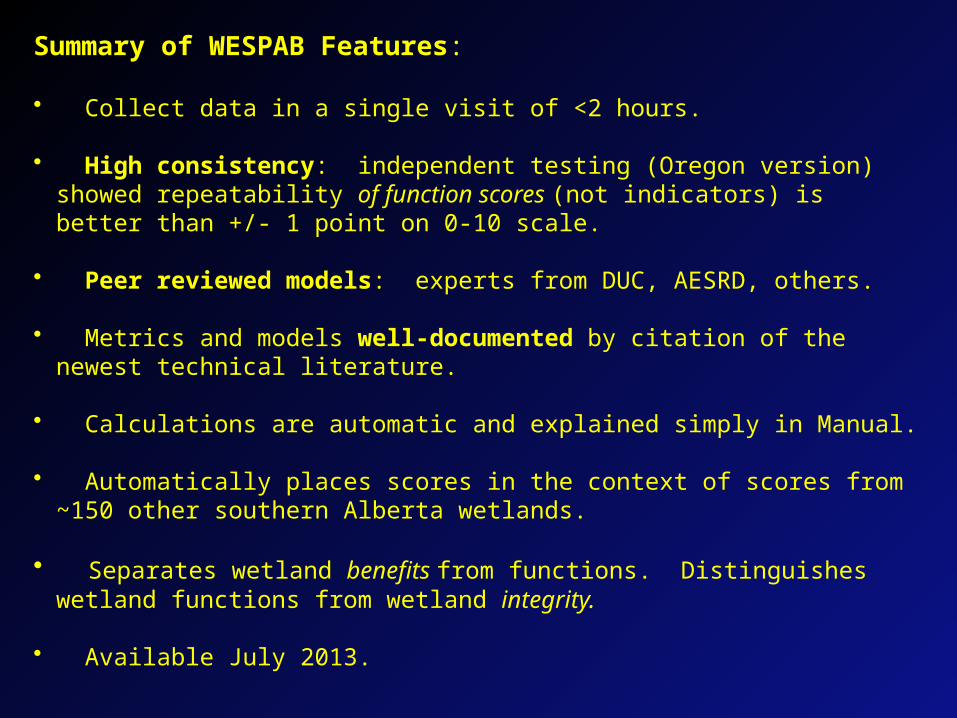
Summary of WESPAB Features:
• Collect data in a single visit of <2 hours.
• High consistency: independent testing (Oregon version) showed repeatability of function scores (not indicators) is better than +/- 1 point on 0-10 scale.
• Peer reviewed models: experts from DUC, AESRD, others.
• Metrics and models well-documented by citation of the newest technical literature.
• Calculations are automatic and explained simply in Manual.
• Automatically places scores in the context of scores from ~150 other southern Alberta wetlands.
• Separates wetland benefits from functions. Distinguishes wetland functions from wetland integrity.
• Available July 2013.
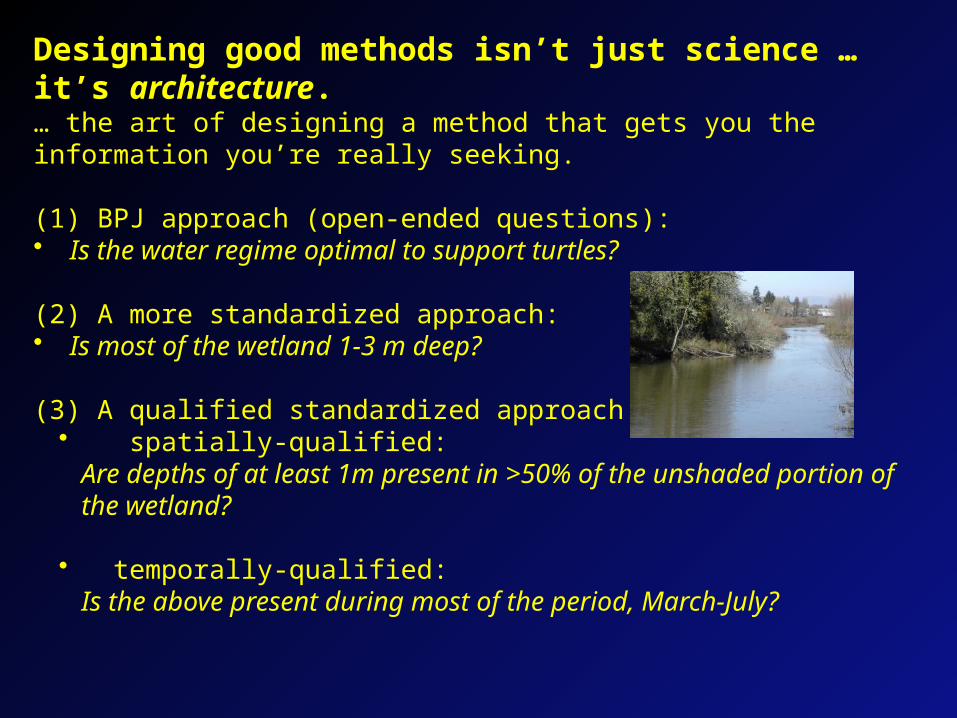
Designing good methods isn’t just science … it’s architecture.… the art of designing a method that gets you the information you’re really seeking.
(1) BPJ approach (open-ended questions):• Is the water regime optimal to support turtles?
(2) A more standardized approach:• Is most of the wetland 1-3 m deep?
(3) A qualified standardized approach:• spatially-qualified:
Are depths of at least 1m present in >50% of the unshaded portion of the wetland?
• temporally-qualified:Is the above present during most of the period, March-July?
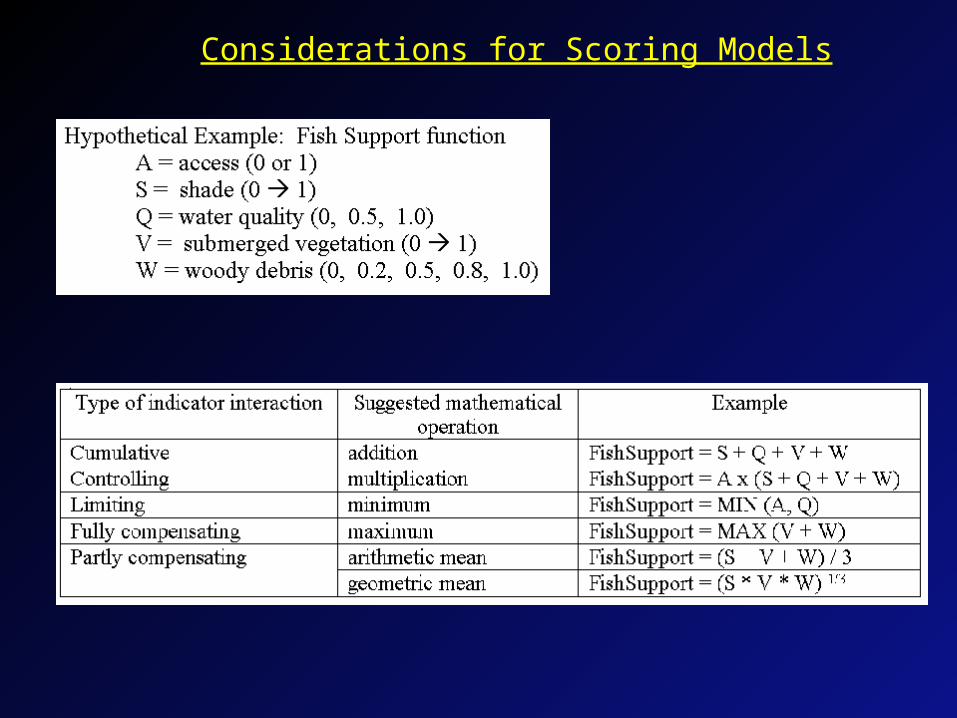
Considerations for Scoring Models
[Marine Nearshore Assessment Calculator]

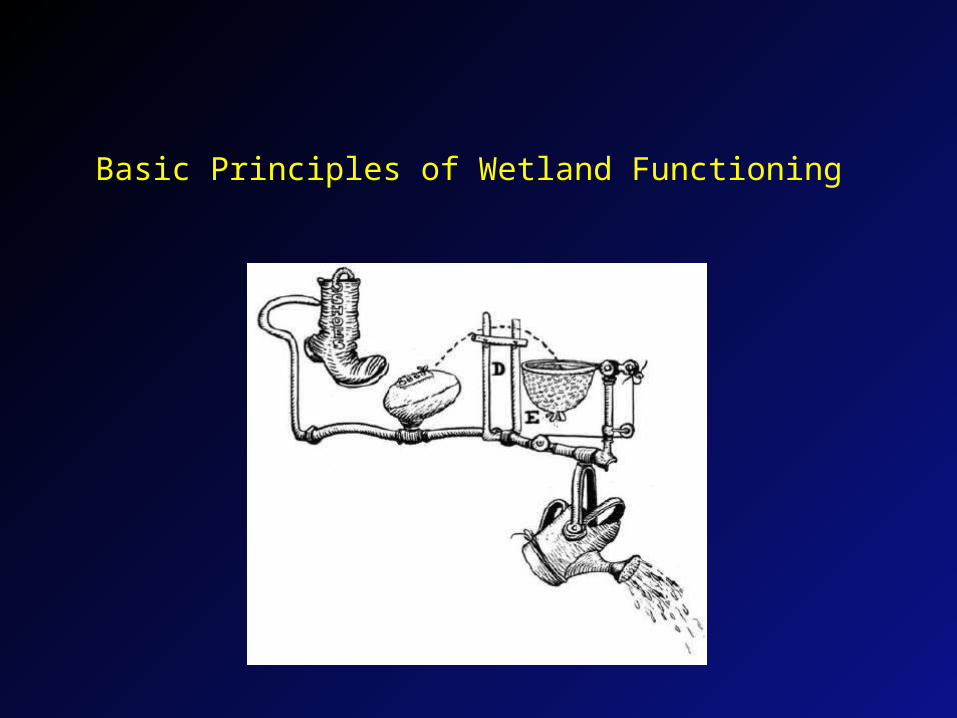
Basic Principles of Wetland Functioning
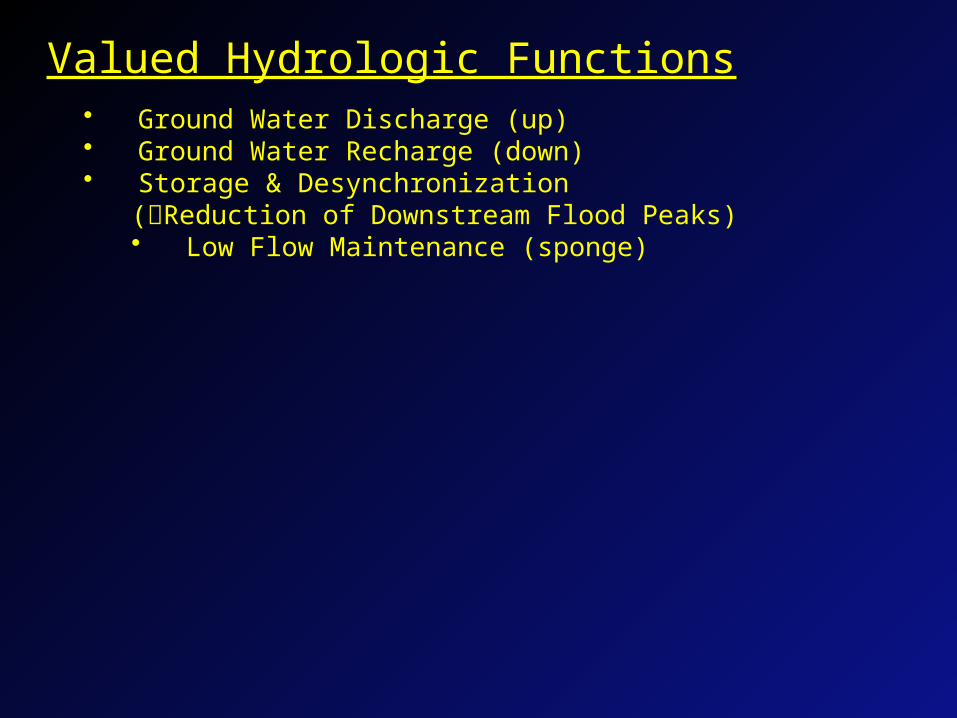
Valued Hydrologic Functions• Ground Water Discharge (up)• Ground Water Recharge (down)• Storage & Desynchronization
(Reduction of Downstream Flood Peaks)• Low Flow Maintenance (sponge)
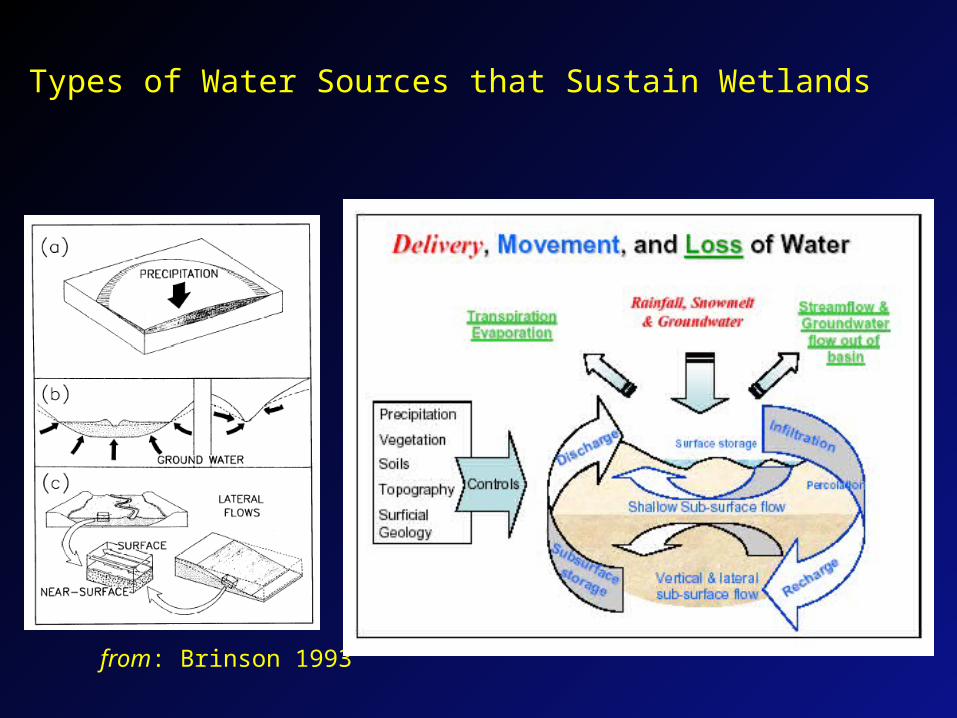
Types of Water Sources that Sustain Wetlands
from: Brinson 1993
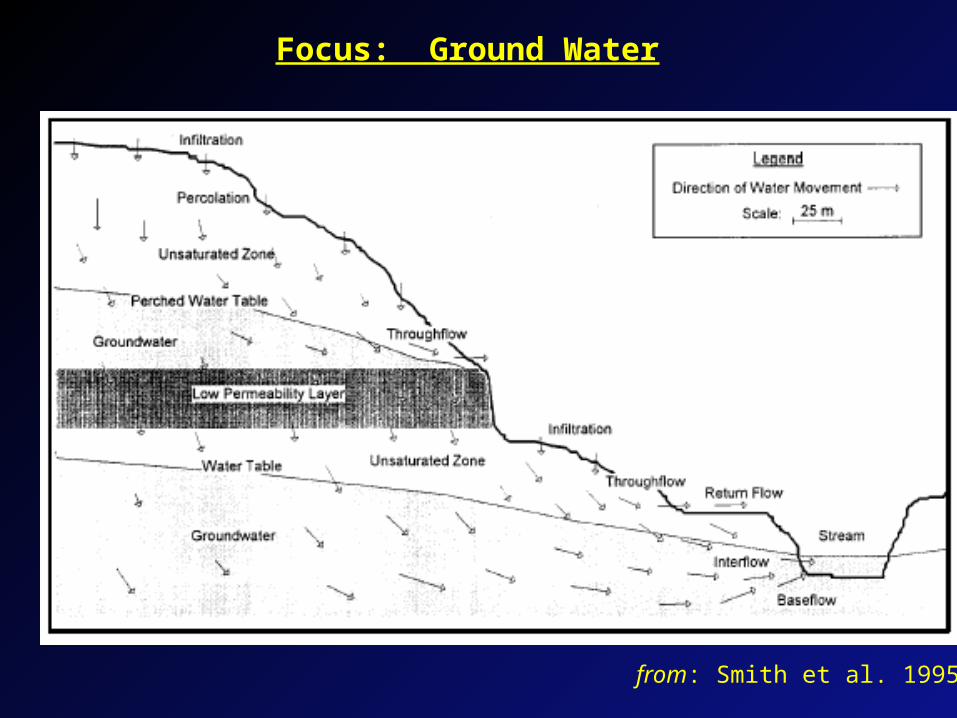
Focus: Ground Water
from: Smith et al. 1995
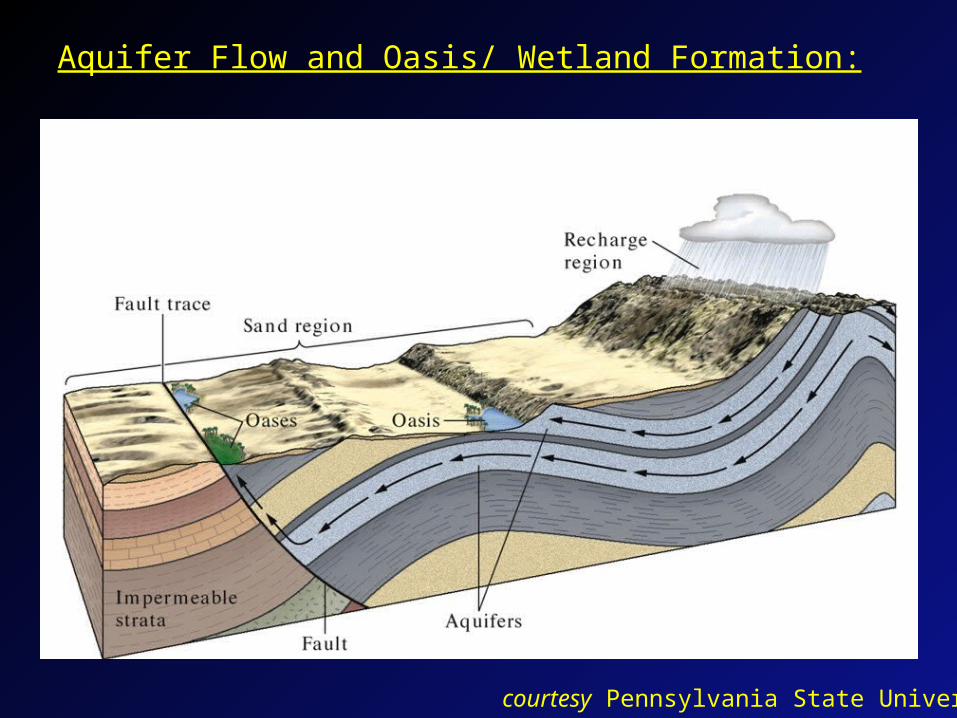
Aquifer Flow and Oasis/ Wetland Formation:
courtesy Pennsylvania State University
1
10
100
1000
10000
1 10
10
0
10
00
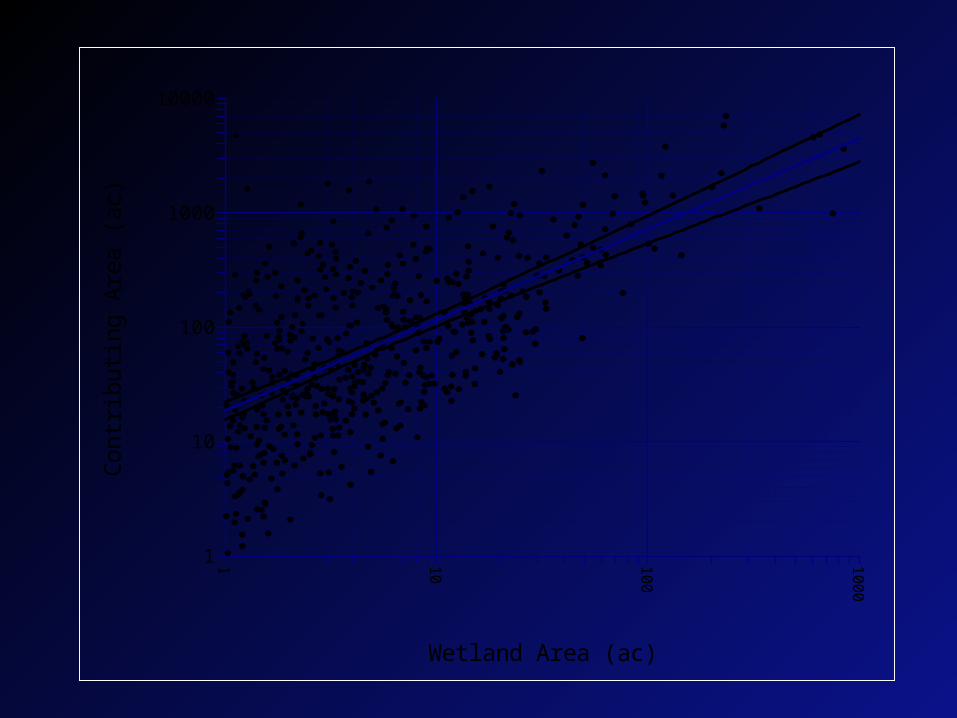
Wetland Area (ac)
Contr
ibutin
g A
rea (
ac)
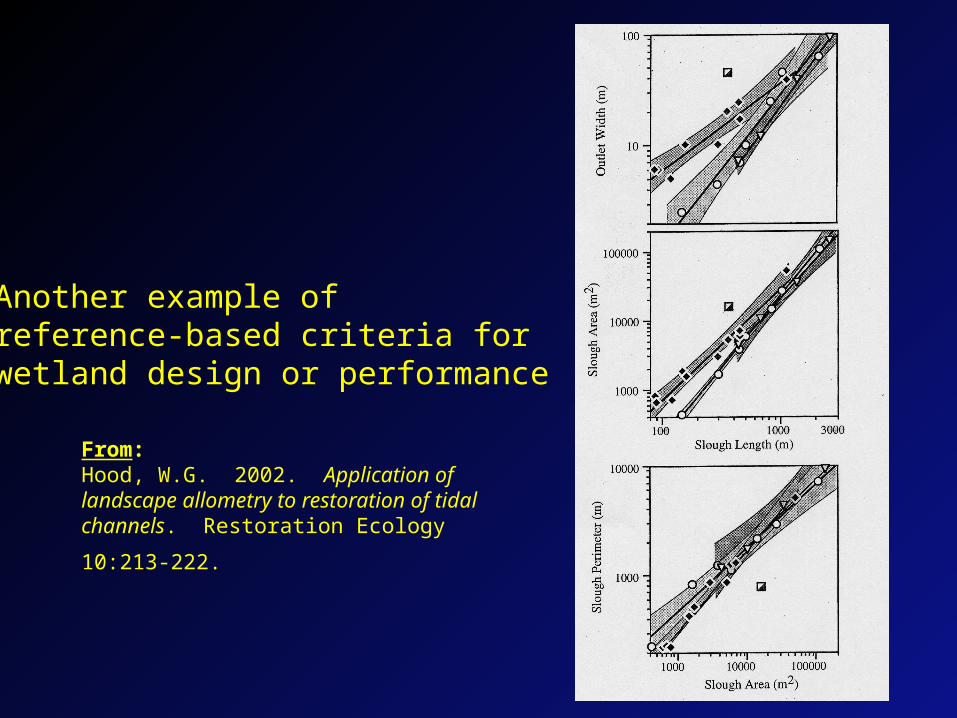
Another example of reference-based criteria forwetland design or performance
From: Hood, W.G. 2002. Application of landscape allometry to restoration of tidal channels. Restoration Ecology
10:213-222.
Valued Water Quality Functions
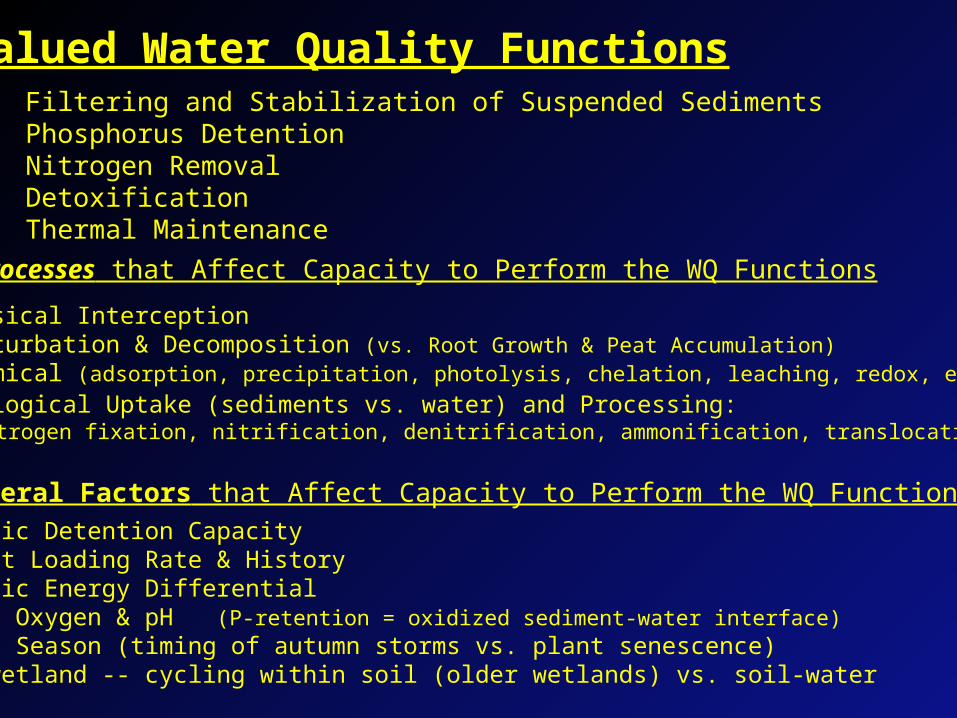
• Physical Interception• Bioturbation & Decomposition (vs. Root Growth & Peat Accumulation)• Chemical (adsorption, precipitation, photolysis, chelation, leaching, redox, etc.) • Biological Uptake (sediments vs. water) and Processing:
• nitrogen fixation, nitrification, denitrification, ammonification, translocation, etc.
Processes that Affect Capacity to Perform the WQ Functions
General Factors that Affect Capacity to Perform the WQ Functions
• Filtering and Stabilization of Suspended Sediments• Phosphorus Detention• Nitrogen Removal• Detoxification• Thermal Maintenance
• Hydrologic Detention Capacity• Pollutant Loading Rate & History• Hydrologic Energy Differential• Sediment Oxygen & pH (P-retention = oxidized sediment-water interface)• Climate/ Season (timing of autumn storms vs. plant senescence)• Age of wetland -- cycling within soil (older wetlands) vs. soil-water
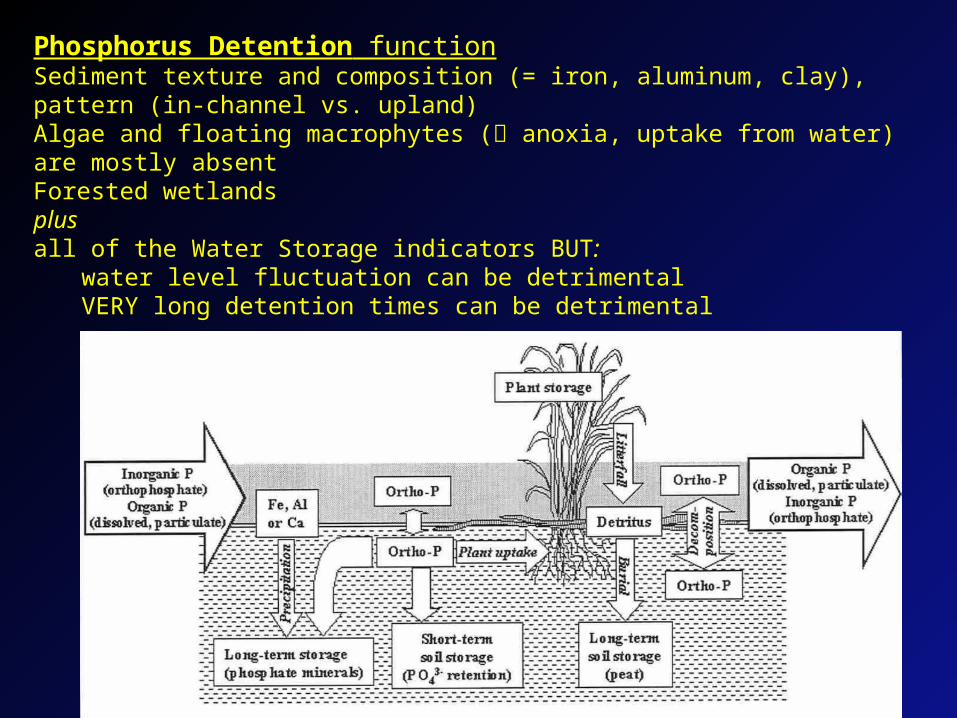
Phosphorus Detention functionSediment texture and composition (= iron, aluminum, clay), pattern (in-channel vs. upland)Algae and floating macrophytes ( anoxia, uptake from water) are mostly absentForested wetlandsplusall of the Water Storage indicators BUT:
water level fluctuation can be detrimentalVERY long detention times can be detrimental
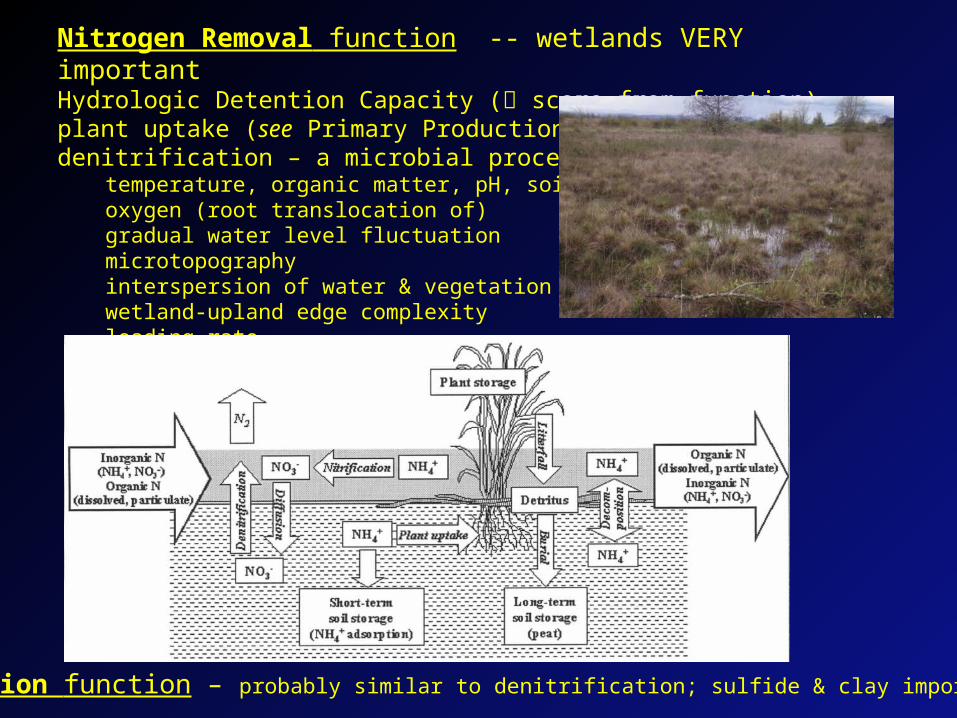
Nitrogen Removal function -- wetlands VERY importantHydrologic Detention Capacity ( score from function)plant uptake (see Primary Production)denitrification – a microbial process
temperature, organic matter, pH, soil texture,oxygen (root translocation of)gradual water level fluctuationmicrotopographyinterspersion of water & vegetationwetland-upland edge complexityloading rate
Detoxification function – probably similar to denitrification; sulfide & clay important
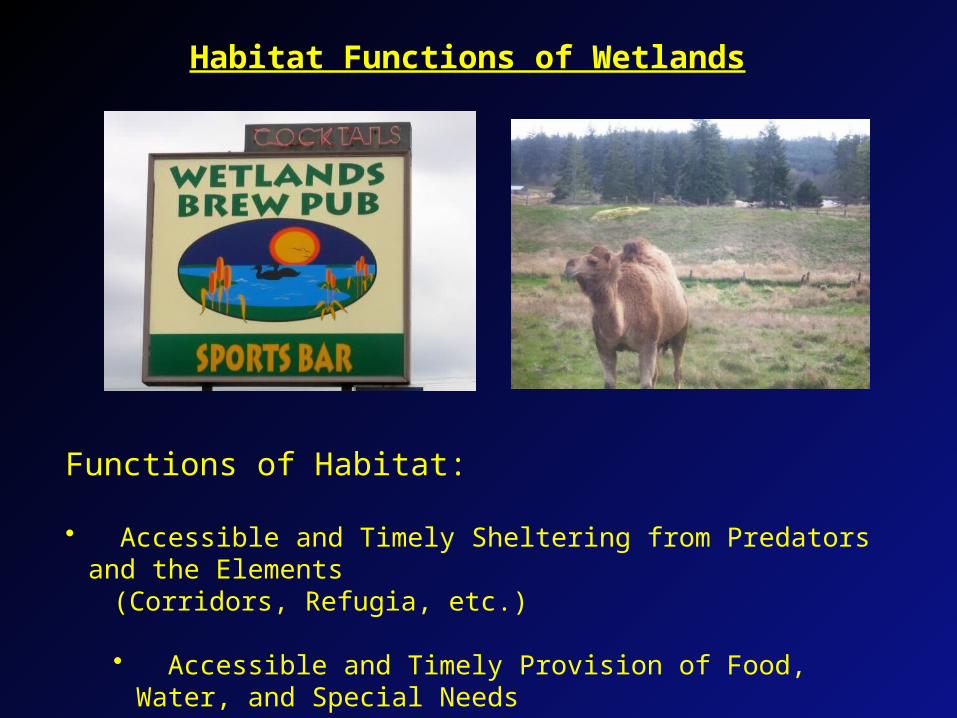
Functions of Habitat:
• Accessible and Timely Sheltering from Predators and the Elements
(Corridors, Refugia, etc.)
• Accessible and Timely Provision of Food, Water, and Special Needs
Habitat Functions of Wetlands
0
10
20
30
40
50
60
70
80
90
100
0 1 2 3 4 5 6 7 8 9 10
11 12
13
14
15
16
17
18
19
20
21
22
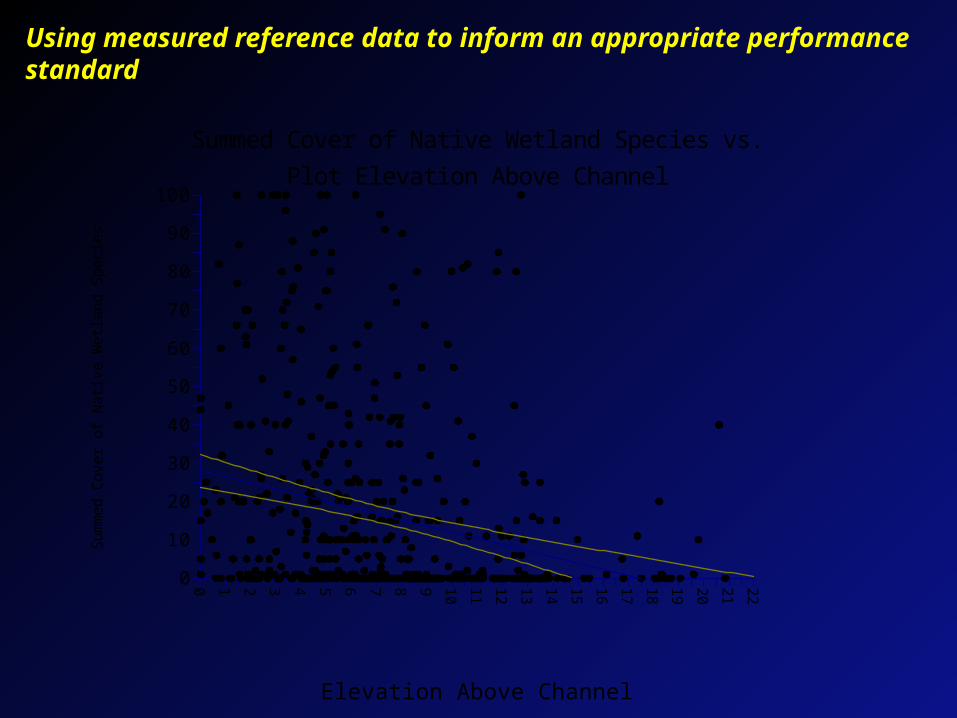
Summed Cover of Native Wetland Species vs.Plot Elevation Above Channel
Elevation Above Channel
Sum
me
d C
ove
r of N
ativ
e W
etla
nd S
pe
cie
s
Using measured reference data to inform an appropriate performance standard

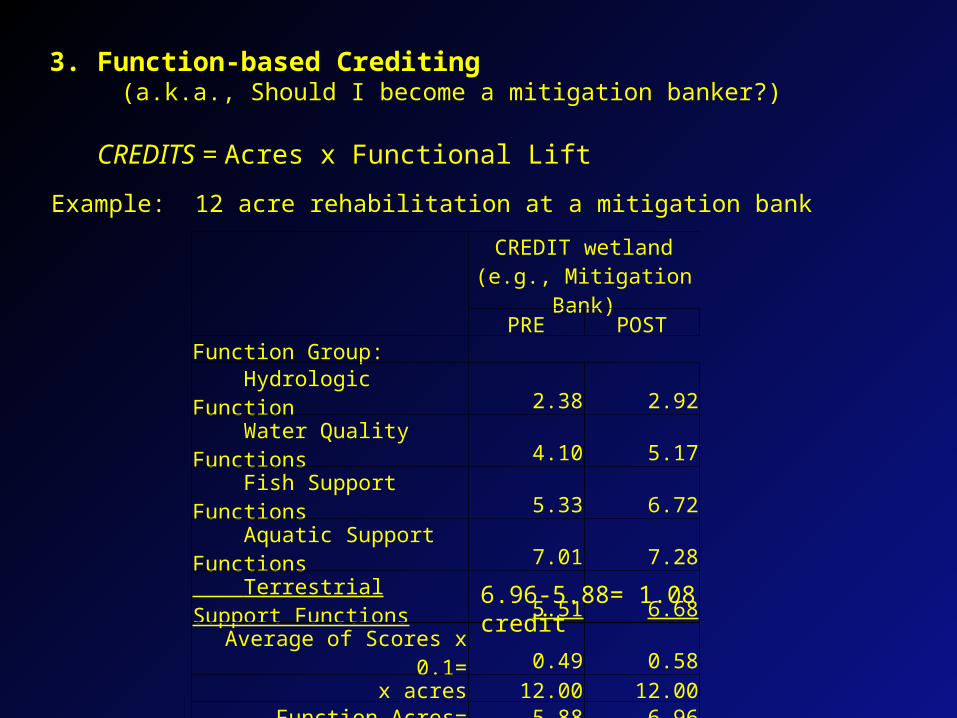
3. Function-based Crediting (a.k.a., Should I become a mitigation banker?)
CREDITS = Acres x Functional Lift
Example: 12 acre rehabilitation at a mitigation bank
CREDIT wetland (e.g., Mitigation Bank)PRE POST
Function Group: Hydrologic Function 2.38 2.92 Water Quality Functions 4.10 5.17 Fish Support Functions 5.33 6.72 Aquatic Support Functions 7.01 7.28 Terrestrial Support Functions 5.51 6.68
Average of Scores x 0.1= 0.49 0.58x acres 12.00 12.00
Function Acres= 5.88 6.96
6.96-5.88= 1.08 credit
Need for Caution:• A site that is poor habitat for (say) amphibians is poor habitat,
regardless of whether it is 0.1 acre or 100 acres. • Functions may be supported within only PART of a site.• Some functions are non-linearly related with area.• Small wetlands in critical locations may be functionally outstanding.
Multiply Scores by Acres?
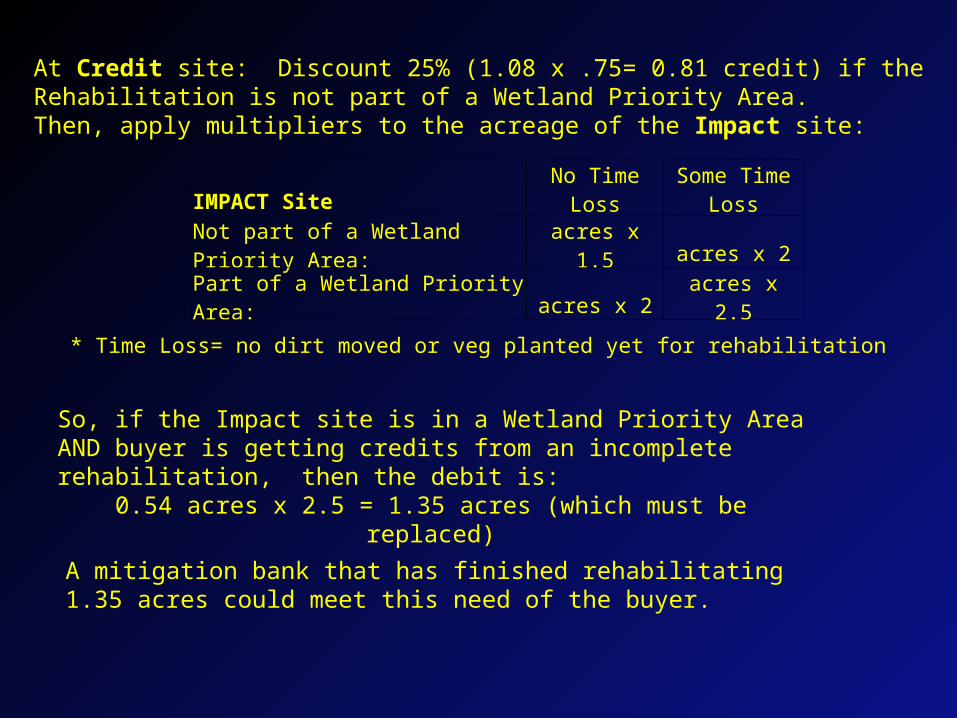
At Credit site: Discount 25% (1.08 x .75= 0.81 credit) if the Rehabilitation is not part of a Wetland Priority Area.Then, apply multipliers to the acreage of the Impact site:
IMPACT Site No Time LossSome Time
LossNot part of a Wetland Priority Area: acres x 1.5 acres x 2Part of a Wetland Priority Area: acres x 2 acres x 2.5
So, if the Impact site is in a Wetland Priority Area AND buyer is getting credits from an incomplete rehabilitation, then the debit is:
0.54 acres x 2.5 = 1.35 acres (which must be replaced)
A mitigation bank that has finished rehabilitating 1.35 acres could meet this need of the buyer.
* Time Loss= no dirt moved or veg planted yet for rehabilitation
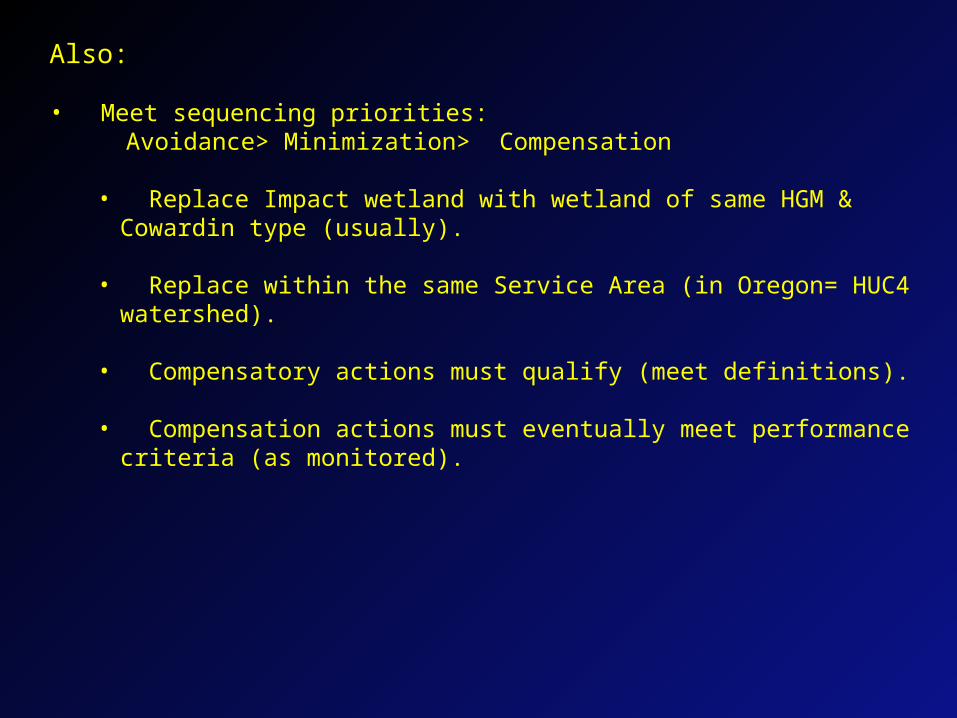
Also:
• Meet sequencing priorities: Avoidance> Minimization> Compensation
• Replace Impact wetland with wetland of same HGM & Cowardin type (usually).
• Replace within the same Service Area (in Oregon= HUC4 watershed).
• Compensatory actions must qualify (meet definitions).
• Compensation actions must eventually meet performance criteria (as monitored).
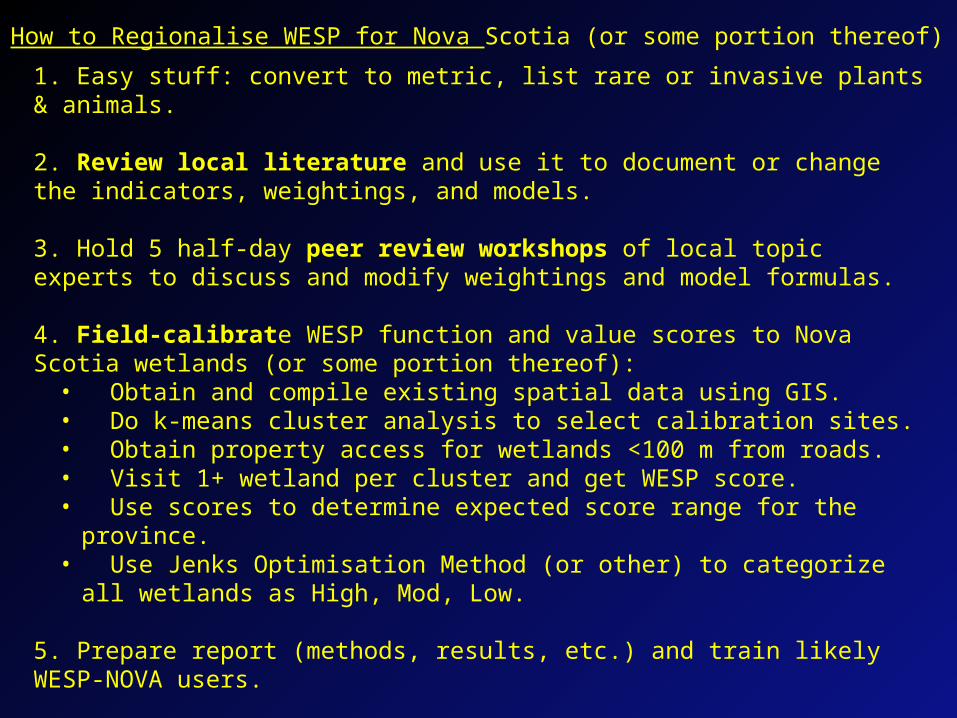
How to Regionalise WESP for Nova Scotia (or some portion thereof)
1. Easy stuff: convert to metric, list rare or invasive plants & animals.
2. Review local literature and use it to document or change the indicators, weightings, and models.
3. Hold 5 half-day peer review workshops of local topic experts to discuss and modify weightings and model formulas.
4. Field-calibrate WESP function and value scores to Nova Scotia wetlands (or some portion thereof):
• Obtain and compile existing spatial data using GIS.• Do k-means cluster analysis to select calibration sites.• Obtain property access for wetlands <100 m from roads.• Visit 1+ wetland per cluster and get WESP score.• Use scores to determine expected score range for the province.• Use Jenks Optimisation Method (or other) to categorize all wetlands
as High, Mod, Low.
5. Prepare report (methods, results, etc.) and train likely WESP-NOVA users.
6. If possible, maintain web portal to expedite acquiring form OF data.


![Topics in Complex Analytic Geometry › faculty › adamus › adamus_publications › … · [Bou] N. Bourbaki, \Elements of Mathematics, Commutative Algebra", Springer, 1989. [Dou]](https://static.fdocuments.in/doc/165x107/5f156ec38f2df735911943b6/topics-in-complex-analytic-geometry-a-faculty-a-adamus-a-adamuspublications.jpg)