
1 TRENDLINES AND MOVING AVERAGES TRENDLINES MOVING AVERAGES.
Upload
virginia-carterCategory
view
214download
0
WATER RESOURCES BULLETINVOL. 24, NO. 2 AMERICAN WATER RESOURCES ASSOCIATION APRIL 1988
WETLAND BOUNDARY DETERMINATION IN THE GREATDISMAL SWAMP USING WEIGHTED AVERAGES'
Virginia Carter, Mary Keith Garrett, and Patricia T. Gammon2
ABSTRACT: A weighted average method was used to analyze transi-tion zone vegetation in the Great Dismal Swamp to determine if amore uniform determination of wetland boundaries can be made na-tionwide. The method was applied to vegetation data collected onfour transects and three vertical layers across the wetland-to-uplandtransition zone of the swamp. Ecological index values based on watertolerance were either taken from the literature or derived from localspecies tolerances. Wetland index values were calculated for 25-rnincrements using species cover and rankings based on the ecologicalindices. Wetland index values were used to designate increments aseither wetland, transitional, or upland, and to examine the usefulnessof a provisional wetland-upland break-point. Most increments weredesignated wetland or transitional when all species were used. Re-moval of three or five ubiquitous species either gave a wider rangeof wetland index values with a more variable designation of incrementsor caused designation of increments to be similar for all layers. Theuse of locally-derived rankings showed the sensitivity of the weightedaverages method to ecological indices of species with large importancevalues. The weighted average method did not provide for an ob-jective placement of an absolute wetland boundary, but did serve tofocus attention on the transitional boundary zone where supple-mentary information is necessary to select a wetland-upland break-point.(KEY TERMS: wetland boundaries; wetland vegetation; weighted aver-ages; Great Dismal Swamp.)
INTRODUCTION
Rather than having precisely defined boundaries, manywetlands throughout the United States are bordered bytransition zones or ecotones of variable width and vegetativecomposition. Hydrology, soils, and vegetation all interactto form a continuum rather than a sharp break within thiszone. The lack of an easily located and well-defined boundarycauses problems in the administration and regulation ofFederal, State, and local wetland programs. The us.e of astandardized quantitative method to analyze transition-zonevegetation would establish a basis for a more uniform appli-cation of wetland boundary determination regionally andnationally.
Wetland ecosystems can be characterized in terms of hy-drology, soils, and vegetation (Cowardin, eta!., 1979; Sanders,et a!., 1985; Carter, 1986). The combined use of wetlandvegetation, soil, and hydrologic indicators can greatly enhancethe technical accuracy, consistency, and credibility of wet-lands determinations, particularly within the transition zonebetween wetland and nonwetland ecosystems (Sanders, et a!.,1985). However, data on vegetation may be more readilyavailable and data collection more practical than for otherindicators.
Changes in vegetative composition are used to determinewetland boundaries based on the assumption that the presenceor absence of a species is dependent on its tolerance for per-sistent water within or above the root zone. The degree towhich species have developed specific wet-site adaptationscontrols their distribution under wet or saturated conditions.Past attempts to describe or rank woody species by watertolerance (Fowells, 1965; Gill, 1970; Teskey and Hinkley,1977; Whitlow and Harris, 1979) have resulted in rankingsthat are very broad and have many local variations. Recently,the U.S. Fish and Wildlife Service (FWS) (Reed, 1986) pre-pared regional and state lists of wetland plants (WetlandsPlant List — WPL) to accompany the Cowardin, et a!. (1979),wetland classification; these lists are intended to help identifywetlands and determine boundaries. Wentworth and John-son (1986) used weighted averages (WA) in conjunction withthe WPL to test wetland designations in four existing butunpublished studies of wetland vegetation that were conductedin various regions of the United States. A summary of theresults of their tests with a thorough statistical analysis canbe found in Johnson and Wentworth (this issue of the WaterResources Bulletin).
The U.S. Geological Survey and the U.S. Fish and Wild-life Service, with the support of the U.S. Army EngineersWaterways Experiment Station, recently completed an in-depth study of the western margin of the Great Dismal Swampof Virginia and North Carolina. The overall objective of this
'Paper No. 87077 of the Water Resources Bulletin. Discussions are open until December 1, 1988.2Respectively Biologist, U.S. Geological Survey, 430 National Center, Reston, Virginia 22092; and Biologist and Botanist, 2233 Whitemarsh Road,
Suffolk, Virginia 23434.
297 WATER RESOURCES BULLETIN

Carter, Garrett, and Gammon
research was to characterize the vegetation, soils, and hy-drology of the wetland-to-upland transition zone in the GreatDismal Swamp and to evaluate various methods for determina-tion of the wetland boundary. The purpose of this paper isto report the results of the application of the WA methodbased on FWS categories to vegetation data from the westernmargin of the Great Dismal Swamp.
GREAT DISMAL SWAMP STUDY AREA
The Great Dismal Swamp of southeastern Virginia andnortheastern North Carolina is one of the largest of manysimilar forested wetlands lying on the southeastern coastalplain of the United States (Carter, et a!., 1977; Oaks andWhitehead, 1979; Daniel, 1981) (Figure 1). The main partof the swamp, 84,000 ha, is approximately 48 km long fromnorth to south and about 16 km wide at its narrowest point.The surface of the Great Dismal Swamp slopes gently east-ward at about 0.2 m per km from an altitude between 7 and10 m above sea level (National Geodetic Vertical datum of1929) near the toe of the Suffolk Scarp to 4.6 m above sealevel near the Deep Creek Swale (Oaks and Whitehead, 1979).At the west edge of the swamp, the Suffolk Scarp, a broadlinear Pleistocene shoreline feature paralleling the westernmargin, rises abruptly to an altitude of 18 to 21 m above sealevel on its undissected crest. The wetland-to-upland transi-tion zone (48 km from north to south) lies along the easternslope of the Suffolk Scarp. The climate of the Great DismalSwamp is temperate, the average annual rainfall is about1220 mm, and the average annual temperature is about 15°C(Lichtler and Walker, 1974; Reber, et al., 1981).
The vegetation of the interior of the Great Dismal Swampwas studied as early as 1901 by Kearney (Kearney, .1901),and the history of vegetative succession since the swamp'sformation 9000 years B.P. (before present) was summarizedby Whitehead (1972). Since 1901, the composition of thevegetation has been altered by ditch and road construction andextensive logging. Vegetation communities have been studiedwithin the interior of the swamp (Day, 1979, 1982; Dabeland Day, 1977; Train and Day, 1982; Levy and Walker,1979; Musselrnan, et al., 1977) but no previous studies havebeen done on vegetation of the western transition zone. Theground surface elevation changes gradually from about 6 mto 11 m above sea level across the transition zone. Increasein slope and elevation to the west, elevated areas in the tran-sition zone, microrelief of up to 30 cm, and disturbance atthe upland end can be expected to cause differences invegetative composition.
METHODS
Great Dismal Swamp Data Collection
Four east-to-west transects (A, B, C, and D) were estab-lished on the east slope of the Suffolk Scarp, two in NorthCarolina and two in Virginia (Figure 1). The four transects
are perpendicular to the Scarp and cross the transition zonefrom wetland to upland, incorporating the altitude rangefrom 6 to 11 m above sea level. The transects vary from 420to 612 m in length and are consecutively numbered bymeter from the eastern end. Ground elevations were surveyedat a maximum of 30-m intervals and temporary benchmarkswere installed every 150 m along each transect. The tran-sects were used to collect water-level, soils, and ground-waterdissolved-oxygen data, as well as vegetation data.
The vegetation was sampled on all transects by the line-intercept method (Anderson, 1942; Bauer, 1943; Buell andCantlon, 1950; Fletcher, 1983). Three parallel lines werelaid out 7 m apart on each transect, beginning well intothe area considered wetland and extending as far into thearea considered upland as possible. The final meter of thevegetation survey was always close to the edge of the agricul-tural fields to the west, except for transect B where the con-struction of an irrigation pond eliminated the last 150 meters.Au plants were identified to species following Radford, et al.(1968). Vegetation data were collected in August-Octoberof 1979, 1981, and 1982 and in June-August of 1984.
Each transect consists of three layers, upper (canopy:greater than 5 m), middle (sub-canopy and shrub: 1 to 5 m)and lower (low-shrub and herbaceous: lower than I m). Theactual cover was determined to the nearest 0.25 m for theupper and middle layers and to 0.01 m for the lower layerfor each linear meter interval for each species. Cover wasmeasured for each individual separately if more than oneindividual tree or shrub covered the same meter. The sameindividual was included in the cover data for both the upperand middle layers, or both the middle and lower layers ifplant foliage occurred above and below the 5-m or 1-m break.Frequency data (stem counts for stems whose foliage actuallyintercepted the line) were collected for the upper and middlelayers. The same individual was included in the frequencydata for both the upper and middle layers if plant foliageoccurred above and below the 5-m break. Because of theclose spacing of the lines at each transect, an occasionaltree that had a spreading crown overlapped more than oneline.
Species lists were compiled for each layer, each transect,and for the entire series of transects. The transects weredivided into 25-rn increments in order to evaluate the gradualchange from wetland to upland, and the data were processedon the basis of these 25-m increments. Inspection of the datashowed that each increment was relatively homogenous inspecies composition and provided a sufficiently large samplefor analysis. The increments were numbered from the easternend and if the last increment was less than 10 m, the incre-ment was eliminated from the calculations. Transect A, B, C,and D have 24, 23, 25, and 17 increments, respectively. Eachtotal increment, like a transect, consists of three parallel25-rn lines with three layers of vegetation, or nine line-intercept determinations. A layer increment, which is usedto calculate the layer index values, includes only the threeline-intercept determinations for the layer of interest.
298 WATER RESOURCES BULLETIN

Wetland Boundary Determination in the Great Dismal Swamp Using Weighted Averages
:::::.
DOLEGA'FeEDER
F
______
:: ':!!t.: :.. : : : . : : . :
CANA
DM*JLynches
VIRGINIACAROLIN
Mills
0 1 2 3 4 5MILESI I I I I I
0 1 2 3 4 5 KILOMETERS
Figure 1. Map Showing Location of Transects on Transition Zone of Great Dismal Swamp. Stippled area is the Great DismalSwamp study area. Western boundary is as transferred from U.S. Geological Survey 1 :250,000-scale map.
299 WATER RESOURCES BULLETIN
Carter, Garrett, and Gammon
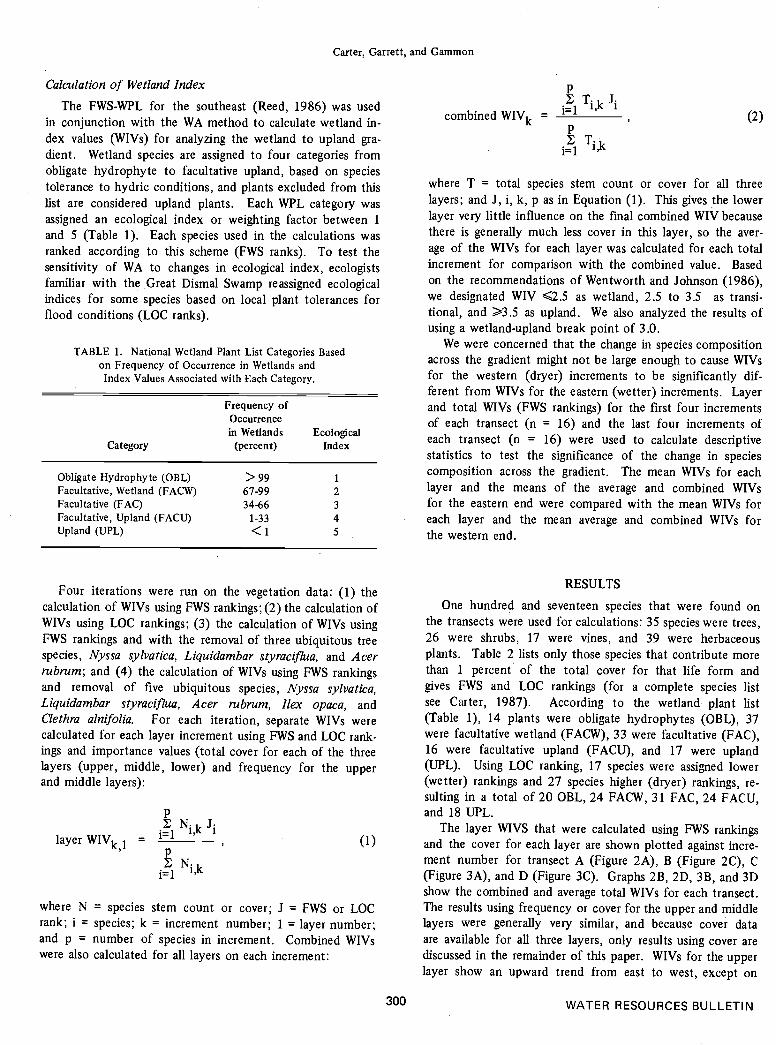
Calculation of Wetland Index
The FWS-WPL for the southeast (Reed, 1986) was usedin conjunction with the WA method to calculate wetland in-dex values (WIVs) for analyzing the wetland to upland gra-dient. Wetland species are assigned to four categories fromobligate hydrophyte to facultative upland, based on speciestolerance to hydric conditions, and plants excluded from thislist are considered upland plants. Each WPL category wasassigned an ecological index or weighting factor between 1and 5 (Table 1). Each species used in the calculations wasranked according to this scheme (FWS ranks). To test thesensitivity of WA to changes in ecological index, ecologistsfamiliar with the Great Dismal Swamp reassigned ecologicalindices for some species based on local plant tolerances forflood conditions (LOC ranks).
Category
Frequency ofOccurrencein Wetlands
(percent)Ecological
Index
Obligate Hydrophyte (OBL) > 99 1Facultative, Wetland (FACW) 67-99 2Facultative (FAC) 34-66 3Facultative, Upland (FACU) 1-33 4Upland (UPL) <1 5
Four iterations were run on the vegetation data: (1) thecalculation of WIVs using FWS rankings; (2) the calculation ofWIVs using LOC rankings; (3) the calculation of WIVs usingFWS rankings and with the removal of three ubiquitous treespecies, Nyssa sylvatica, Liquidanibar styracif7ua, and Acerrubrum; and (4) the calculation of WIVs using FWS rankingsand removal of five ubiquitous species, Nyssa sylvatica,Liquidambar sty raciflua, Acer rubrum, Ilex opaca, andClethra alnifolia. For each iteration, separate WIVs werecalculated for each layer increment using FWS and LOC rank-ings and importance values (total cover for each of the threelayers (upper, middle, lower) and frequency for the upperand middle layers):
pNi,k i
— i=llayer WIVk1 — ___________
pN.
i=1
where N = species stem count or cover; J FWS or LOCrank; i = species; k = increment number; 1 = layer number;and p = number of species in increment. Combined WIVswere also calculated for all layers on each increment:
p1.1 J.•_i 1,i 1
combined WIVk = __________p
T.i=l 1,
where T = total species stem count or cover for all threelayers; and J, i, k, p as in Equation (1). This gives the lowerlayer very little influence on the final combined WIV becausethere is generally much less cover in this layer, so the aver-age of the WIVs for each layer was calculated for each totalincrement for comparison with the combined value. Basedon the recommendations of Wentworth and Johnson (1986),we designated WIV 2.5 as wetland, 2.5 to 3.5 as transi-tional, and 3 .5 as upland. We also analyzed the results ofusing a wetland-upland break point of 3.0.
We were concerned that the change in species compositionacross the gradient might not be large enough to cause WIVsfor the western (dryer) increments to be significantly dif-ferent from WIVs for the eastern (wetter) increments. Layerand total WIVs (FWS rankings) for the first four incrementsof each transect (n = 16) and the last four increments ofeach transect (n = 16) were used to calculate descriptivestatistics to test the significance of the change in speciescomposition across the gradient. The mean WIVs for eachlayer and the means of the average and combined WIVsfor the eastern end were compared with the mean WIVs foreach layer and the mean average and combined WIVs forthe western end.
RESULTS
One hundred and seventeen species that were found onthe transects were used for calculations: 35 species were trees,26 were shrubs, 17 were vines, and 39 were herbaceousplants. Table 2 lists only those species that contribute morethan 1 percent of the total cover for that life form andgives FWS and LOC rankings (for a complete species listsee Carter, 1987). According to the wetland plant list(Table 1), 14 plants were obligate hydrophytes (OBL), 37were facultative wetland (FACW), 33 were facultative (FAC),16 were facultative upland (FACU), and 17 were upland(UPL). Using LOC ranking, 17 species were assigned lower(wetter) rankings and 27 species higher (dryer) rankings, re-sulting in a total of 20 OBL, 24 FACW, 31 FAC, 24 FACU,and 18 UPL.
The layer WIVS that were calculated using FWS rankings(1) and the cover for each layer are shown plotted against incre-
ment number for transect A (Figure 2A), B (Figure 2C), C(Figure 3A), and D (Figure 3C). Graphs 2B, 2D, 3B, and 3Dshow the combined and average total WIVs for each transect.The results using frequency or cover for the upper and middlelayers were generally very similar, and because cover dataare available for all three layers, only results using cover arediscussed in the remainder of this paper. WIVs for the upperlayer show an upward trend from east to west, except on
300 WATER RESOURCES BULLETIN
(2)
TABLE 1. National Wetland Plant List Categories Basedon Frequency of Occurrence in Wetlands andIndex Values Associated with Each Category.

Wetland Boundary Determination in the Great Dismal Swamp Using Weighted Averages
transect C. WIVs for the middle layer are quite variable;they show an upward trend from east to west on transects Aand B but very little trend on transects C and D. Lowerlayer WIVs are consistently low, mostly because of a pre-dominance of the ubiquitous Clethra alnifolia (FACW). Aver-age WIVs are always somewhat lower than combined WIVsbecause of the lower layer.
TABLE 2. Dominant Plant Species Found on the Transition Zoneof the Great Dismal Swamp and Their Associated Ranks Based
on Ecological Index Values and Locally-Derived Values (seeTable 1 for categories). Species listed contribute more
than 1 percent of total cover for each life form.
FWS LOCScientific Name Rank Rank
TREES
Rex opaca AitonMagnolia virginiana L.Pinus taeda L.Acer rubrum L.Carpinus caroliniana Walter.Liquidambar styraciflua L.Liriodendron tulipifera L.Nyssa sylvatica MarshallQuercus alba L.Quercus laurifolia MichauxQuercus nigra L.Quercus phellos L.Taxodium distichum (L.) Richard
SHRUBS
Rex glabra (L.) GrayLeucothoe axillaris (Lam.) D.DonLyonia lucida (Lam.) K. Kochaethra alnifolia L.Rex verticillata (L.) GrayItea virginica L.Leucothoe race mosa (L.) GrayRhododendron viscosum (L.) TorreyRubus hispidus L.Symplocos tinctoria (L.) L'Her.Viburnum nudum L.
VINES
Lonicera japonica ThunburgSmilax laurifolia L.Berchemia scandens (Hill) K.Koch.Campsis radicans (L.) SeemannDecu maria barbara L.Parthenocissus quinquefolia (L.) PlanchonRhus radicans L.Smilax rotundifolia L.Vitis rotundifolia Michaux
2 22 32 22 3
2 1
2 1
2. 22 12 23 42 1
3 42 12 23 32 33 33 33 33 3
Osmunda cinnamomea L. 2 2
Woodwardia areolata (L.) Moore 1 2
Athyrium asplenioides (Michaux) A.A. Eaton 3 3
Arundinaria gigantea (Walter) Muhl. 2 2
Saururus cernuus L. 1 1
Using LOC rankings rather than FWS rankings had verylittle effect on upper layer WIVs, which were dominated byfacultative species with unchanged ranks. Changing severalQuercus spp. from FAC to FACU caused WIVs to increaseon some increments. Middle layer WIVs using LOC rankingswere smaller and less variable than with FWS rankings, mostlybecause hex opaca was changed from FACU to FAC andClethra alnifolia from FACW to FAC. Lower layer WIVswere always considerably higher when LOC rankings wereused because of C. alnifolia. The WA method is very sensi-tive to changes in ecological index of species with large im-portance (cover or, frequency) values. Overall, use of LOCrankings gave higher combined WIVs, causing more incre-ments to have values 3 (e.g., Figure 4A where Quercusspp. and C. alnifolia have increased the combined WIVs forincrements B1S-l8).
When the ubiquitous trees, Acer rubrum (FAC), Nyssasylvatica (FAC), and Liquidambar styraciflua (FAC), are re-moved, the range of values for WIVs expands and WIVs be-come more variable. On the upper layer of transect D (Fig-ure 4B) values originally above 3 increased or decreasedslightly and values between 2 and 3 decreased. On transect C(the most variable) upper layer increments Cl-3 and C5 haveeither Taxodium (OBL) and (or) Similax laurifolia (FACW)whereas increment C4 has hex opaca (FACU) and Anisostichuscapreolata (UPL) (Figure 4C). Increment C7 contains Pinus(FAC) and increments Cli, C13-15, C18, and C19 haveQuercus spp. (FAC, FACU, UPL). Removal of the ubiquitousspecies allows these other species to dominate the WIVs.Transects A and B show similar but less erratic trends thantransect C. Removal of hex opaca (FACU) and Clethraalnifolia (FACW), in addition to the three ubiquitous treesmentioned above, lowers middle layer WIVs dramatically.Lower layer WIVs increase 'when both C. alnifolia and 1.opaca are removed. The overall effect of the removal ofthree and five ubiquitous species on combined WIVs on tran-sect C is demonstrated in Figure 4D.
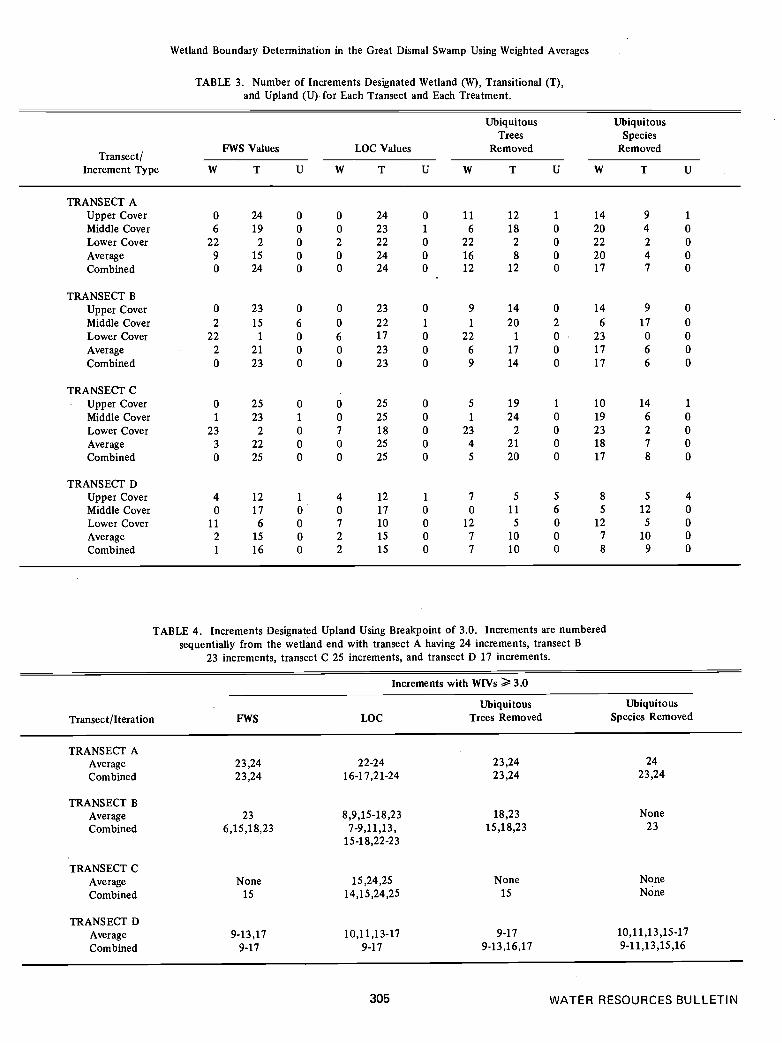
Table 3 summarizes the results of classifying incrementswith WIVs. The transect vegetation was composed primarilyof facultative species with relatively few obligate hydrophytesor upland plants. Consequently, WIVs for all treatments ex-cept for removal of ubiquitous species were almost always< 2.5 (wetland) or between 2.5 and 3.5 (transitional); veryfew increments were designated upland (> 3.5). Lower coverincrements have more wetland designations than any otherincrement type. Use of LOC rankings, rather than FWSrankings, generally caused more increments to be designatedtransitional than to be designated upland or wetland. Whenthree ubiquitous tree species were removed, WIVs had a widerrange of values and designation of increments to wetland andtransitional categories was more variable. Removal of fiveubiquitous species caused designation of increments to besimilar for all layers and for combined layers; many moreincrements were designated wetland. The wetland-upland'break point of a WIV of 3.0 occurs at different places onthe same transect with different treatments (Table 4).
301 WATER RESOURCES BULLETIN
42
33333342321
32
33434343331
HERBACEOUS PLANTS

Carter, Garrett, and Gammon
Figure 2. Wetland Index Values for (a) Transect A Increments, Upper, Middle, and Lower Cover; (b) Transect AAverage and Combined Values; (c) Transect B Increments, Upper, Middle, and Lower Cover; and (d) Transect B
Average and Combined Values. Dashed horizontal line indicates possible wetland-upland break.
When descriptive statistics for the eastern and western in-crements were calculated, the mean WIVs for each category(upper layer, middle layer, etc.) were significantly different(P < 0.01), which confirms that there was adequate separa-tion between the vegetation types at opposite ends of thetransects. Eastern increment combined WIVs had a mean of2.69 (SE = 0.030) the largest standard error of all the easternmeans was 0.069 (middle cover); western increment com-bined WIVs had a mean of 2.94 (SE = 0.033), the largeststandard error of all western means was 0.092 (lower cover).
DISCUSSION
Increased objectivity and greater uniformity of applicationcould result from use of a numerical system such as this foridentifying wetland boundaries; therefore, we have chosen toexamine this application in some detail. In the case of awetland-to-upland transition zone with a long gradual gradientlike that in Great Dismal Swamp, a progression of WIVswhich, although variable, show a trend from below 3.0 toabove 3.0 will be encountered. We have demonstrated thatthe eastern ends of our transects have WIVs significantly dif-ferent from the western ends, but the range of WIVs calcu-lated using FWS rankings is fairly small, 2.45 to 3.25 forcombined WIVs and 2.34 to 3.16 for average WIVs. There
302 WATER RESOURCES BULLETIN
24 22 20 18
w
-J
>
waz
az-jI-w
4INCREMENT
w
-J
>
xwaz
az-JI-w
24 22 20 18 16 14 12 .10
3
2
INCREMENT
1 22 20 18 16 14 12 10 8 6 4 2
INCREMENT22 20 18 16 14 12 10 8 6 4 2
INCREMENT

Wetland Boundary Determination in the Great Dismal Swamp Using Weighted Averages
z-JI-w
Figure 3. Wetland Index Values for (a) Transect C Increments, Upper, Middle, and Lower Cover; (b) Transect CAverage and Combined Values; (c) Transect D Increments, Upper, Middle, and Lower Cover; and (d) Transect D
Average and Combined Values. Dashed horizontal line indicates possible wetland-upland break.
are almost no WIVs > 3.5 and thus very few incrementsdesignated upland in any of our iterations (Tables 3 and 4).
Removal of ubiquitous species resulted in WIVs as high as3.82 and as low as 1.18 (D upper cover). There was only asmall change in the number of increments designated upland,but more increments were designated wetland with treatment.For practical use, the removal of ubiquitous species wouldbe time consuming and would require further definition ofnumerical limits. Because WA is sensitive to changes in eco-logical indices (as with LOC values), it would be better to usea standardized list such as the WPL.
The western ends of all the Great Dismal Swamp tran-sects abut agricultural land or the irrigation pond that was
installed during the study and truncates transect B. The lackof increments that can be indisputably classified as upland(WIVs > 3.5) reflects conversion of upland forest to agricul-ture. Selective cutting of oaks near the field edges and thepresence of old water-filled ruts from long-abandoned loggingroads give obligate and FACW understory species a place tothrive, thus giving these sites a lower WIV than might be ex-pected.
Each layer gives a different picture of the wetness of thetransition zone of the Great Dismal Swamp. The lower layerhas many obligate and FACW species and consistently lowWIVs. For practical use, the lower layer alone could bemisleading because herbaceous annuals may be abundant in
303 WATER RESOURCES BULLETIN
25 20 15
w
-J
>
10 5
INCREMENT
z-JI—LU
><w 15 10
INCREMENT
4
3'
2
TRANSECT 0 D
Average
I I I I I I I I
16 14 12 10 8 6 4 2
INCREMENT16 14 12 10 8 6 4 2
INCREMENT

Carter, Garrett, and Gammon
extended dry periods and very scanty in extended wet periodsduring the growing season. The middle layer of shrubs andsaplings seems to reflect a dryer environment than the canopyor lower layers, but this is primarily due to saplings that havebecome established on old stumps and slightly elevatedareas. Most of the shrubs are FACW and have a wide tolerancefor moisture conditions, such as are found on the westernmargin of the Great Dismal Swamp. The upper layer pro-vides the most consistent trend from wet to dry. It seemsdesirable to use all three layers for designating wetlands asthe total association of plants should best reflect long-termenvironmental conditions.
Johnson and Wentworth (this issue of Water ResourcesBulletin) tested data collected within relatively homogeneousvegetation types rather than across the moisture/elevationgradient between wetland and upland. They suggested that
a WA of 3.0 be considered as a provisional break pointseparating wetlands from upland and stress that if the WAlies within 0.5 units of the break point, it is mandatory thatthe vegetation data be supplemented with soils and (or) hy-drology data. In the Great Dismal Swamp, establishing aboundary based on vegetation alone where WIVs slightly lessthan 3.0 change to slightly more than 3.0 appears to be dif-ficult at best, especially when different layers and treatmentsprovide different answers (Table 4). For example, incre-ments 14, 15, and 16 of transect D have combined WIVs of3.00; we have designated them upland, but this illustratesthe difficulty arising from a numerical separation made with-out benefit of ancillary data. We are satisfied with the desig-nation of most of our wetland increments as transitional(Table 3) and we agree with the Johnson and Wentworthrequirement for soils and (or) hydrology data to assist in
304 WATER RESOURCES BULLETIN
LU
-J
>
LU
-J
>
LU
z
z-JI-LU
4TRANSECT B COMBINED A
FWS
2
1III I 111111 111111111
4
3
2
22 20 18 16 14 12 10 8 6 4 2INCREMENT
>(LU
z14 12 10 8 6
INCREMENT
0z-JI-LU
25 20 15 10 5INCREMENT
25 20 15 10 5
INCREMENTFigure 4. (a) Transect B Combined WIVs Calculated Using FWS and LOC Rankings; (b) WIVs for Transect D Upper
Layer Cover; (c) Transect C Middle Layer Cover Calculated With All Species and Three Ubiquitous Tree SpeciesRemoved; and (d) Transect C Combined Layers Calculated With All Species, Three Ubiquitous Tree Species
and Five Ubiquitous Species Removed. Dashed horizontal line indicates possible wetland-upland break.
Wetland Boundary Determination in the Great Dismal Swamp Using Weighted Averages
TABLE 3. Number of Increments Designated Wetland (W), Transitional (T),and Upland (U) for Each Transect and Each Treatment.
UbiquitousTrees
FWS Values LOC Values RemovedTransect!
Increment Type W T U W T U W T U W
UbiquitousSpecies
Removed
I U
TRANSECT AUpper Cover 0 24 0 0 24 0 11 12 1 14 9 1Middle Cover 6 19 0 0 23 1 6 18 0 20 4 0Lower Cover 22 2 0 2 22 0 22 2 0 22 2 0
Average 9 15 0 0 24 0 16 8 0 20 4 0Combined 0 24 0 0 24 0 12 12 0 17 7 0
TRANSECT BUpper Cover 0 23 0 0 23 0 9 14 0 14 9 0
Middle Cover 2 15 6 0 22 1 1 20 2 6 17 0Lower Cover 22 1 0 6 17 0 22 1 0 23 0 0
Average 2 21 0 0 23 0 6 17 0 17 6 0Combined 0 23 0 0 23 0 9 14 0 17 6 0
TRANSECT CUpper Cover 0 25 0 0 25 0 5 19 1 10 14 1Middle Cover 1 23 1 0 25 0 1 24 0 19 6 0Lower Cover 23 2 0 7 18 0 23 2 0 23 2 0
Average 3 22 0 0 25 0 4 21 0 18 7 0Combined 0 25 0 0 25 0 5 20 0 17 8 0
TRANSECT DUpper Cover 4 12 1 4 12 1 7 5 5 8 5 4Middle Cover 0 17 0 0 17 0 0 11 6 5 12 0Lower Cover 11 6 0 7 10 0 12 5 0 12 5 0Average 2 15 0 2 15 0 7 10 0 7 10 0Combined 1 16 0 2 15 0 7 10 0 8 9 0
TABLE 4. Increments Designated Upland Using Breakpoint of 3.0. Increments are numberedsequentially from the wetland end with transect A having 24 increments, transect B
23 increments, transect C 25 increments, and transect D 17 increments.
Increments with WIV5 3.0
Ubiquitous UbiquitousTransect/Iteration FWS LOC Trees Removed Species Removed
TRANSECT AAverage 23,24 22-24 23,24Combined 23,24 16-17,21-24 23,24
2423,24
TRANSECT BAverage 23 8,9,15-18,23 18,23 NoneCombined 6,15,18,23 7-9,11,13, 15,18,23 23
15-1 8,22-2 3
TRANSECT CAverage None 15,24,25 None None
Combined 15 14,15,24,25 15 None
TRANSECT DAverage 9-13,17 10,11,13-17 9-17Combined 9-17 9-17 9-13,16,17
10,11,13,15-179-11,13,15,16
305 WATER RESOURCES BULLETIN
Carter, Garrett, and Gammon
decision making. Clearly, the use of the WA method does notprovide for an objective placement of an absolute wetlandboundaiy but serves to focus attention on the transitionalboundary zone wherein supplementary data on hydrology andsoils rather than political and social considerations should beused for a final determination.
ACKNOWLEDGMENTS
The authors thank Lucy E. Edwards, Cliff Hupp, and Thomas R.Wentworth for thorough review of the manuscript and many helpfulsuggestions.
LITERATURE CITED
Anderson, K. L., 1942. A Comparison of Line Transects and Per-manent Quadrats in Evaluating Composition and Density of PastureVegetation of the Tall Prairie Grass Type. Journal of Ecology 124:45-60.
Bauer, H. L., 1943. The Statistical Analysis of Chaparral and OtherUpland Communities by Means of Transect Samples. Ecology 24:45.60.
Buell, M. F. and J. E. Cantlon, 1950. A Study of Two Communitiesof the New Jersey Pine Barrens and a Comparison of Methods.Ecology 31(4):567-586.
Carter, Virginia, 1986. An Overview of the Hydrologic Concerns Re-lated to Wetlands in the United States. Canadian Journal of Bo-tany 64:365-374.
Carter, Virginia, 1987. Relation to Hydrogeology, Soils and Vegeta-tion on the Wetland-to-Upland Transition Zone of the Great Dis-mal Swamp, Virginia and North Carolina. Unpublished Ph.D. Dis-sertation, George Washington University, Washington, D.C., 300 pp.
Carter, Virginia, M. K. Garrett, Lurie Shima, and Patricia Gammon,1977. The Great Dismal Swamp: Management of a HydrologicResource with the Aid of Remote Sensing. Water Resources Bul-letin 13(1): 1-12.
Cowardin, L. M., Virginia Carter, F. C. Golet, and E. T. LaRoe, 1979.Classification of Wetlands and Deepwater Habitats of the UnitedStates. U.S. Fish and Wildlife Service FWS/OBS-79-31, 103 pp.
Dabel, C. V. and F. P. Day, 1977. Structural Comparisons of FourPlant Communities in the Great Dismal Swamp, Virginia. Bulletinof the Torrey Botanical Club 104:352-360.
Daniel III, C. C., 1981. Hydrology, Ecology and Soils of Pocosins: AComparison of Natural and Altered Systems. In: Pocasin Wetlands,C. J. Richardson, M. L. Mathews, and S. A. Anderson (Editors).Hutchison Ross Publishing Company, Stroudsburg, Pennsylvania,pp. 69-108.
Day, Jr., F. P., 1979. Litter Accumulation in Four Plant Communi-ties in the Dismal Swamp, Virginia. American Midland Naturalist102:281-289.
Day, Jr., F. P., 1982. Litter Decomposition Rates in the SeasonallyFlooded Great Dismal Swamp. Ecology 63:670-678.
Fletcher, S. W., 1983. Evaluation of Methods for Sampling Vegetationand Delineating Wetlands Transition Zones in Southern Louisiana,January 1979-May 1981. U.S. Army Corps Engineers WaterwaysExperiment Station Technical Report Y-83-1, Vicksburg, Mississippi,259 pp.
Fowdlls, H. A., 1965. Silvics of Forest Trees of the United States.U.S. Department of Agriculture Handbook No. 271, 762 pp.
Gill, C. J., 1970. Flooding Tolerance of Woody Species — A Review.Forestry Abstracts 31:671-688.
Kearney, T. H., 1901. Report on a Botanical Survey of the DismalSwamp Region. Contribution from the U.S. National Herbarium5: 32 1-55 0.
Levy, G. R. and S. W. Walker, 1979. Forest Dynamics in the DismalSwamp of Virginia. In. The Great Dismal Swamp, P. W. Kirk, Jr.(Editor). University Press of Virginia, Charlottesville, Virginia,pp. 101-126.
Lichtler, W. F. and P. N. Walker, 1974. Hydrology of the DismalSwamp, Virginia-North Carolina. U.S. Geological Survey Open-FileReport 74-39, 50 pp.
Musselman, L. J., D. L. Nickrent, and G. F. Levy, 1977. A Contribu-tion Toward a Vascular Flora of the Great Dismal Swamp. Rhodora79:240-268.
Oaks, Jr., R. Q. and D. R. Whitehead, 1979. Geologic Setting andOrigin of the Dismal Swamp, Southeastern Virginia and North-eastern North Carolina. In: The Great Dismal Swamp, P. W. Kirk,Jr. (Editor). University of Virginia Press, Charlottesville, Virginia,pp. 1-24.
Radford, A. E., H. E. Ahies, and C. R. Bell, 1968. Manual of theVascular Flora of the Carolinas. The University of North CarolinaPress, Chapel Hill, North Carolina, 1183pp.
Reber, E. J., M. A. Bailey, P. J. Swecher, J. S. Quesenberry, and D.Bradshaw, 1981. Soil Survey of City of Suffolk, Virginia. U.S.Soil Conservation Service, Suffolk, Virginia, 99 pp.
Reed, P. B., Jr., 1986. Wetland Plant List. National Wetlands Inven-tory. U.S. Fish and Wildlife Service, St. Petersburg, Florida.
Sanders, Sr., D. R., W. B. Parker, S. W. Forsythe, and R. T. Huffman,1985. Wetlands Delineation Manual. U.S. Army Engineers Water-ways Experiment Station Technical Report Y-84, 115 pp.
Teskey, R. 0. and T. M. Hinckley, 1977. Impact of Water LevelChanges in Woody Riparian and Wetland Communities, VolumeII: The Southern Forest Region. U.S. Fish and Wildlife Service,Office of Biological Services FWS/OBS-77/59, 46 pp.
Train, E. and F. P. Day, Jr., 1982. Population Age Structure of TreeSpecies in Four Plant Communities in the Great Dismal Swamp,Virginia. Castanea 47:1-16.
Wentworth, T. R. and G. P. Johnson, 1986. Use of Vegetation in theDesignation of Wetlands, Final Report. U.S. Fish and WildlifeService, National Wetlands Inventory, St. Petersburg, Florida,107 pp.
Whitehead, D. R., 1972. Developmental and Environmental Historyof the Dismal Swamp. Ecological Monographs 42:301-3 15.
Whitlow, T. H. and R. W. Harris, 1979. Flood Tolerance in Plants: AState-of-the-Art Review. U.S. Army Corps of Engineers WaterwaysExperiment Station Technical Report E-79-2, Vicksburg, Mississippi,161 pp.
306 WATER RESOURCES BULLETIN