Western Region Pesticide Meeting Air Monitoring Studies for Agriculture-Urban Interfaces Carl A....
44
Western Region Pesticide Meeting Air Monitoring Studies for Agriculture-Urban Interfaces Carl A. Brown, Ph.D. Idaho Department of Environmental Quality
-
Upload
cathleen-moody -
Category
Documents
-
view
215 -
download
0
Transcript of Western Region Pesticide Meeting Air Monitoring Studies for Agriculture-Urban Interfaces Carl A....
Western Region Pesticide Meeting Air Monitoring Studies for
Agriculture-Urban Interfaces
Carl A. Brown, Ph.D.Idaho Department of Environmental Quality

Outline
• Purpose of study
• Background/Description of sites
• Preliminary Risk Screening Analysis
• Source identification
• 1, 3-DCP
• Wrap-up
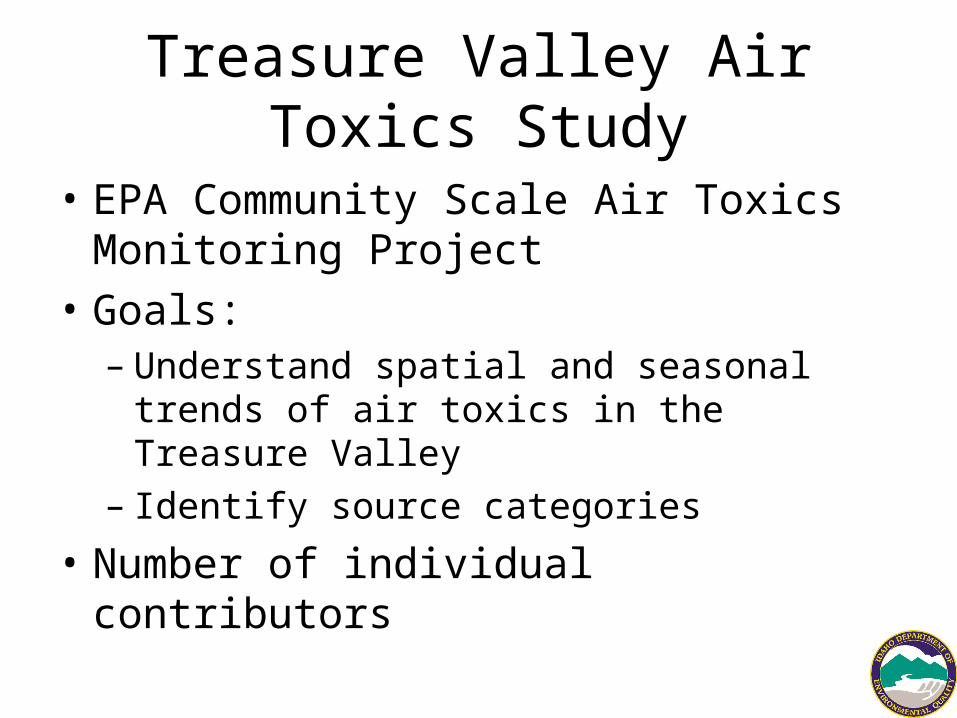
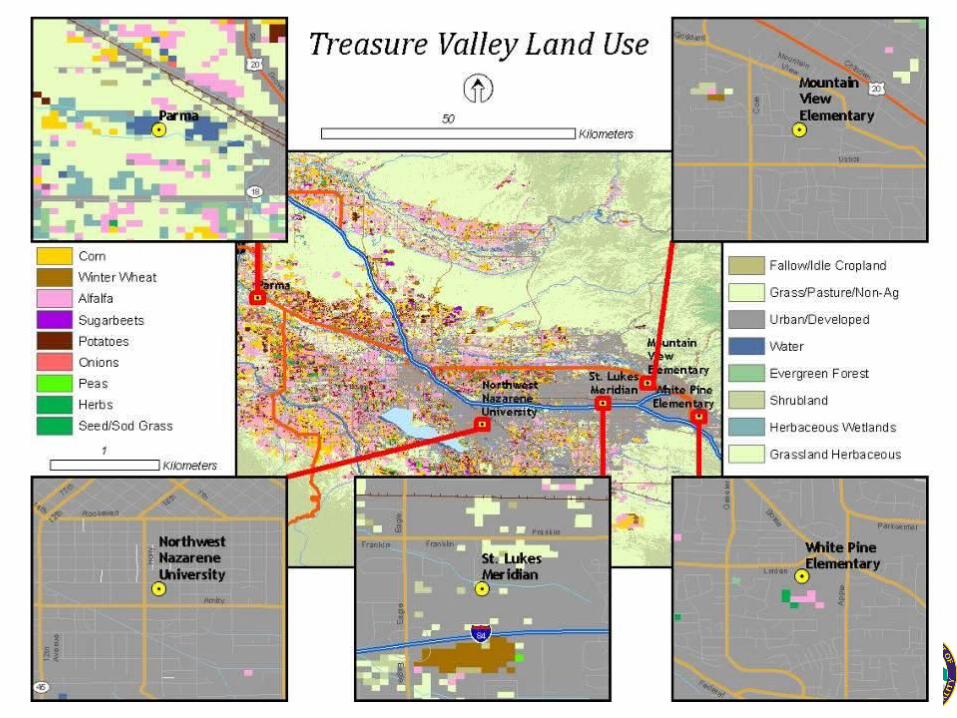
Treasure Valley Air Toxics Study
• EPA Community Scale Air Toxics Monitoring Project
• Goals: – Understand spatial and seasonal trends of air
toxics in the Treasure Valley– Identify source categories
• Number of individual contributors
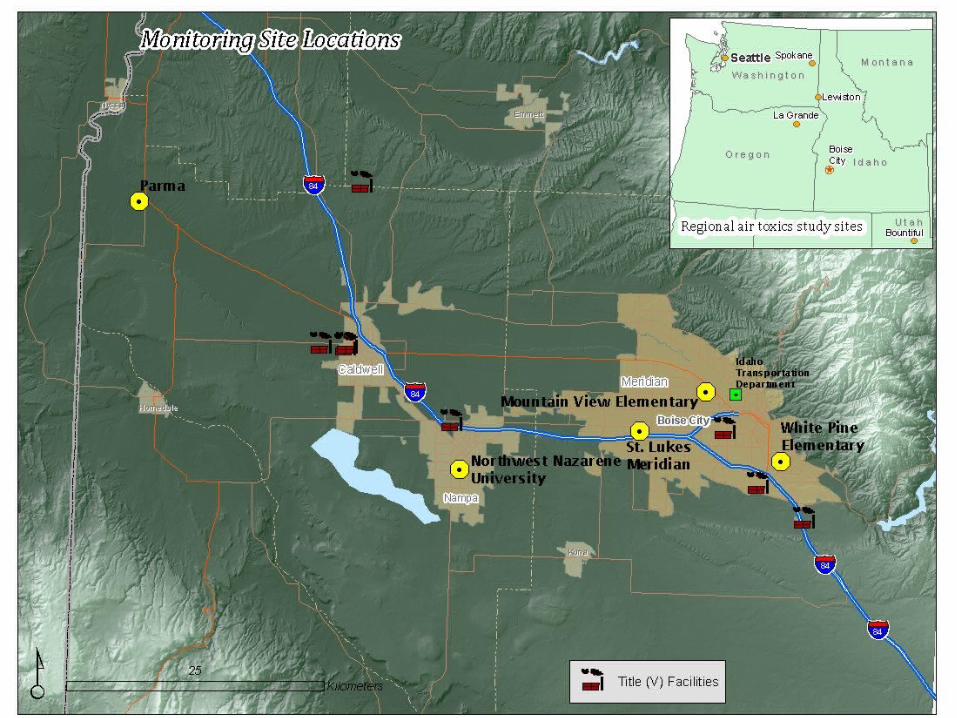
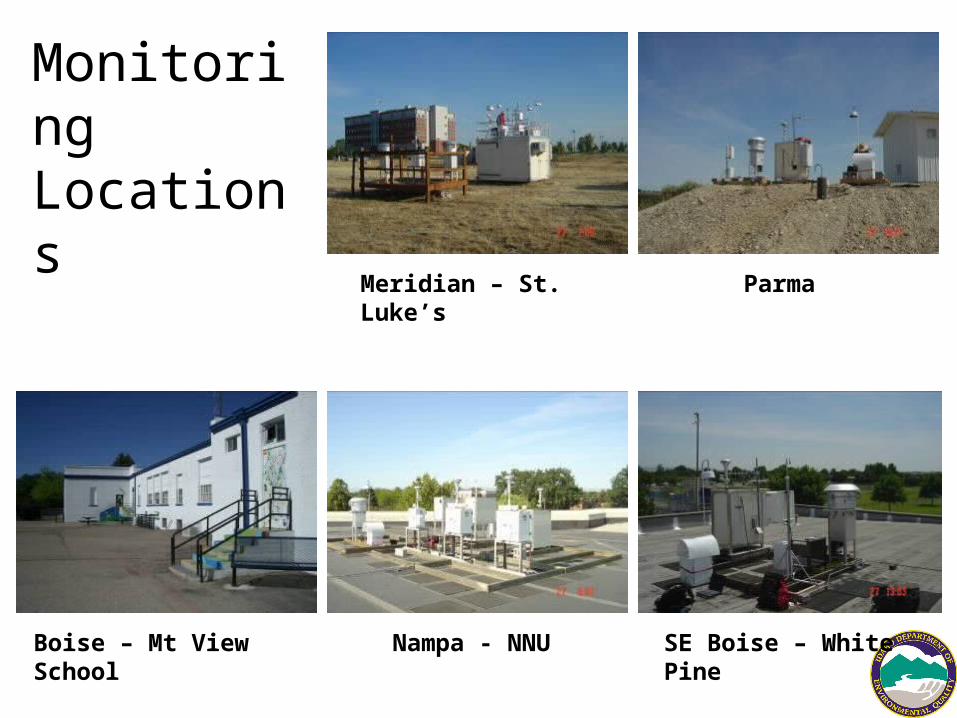
Meridian – St. Luke’s Parma
Boise – Mt View School Nampa - NNU SE Boise – White Pine
Monitoring Locations

Sampling and Analysis Methods
• Metal/Trace Element Hazardous Air Pollutants– Quartz PM10 Hi-vol filters– Metals analysis by EPA IO-3.5 (ICP analysis)
• Volatile Organic Carbon Compounds (VOCs)– Whole-air samples in evacuated Summa Cans– EPA Method 15A (GC/FID)
• Carbonyls (aldehydes and ketones)– Sample adsorbed on DNPH cartridge– Analysis by EPA Method 11A (HPLC)
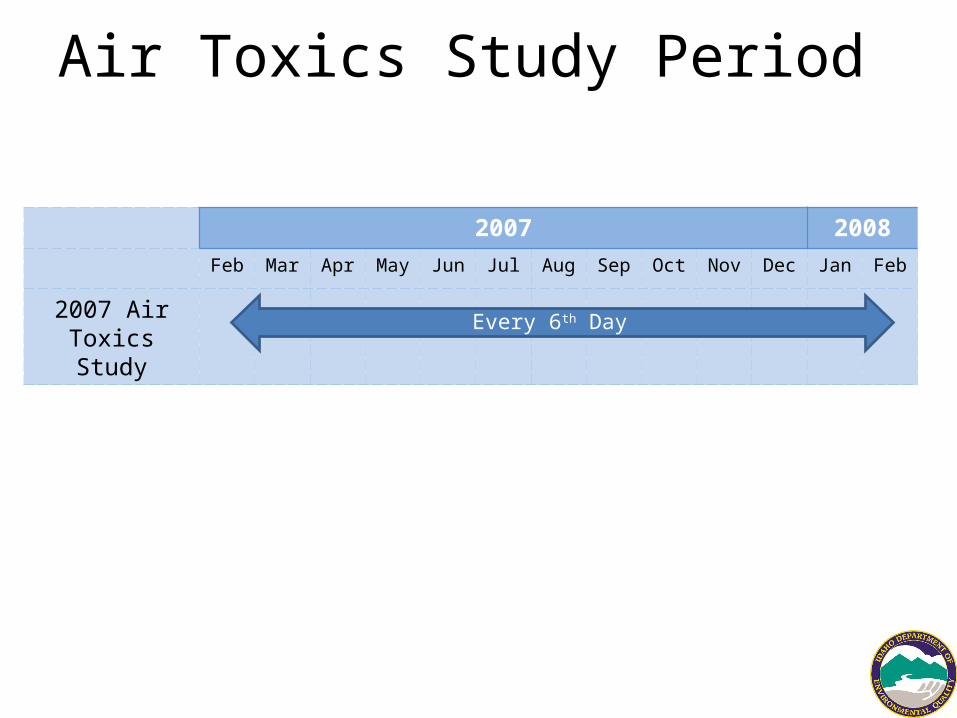
Air Toxics Study Period
2007 2008Feb Mar Apr May Jun Jul Aug Sep Oct Nov Dec Jan Feb
2007 Air Toxics Study
Every 6th Day

Data Quality Assessment – Frequently Detected Species

Data Quality Assessment – Infrequently
Detected Species
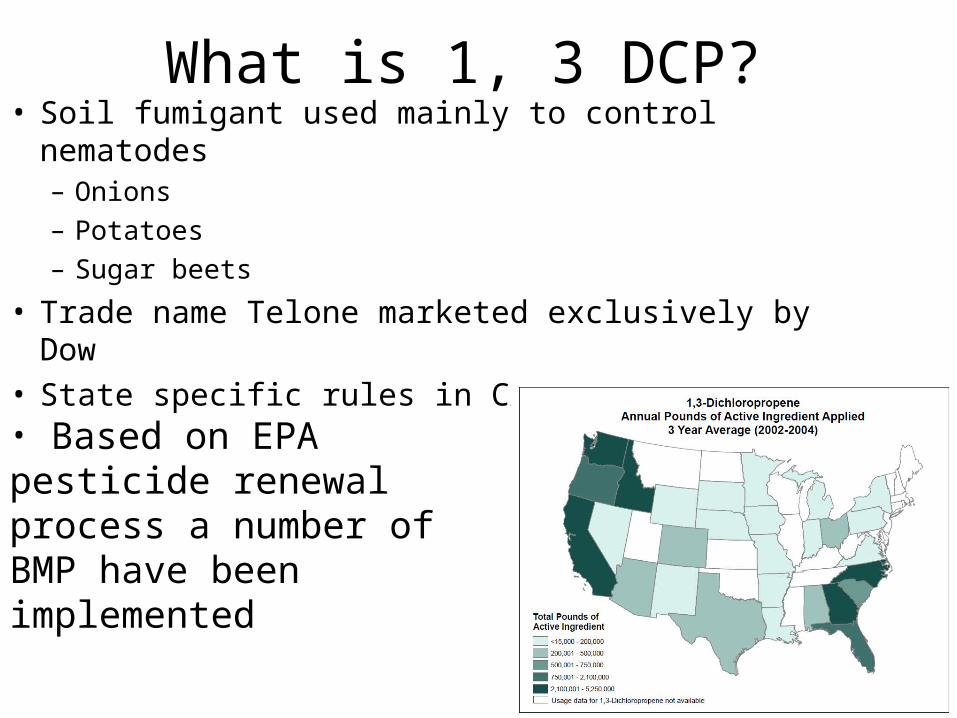
What is 1, 3 DCP?• Soil fumigant used mainly to control nematodes
– Onions– Potatoes– Sugar beets
• Trade name Telone marketed exclusively by Dow• State specific rules in CA limiting its use
• Based on EPA pesticide renewal process a number of BMP have been implemented

Data Quality Assessment
• % > MRL• Precision• Completeness
In order to characterize a pollutant… you need to first detect it…
Risk Screening Process
• Remove species with low data quality• Determine maximum measured
concentration• Compare maximum concentration to
conservative benchmarks
Risk Screening Process
• Compare to conservative benchmarks: Non-carcinogens– Hazard quotient > 0.1:
• The ratio of the potential exposure to a substance and the level at which no adverse effects are expected.

Risk Screening Process
• Compare to conservative benchmarks: Carcinogens– 1 in a Million Cancer Risk:
• A risk level of 1 in a million implies a likelihood that 1 person, out of a population of one million equally exposed people would contract cancer if exposed continuously (24 hours per day) to the specific concentration over 70 years (an assumed lifetime).

Risk ScreeningAfter removing the compounds measured with a low confidence,
the following species are the remaining contaminants of concern:• acetaldehyde• arsenic• benzene• cadmium• (cis- and trans-)1,3-dichloropropene• ethyl benzene• formaldehyde• manganese• methylene chloride

Carcinogenic Risk DriversMonitoring Site
White Pine
Mountain View
St. Luke's NNU Parma
benzene benzene formaldehyde benzene dichloropropene formaldehyde formaldehyde benzene formaldehyde benzene
acetaldehyde acetaldehyde acetaldehyde dichloropropene formaldehyde
ethyl benzene
arsenic acetaldehyde acetaldehyde
arsenic arsenic arsenic

Communication
• Management• ISDA• UI Parma Research Center• IDHW• EPA
Source Identification Methods• Statistical “Receptor Modeling” methods
– Principal Component Analysis – PCA – Positive Matrix Factorization – PMF
• Temporal patterns
• Correlations with other species/tracers
• Seasonal-spatial trends
• Experience with typical source categories– Other studies/literature
• Source investigation

Identified Source Categoriesfor Contaminants of Concern
Mobile Sources
Photo-chemical Production
Biomass Burning
Geologic/ Wind Erosion
Mixed Sources / Stagnation
Solvents Agricultural Pesticide
Benzene Major Minor Minor Minor
Ethyl Benzene Major Minor Minor Minor
Formaldehyde Minor Major Major Minor
Acetaldehyde Minor Major MajorArsenic Minor Major Major Minor
Cadmium Minor Minor Minor MajorManganese MajorMethylene Chloride Major1,3-Dichloropropene Major

Data Comparisons
• NATA: National Air Toxics Assessment– NATA provides inhalation cancer and non-cancer
risks at the county and census tract level
• Comparison to national monitoring data

National Air Toxics Analysis

NATA 2002
0
5
10
15
20
25
BENZENE
CARBON TETRACHLO
RIDE
1,3-
BUTADIENE
ARSENIC
ACETALDEHYDE
TRICHLO
ROETHYLE
NE
CHROMIU
M C
OM
POUNDS
PAH/POM
NAPHTHALENE
BENZENE
CARBON TETRACHLO
RIDE
1,3-
BUTADIENE
ARSENIC
ACETALDEHYDE
CHROMIU
M C
OM
POUNDS
NAPHTHALENE
PAH/POM
BENZENE
CARBON TETRACHLO
RIDE
1,3-
BUTADIENE
ACETALDEHYDE
CHROMIU
M C
OM
POUNDS
ARSENIC
BENZENE
CARBON TETRACHLO
RIDE
ACETALDEHYDE
1,3-
BUTADIENE
CHROMIU
M
CARBON TETRACHLO
RIDE
BENZENE
ACETALDEHYDE
1,3-
BUTADIENE
Can
cer
Ris
k (i
n a
mil
lio
n)
Background RiskNonroad RiskOnroad RiskArea RiskMajor Risk
"WHP" "MTV" "STL" "NNU" "PAR"
cbrown
NATA background slide

Mobile

Mobile
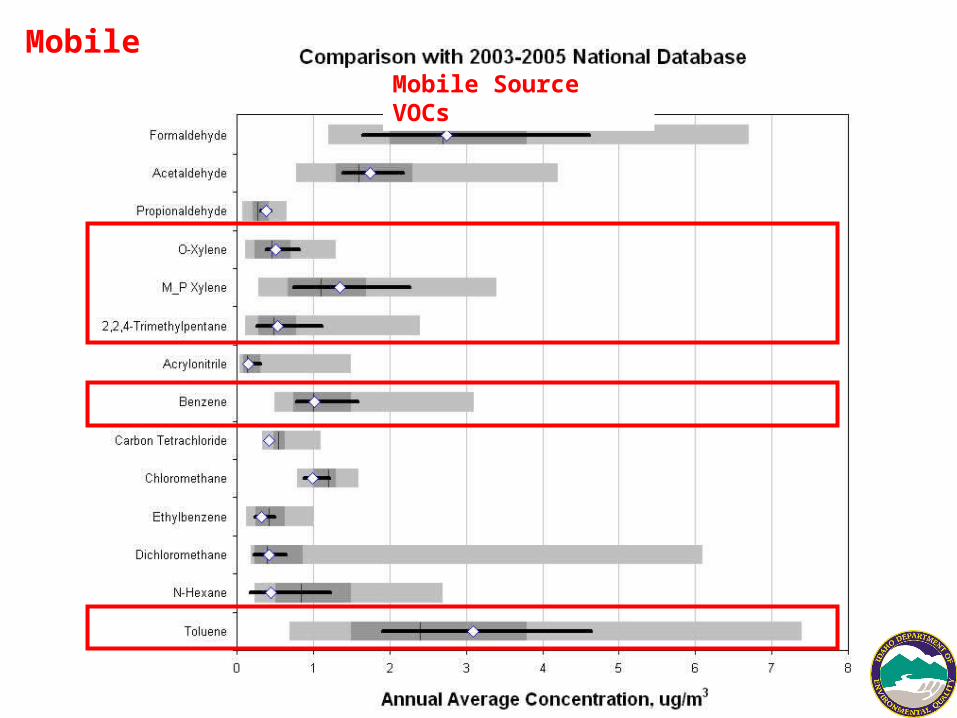
Mobile Source VOCs
Mobile

Aldehydes

Aldehydes

Geologic/Wind Erosion

Geologic/Wind Erosion
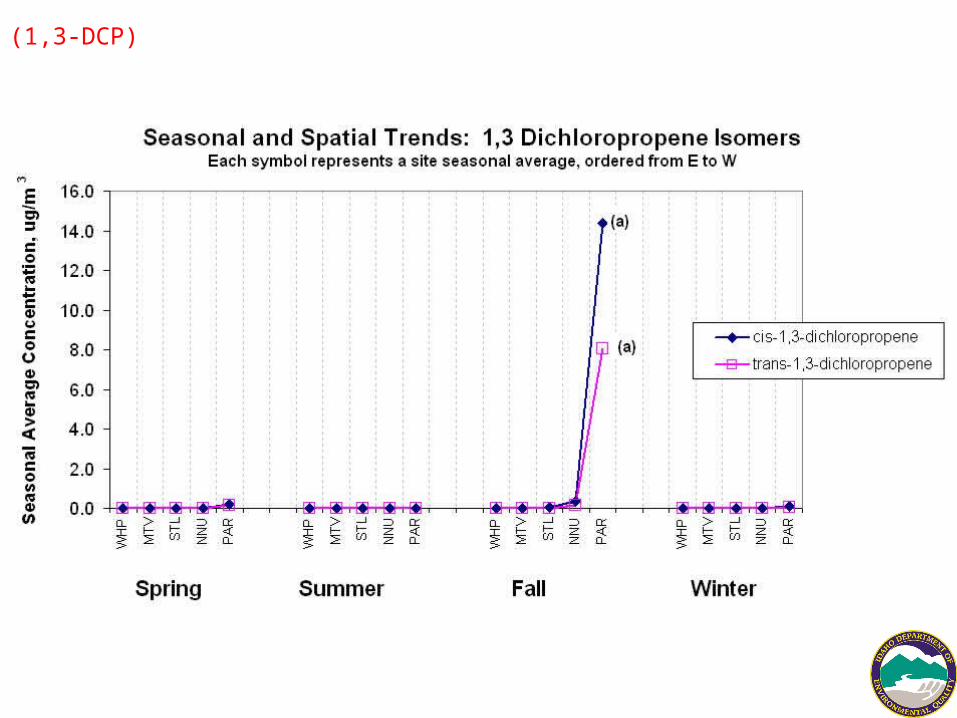
(1,3-DCP)

(1,3-DCP)
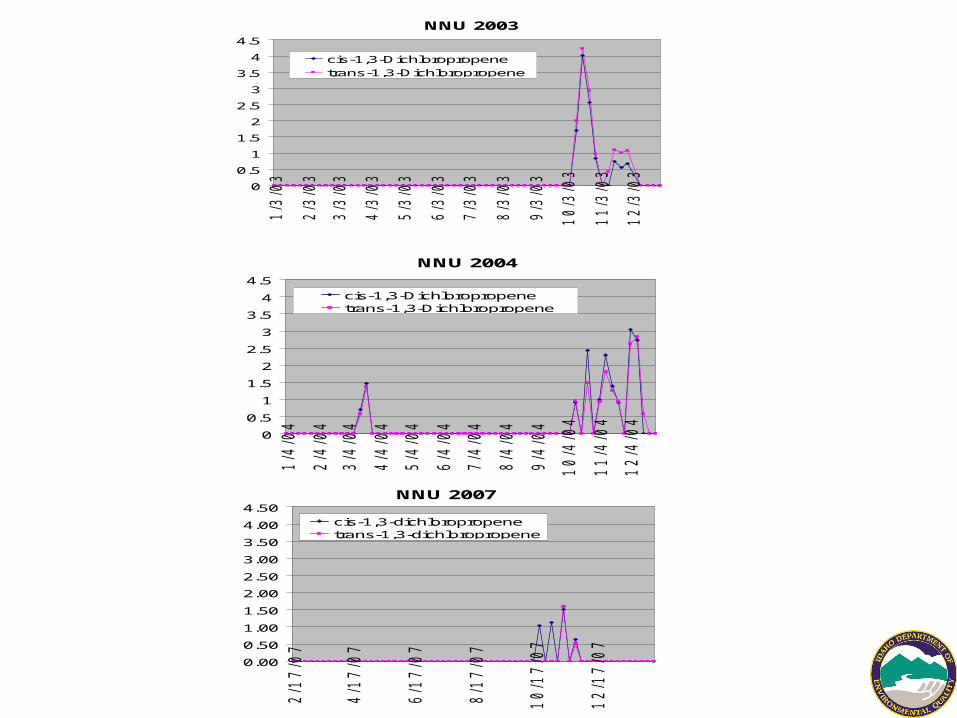
NNU 2003
0
0.5
1
1.5
2
2.5
3
3.5
4
4.5
1/3
/03
2/3
/03
3/3
/03
4/3
/03
5/3
/03
6/3
/03
7/3
/03
8/3
/03
9/3
/03
10/3
/03
11/3
/03
12/3
/03
cis-1,3-Dichloropropene
trans-1,3-Dichloropropene
NNU 2007
0.00
0.50
1.00
1.50
2.00
2.50
3.00
3.50
4.00
4.50
2/1
7/0
7
4/1
7/0
7
6/1
7/0
7
8/1
7/0
7
10
/17
/07
12
/17
/07
cis-1,3-dichloropropenetrans-1,3-dichloropropene
NNU 2004
0
0.5
1
1.5
2
2.5
3
3.5
4
4.51
/4/0
4
2/4
/04
3/4
/04
4/4
/04
5/4
/04
6/4
/04
7/4
/04
8/4
/04
9/4
/04
10
/4/0
4
11
/4/0
4
12
/4/0
4
cis-1,3-Dichloropropenetrans-1,3-Dichloropropene

Dispersion Modeling of 40 Acre 1,3 DCP Treatment, 1st 24-hours
• Industrial Source Complex Area Source Model
• Fall meteorology for Treasure Valley, Idaho
• 1,3 DCP application rate: 177 lb/acre
• Application Acreage: 40 acres
• Total 1,3 DCP Flux (cis + trans) based on peak 24-hour loss of 7% of applied DCP: 1.62e-05 gm/m2-s
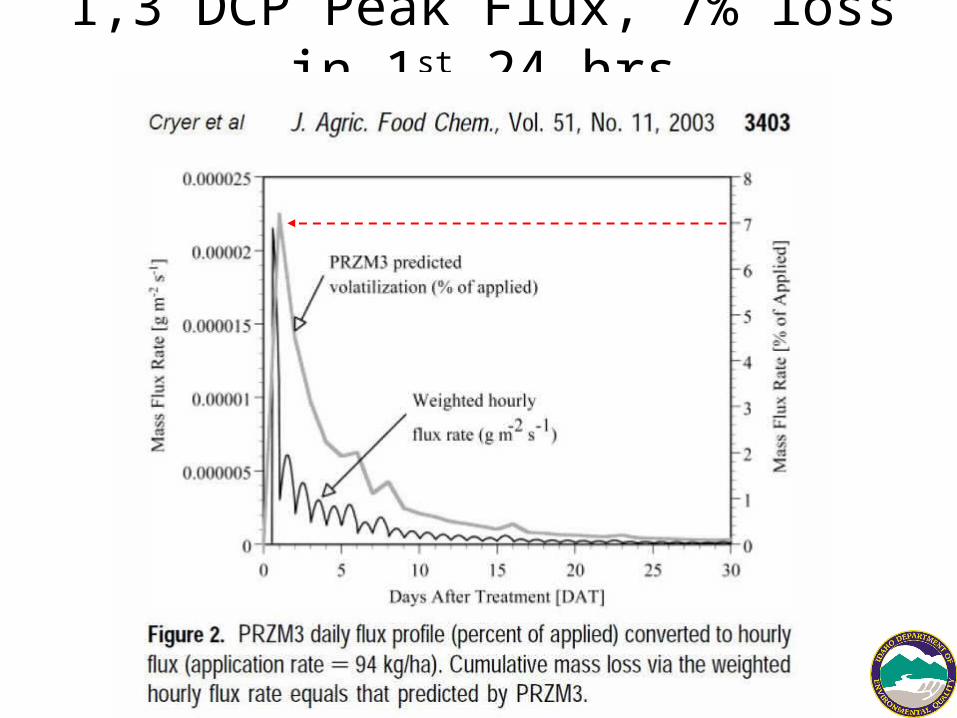
1,3 DCP Peak Flux, 7% loss in 1st 24-hrs

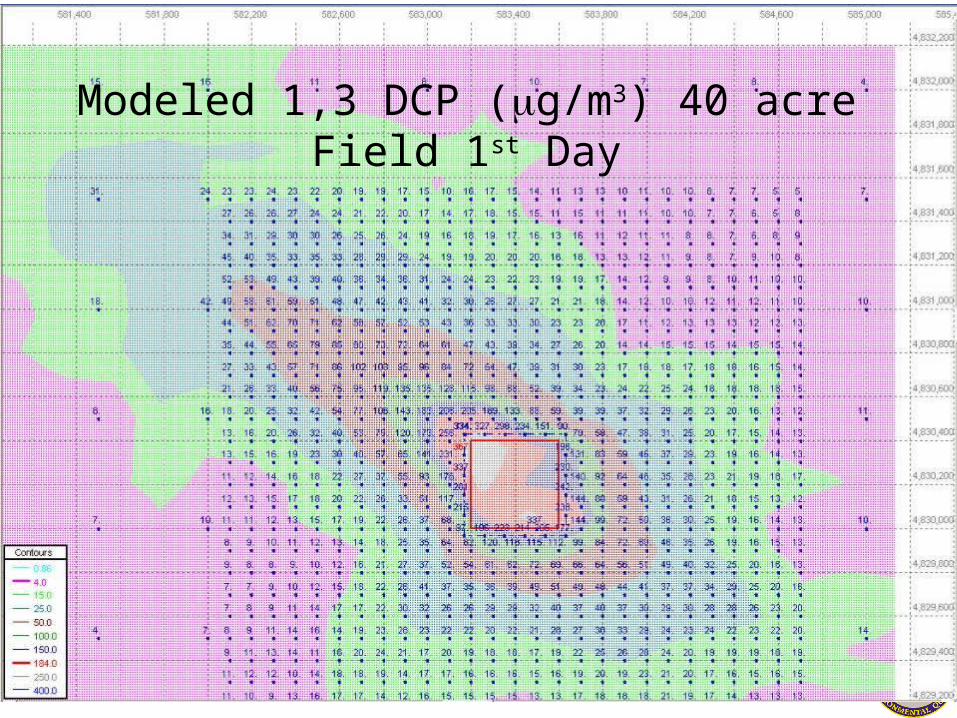
Modeled 1,3 DCP (g/m3) 40 acre Field 1st Day
• Boise Airport meteorology for fall 2007.
• Concentrations represent the highest 1 day total DCP concentration.
•Peak concentration near the field is 367 ug/m3.
•The maximum contour ridge extending toward the NW represents nighttime drainage wind directions when the air is stable.
Modeled 1,3 DCP (g/m3) 40 acre Field 1st Day


Modeled DCP concentration/distance
• For Parma, the observations and model results are consistent for a 40 acre field about 200m to 2500m ( 1/8 to 1.5 miles away).
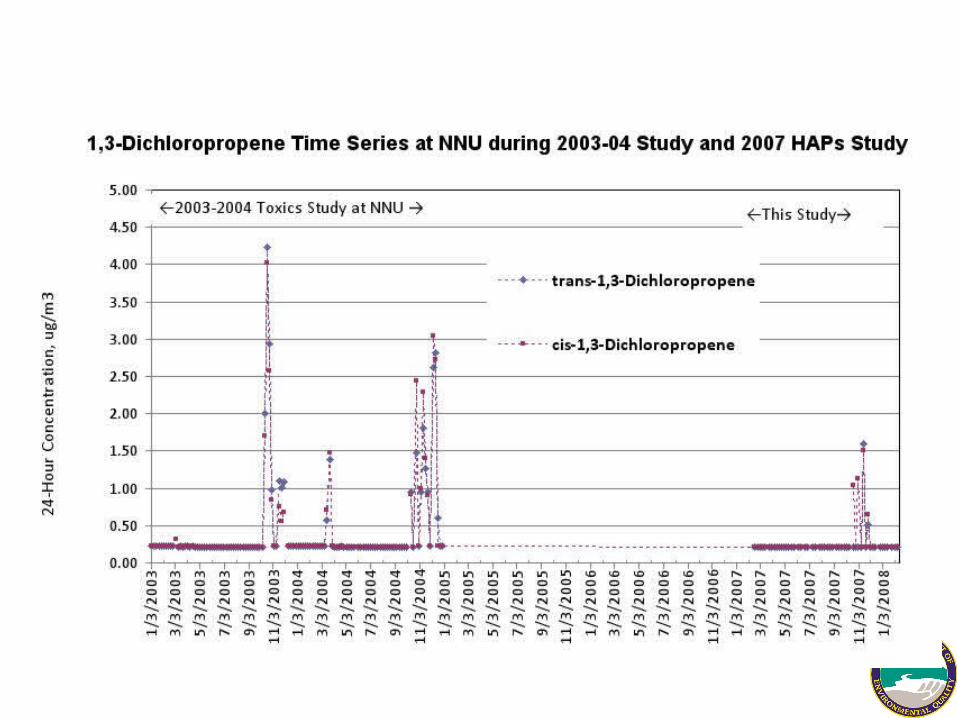
• For NNU, the observations and the model results are consistent for a range of about 7500 to 9500 meters (or 4.6 to 6 miles away) approximately the distance from NNU to the agricultural areas surrounding Nampa.
• Could be multiple fields at greater distances• Model results are reasonably consistent with the
measurements

What about human health risk?
• Conference call with pesticide risk assessor with EPA– 1, 3 DCP concentrations in the range of what EPA
would have expected for rural/agricultural area and not a human health concern
• Health Consultation with Dr. Kai Elgethun (IDHW)

Summary
• Monitored air toxics at 5 sites across the Treasure Valley
• Source attribution/risk screening• Most species at or below national median• 1, 3-DCP

Aldehydes