Western Financial Group Q2 2008 Financial Results Conference Call August 12, 2008.
date post
22-Dec-2015Category
view
215download
1
Western Financial Group2008 Year End Financial Results
Conference Call
March 20, 2009

Forward-Looking StatementsThis presentation contains certain forward-looking statements. Forward-looking statements include, without limitation, statements regarding the future financial position, business strategy, budgets, litigation, projected costs, capital expenditures, financial results, taxes and plans and objectives of or involving Western Financial Group Inc. (the “Company”) or its subsidiaries. Many of these statements can be identified by looking for words such as ‘‘believe’’, ‘‘expects’’, ‘‘expected’’, ‘‘will’’, ‘‘intends’’, ‘‘projects’’, ‘‘anticipates’’, ‘‘estimates’’, ‘‘continues’’ or similar words. The Company believes the expectations reflected in such forward-looking statements are reasonable but no assurance can be given that these expectations will prove to be correct and such forward-looking statements should not be unduly relied upon. Forward-looking statements are not guarantees of future performance and involve a number of risks and uncertainties only some of which are described herein. Many factors could cause the Company’s actual results, performance or achievements to, or future events or developments to, differ materially from those expressed or implied by the forward-looking statements, including, without limitation, the risk factors, which are discussed in greater detail in the ‘‘Risk Factors’’ section of the prospectus. Any forward-looking statements are made as of the date hereof and the Company does not assume any obligation to publicly update or revise such statements to reflect new information, subsequent events or otherwise.Non-GAAP MeasuresThroughout this presentation, the Company may use the term ‘‘operating income’’ to refer to earnings, including investment income, before interest expense, taxes, depreciation and amortization of intangible and capital assets, excluding gain (loss) from the sale of assets and income (loss) from equity investments. The Company uses ‘‘operating income’’ to assist it in measuring corporate performance before the costs of capital and amortization of capital and intangible assets. Operating income is not a measure recognized by GAAP and does not have a standardized meaning prescribed by GAAP. Therefore, this measure may not be comparable to similar measures presented by other issuers and investors are cautioned that it should not be used as an alternative to ‘‘net income’’ or other measures of financial performance calculated in accordance with GAAP.

TSX: WES3
Today’s Remarks• Operational progress in 2008
• Top achievements and disappointments in 2008
• 2008 financial review
• Priorities for 2009

Operational Progress in 2008

TSX: WES5
WFG Agency Network• Same store customer count +3.5%• Same store sales +8.9%• Soft pricing market continued - bottomed out
in Q4• Deteriorating loss ratios at insurance
companies in 2nd half cause adjustment of $1.0 million to 2008 profit share commission estimates

TSX: WES6
WFG Agency NetworkAcquisitions:
• Southern• Simpson• Woodland• Dunn• Vet’s• Boyd • Bakes-Jarvie (Jan 1/09)

TSX: WES7
Western Life Assurance• Sales and production increases – all lines• Certificate count growth 11.5% in 2008• Bolt-on product for network is at 6,400+ policies.
Target was 20,000 by Q2/08, extended through 2008 Y/E - has flattened. Target of 7,500 for Y/E 2009
• Western & Affiliates account for $3.2 million of 2008 net premium revenue
• Smooth CEO transition

TSX: WES8
Bank West
• Loan book stable at $273.4 MM – capacity held for AgriFinancial
• AgriFinancial will add $80 MM in 2009
• Non-performing loans – 1.2% at year end
• Specific provisions at 37 bps
• Overspent on new banking platform
• Bruce Ratzlaff takes helm in November

Top 2 Achievements in 2008

TSX: WES10
Top 2 Achievements in 2008
• Strong market share gains at Network
• Cross sales between WFG/Western Life
Top 4 Disappointments in 2008
TSX: WES12
Top 4 Disappointments in 2008
• “Lost Year” at Bank West – delay in AgriFinancial approvals
• Equity portfolio write-downs – liberalization of policies aggravated the loss
• Execution delays on acquisitions
• Collapse of share price
2008 Financial Review
TSX: WES14
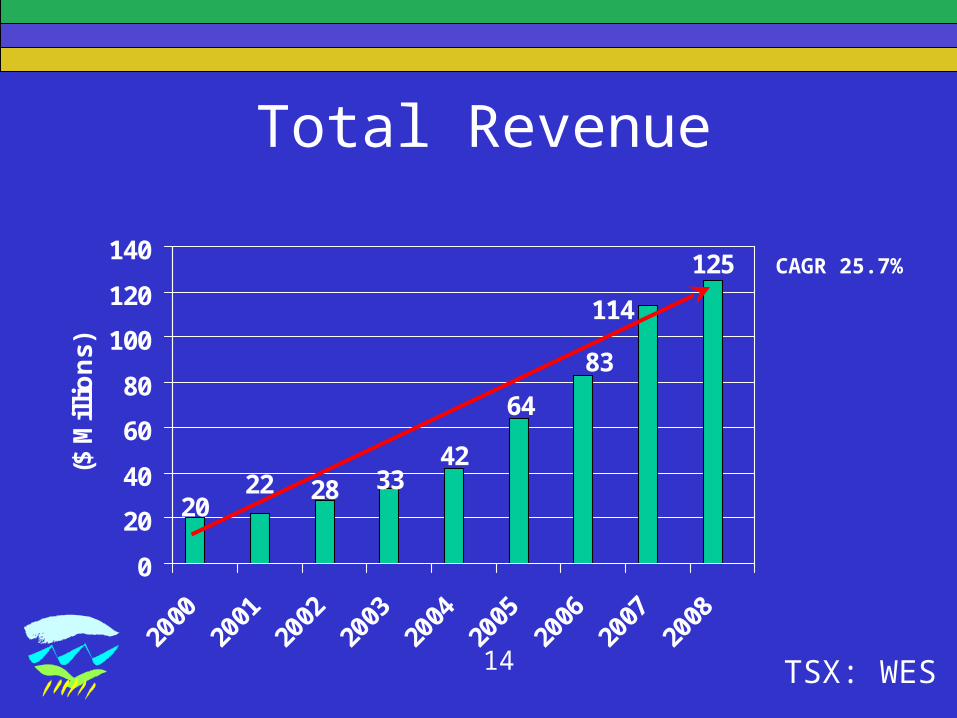
Total Revenue
125
114
20
64
3342
2822
83
0
20
40
60
80
100
120
140
2000
2001
2002
2003
2004
2005
2006
2007
2008
($ M
illi
on
s)
CAGR 25.7%
TSX: WES15
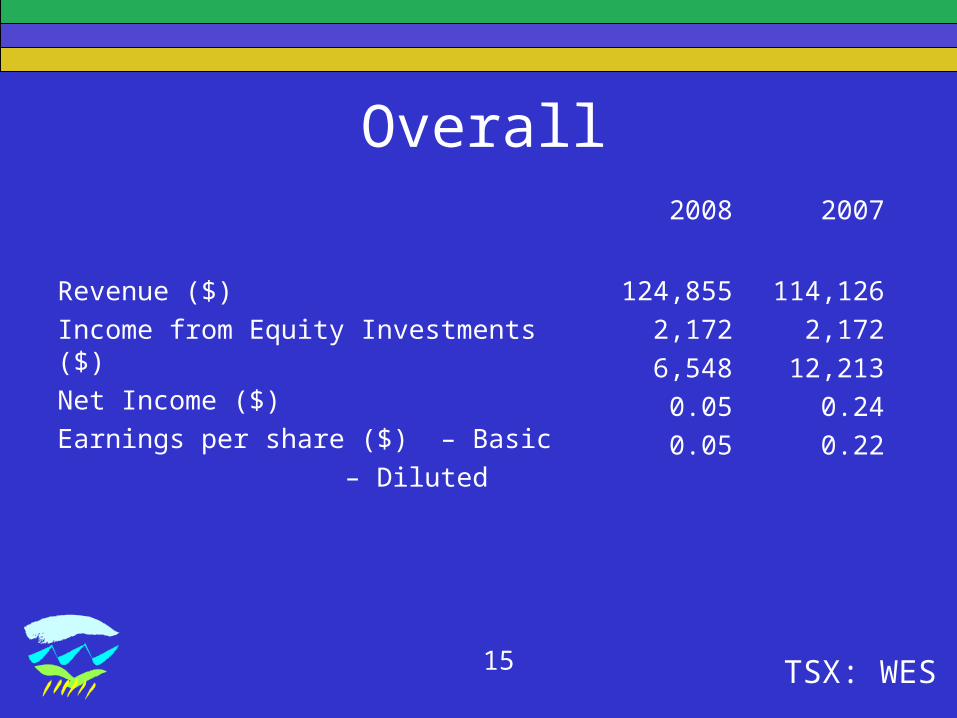
Overall2008 2007
Revenue ($)
Income from Equity Investments ($)
Net Income ($)
Earnings per share ($) – Basic
– Diluted
124,855
2,172
6,548
0.05
0.05
114,126
2,172
12,213
0.24
0.22
TSX: WES16
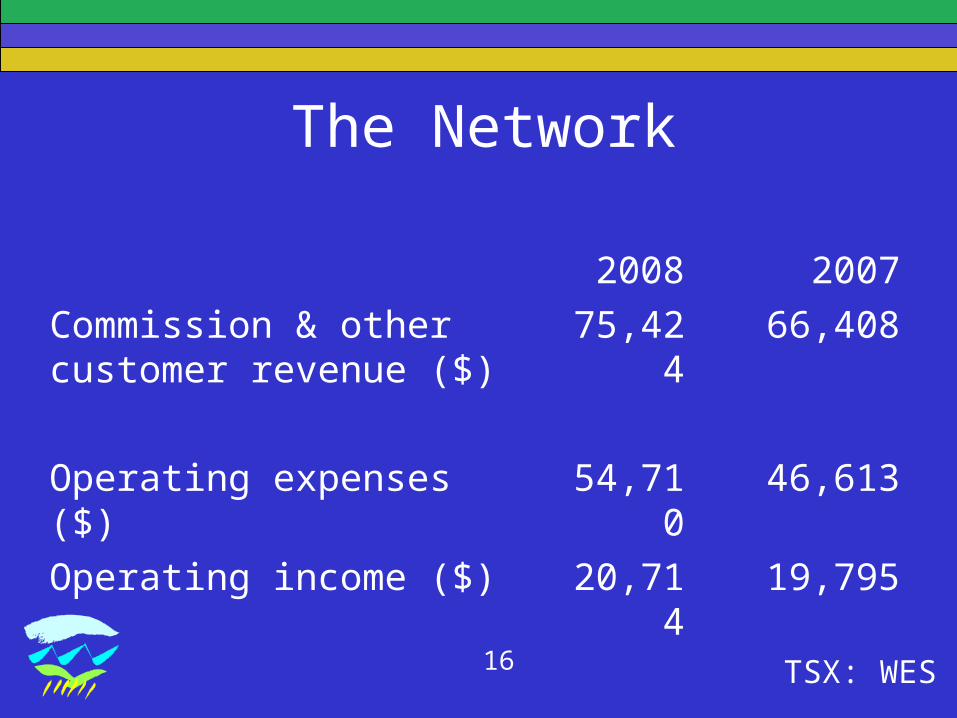
The Network
2008 2007
Commission & other customer revenue ($)
75,424 66,408
Operating expenses ($) 54,710 46,613
Operating income ($) 20,714 19,795
TSX: WES17
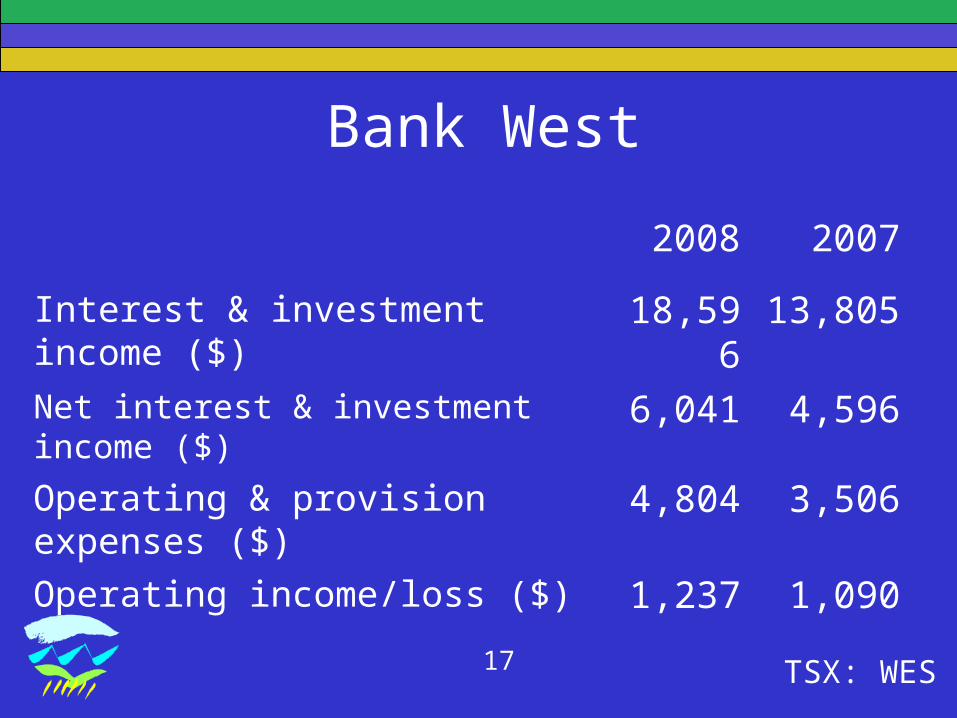
Bank West
2008 2007
Interest & investment income ($) 18,596 13,805Net interest & investment income ($) 6,041 4,596
Operating & provision expenses ($) 4,804 3,506
Operating income/loss ($) 1,237 1,090
TSX: WES18
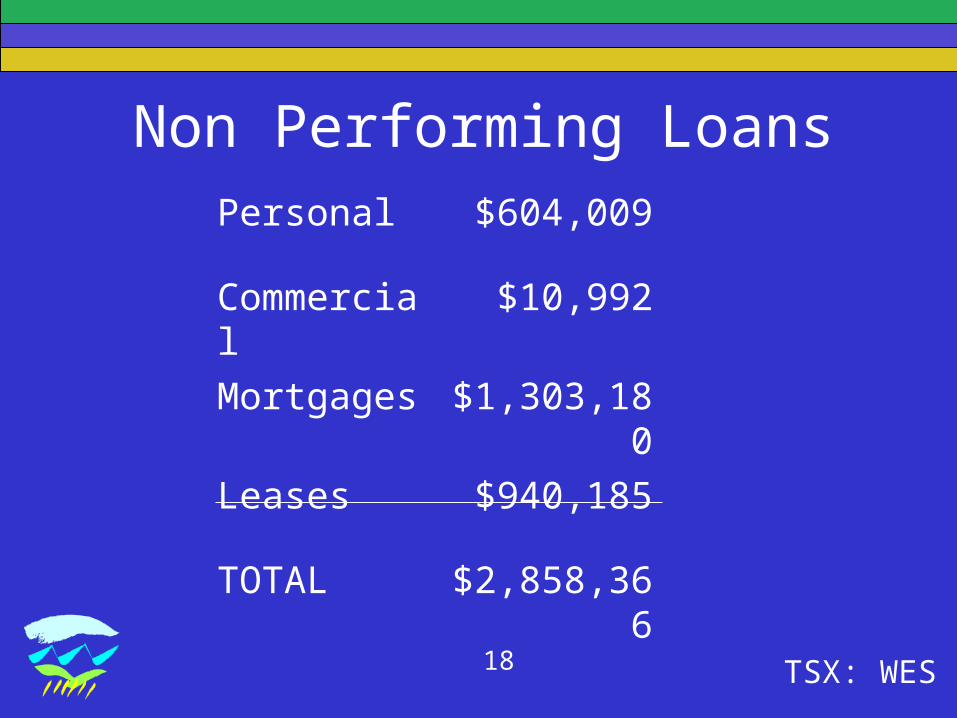
Non Performing LoansPersonal $604,009
Commercial $10,992
Mortgages $1,303,180
Leases $940,185
TOTAL $2,858,366
TSX: WES19
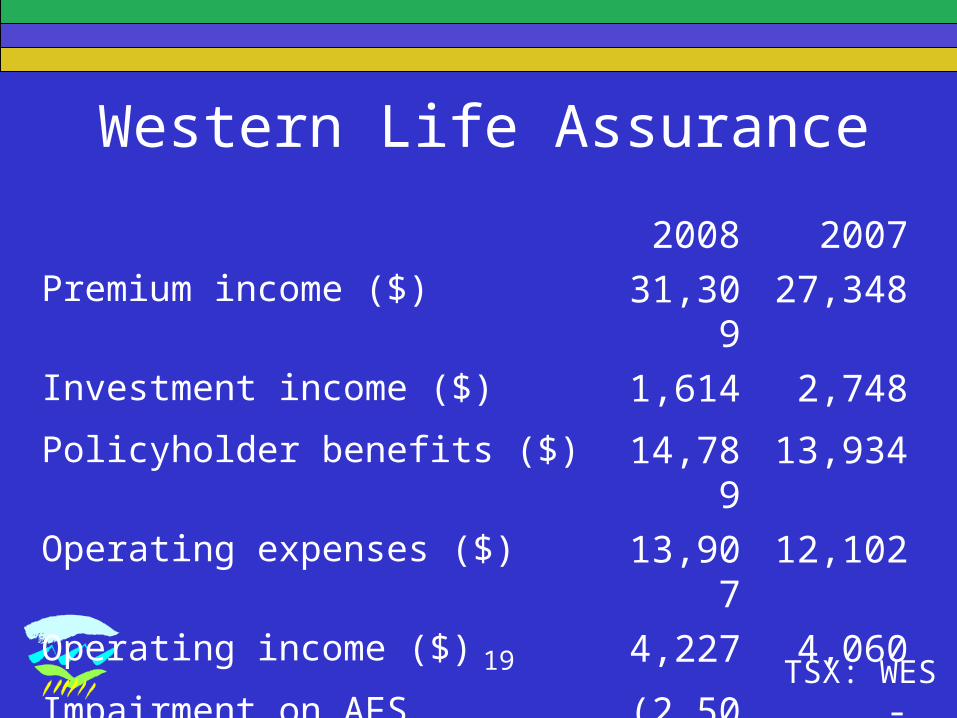
Western Life Assurance
2008 2007
Premium income ($) 31,309 27,348
Investment income ($) 1,614 2,748
Policyholder benefits ($) 14,789 13,934
Operating expenses ($) 13,907 12,102
Operating income ($) 4,227 4,060
Impairment on AFS Investments (2,505) -

TSX: WES20
Corporate & All Other
2008 2007
Other revenues ($) 1,959 3,817
Operating expenses ($) 9,223 9,130
Operating loss ($) (7,264) (5,313)
Impairment on AFS Investments (1,542) -

TSX: WES21
Western Financial GroupHistorical Consolidated ROE
1.9 1.8
8.1
5.6
7.28.3
7.5 8.1 7.9
0123456789
2000
2001
2002
2003
2004
2005
2006
2007
2008
Per
cen
t
TSX: WES22
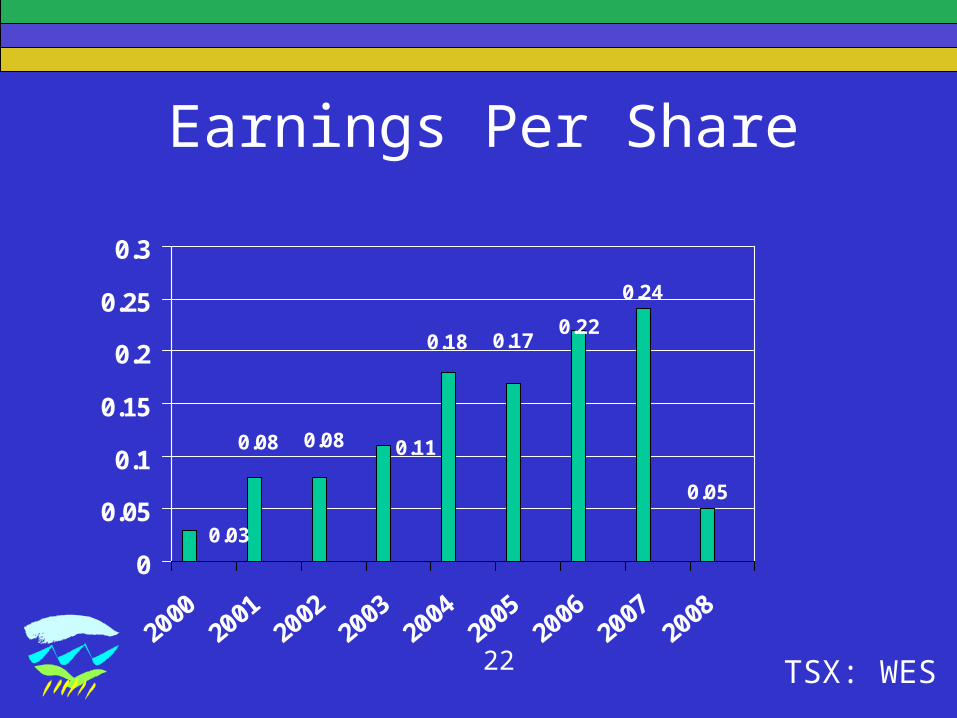
Earnings Per Share
0.24
0.05
0.08 0.08
0.18
0.11
0.17
0.03
0.22
0
0.05
0.1
0.15
0.2
0.25
0.3
2000
2001
2002
2003
2004
2005
2006
2007
2008
TSX: WES23
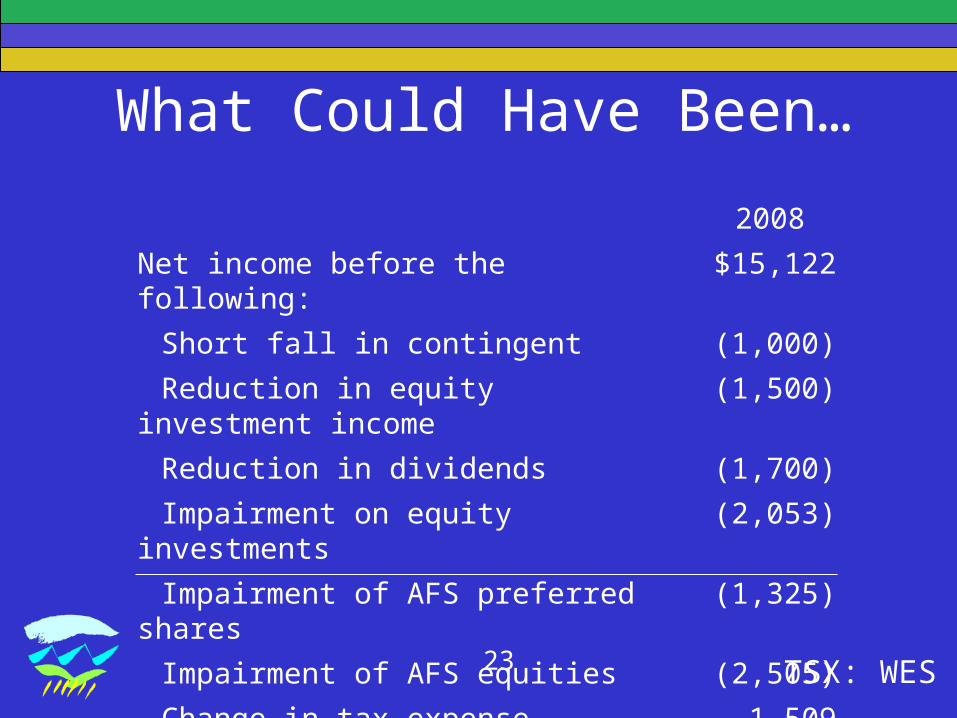
What Could Have Been… 2008
Net income before the following: $15,122
Short fall in contingent (1,000)
Reduction in equity investment income (1,500)
Reduction in dividends (1,700)
Impairment on equity investments (2,053)
Impairment of AFS preferred shares (1,325)
Impairment of AFS equities (2,505)
Change in tax expense 1,509
Net income for the year 6,548

Priorities for 2009

TSX: WES25
2009 Priorities• Manage NPLs at Bank West• Internal growth focus – same store sales, cross
sales, PPCA• Increasing ownership in partner company – HED• Managing costs• Re-establishing profitability• Enhancing brand and reputation

Questions

…because we live here.


![Financial Results Conference Call Transcript [Result]](https://static.fdocuments.in/doc/165x107/577c7a6e1a28abe054952be6/financial-results-conference-call-transcript-result.jpg)