Western Australia’s South West indicators report_2017.pdf · No person should act on the basis...
12
April 2017 Western Australia’s South West www.swdc.wa.gov.au W E S T E R N A U S T R A L I A T H E G O V E R N M E N T O F
-
Upload
truongminh -
Category
Documents
-
view
214 -
download
0
Transcript of Western Australia’s South West indicators report_2017.pdf · No person should act on the basis...

1
April 2017
Western Australia’s South West
www.swdc.wa.gov.au
W
E ST E R N A U S T R ALIA
TH
E GO V E R N M ENT OF

2
DisclaimerIndicators Report: Western Australia’s South West is produced by the South West Development Commission. While every effort was made to ensure that information was correct at the time of publication, we encourage you to seek up-to-date information. No person should act on the basis of any material contained in this document without confirmation or appropriate professional advice.
We’re working on tomorrow, today
WE ST E R N A U S T R ALIA
TH
E
GO V E R N M ENT OF
Harvey Shire
Collie Shire
CapelShire
Boyup Brook Shire
DardanupShire
City of Busselton
NannupShire
Manjimup Shire
DonnybrookBalingup Shire
Bridgetown- Greenbushes Shire
Augusta-Margaret River Shire
• Harvey
• Collie• Eaton
• Donnybrook• Capel
• Bridgetown
• Boyup Brook
• Manjimup
• Margaret River Nannup •
City of Bunbury
City of Busselton
Warren Blackwood SUB-REGIONS
Bunbury Wellington Vasse
The South West Development Commission is part of the WA Government.
We work with communities, government, business and industry to make the South West region of Western Australia an even better place to live, work and invest.
Developing the region’s economy and improving quality of life are key areas of focus.
3
Message from the chairman
Welcome to the latest edition of Progress Indicators: Western Australia’s South West.
It has been produced by the South West Development Commission to provide insight into the state of the region. We expect it will be a useful tool to assist with everything from
research for school assignments to planning and decision-making by business and industry.
We encourage you not only to make use of the information in this document, but to feel free to contact our research officer for any facts and figures about the region you may need.
Our team is also on hand to provide information and guidance in a number of areas, ranging from investment
and trade opportunities to industrial land availability and development.
Our region offers many competitive advantages to those who base their operations in the South West, not least our enviable lifestyle and natural environment.
— Stuart Hicks
Region by the numbers■ Trade through the Bunbury Port reached 16.2
million tonnes in 2015/16
■ The South West’s gross regional product has grown by 35.5 per cent over the past five years
■ Population has continued to grow by an annual average of 2.4 per cent over the past five years
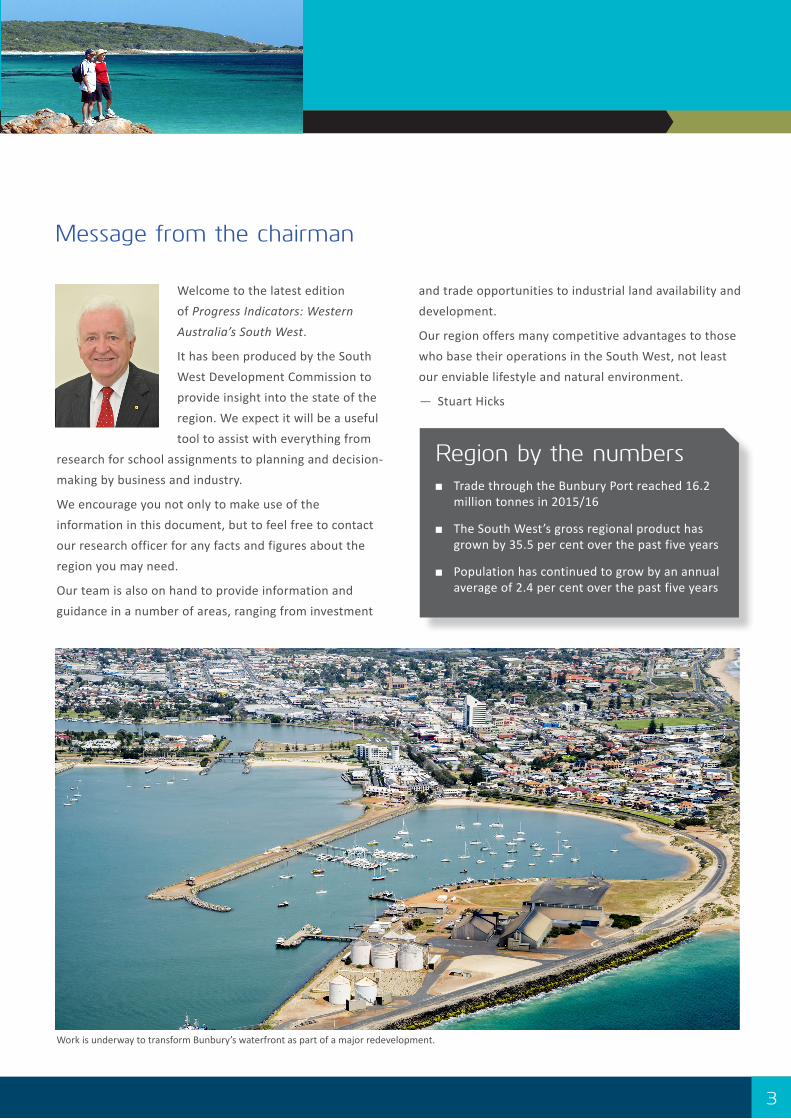
Work is underway to transform Bunbury’s waterfront as part of a major redevelopment.

4
South West: a dynamic, evolving regionThe South West Region has achieved an average annual population growth of 2.1 per cent over the past five years and continues to have a strong, diversified economy. The region’s contribution to Western Australia’s Gross State Product has remained steady at more than 6 per cent over the past decade.
The region remains a preferred place to live with the most recent Living in the Regions survey indicating that of all the regions in WA, the South West was highest in a number of categories which included happiness, lifestyle and safety.
The Regional Prices Index calculated that the South West had lower housing costs than the Perth Metro area. Operational aged care housing in the region had a record increase in operational places of 8.9 per cent in 2013/14. With the steady increase in population in the South West, the aged care places ratio (places per 1000 people aged 70 years and over) increased to 104.
With production valued at approximately $2.4 billion for the 2015/16 year, mining and mineral processing remains the largest industry contributor to gross regional product. Alumina was the largest commodity in terms of value followed by coal and heavy mineral sands.
During 2015/16, nearly all of the bulk mineral production was shipped out of the Bunbury Port. The Port recorded 16.2 million tonnes of trade in 2015/16.
Economic overview
Record retail turnover in the South West of just over $2 billion in 2014/15 has been supported by strong investment in housing and commercial construction, with $720 million of new development approved in 2015/16, particularly around the two regional cities of Bunbury and Busselton.
New shopping centres have opened in Eaton and Dalyellup, with further retail expansion at existing shopping centres in Greater Bunbury recently completed.
There has been continued strong growth for the tourism industry with 2015 being a record year. Total visitors to the region approached five million and total visitor expenditure was valued at a $1.37 billion.
The value of agricultural production for the region has remained steady with the main commodity sectors being vegetables, milk and fruit.
Areas of opportunity for future growth remain in the inland areas of the Warren Blackwood which has comparative advantages in horticulture and beef production. There is also potential for growth at Collie once uncertainty in relation to coal operations reduces.These opportunities will contribute to reverse the slight slowdown in GDP growth attributable to reduced investment in the mining and mineral processing sectors.
AT A GLANCE
Bunbury Port’s top four export commodities
traded in 2015/16
Alumina: 74%Woodchips: 11%Mineral Sands: 4%Spodumene: 3%
* % based on tonnage
5
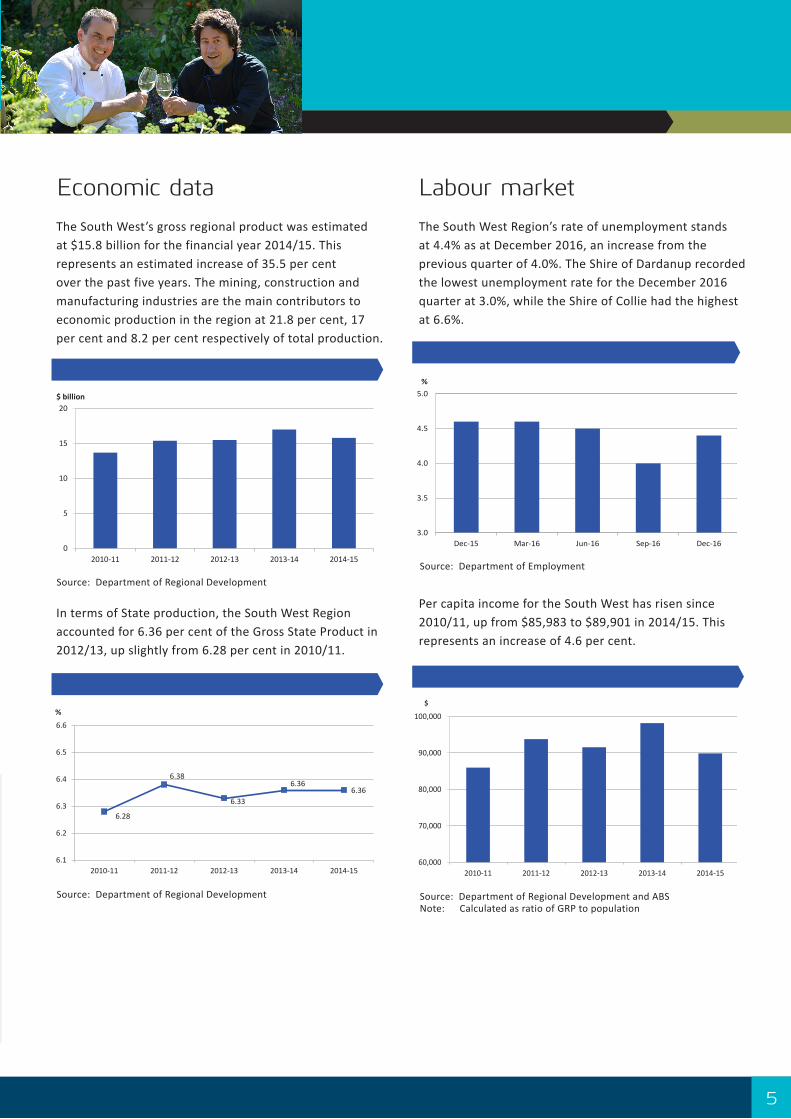
The South West’s gross regional product was estimated at $15.8 billion for the financial year 2014/15. This represents an estimated increase of 35.5 per cent over the past five years. The mining, construction and manufacturing industries are the main contributors to economic production in the region at 21.8 per cent, 17 per cent and 8.2 per cent respectively of total production.
The South West Region’s rate of unemployment stands at 4.4% as at December 2016, an increase from the previous quarter of 4.0%. The Shire of Dardanup recorded the lowest unemployment rate for the December 2016 quarter at 3.0%, while the Shire of Collie had the highest at 6.6%.
In terms of State production, the South West Region accounted for 6.36 per cent of the Gross State Product in 2012/13, up slightly from 6.28 per cent in 2010/11.
Per capita income for the South West has risen since 2010/11, up from $85,983 to $89,901 in 2014/15. This represents an increase of 4.6 per cent.
Gross Regional Product
Source: Department of Regional Development
Source: Department of Regional Development
Source: Department of Employment
Source: Department of Regional Development and ABS Note: Calculated as ratio of GRP to population
Unemployment Rate
Percentage of Gross State Product Per Capita Income
Economic data Labour market
3.0
3.5
4.0
4.5
5.0
Dec-15 Mar-16 Jun-16 Sep-16 Dec-16
%
0
5
10
15
20
2010-11 2011-12 2012-13 2013-14 2014-15
$ billion
60,000
70,000
80,000
90,000
100,000
2010-11 2011-12 2012-13 2013-14 2014-15
$
6.28
6.38
6.33
6.36 6.36
6.1
6.2
6.3
6.4
6.5
6.6
2010-11 2011-12 2012-13 2013-14 2014-15
%
6
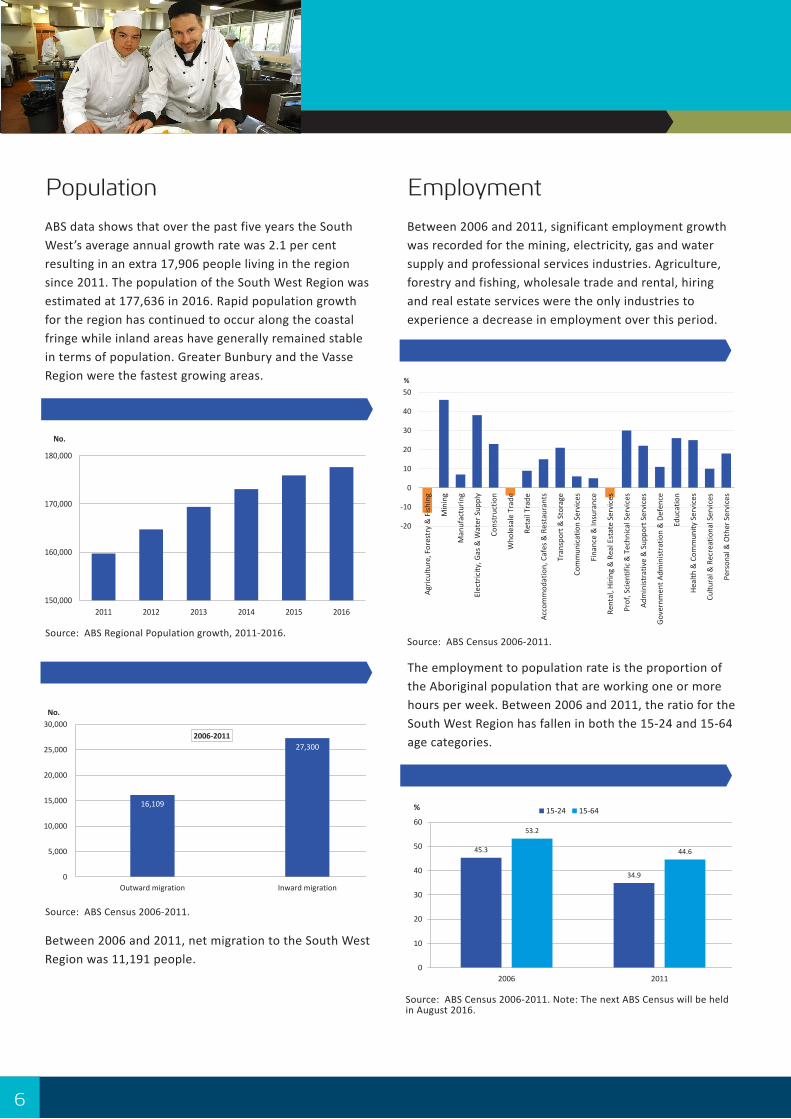
Between 2006 and 2011, significant employment growth was recorded for the mining, electricity, gas and water supply and professional services industries. Agriculture, forestry and fishing, wholesale trade and rental, hiring and real estate services were the only industries to experience a decrease in employment over this period.
The employment to population rate is the proportion of the Aboriginal population that are working one or more hours per week. Between 2006 and 2011, the ratio for the South West Region has fallen in both the 15-24 and 15-64 age categories.
Employment by Industry (change 2006-2011)
Aboriginal Employment to Population Ratio
EmploymentABS data shows that over the past five years the South West’s average annual growth rate was 2.1 per cent resulting in an extra 17,906 people living in the region since 2011. The population of the South West Region was estimated at 177,636 in 2016. Rapid population growth for the region has continued to occur along the coastal fringe while inland areas have generally remained stable in terms of population. Greater Bunbury and the Vasse Region were the fastest growing areas.
Between 2006 and 2011, net migration to the South West Region was 11,191 people.
Population Growth
Source: ABS Regional Population growth, 2011-2016.
Population Mobility (2006-2011)
Population
-20
-10
0
10
20
30
40
50
Agric
ultu
re, F
ores
try
& F
ishin
g
Min
ing
Man
ufac
turin
g
Elec
tric
ity, G
as &
Wat
er S
uppl
y
Cons
truc
tion
Who
lesa
le T
rade
Reta
il Tr
ade
Acco
mm
odat
ion,
Caf
es &
Res
taur
ants
Tran
spor
t & S
tora
ge
Com
mun
icat
ion
Serv
ices
Fina
nce
& In
sura
nce
Rent
al, H
iring
& R
eal E
stat
e Se
rvic
es
Prof
, Sci
entif
ic &
Tec
hnic
al S
ervi
ces
Adm
inist
rativ
e &
Sup
port
Ser
vice
s
Gove
rnm
ent A
dmin
istra
tion
& D
efen
ce
Educ
atio
n
Heal
th &
Com
mun
ity S
ervi
ces
Cultu
ral &
Rec
reat
iona
l Ser
vice
s
Pers
onal
& O
ther
Ser
vice
s
%
150,000
160,000
170,000
180,000
2011 2012 2013 2014 2015 2016
No.
16,109
27,300
0
5,000
10,000
15,000
20,000
25,000
30,000
Outward migration Inward migration
No.
2006-2011
53.2
44.6 45.3
34.9
0
10
20
30
40
50
60
2006 2011
% 15-24 15-64
Source: ABS Census 2006-2011.
Source: ABS Census 2006-2011. Note: The next ABS Census will be held in August 2016.
Source: ABS Census 2006-2011.
7
Industry and business
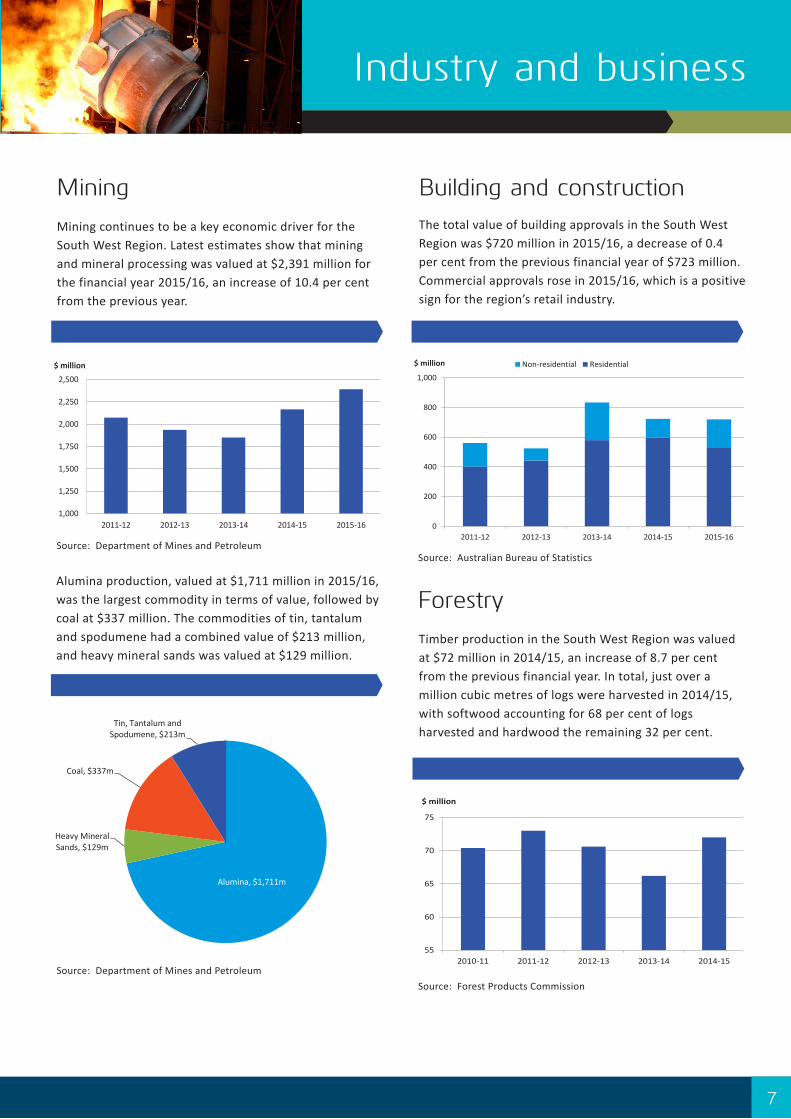
Mining continues to be a key economic driver for the South West Region. Latest estimates show that mining and mineral processing was valued at $2,391 million for the financial year 2015/16, an increase of 10.4 per cent from the previous year.
Alumina production, valued at $1,711 million in 2015/16, was the largest commodity in terms of value, followed by coal at $337 million. The commodities of tin, tantalum and spodumene had a combined value of $213 million, and heavy mineral sands was valued at $129 million.
The total value of building approvals in the South West Region was $720 million in 2015/16, a decrease of 0.4 per cent from the previous financial year of $723 million. Commercial approvals rose in 2015/16, which is a positive sign for the region’s retail industry.
Value of Mining
Source: Department of Mines and Petroleum
Source: Department of Mines and Petroleum
Source: Australian Bureau of Statistics
Mining Commodities
Value of Building Approvals
Mining Building and construction
Timber production in the South West Region was valued at $72 million in 2014/15, an increase of 8.7 per cent from the previous financial year. In total, just over a million cubic metres of logs were harvested in 2014/15, with softwood accounting for 68 per cent of logs harvested and hardwood the remaining 32 per cent.
Source: Forest Products Commission
Timber Production
Forestry
0
200
400
600
800
1,000
2011-12 2012-13 2013-14 2014-15 2015-16
$ million Non-residential Residential
1,000
1,250
1,500
1,750
2,000
2,250
2,500
2011-12 2012-13 2013-14 2014-15 2015-16
$ million
Alumina, $1,711m
Heavy Mineral Sands, $129m
Coal, $337m
Tin, Tantalum and Spodumene, $213m
55
60
65
70
75
2010-11 2011-12 2012-13 2013-14 2014-15
$ million

8
Trade data for the Bunbury Port shows total throughput at 16.2 million tonnes for 2015/16, a slight decrease on the previous year. Exports remained stable for the year while imports decreased by 1 per cent.
The major commodity exported through the port in 2015/16 was alumina at 10.7 million tonnes, followed by woodchips at 1.6 million tonnes and mineral sands at 592 thousand tonnes. Wheat exports, which commenced in 2014, had a total of 154,640 tonnes exported in 2015/16.
Total Port Trade (tonnes)
Source: Southern Ports Authority
Source: Southern Ports Authority
Commodity Exports (% based on tonnage)
Bunbury Port
10
11
12
13
14
15
16
17
2011-12 2012-13 2013-14 2014-15 2015-16
Mt Total imports Total exports
74%
4%
11%
2% 0%
2% 1% 2% 1%
AluminaMineral SandsWoodchipsSilica SandSpodumeneTimberGrainCopper ConcentrateIron Oxide
Retail turnover in the South West Region was estimated at $2,023 million in 2014/15, an increase of 2.8 per cent over the previous year. The South West retail sector is continuing its strong growth record over the last decade, driven mainly by population growth as well as a newer and more diverse range of retail outlets.
Source: Department of Regional Development
Retail Turnover
Retail
ABS data shows that total agricultural production in the South West Region was $637 million in 2014/15. The major contributors to agricultural production in 2014/15 were fruit ($129.4 million), vegetables ($101.7 million), milk ($141.4 million), cattle ($80.5 million), grapes ($41.8 million) and pasture cut for hay ($25.7 million). The shires of Harvey, Manjimup and Busselton were the largest in the region in terms agricultural production values.
Agricultural Production
Source: Australian Bureau of Statistics Note: Data is based on the ABS Bunbury SA4 Region, which includes the Shire of Waroona.
Agriculture
450
500
550
600
650
700
2010-11 2011-12 2012-13 2013-14 2014-15
$ million
1,500
1,600
1,700
1,800
1,900
2,000
2,100
2010-11 2011-12 2012-13 2013-14 2014-15
$ million
9
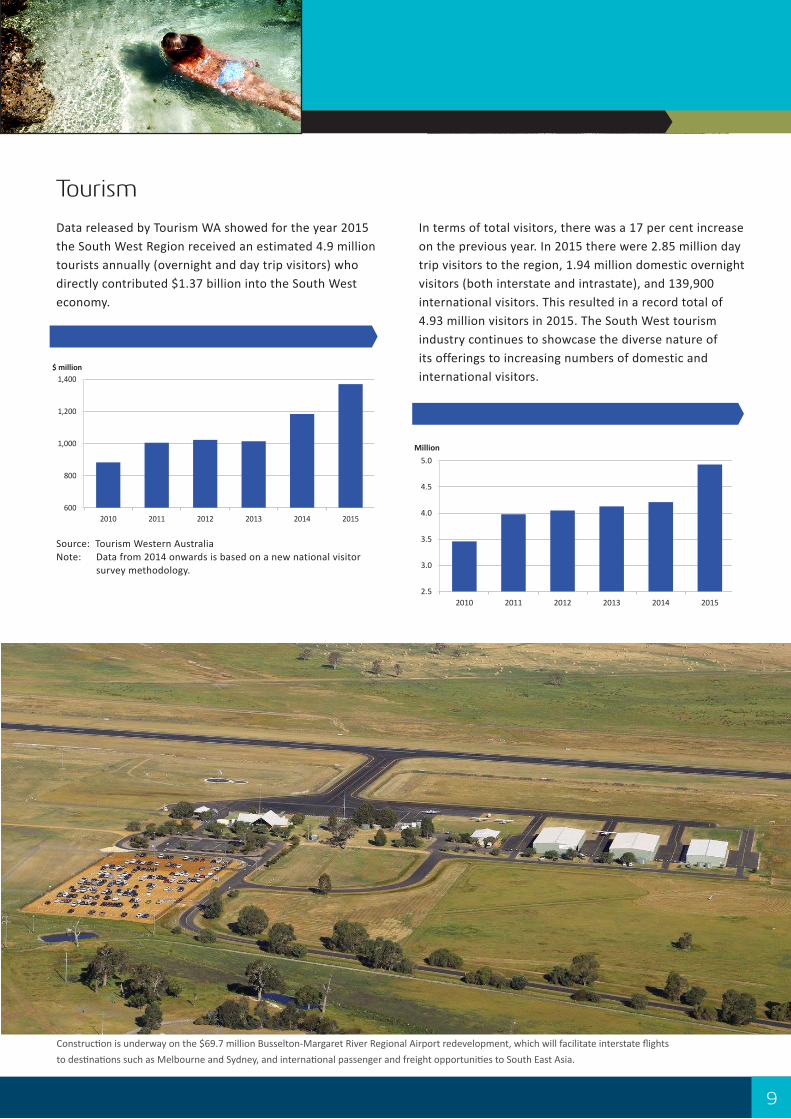
Data released by Tourism WA showed for the year 2015 the South West Region received an estimated 4.9 million tourists annually (overnight and day trip visitors) who directly contributed $1.37 billion into the South West economy.
In terms of total visitors, there was a 17 per cent increase on the previous year. In 2015 there were 2.85 million day trip visitors to the region, 1.94 million domestic overnight visitors (both interstate and intrastate), and 139,900 international visitors. This resulted in a record total of 4.93 million visitors in 2015. The South West tourism industry continues to showcase the diverse nature of its offerings to increasing numbers of domestic and international visitors.
Source: Tourism Western Australia Note: Data from 2014 onwards is based on a new national visitor survey methodology.
Total Visitor Expenditure
Total Visitors
Tourism
600
800
1,000
1,200
1,400
2010 2011 2012 2013 2014 2015
$ million
2.5
3.0
3.5
4.0
4.5
5.0
2010 2011 2012 2013 2014 2015
Million
Construction is underway on the $69.7 million Busselton-Margaret River Regional Airport redevelopment, which will facilitate interstate flights to destinations such as Melbourne and Sydney, and international passenger and freight opportunities to South East Asia.
10
Education
Aboriginal Education and Training
The SEIFA Index of Education and Occupation is designed to reflect the educational and occupational level of communities. The education variables in this index show either the level of qualification achieved or whether further education is being undertaken. Between 2006 and 2011, all local government areas in the South West Region recorded a lower SEIFA score except for Bridgetown-Greenbushes, Collie and Nannup. This indicates a relatively lower education and occupation status of people in these areas where a decrease was recorded.
SEIFA Index of Education and Occupation
The percentage of Aboriginal students in the South West Region completing year 12 has risen from 17.7 per cent in 2006 to 23.2 per cent. However, over the same period the percentage of Aboriginal students in the South West involved in technical or tertiary studies has fallen from 6.4 per cent to 4.7 per cent.
Source: Department of Health
The number of operational aged care places (which includes both residential care places and home care places) in the South West Region increased in 2015/16. In June 2016 there were 1,884 operational aged care places in the region, up from 1,810 recorded in June 2015. This represents an increase of 4.1 per cent over the 12 month period. This increase translates into an aged care ratio (places per 1,000 people aged 70 years and over) of 105.
Aged Care Places
Aged care
0 2 4 6 8 10
Collie
Nannup
Bridgetown - Greenbushes
Augusta - Margaret River
Boyup Brook
Bunbury
Busselton
Capel
Dardanup
Donnybrook-Balingup
Harvey
Manjimup2011 decile2006 decile
0
5
10
15
20
25
2006 2011
% Percentage students completing Year 12Percentage completing post secondary studies
1,000
1,200
1,400
1,600
1,800
2,000
2013-14 2014-15 2015-16
Number Total operational aged care places
People and Place
Source: ABS Census 2006-2011. Note: The next ABS Census will be held in August 2016.
Source: ABS Census 2006-2011. Note: The next ABS Census will be held in August 2016.
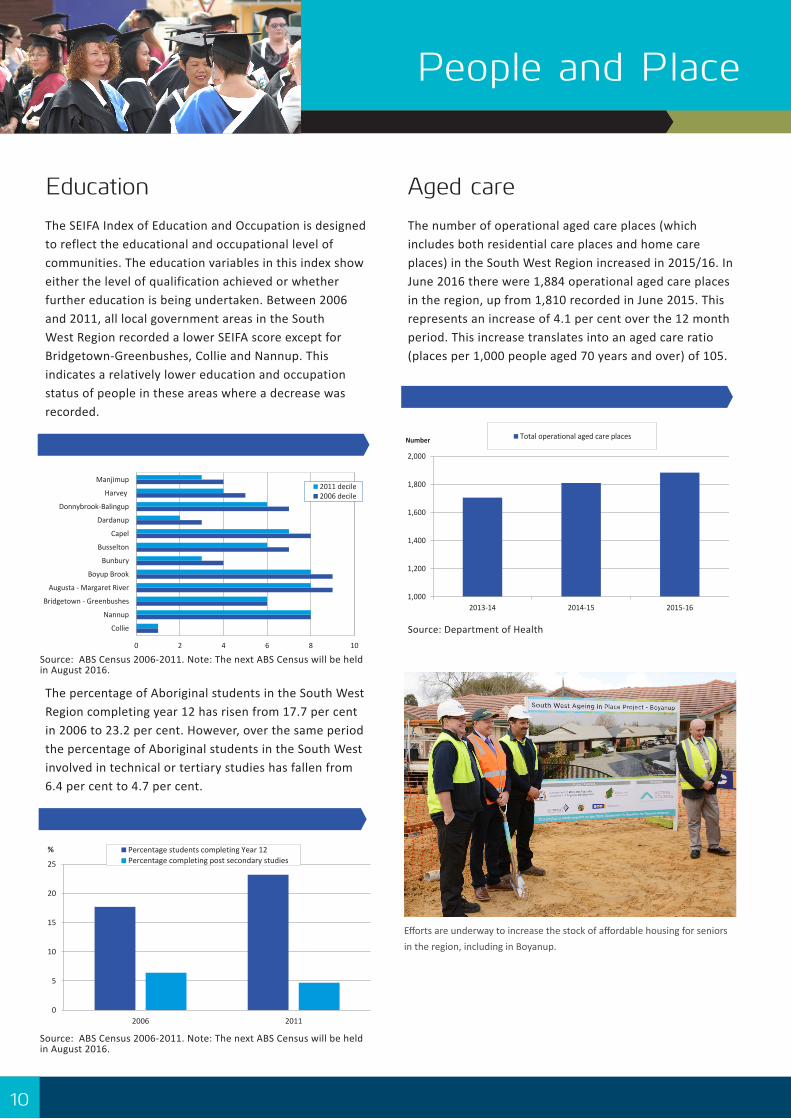
Efforts are underway to increase the stock of affordable housing for seniors in the region, including in Boyanup.
11
Source: WA Police Department
Source: Department of Regional Development
SafetyHousing prices in the South West Region have remained relatively stable since 2012. The current median house prices for the four large regional centres in the South West are significantly lower than that of the Perth Metro area.
The Regional Prices Index contrasts the cost of housing in the South West Region to the Perth Metropolitan Area. The housing index includes the cost of rates and charges, rents, utility costs, credit charges and insurance. For both 2011 and 2013, the South West Region had lower housing costs than the Perth Metro area, with an index rating of 93.4 and 95.0 respectively. In 2013, the regional centre of Bunbury was significantly less expensive for housing than the Perth Metro area with an index rating of 92.7.
Median House Price
Housing
Source: Real Estate Institute of WA
Criminal Offences
Regional Prices Index
Criminal offences in the South West police district increased by 10.8 per cent in 2015/16. Both categories of offences (crimes against the person and crimes against property) recorded an increase over this period.
In terms of why people choose to the live in the South West Region, the latest Living in the Regions Survey for 2013 shows that people living in the South West enjoy their lifestyle more than in comparison to their Perth and regional counterparts. South West respondents also rated the highest of all the regions in seven of the nine attitude ratings categories. Key reasons why South West respondents like living in the region include happiness, lifestyle and safety.
Living in the South West (benefits 2013)
Source: Department of Regional Development
Lifestyle
0
2,000
4,000
6,000
8,000
10,000
12,000
14,000
2011-12 2012-13 2013-14 2014-15 2015-16
No. Total offences against the personTotal offences against property
90
92
94
96
98
100
South West Bunbury Busselton Perth
Index 2011 2013
0 2 4 6 8 10
Happiness
Lifestyle
Safety
Health and wellbeing
Sense of community
Connectedness
Financial situation
Employment prospects
Education and training
South WestRegional WAMetropolitan
100,000
200,000
300,000
400,000
500,000
600,000
2012 2013 2014 2015 2016
$
Bunbury Urban Area Busselton Urban AreaCollie ManjimupPerth Metro

12
W
E ST E R N A U S T R ALIA
TH
E
GO V E R N M ENT OF
South West Indicators Report
South West Development Commission61 Victoria Street, PO Box 2000 Bunbury WA 6231
T: 08 9792 2000 ∙ E: [email protected]
Photo credits: South West Development Commission, Tourism WA