West Virginia Wesleyan College Fact Book - wvwc.edu · PDF file• Demonstrate their local...
43
0 2016 West Virginia Wesleyan College Fact Book COMPILED BY TAMMY CRITES, DIRECTOR OF INSTITUTIONAL RESEARCH
Transcript of West Virginia Wesleyan College Fact Book - wvwc.edu · PDF file• Demonstrate their local...
0
2016
West Virginia Wesleyan College Fact Book
COMPILED BY
TAMMY CRITES, DIRECTOR OF INSTITUTIONAL RESEARCH

1
Table of Contents Mission and Organizational Structure ........................................................................................................................................ 2
West Virginia Wesleyan College Statement of Mission .................................................................................................... 3
Wesleyan Accreditation ................................................................................................................................................... 3
Organizational Chart Fall 2016-17 .................................................................................................................................... 4
West Virginia Wesleyan College Administrative Execute Officers 2016-2017 ................................................................... 5
Administrative Executive Officers .................................................................................................................................... 5
Staff Council Officers 2016-17 .......................................................................................................................................... 5
West Virginia Wesleyan College Academic Structure 2016-17 .......................................................................................... 6
Academic School Directors ............................................................................................................................................... 7
Faculty Senate 2016-17 .................................................................................................................................................... 7
Executive Committee of Faculty Assembly ....................................................................................................................... 7
Fall 2016 New Students .............................................................................................................................................................. 8
First-time Full-time Freshmen Financial Aid Profile ........................................................................................................ 12
Fall 2016 Student Body ............................................................................................................................................................. 13
Historical Enrollment Summary ..................................................................................................................................... 13
Fall 2016 All Students by Gender, Race and Ethnicity ..................................................................................................... 18
Declared Academic First and Second Majors by School- Fall 2016 .................................................................................. 20
All Student Athletes by Scholarship Status ..................................................................................................................... 25
Student Outcomes .................................................................................................................................................................... 26
Institutional Yearly Retention Rates .............................................................................................................................. 27
Yearly Retention and Graduation Rates ......................................................................................................................... 28
Degrees Awarded by Major Field of Study ..................................................................................................................... 29
2015201520152015----2016 Placement Report2016 Placement Report2016 Placement Report2016 Placement Report ........................................................................................................................................... 33
Faculty and Staff ....................................................................................................................................................................... 34
Fall 2016 Employee Summary ........................................................................................................................................ 35
Faculty Profile ................................................................................................................................................................ 36
Financials and Fund Raising ...................................................................................................................................................... 37
Unrestricted Revenues and Gains .................................................................................................................................. 38
Expenditures by Category .............................................................................................................................................. 39
Giving by Source ............................................................................................................................................................ 40
West Virginia Wesleyan College Benchmark Institutions ............................................................................................... 42

2
Mission and Organizational StructureMission and Organizational StructureMission and Organizational StructureMission and Organizational Structure

3
West Virginia Wesleyan College Statement of Mission
West Virginia Wesleyan College challenges its students to a life-long commitment to develop their intellectual, ethical,
spiritual, and leadership potential and to set and uphold standards of excellence. Firmly rooted in the liberal arts tradition
and closely related to The United Methodist Church, the College is a community of learning based on fundamental
principles formed at the intersection of Christian faith and liberal education: intellectual rigor, self-discovery, human
dignity, mutual support, social justice, self-discipline, mental and physical wellness, the appreciation of diversity and the
natural world, and the judicious use of resources. The College recognizes and affirms its interdependence with the external
communities - local, regional, national, and global - and its covenant with the people of West Virginia to share its
educational and cultural resources.
West Virginia Wesleyan College prepares its students through its curriculum of arts and sciences, pre-professional,
professional, and graduate studies, and its rich campus life program. As a residential institution of higher education, the
College aspires to graduate broadly educated men and women who
• Think critically and creatively,
• Communicate effectively,
• Act responsibly, and
• Demonstrate their local and world citizenship through service
Wesleyan Accreditation
West Virginia Wesleyan is accredited by The Higher Learning Commission (30 North LaSalle Street, Suite 2400, Chicago, IL
60602-2504; telephone 1-800-621-7440) and approved by the University Senate of The United Methodist Church. It is a
member of the National Association of Schools of Music and is approved by the West Virginia Department of Education. The
College participates in the Interstate Certification Project, whereby a number of states certify teachers graduating from
Wesleyan’s Department of Education. The nursing program is fully accredited by the West Virginia Board of Examiners for
Registered Nurses (101 Dee Drive, Suite 102, Charleston, WV 25311- 1620; telephone 304-558-3596), and accredited by the
Accreditation Commission for Education in Nursing, Inc., (3343 Peachtree Road NE, Suite 850, Atlanta, GA, 30326;
telephone 1-866-747-9965). The athletic training program is accredited by the Commission on Accreditation of Athletic
Training Education (CAATE), (6836 Austin Center Blvd., Suite 250, Austin, TX 78731-3193, 512-733-9700)*. The School of
Business is a candidate for accreditation with the Accreditation Council for Business Schools and Programs (ACBSP), (11520
West 119th Street, Overland Park, KS 66213, 913-339-9356).
The College holds membership in the Appalachian College Association, The National Association of Independent Colleges
and Universities, the American Association of Colleges for Teacher Education, the National Association of Schools and
Colleges of The United Methodist Church, Campus Compact, and the Council of Independent Colleges
4
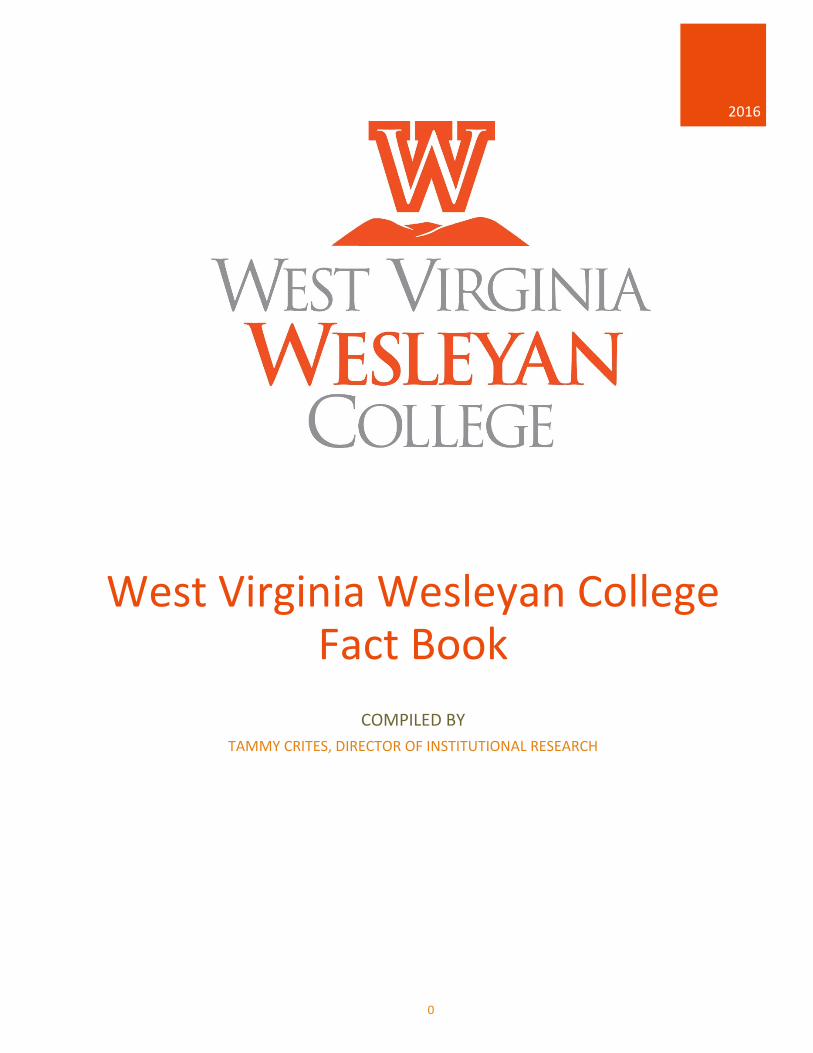
Organizational Chart Fall 2016-17
West Virginia Wesleyan College
Organizational Chart
2016-2017
(As of September 2016)
Board of Trustees Chair
Gavin Appleby
Office of the
PresidentPamela Balch
VP Academics
Boyd Creasman
Associate Dean
Teaching
and Learning
Accreditation
Assessment of Student Learning
Academic Schools
Graduate Programs
Academic Departments
and
Curriculum
Academic Services
Learning Center
Library
Student Success
Coordinator
VP Administration
and Finance
Barry Pritts
Accounting Office
Retail Store (Bobcat Den)
Information Technology
Food Service -Contracted
with Aladdin
Food Service
Human Resources
Physical plant
Student Accounts and Administrative
Services
Security
VP Enrollment Management
John Waltz
Admissions (Graduate and Undergraduate
Programs)
Financial Aid
Marching Band
Retention
Website
VP Institutional
Advancement Bob Skinner
Assoc. VP Advancement and Alumni
Relations
Emeritus Club
Wesleyan Fund
Major Gifts Solicitation
Planned Giving
Grants and Government
Relations
Marketing and Communications
Stewardship
Director Athletics
Randy Tenney
Athletic Training
Compliance
NCAA II Athletic Teams
Sports Information
Student Athlete Support
Center
Director Institutional
Research
Tammy Crites
Legal Affairs Counsel
Dave McCauley
Registrar
Alice Creasman
Director Title IX
Meghan Frum
VP StudentsDevelopment
John Waltz
Religious/ Spiritual
Life/Chaplain
Career Services
Multicultural Programs/
Services
Campus life
Counseling
Health Center
Community Engagement

5
West Virginia Wesleyan College Administrative Execute Officers 2016-2017
Administrative Executive OfficersAdministrative Executive OfficersAdministrative Executive OfficersAdministrative Executive Officers Pamela M. Balch, Ed.D, President of the College
Boyd H. Creasman, Ph.D, Vice President for Academic Affairs and Dean of the College
John Waltz, M.A., Vice President for Enrollment Management
Barry R. Pritts, Ph.D, Vice President for Administration and Finance
Robert N. Skinner, M.A., Vice President of Advancement
John Waltz, M.A., Interim Vice President for Student Development
Staff Council Officers 201Staff Council Officers 201Staff Council Officers 201Staff Council Officers 2016666----11117777
Jonathan Andrew
Kimberly Haney
Matt Linder
Alisa Lively (chair)
Katie Loudin (chair elect)
Denise Mills
Alice Teets

6
West Virginia Wesleyan College Academic Structure 2016-17
VP Academic Affairs
School of Business
Business
Economics
MBA Program
School of Education
Education
M.Ed. Program
School of Exercise Science and Athletic
Training
Athletic Training
Exercise Science
MSAT Program
School of Fine Arts and Humanities
Art
English
Gender Studies
History
Music
Philosophy
Religious Studies
Theatre
MFA Program
School of Nursing
Nursing
MSN Program
School of Science
Biology
Chemistry
Environmental Studes
Math/Computer Science
Physics
School of Social and
Behavioral Science
Communication
Criminal Justice
Political Science
Psychology
Sociology
Associate Dean
for Teaching and Learning
Learning Center
Library

7
Academic School Directors
Susan L. Aloi, Ed.D, School of Business
Karen R. Petitto, Ed.D., School of Education
Stephen Cresswell, Ph.D., School of Fine Arts and Humanities
Rae Emrick., MSAT School of Exercise Science
Susan Leight Ph.D., School of Nursing
Pamel Wovchko, Ph.D., School of Science
Karen S. Miller, Ph.D., School of Social and Behavioral Science
Faculty Senate 2016-17
Executive Committee of Faculty Assembly Shirley Fortney, Chair of the Faculty
Greg Bradley Popovich, Vice Chair of the Faculty
Melissa Buice
Ashley Lawson
Greg Mach
Paula McGrew

8
Fall 201Fall 201Fall 201Fall 2016666 New StudentsNew StudentsNew StudentsNew Students

9
Fall 2012-2016 Full-Time Freshmen Enrollment Funnel and Academic Profile
Fall 2012 Fall 2013 Fall 2014 Fall 2015 Fall 2016
Applicants 2008 1762 1788 1782 1752
Accepted 1557 1356 1377 1376 1347
Accept rate 77.5% 77.0% 77.0% 77.2% 76.9%
Matriculates 404 471 415 392 387
Yield 25.9% 34.7% 30.1% 28.5% 28.7%
High School GPA 3.37 3.47 3.49 3.48 3.53
ACT Composite Score 21.9 22.5 22.5 22.2 22.5
SAT Verbal Score 483 490 484 483 486
SAT Math Score 487 498 487 491 503
SAT Written Score 466 477 473 467 469
SAT Combined (M and V only) 970 989 971 974 982
SAT Combined All 1433 1463 1444 1445 1457
West Virginia61.0%
Maryland5.2% Pennsylvania
7.0%Virginia4.7%
International6.5%
Others4.7%
New Jersey2.1%
Florida3.9%
Ohio4.7%
New York0.3%
New Hampshire0.3%
Fall 2016387 Full-Time Freshmen
by State

10
Religious
United Methodist 60 59 66 69 67
Roman Catholic 39 37 43 33 44
Baptist 41 52 44 34 53
Christian Missionary 0 0 0 0 0
Lutheran 0 3 2 6 5
Nazarene 3 1 4 1 2
Jewish 0 1 2 1 2
Presbyterian 6 10 7 10 7
Episcopal 3 2 3 3 3
United Church of Christ 3 6 7 4 7
Other 51 63 86 57 68
No Preference 206 237 151 174 129
Fall 2012-2016 Full-Time Freshmen Demographics
Fall 2012 Fall 2013 Fall 2014 Fall 2015 Fall 2016
Home State
West Virginia 210 273 254 212 236
Maryland 46 51 40 57 20
Pennsylvania 40 34 39 42 27
Virginia 17 24 22 19 18
International 7 21 11 20 25
Others 23 37 19 18 18
New Jersey 7 6 8 10 8
Florida 20 12 11 8 15
Ohio 16 10 6 3 18
New York 13 1 2 3 1
New Hampshire 1 0 2 0 1
Massachusetts 0 0 1 0 0
Connecticut 3 1 0 0 0
Maine 1 1 0 0 0

11
Ethnic Classification
Fall 2012 Fall 2013 Fall 2014 Fall 2015 Fall 2016
White American 311 367 334 298 296
African American 64 48 39 45 30
Asian American 0 0 2 1 0
American Indian/Alaska Native 0 0 2 0 2
Spanish American(Hispanic) 8 10 9 12 14
Pacific Islander/Hawaiian 0 0 1 1 0
Not specified 7 4 2 4 0
International 7 21 10 20 27
More than one 7 21 16 11 18
Gender
Female 210 228 245 215 213
Male 194 248 170 177 174
Academic Majors Upon
Admission
Business/Economics 51 56 33 58 62
Exercise Science/Athletic Training 49 58 50 41 42
Nursing 45 51 56 40 37
Biology/Environmental Science 52 59 45 42 35
Undecided/General Studies 54 56 51 42 30
Chemistry/Biochemistry 15 24 30 30 26
Engineering 3/2 , Physics, Geophysics 22 38 29 30 26
Criminal Justice/Sociology/Poli Sci 24 28 23 25 25
Education 30 32 33 25 24
Psychology 16 10 17 11 19
Music/Music Education 7 9 10 11 15
Art 9 10 8 8 12
English 5 4 7 4 9
Math/Computer Science 7 13 6 8 8
Communication Public Relations 5 8 5 6 8
History and International Studies 6 4 6 2 3
Health Science 3
Theatre and Music Theatre and Arts Admin. 6 10 5 7 2
Christian Education/Religious Studies/Philosophy 1 1 0 2 1
Gender Studies 1 0 0 Source: WVWC Admission Records as of the Census date

12
First-time Full-time Freshmen Financial Aid Profile
Undergraduate Cost of Attendance and Direct Cost
2012-13 2013-14 2014-15 2015-16 2016-17
WVWC Tuition and Fees $25,804 $26,794 $27,858 $28,792 $29,752
WVWC Room and Board $7,510 $7,740 $7,890 $8,066 $8,248
WVWC Direct Cost $33,314 $34,534 $35,748 $36,858 $38,000
WVWC Indirect Cost(Book, Supplies,
Travel) $6,000 $6,000 $6,000 $6,065 $6,065
Total Cost of Attendance $39,314 $40,534 $41,748 $42,923 $44,065
Awarded Financial Aid to First Time Full-Time Freshmen
Fall 2012 Fall 2013 Fall 2014 Fall 2015 Fall 2016
Number First-time Full-time
Freshmen 404 471 415 392 387
% Completing FAFSA 96% 93% 91% 94% 90%
% applied for Need or Merit
Financial Aid 100% 99% 99% 99% 100%
% received any Financial Aid 100% 99% 99% 99% 100%
% received scholarship or grant aid 100% 99% 99% 99% 100%
% received self-help aid 76% 89% 75% 70% 75%
Average Financial Aid Award All
Sources* $25,490 $27,273 $28,247 $30,416 $30,145
Average Scholarship and Grant
Award All Sources $20,494 $22,367 $22,905 $23,829 $25,619
Average Self Help Award All Sources $4,996 $4,738 $5,343 $4,633 $5,289
% received Alternative Loans 9% 3% 6% 5% 7%
% received Parent Plus Loans 11% 8% 11% 16% 11%
Median Estimated Family
Contribution $7,321 $8,371 $7,356 $10,541 $9,274
% Pell Eligible 40% 37% 70% 34% 34%
First Time Full-Time Freshmen Net Cost of Attendance and Out of Pocket Direct Cost
2012-13 2013-14 2014-15 2015-16 2016-17 Net Cost of Attendance (Total Cost of
Attendance -Ave. Scholarships and Grants) $18,820 $18,167 $18,843 $19,029 $18,446
Out of Pocket Direct Cost (Total Direct
Cost -Average Financial Aid Award All Source) $7,824 $7,261 $7,501 $6,442 $7,845
Source: Financial Aid Files as of no later than November 15th each year.
*Does not Include Parent Loans

13
Fall Fall Fall Fall 2012012012016666 Student BodyStudent BodyStudent BodyStudent Body

14
Historical Enrollment Summary
UNDERGRADUATE
STUDENT
ENROLLMENT
NEW FULL TIME STUDENTS 2012-2013 2013-2014 2014-2015 2015-2016 2016-2017
Fall Spring Fall Spring Fall Spring Fall Spring Fall Spring
Fall First Year 404 347 471 415 415 374 392 341 387 339
Spring First Year 8 5 2 3 5
Fall Transfers 61 41 39 34 40 35 49 46 42 32
Spring Transfers 13 10 16 6 11
Fall Visitors 2 2 5 4 4 3 6 4 4 0
Spring Visitors 2 3 2 1 0 1 2 1 0
Total 469 414 517 469 459 431 447 402 434 387
RETURNING FULL TIME STUDENTS
Continuing Students 809 753 816 758 891 835 910 832 918 843
Fall readmits 11 12 7 6 15 Spring Readmits 14 6 2 8 8
Total 820 767 828 764 898 837 916 840 933 851
TOTAL UNDERGRADUATE
Full-time 1289 1181 1345 1233 1357 1268 1363 1242 1367 1238
Part-time 26 27 22 30 33 35 26 38 29 38
Total Headcount 1315 1208 1367 1263 1390 1303 1389 1280 1396 1276
Undergraduate FTE 1302 1195 1356 1246 1372 1284 1373.3 1257.6 1379.6 1255.4
Average Undergraduate FTE 1248 1301 1328 1315 1318
15
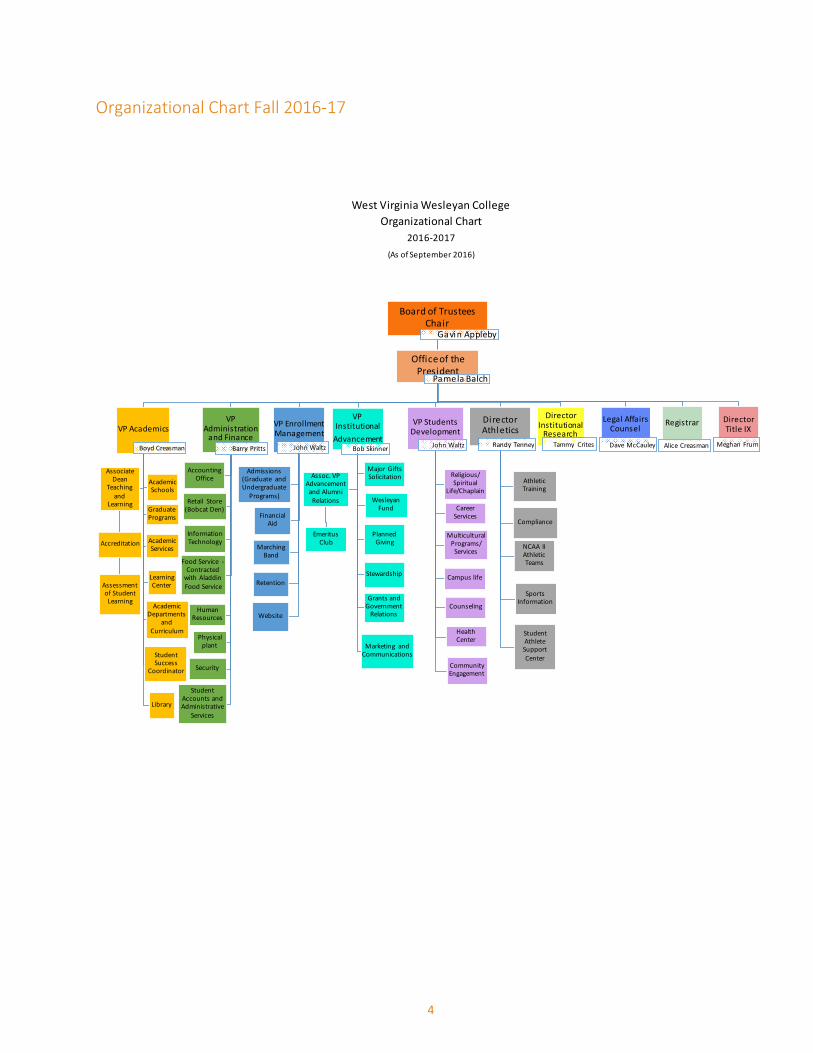
GRADUATE STUDENT ENROLLMENT MASTER OF BUSINESS ADMINISTRATION 2012-2013 2013-2014 2014-2015 2015-2016 2016-2017
Fall Spring Fall Spring Fall Spring Fall Spring Fall Spring
Full-time 14 14 23 23 15 12 9 7 18 17
Part-time 6 1 4 1 1 0 1 1 1 1
Total Headcount 20 15 27 24 16 12 10 8 19 18
FTE 17 15 25 24 15 12 9.5 7.5 19.5 17.5
Five Year MBA Program (not included in above MBA figures)#
23 20 19 23 14 13 10 24 24 25
MASTER'S IN EDUCATION
Full-time 19 18 12 12 12 14 16 14 9 7
Part-time 7 12 5 6 5 9 4 2 3 2
Total Headcount 26 30 17 18 17 23 20 16 12 9
FTE 22.5 24.0 14.5 14.3 14.833 17.5 18.2 15.1 13.7 8.0
Five YEAR MED (not included in above MED figures)
11 12 8 6 8 13 12 13 14 14
MASTER OF SCIENCE in ATHLETIC TRAINING
Full-time 9 9 10 10 12 11 12 11 10 9
Part-time 1 0 0 0 0 1 0 1 0 0
Total Headcount 10 9 10 10 12 12 12 12 10 9
FTE 9.17 9 10 10 12 11.83 12 11.5 10 9
Masters of Science in Nursing
Full-time 10 8 24 28 44 51 67 53 79 47
Part-time 1 4 5 9 10 6 9 7 8 8
Total Headcount 11 12 29 37 54 57 76 60 87 55
FTE 10.5 10 26.5 32.5 49.5 54 72.2 56.88 83.7 51
Masters in Fine Arts-Creative Writing
Full-time 12 21 19 21 22 19 11 14 18 18
Part-time 0 0 0 0 0 0 0 0
Total Headcount 12 21 19 22 22 19 11 14 18 18
FTE 12 21 19 22 22 19 11 14 18 18
TOTAL MASTERS LEVEL GRADUATE STUDENTS
Full-time Enrollment 64 70 88 94 105 107 115 99 134 98
Part-time Enrollment 15 17 14 16 16 16 14 11 12 11
Total Headcount 79 87 102 111 121 123 129 110 146 109 FTE 71 79 95 102 113 114 122.8 105 144.8 104
Average Graduate FTE 75 99 114 114 124

16
TOTAL STUDENT
BODY ENROLLMENT
SUMMARY
2012-2013 2013-2014 2014-2015 2015-2016 2016-2017
Fall Spring Fall Spring Fall Fall Spring Fall Spring Fall Total Student Body Full-time Enrollment 1353 1251 1433 1327 1462 1375 1478 1341 1501 1336
Total Student Body Part-time Enrollment 41 44 36 46 49 51 40 49 41 49
Total Student Body Headcount Enrollment 1394 1295 1469 1374 1511 1426 1518 1390 1542 1385 Total Student Body Semester FTE 1373 1273 1451 1349 1485 1399 1496.1 1363 1524.4 1359 Total Student Body Average FTE 1323 1400 1442 1429 1442
*** The 5 year MBA program students are officially counted in the undergraduate headcount and FTE numbers but are also enrolled in
one or more masters level courses.
**** The MED PROGRAM was reestablished in Fall 2007. The 5 year MED program students are officially counted in the undergraduate
headcount and FTE numbers but are also enrolled in one or more masters level courses.
## The MS AT Program had its first enrollment in Fall 2008.
### The MSN Program had its first enrollment in Fall 2009.
#### The MFA in Creative Writing had its first enrollment in July 2011.
Source: WVWC Student Records as of the Census date

17

18
Fall 2016 All Students by Gender, Race and Ethnicity
Undergraduates
Inte
rna
tio
na
l
Bla
ck n
on
-
His
pa
nic
Am
. In
dia
n o
r
Ala
ska
n
Na
tiv
e
Asi
an
Pa
cifi
c
Isla
nd
er/
Ha
w
aii
an
H
isp
an
ic
Wh
ite
, n
on
-
His
pa
nic
Ra
ce/e
th.
un
kn
ow
n
Mo
re t
ha
n
on
e
To
tal
Ge
nd
er
Pe
rce
nta
ge
Full Time Undergraduates
Men 57 79 3 0 2 21 430 5 21 618 45.2%
Women 28 28 2 2 0 13 640 6 30 749 54.8%
Full-time Total 85 107 5 2 2 34 1070 11 51 1367
Ethnic
Percentages 6.2% 7.8% 0.4% 0.1% 0.1% 2.5% 78.3% 0.8% 3.7%
Part Time Undergraduates
Men 1 1 9 2 13 44.8%
Women 1 15 16 55.2%
Part-time Total 2 0 0 0 0 1 24 2 0 29
Total Undergraduates Men 58 79 3 0 2 22 439 7 21 631 45.2%
Women 29 28 2 2 0 13 655 6 30 765 54.8%
Total 87 107 5 2 2 35 1094 13 51 1396
Ethnic
Percentages 6.2% 7.7% 0.4% 0.1% 0.1% 2.5% 78.4% 0.9% 3.7%
Graduate Students Full Time Graduate Students
Men 1 1
1 1
22 1 1 28 24.3%
Women
1
2
1 72 10 1 87 75.7%
Part-time Graduate Students
Men
1
1 7.1%
Women
1
10 2
13 92.9%
Total Graduate Students
Men 1 1 0 2 1 0 22 1 1 29 22.5%
Women 0 2 0 2 0 1 82 12 1 100 77.5%
Total 1 3 0 4 1 1 104 13 2 129
Ethnic
Percentages
0.8% 2.3% 0.0% 3.1% 0.8% 0.8% 80.6% 10.1% 1.6%
Grand Total Students Men 4 3 0 0 0 0 23 4 3 37 25.3%
Women 1 4 0 0 0 0 92 12 0 109 74.7%
Total 5 7 0 0 0 0 115 16 3 146
Ethnic
Percentages 3.4% 4.8% 0.0% 0.0% 0.0% 0.0% 78.8% 11.0% 2.1%
STATES AND COUNTRIES
West Virginia Wesleyan College has a commitment to providing a diverse environment for student to both learn
in and live in. Sixty percent of Wesleyan's student body are from WV. Thirty-four percent of the student body
consists of students from 34 other states and six percent are international students from the 27 countries.
Source: WVWC Student Records as of the Census date
19
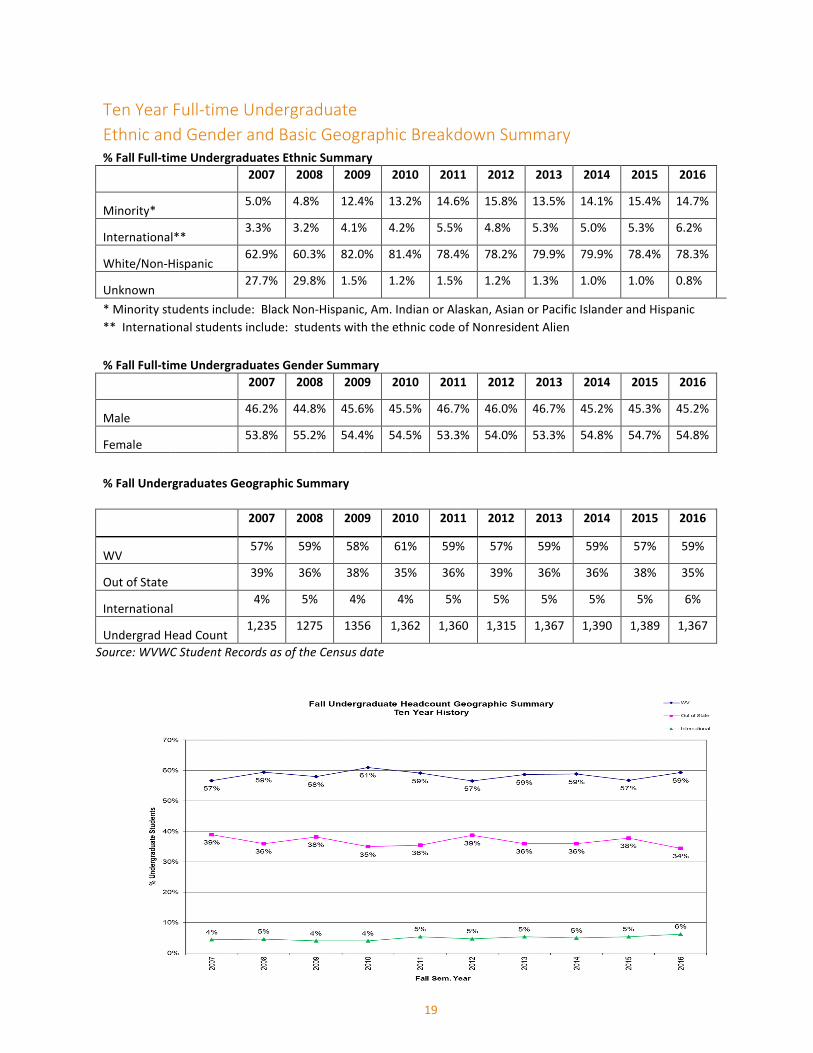
Ten Year Full-time Undergraduate
Ethnic and Gender and Basic Geographic Breakdown Summary
% Fall Full-time Undergraduates Ethnic Summary
2007 2008 2009 2010 2011 2012 2013 2014 2015 2016
Minority* 5.0% 4.8% 12.4% 13.2% 14.6% 15.8% 13.5% 14.1% 15.4% 14.7%
International** 3.3% 3.2% 4.1% 4.2% 5.5% 4.8% 5.3% 5.0% 5.3% 6.2%
White/Non-Hispanic 62.9% 60.3% 82.0% 81.4% 78.4% 78.2% 79.9% 79.9% 78.4% 78.3%
Unknown 27.7% 29.8% 1.5% 1.2% 1.5% 1.2% 1.3% 1.0% 1.0% 0.8%
* Minority students include: Black Non-Hispanic, Am. Indian or Alaskan, Asian or Pacific Islander and Hispanic
** International students include: students with the ethnic code of Nonresident Alien
% Fall Full-time Undergraduates Gender Summary
2007 2008 2009 2010 2011 2012 2013 2014 2015 2016
Male 46.2% 44.8% 45.6% 45.5% 46.7% 46.0% 46.7% 45.2% 45.3% 45.2%
Female 53.8% 55.2% 54.4% 54.5% 53.3% 54.0% 53.3% 54.8% 54.7% 54.8%
% Fall Undergraduates Geographic Summary
2007 2008 2009 2010 2011 2012 2013 2014 2015 2016
WV 57% 59% 58% 61% 59% 57% 59% 59% 57% 59%
Out of State 39% 36% 38% 35% 36% 39% 36% 36% 38% 35%
International 4% 5% 4% 4% 5% 5% 5% 5% 5% 6%
Undergrad Head Count 1,235 1275 1356 1,362 1,360 1,315 1,367 1,390 1,389 1,367
Source: WVWC Student Records as of the Census date
20
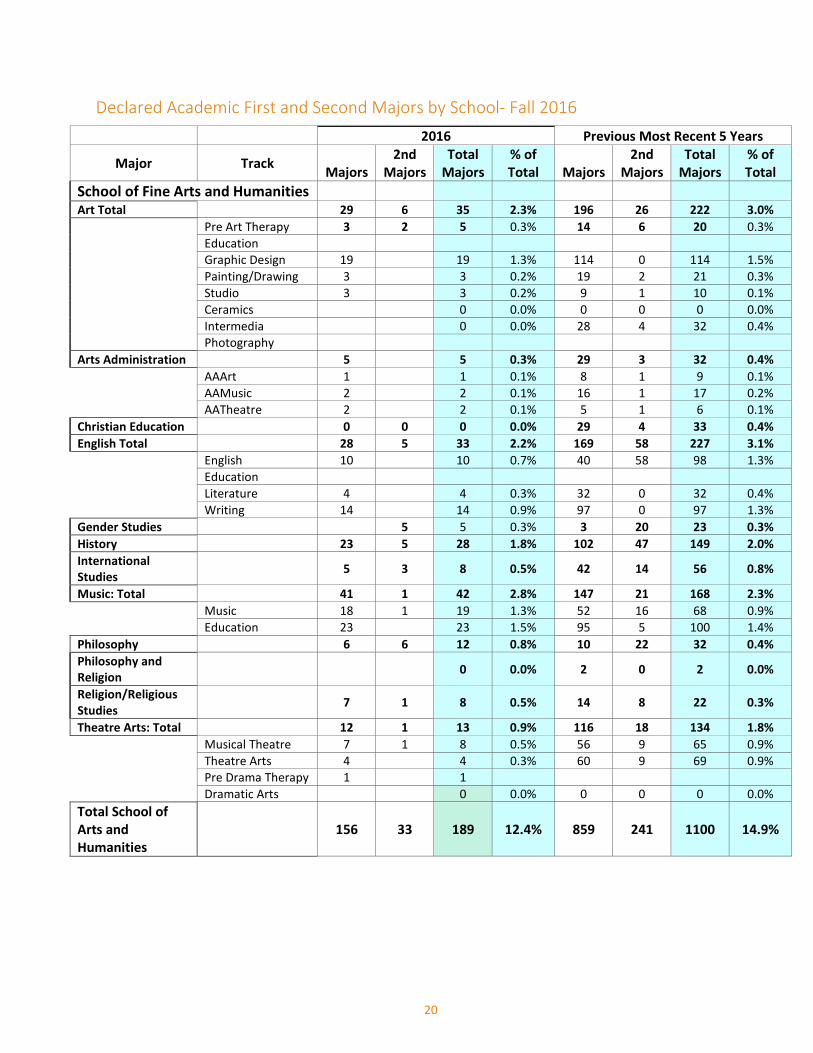
Declared Academic First and Second Majors by School- Fall 2016
2016 Previous Most Recent 5 Years
Major Track Majors
2nd
Majors
Total
Majors
% of
Total Majors
2nd
Majors
Total
Majors
% of
Total
School of Fine Arts and Humanities
Art Total 29 6 35 2.3% 196 26 222 3.0%
Pre Art Therapy 3 2 5 0.3% 14 6 20 0.3%
Education
Graphic Design 19 19 1.3% 114 0 114 1.5%
Painting/Drawing 3 3 0.2% 19 2 21 0.3%
Studio 3 3 0.2% 9 1 10 0.1%
Ceramics 0 0.0% 0 0 0 0.0%
Intermedia 0 0.0% 28 4 32 0.4%
Photography
Arts Administration 5 5 0.3% 29 3 32 0.4%
AAArt 1 1 0.1% 8 1 9 0.1%
AAMusic 2 2 0.1% 16 1 17 0.2%
AATheatre 2 2 0.1% 5 1 6 0.1%
Christian Education 0 0 0 0.0% 29 4 33 0.4%
English Total 28 5 33 2.2% 169 58 227 3.1%
English 10 10 0.7% 40 58 98 1.3%
Education
Literature 4 4 0.3% 32 0 32 0.4%
Writing 14 14 0.9% 97 0 97 1.3%
Gender Studies 5 5 0.3% 3 20 23 0.3%
History 23 5 28 1.8% 102 47 149 2.0%
International
Studies 5 3 8 0.5% 42 14 56 0.8%
Music: Total 41 1 42 2.8% 147 21 168 2.3%
Music 18 1 19 1.3% 52 16 68 0.9%
Education 23 23 1.5% 95 5 100 1.4%
Philosophy 6 6 12 0.8% 10 22 32 0.4%
Philosophy and
Religion 0 0.0% 2 0 2 0.0%
Religion/Religious
Studies 7 1 8 0.5% 14 8 22 0.3%
Theatre Arts: Total 12 1 13 0.9% 116 18 134 1.8%
Musical Theatre 7 1 8 0.5% 56 9 65 0.9%
Theatre Arts 4 4 0.3% 60 9 69 0.9%
Pre Drama Therapy 1 1
Dramatic Arts 0 0.0% 0 0 0 0.0%
Total School of
Arts and
Humanities
156 33 189 12.4% 859 241 1100 14.9%
21
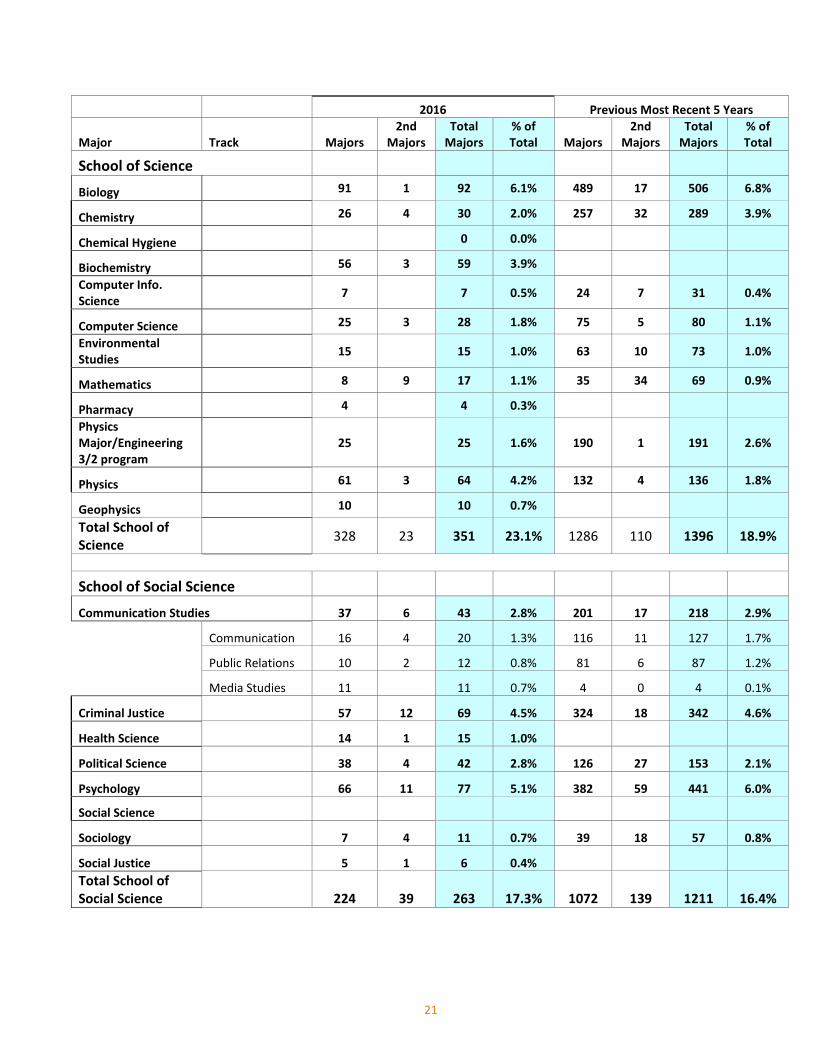
2016 Previous Most Recent 5 Years
Major Track Majors
2nd
Majors
Total
Majors
% of
Total Majors
2nd
Majors
Total
Majors
% of
Total
School of Science
Biology 91 1 92 6.1% 489 17 506 6.8%
Chemistry 26 4 30 2.0% 257 32 289 3.9%
Chemical Hygiene 0 0.0%
Biochemistry 56 3 59 3.9%
Computer Info.
Science 7 7 0.5% 24 7 31 0.4%
Computer Science 25 3 28 1.8% 75 5 80 1.1%
Environmental
Studies 15 15 1.0% 63 10 73 1.0%
Mathematics 8 9 17 1.1% 35 34 69 0.9%
Pharmacy 4 4 0.3%
Physics
Major/Engineering
3/2 program
25 25 1.6% 190 1 191 2.6%
Physics 61 3 64 4.2% 132 4 136 1.8%
Geophysics 10 10 0.7%
Total School of
Science 328 23 351 23.1% 1286 110 1396 18.9%
School of Social Science
Communication Studies 37 6 43 2.8% 201 17 218 2.9%
Communication 16 4 20 1.3% 116 11 127 1.7%
Public Relations 10 2 12 0.8% 81 6 87 1.2%
Media Studies 11 11 0.7% 4 0 4 0.1%
Criminal Justice 57 12 69 4.5% 324 18 342 4.6%
Health Science 14 1 15 1.0%
Political Science 38 4 42 2.8% 126 27 153 2.1%
Psychology 66 11 77 5.1% 382 59 441 6.0%
Social Science
Sociology 7 4 11 0.7% 39 18 57 0.8%
Social Justice 5 1 6 0.4%
Total School of
Social Science 224 39 263 17.3% 1072 139 1211 16.4%

22
2016 Previous Most Recent 5 Years
Major Track Majors
2nd
Majors
Total
Majors
% of
Total Majors
2nd
Majors
Total
Majors
% of
Total
School of Business
Business Total 208 10 218 14.3% 938 40 978 13.2%
Accounting 43 1 44 2.9% 268 7 275 3.7%
Finance 0 0.0% 0 0 0 0.0%
Business
Admin 67 4 71 4.7% 379 22 401 5.4%
Management 28 2 30 2.0% 111 5 116 1.6%
Marketing 30 2 32 2.1% 100 3 103 1.4%
International
Business 1 1 0.1% 80 3 83 1.1%
Sport
Business 40 40 2.6%
Economics 20 8 28 1.8% 44 50 94 1.3%
Total School of Business 228 18 246 16.2% 1030 91 1121 15.1%
School of Education
Elementary 80 1 81 5.3% 419 7 426 5.8%
Secondary 44 4 48 3.2% 378 18 396 5.3%
Total School of
Education 124 5 129 8.5% 797 25 822 11.1%
School of Exercise Science
Physical
Education 2 4 6 0.4% 9 22 31 0.4%
Exercise
Science 124 1 125 8.2% 393 9 402 5.4%
Athletic
Training 49 1 50 3.3% 259 0 259 3.5%
Exercise Science 175 6 181 11.9% 661 31 692 9.3%
School of Nursing 122 0 122 8.0% 691 4 695 9.4%
Nursing 79 79
Pre-Nursing 43 43
Total School of
Health Sciences 297 6 303 19.9% 1352 35 1387 18.7%
Contract Major 0 0.0% 7 3 10 0.1%
Undeclared 39 39 2.6% 357 0 357 4.8%
Total Undergraduate
Declared Majors 1396 124 1520 100.0% 6760 644 7404 100.0%

23
Source: WVWC Student Records as of the Census date
Total School
of Arts and
Humanities
Total School
of Science
Total
Schoool of
Social and
Behavioral
Science
Total School
of Education
Total School
of Business
Total School
of Nursing
Total School
of Exercise
Science
Contracts
Total
Undecided/
General
Education
2007 232 200 251 135 223 75 130 0 94
2008 224 233 258 157 243 90 126 3 86
2009 231 258 230 173 239 124 138 8 86
2010 231 261 253 169 230 141 146 1 73
2011 226 288 246 180 212 142 120 0 75
2012 201 270 238 153 219 145 138 1 64
2013 211 319 244 147 221 143 147 0 59
2014 208 348 254 150 207 143 152 1 61
2015 192 363 239 146 225 131 148 56
2016 189 351 263 129 246 122 181 39
0
50
100
150
200
250
300
350
400#
ST
UD
EN
T M
AJO
RS
Declared Undergraduate Majors by School
Fall 2007 - Fall 2016

24
West Virginia Wesleyan College
Student Organizations
(In Alphabetical Order)
Alpha Delta Pi Sorority Hallom Math Honorary Religious Life Council
Alpha Gamma Delta Sorority Honors Program Senior Class Council
Alpha Lambda Delta Honorary Interfraternity Council (IFC) Sigma Alpha Iota
Alpha Phi Alpha International Student
Organization Sigma Tau Delta
Alpha Phi Omega Interfaith Sigma Theta Epsilon
Alpha Psi Omega Jazz Ensemble Sigma Theta Tau
Alpha Sigma Phi Junior Class Council Student Nurses of Wesleyan (SNOW)
Alpha Xi Delta Sorority Just Stand Sociology Club
Beta Beta Beta Kappa Delta Pi Sophomore Class Council
Black Student Union Kappa Alpha Order Student Art League
Bobcat Entertainment Lambda Pi Eta Communication
Honorary Student Athlete Advisory Committee
Catholic Campus Ministry Love Your Melon Student Athletic Trainers’ Club
Cheerleading Omega Psi Phi Fraternity Student Education Association
Chi Phi Fraternity Omicron Delta Epsilon Student Senate
College Republicans Omicron Delta Kappa Theta Chi Fraternity
Collegiate 4-H Club Order of Omega Theta Xi Fraternity
Concentus Vocum Panhellenic Association WE LEAD
Concert Band Pharos Wesleyan Ambassadors
Concert Chorale Phi Kappa Phi Wesleyan Singers
Delta Mu Delta Phi Mu Alpha Sinfonia WVWC-C92FM
ENACTUS Phi Sigma Tau Young Democrats
Engineering/Physics Club Pre-Law Society Zeta Tau Alpha
Fellowship of Christian Athletes Pre-Med Society
Freshman Council PRISM
Gamma Sigma Alpha Psi Chi
Source: WVWC Web page 05-2016

25
All Student Athletes by Scholarship Status
All Student Fall 2016
Sports
Number of
Student
Athletes
Scholarship Student Athletes
Walk on Student Athletes
% Scholarship
Baseball 58 27 31 47%
M. Basketball 20 8 12 40%
M. Cross Country and Track* 72 34 38 47%
Football# 117 54 63 46%
Golf 13 6 7 46%
M. Soccer# 40 19 21 48%
M. Swimming 15 7 8 47%
M. Tennis 21 9 12 43%
Totals 356 164 192 46%
% of FT Undergraduate Men 57.6% 26.5% 31.1%
FT Undergraduate Men 618
2 Graduate FB, 1 Graduate MSR
Women's Programs
W. Basketball 21 16 5 76%
W. Cross Country and Track* 63 26 37 41%
W. Lacrosse 23 13 10 57%
W. Soccer 48 31 17 65%
Softball 34 12 22 35%
W. Swimming 21 10 11 48%
W. Tennis 10 8 2 80%
Volleyball 29 21 8 72%
W. Golf# 7 4 3 57%
Totals 256 141 115 55%
% FT Undergraduate Women 34.2% 18.8% 15.4%
# of FT Undergraduate Women 749
All Student Athlete Totals 612 305 307 50%
% of Total Students 45% 22% 22%
# Total FT Students 1367 * This number does not include those athletes who also participated in another sport during the year.
# 1 Graduate WGOLF Source: WVWC Student Records as of the census date each year

26
Student OutcomesStudent OutcomesStudent OutcomesStudent Outcomes

27
Institutional Yearly Retention Rates
First-Time Full-time Freshmen Rate
Transfer Student Retention Rates
Freshmen Cohort
for First Year
Retention 291 401 382 399 371 405 404 471 415 392
Freshmen to
Sophomore (Year 1)75.3% 73.8% 74.6% 69.9% 67.3% 64.0% 65.1% 73.0% 71.8% 70.4% 71.5% 70.2% 75%
Sophomore to
Junior (Year 2)88.3% 83.03% 87.5% 82.8% 80.0% 82.2% 87.3% 88.6% 82.3% 87.3% 85.2% 85.8% 85%
Junior to Senior
(Year 3)95.4% 91.6% 96.1% 94.2% 96.6% 91.9% 92.4% 90.2% 88.9%** 92.2%** 92.0% 90.6% 95%
* These numbers only reflect retention for students who originally entered WVWC as First-time Full-time Freshmen
** If 2 2015-16 Graduates are included in the rate the Junior to Senior retention/completion rate is 92.9%
Fall 14
to
Fall 15
Fall 15
to
Fall 16
Fall to Fall Year of
Retention*
Strategic
Planning
Long
Term
Goal
Previous
3 yr.
Ave.
Fall 2016
Projection
Fall 06
to
Fall 07
Fall 07
to
Fall 08
Fall 08
to
Fall 09
Fall 09
to
Fall 10
Fall 10
to
Fall 11
Fall 11
to
Fall 12
Fall 12
to
Fall 13
Fall 13
to
Fall 14
Transfer Entering
Cohort 39 55 42 60 32 60 61 39 40 49
(Year 1) 77.5% 70.9% 87.2% 80.0% 78.1% 60.0% 54.1% 74.4% 81.5% 77.6% 67.1%
(Year 2) 42.1% 67.7% 59.0% 67.6% 64.6% 60.0% 77.8% 54.5% 79.3% 75.0% 69.4%
(Year 3) 69.2% 37.5% 38.1% 30.4% 39.1% 38.7% 15.4% 21.4% 5.8% 30.4% 15.5%
Actual Data is as of Census Date each year
Fall 15
to
Fall 16
Previou
s 3 yr.
Ave.
Fall 10
to
Fall 11
Fall 11
to
Fall 12
Fall 12
to
Fall 13
Fall 13
to
Fall 14
Fall 14
to
Fall 15
** If 2015-16 Graduates and are included in the rates, retention/completion rate is first year 79.6%, second year 87.5%, third
year 78.3%
Fall to Fall Year
of Retention*
* These numbers only reflect retention for students who originally entered WVWC as Transfer Students.
Student who have readmitted to the institution are included in their original cohort for retention
purposes.
Fall 06
to Fall
07
Fall 07
to
Fall 08
Fall 09
to
Fall 10
Fall 08
to
Fall 09

28
West Virginia Wesleyan College
First Time Full Time Freshmen
Yearly Retention and Graduation Rates
2005 to Present
Source: WVWC Student records as of the census date each year
Year 2 % Year 3 % Year 4 % Year 5 Year 6 < 3 yrs 4 yrs 5 yrs > 5 Total
2005 307 215 70.0% 190 61.9% 169 55.0% 42 2 2 126 40 2 170 55.4%
2006 291 219 75.3% 181 62.2% 174 59.8% 51 0 4 113 51 2 170 58.4%
2007 401 296 73.8% 259 64.6% 244 60.8% 53 7 1 178 56 6 241 60.1%
2008 382 285 74.6% 236 61.8% 228 59.7% 46 4 1 167 50 5 223 58.4%
2009 399 279 69.9% 223 55.9% 206 51.6% 51 2 3 148 47 3 201 50.4%
2010 371 250 67.4% 211 56.9% 196 52.8% 41 5 3 136 43 3 185 49.9%
2011 405 259 64.0% 225 55.6% 206 50.9% 36 7 5 148 43 5 201 49.6%
2012 404 263 65.1% 234 57.9% 209 51.7% 50 7 136 49
2013 471 344 73.0% 283 60.1% 261 55.4% 2 193
2014 415 298 71.8% 261 62.9% 5
2015 392 276 70.4%
2016 387
Recent 3 Yr
Average398 306 71.8% 259 60.3% 225 52.8% 42 5 5 159 45 4 196 50.0%
Total Grads %
Returning for: Graduating in:First-Time Full-time
Freshmen and Year
Entering College
2005 0.7% 41.7% 13.0% 54.7% 0.7% 55.4%
2006 1.4% 40.2% 17.5% 57.7% 0.7% 58.4%
2007 0.2% 44.6% 14.0% 58.6% 1.5% 60.1%
2008 0.3% 44.0% 13.1% 57.1% 1.3% 58.4%
2009 0.8% 37.8% 11.8% 49.6% 0.8% 50.4%
2010 0.8% 37.5% 11.6% 49.1% 0.8% 49.9%
2011 1.2% 37.8% 10.6% 48.4% 1.2% 49.6%
2012 1.7% 35.4% 12.1% 47.5%
2013 0.4% 41.4%
2014 1.2%
Recent 3 Yr
Average1.1% 38.4% 11.4% 48.3% 0.9% 50.0%
Graduation Rates
1.2%
41.4%
47.5%
49.6%
0.0%5.0%
10.0%15.0%20.0%25.0%30.0%35.0%40.0%45.0%50.0%55.0%60.0%65.0%
2005
2006
2007
2008
2009
2010
2011
2012
2013
2014% o
f F
resh
men
Cla
ss G
rad
uati
ng
First time Freshmen Year
West Virginia Wesleyan CollegeGraduation Rate
3 Years
Cum 4 Yr
Cum 5 Yr
Cum 6 Yr

29
Degrees Awarded by Major Field of Study 2016 Previous 5 year Total
July 1, 2015 through June 30, 2016 July 1, 2011 through June 30, 2015
Major Division Majors 2nd or
3rd
Majors
Total
Majors
%of
All
Majors 2nd or
3rd
Majors
Total
Majors
%of All
Fine Arts and Humanities
Art Total 9 1 10 4.3% 46 5 51 3.6%
Education
0 0.0% 0 0 0
Graphic Design 4
4 1.7% 26 0 26
Painting/Drawing 2
2 0.9% 10 0 10
Studio
0 0.0% 0 0 0
Ceramics
0 0.0% 0 0 0
Intermedia 1
1 0.4% 2 0 2
Photography 1
3 0 0
Pre Art Therapy 1
1 0.4% 5 2 7
Art Administration 1
1 0.4% 10 1 11 0.8%
Theatre Arts
0 0.0% 10 3 13 0.9%
English: Total 6 1 7 3.0% 50 15 65 4.6%
Education
0 0.0%
0 0
Literature 3
3 1.3% 14 0 14
Writing 3
3 1.3% 36 0 36
Gender Studies
3 3 1.3% 4 10 14 1.0%
History 4 2 6 2.6% 37 8 45 3.2%
Music: Total 5
5 2.1% 24 3 27 1.9%
Music: 2
2 0.9% 12 3 15
Education 3
3 1.3% 12 0 12
Music Theatre 1
1 0.4% 6 1 7 0.5%
Philosophy 1 1 2 0.9% 3 7 10 0.7%
Philosophy and
Religion
0
0 0.0% 0 0 0 0.0%
Religion/Religious
Studies
2
2 0.9% 6 1 7 0.5%
International Studies 1
1 0.4% 8 3 11 0.8%
Christian Education 0
0 0.0% 6 0 6 0.4%
Total Arts and
Humanities
30 8 38 16.2% 210 57 267 18.7%

30
2016 Previous 5 year Total
July 1, 2015 through June 30, 2016 July 1, 2011 through June 30, 2015
Major Division Majors 2nd or
3rd
Majors
Total
Majors
%of
All
Majors 2nd or
3rd
Majors
Total
Majors
%of All
School of Science
Biology
16
16 6.8% 64 0 64 4.5%
Biochemistry
8
8 3.4% 2 0 2 0.1%
Chemistry
9
9 3.8% 55 2 57 4.0%
Material Chemistry
0
0 0.0% 1 0 1 0.1%
Computer Info.
Science
2
2 0.9% 6 2 8 0.6%
Computer Science
4
4 1.7% 8 0 8 0.6%
Engineering Physics
0
0 0.0% 0 0 0 0.0%
Environmental
Science/Studies
3
3 1.3% 11 1 12 0.8%
Mathematics
2
2 0.9% 12 5 17 1.2%
Pharmacy
0 0 0 0.0%
Physics
15
15 6.4% 47 0 47 3.3%
Geophysics
0 0 0 0.0%
Total Science
59 0 59 25.2% 206 10 216 15.1%
School of Social
Science
Communication
Studies
5
5 2.1% 27 2 29 2.0%
Media Studies
Public Relations
2
2 0.9% 28 0 28 2.0%
Criminal Justice
9 1 10 4.3% 69 4 73 5.1%
Health Science
0 0 0 0.0%
Political Science
5
5 2.1% 31 6 37 2.6%
Psychology
22 2 24 10.3% 110 7 117 8.2%
Sociology
3
3 1.3% 14 8 22 1.5%
Total Social Science
46 3 49 20.9% 279 27 306 21.4%
School of Education
Education: Total
15 2 17 7.3% 118 8 126 8.8%
Elementary 11
11 4.7% 75 1 76 5.3%
Secondary 4 2 6 2.6% 43 7 50 3.5%

31
2016 Previous 5 year Total
July 1, 2015 through June 30, 2016 July 1, 2011 through June 30, 2015
Major Division Majors 2nd or
3rd
Majors
Total
Majors
%of All Majors 2nd or
3rd
Majors
Total
Majors
%of
All
School of Business
Business: Total
33 1 34 14.5% 217 7 224 15.7%
Accounting 5
5 2.1% 66 0 66 4.6%
Finance
0 0.0% 0 0 0 0.0%
Business
Administration
8 1 9 3.8% 56 4 60 4.2%
International
Business
3
3 1.3% 20 1 21 1.5%
Management 8
8 3.4% 37 2 39 2.7%
Marketing 4
4 1.7% 30 0 30 2.1%
Sports Business 5
5 2.1% 8 0 8 0.6%
Economics 1 2 3 1.3% 15 18 33 2.3%
Total School of Business 34 3 37 15.8% 232 25 257 18.0%
School of Exercise
Science
18 1 19 8.1% 146 7 153 10.7%
Physical
Education:
1 1 2 0.9% 15 7 22 1.5%
Exercise
Science
14
14 6.0% 106 0 106 7.4%
Athletic
Training
3
3 1.3% 25 0 25 1.8%
School of Nursing 15
15 6.4% 100 0 100 7.0%
Total School of
Health Sciences
33 1 34 14.5% 246 7 253 17.7%
Contract Major
0 0.0% 2 0 2 0.1%
Total Undergraduate
Student Majors
217 17 234 100% 1293 134 1427 100%
Number of Students with two or more
Majors
17 7.8%
0 134 10.4%
Number Undergraduate Degrees
Awarded
217
0 1293
5 year Undergraduate/MBA
6
6 Broken into
specialties above 57
41 Broken into specialties
above
5 year Undergraduate/MED 6 6 Broken into
specialties above 20
21 Broken into specialties
above (5 years)
MBA 12 Includes 5 year 103 Includes 5 year
MED
15 Includes 5 year 54 Includes 5 year
MSAT
9
25 Includes 5 year
MSN
14
14 Includes 5 year
MFA
13
17 2 Year

32

33
2015-2016 Placement Report
Student Success aStudent Success aStudent Success aStudent Success after Graduationfter Graduationfter Graduationfter Graduation
Graduate Outcome Statistics as of SGraduate Outcome Statistics as of SGraduate Outcome Statistics as of SGraduate Outcome Statistics as of Six Months aix Months aix Months aix Months after Graduation fter Graduation fter Graduation fter Graduation
Goal: 90% or higherGoal: 90% or higherGoal: 90% or higherGoal: 90% or higher
Partial list of Graduate Schools attending:
Adler School of Professional Psychology, Belmont University, Duke University, Drew Theological School, Indiana University,
Lynn University, Marshal University, Penn State University, Radford University, Stanford University, St. George’s University,
St John’s University, University of Sioux Falls, University of Southern California, University of Western Florida, Vanderbilt
University, Wesley Theological Seminary, West Virginia School of Osteopathic Medicine West Virginia University
Partial List of Employers:
Alpha Gamma Delta, AmeriCorps, Ann Taylor Loft, Appalachian Reading Center, Arnett, Foster, Toothman CPAs, Design
Studio, GIECO, Kaufmann, Rossin, Inc., Johns Hopkins Hospital Knob Hill Winery, Lakin Correctional Center, Mylan
Pharmaceuticals, National Children’s Hospital, New York Observer, Packer Thomas, CPAs, Powerplay Consulting, RAPP,
Slippery Rock University, Schull Natural Resources, Tamara York Public Relations, Teach for America, The Arena Club, United
Hospital Center, US Air Force, WDTV, WV Dept of Agriculture, West Virginia Wesleyan College
31 31 3345 42
59 5865 50 46
0102030405060708090
100
2011-12
Graduates
2012-13
Graduates
2013-14
Graduates
2014-15
Graduates
2015-16
Graduates
% e
mp
loy
ed
or
in g
rad
ua
ted
sch
oo
l
% in
volunteer
work or
internships% employed
in field
% in Graduate
School
% of
graduating
class with
information
65%
% of
graduating
class with
information
70%
% of
graduating
class with
information
70%
% of
graduating
class with
information
64%
% of
graduating
class with
information
75%

34
Faculty and StaffFaculty and StaffFaculty and StaffFaculty and Staff

35
Fall 2016 Employee Summary
Number of staff by employment status and occupational category: Fall 2016
Occupational Category # of Full-
time
Employees
# of Part-
time
Employees
Full-Time
Equivalent
Employees
Total Number of Staff 279 119 319
Instructional Staff 91 53 109
Library Staff 7 1 7
Student and Academic Affairs and other Educational Services 10 18 16
Management 30 1 30
Business and Finance 9 1 9
Computer Engineering and Science 10 1 10
Community, Social Service, Legal, Arts, Design,
Entertainment, and Sports and Media 43 19 49
Health Care Practitioners 3 7 5
Service Occupations 33 10 36
Sales and Related Occupations 2 0 2
Office and Administrative Support 22 8 25
Natural Resources, Construction, and Maintenance 17 0 17
Production, Transportation and Material Moving 2 0 2
NOTE: Full-time-equivalent (FTE) staff is calculated by summing the total number of full-time staff and adding one third of the total number of part-time staff. Graduate assistants are not included in the above figures. Many of the FTE figures may be included in the DFR.
Source: IPEDS Human Resources Survey (Employees as of November 1, 2016)

36
Faculty Profile
Source: Academic Dean’s office using the AAUP guidelines. These will differ slightly from the IPED Humane Resources
Guidelines listed on the previous page. In the AAUP guidelines, a staff member who teaches will be counted on this report
as part-time faculty. In the IPEDS report a staff member can only count in their primary employment category.
Terminal 9- 12 Mo. 9-12 Mo. % Change
Title Number % Tenured % Doctorate % Degree % Salary Ave. Salary Ave. from
2015-2016 2016-2017 15-16 to 16-17
Professors 11 10 91% 11 100% 11 100% 63,938$ 65,534$ 2.71%
Men 9 82% 8 89% 9 100% 9 100% 64,736$ 66,376$ 2.53%Women 2 18% 2 100% 2 100% 2 100% 59,946$ 61,745$ 3.00%
Associate Professors 31 30 97% 23 74% 28 90% 54,832$ 57,117$ 4.17%
Men 12 39% 12 100% 7 58% 11 92% 56,491$ 58,186$ 3.00%
Women 19 61% 18 95% 16 84% 17 89% 55,474$ 56,443$ 1.75%
Assistant Professor 42 5 12% 25 60% 29 69% 46,560$ 47,406$ 1.82%
Men 17 40% 3 18% 10 59% 12 71% 45,750$ 46,009$ 0.57%
Women 25 60% 2 8% 15 60% 17 68% 47,023$ 48,357$ 2.84%
Instructors 6 0 0% 0 0% 0 0% 40,800$ 39,849$ -2.33%
Men 2 33% 0 0% 0 0% 0 0% 35,298$
Women 4 67% 0 0% 0 0% 0 0% 42,233$ 42,125$ -0.26%
Total 91 45 49% 59 65% 68 75% 51,635$ 52,463$ 1.60%
Total Men 39 43% 23 59% 26 67% 32 82% 53,686$ 53,709$ 0.04%
Total Women 52 57% 22 42% 33 63% 36 69% 50,097$ 51,466$ 2.73%
Faculty Census
Head Count
Total
157
This c o unt do es no t inc lude SASS s ta ff o r ins truc to rs o f deve lo pmenta l co urs es .
Fall Full-time Equivilent Faculty (FTE Faculty)
2011 2012 2013 2014 2015 2016
109.3 112.7 106.3 106.7 111.3 113.0
2011 2012 2013 2014 2015 2016
13.2:1 12.8:1 13.1:1 13.7:1 13.7:1 12.8Undergraduate Student Faculty Ratio (Fall FTE
2016-2017
Fall Semester Faculty Profile
Full-Time
91
Part-Time
66
Total Faculty FTE (FT +(PT/3)

37
Financials and Fund RaisingFinancials and Fund RaisingFinancials and Fund RaisingFinancials and Fund Raising

38
Unrestricted Revenues and Gains
(Revenues in Million Dollars)
FY 2012 FY 2013 FY 2014 FY 2015 FY 2016
% Change
2016 vs
2012
Tuition and Fees $13.17 $13.31 $14.83 $15.87 $15.93 21.0%
Gifts and Grants $1.13 $1.35 $3.18 $2.77 $1.26 11.9%
Auxiliary Enterprises $9.08 $9.27 $9.82 $10.36 $10.47 15.2%
Investment Income $0.27 $0.18 $0.35 $0.44 $0.32 20.9%
Net Assets Released from Restrictions $4.37 $3.70 $4.06 $4.59 $5.74 31.5%
Total Current Funds Revenues $28.01 $27.82 $32.25 $34.03 $33.72 20.4%
Academic Year FTE Enrollment 1375 1310 1423 1441 1469 6.8%
Source: WVWC Audited Financial Statements
Tuition and Fees47.2%
Gifts and Grants3.7%
Auxiliary Enterprises31.0%
Other Income1.0%
Net Assests Released from Restrictions
17.0%
Unrestricted Revenues and GainsFY 2016

39
Expenditures by Category
(Expenditures in Million Dollars)
FY 2012 FY 2013 FY 2014 FY 2015 FY 2016 % Change
2016 vs 2012
Instruction $8.42 $8.72 $9.00 $9.27 $9.70 15.2%
Academic Support $2.70 $2.56 $2.41 $2.87 $3.36 24.6%
Student Services $5.84 $6.03 $6.44 $6.71 $6.89 17.9%
Institutional Support $4.72 $3.83 $4.32 $4.09 $5.00 5.8%
Fund Raising $0.94 $1.04 $1.12 $1.09 $1.15 22.4%
Auxiliary Enterprises $6.19 $6.23 $6.56 $6.97 $6.83 10.3%
Total Current Funds Expenditures $28.81 $28.41 $29.86 $31.00 $32.93 14.3%
Academic Year FTE Enrollment 1375 1310 1423 1441 1469 6.8%
Source: WVWC Audited Financial Statements
Instruction29.4%
Academic Support10.2%
Student Services20.9%
Institutional Support15.2%
Fund Raising3.5%
Auxiliary Enterprises20.7%
Expenditures by CategoryFY 2016

40
Giving by Source
Source: WVWC VSE Report for each Fiscal Year

42
West Virginia Wesleyan College West Virginia Wesleyan College West Virginia Wesleyan College West Virginia Wesleyan College Benchmark InstitutionBenchmark InstitutionBenchmark InstitutionBenchmark Institutionssss
UnitID Institution Name State
CC 2015:
Basic
(HD2015)
Grand
total(EF2014
All students
Undergradua
te total)
Grand
total(EF20
14 All
students
Graduate
and First
profession
Estimated
FTE
Enroll Fall
2014
First-time
Full-time
FR Fall 2014
Full-time
retention
rate 2014
(EF2014D)
Student-
to-faculty
ratio
(EF2014D)
Value of
endowment
assets at the
end of the fiscal
year (F113-
14_F2)
Total expenses-
Total amount
(F113-14_F2)
Tuition and
fees - Total
(F1314_F2)
Net Tuition
and Fees
Per 12
month FTE
Student
2013-14
Fall 2013
New FT
Freshmen
Fall 2013
New FT
Freshmen
Net tuition
and Fees
Fall 2013
New FT
Freshmen
Tuition and
Fee
Discount
Rate
Athletic
Affiliation ACA UMC
210571 Albright College PA Bach AS 2360 33 2351 540 76 15 $64,423,254 $53,560,772 $35,033,700 $14,952 410 $13,697 62.6% NCAA III 0 UMC
156213 Asbury University KY S Masters 1646 233 1497 303 81 12 $42,038,629 $34,569,887 $22,539,435 $13,853 322 $15,454 40.7% NAIA 0 0
237181 Bethany College WV Bach AS 727 30 749 246 70 11 $49,834,976 $24,092,431 $8,033,111 $11,411 265 $11,585 55.0% NCAA III ACA 0
231581 Bridgewater College VA Bach AS 1785 1772 488 74 15 $83,051,300 $40,393,423 $21,393,000 $11,576 552 $9,749 66.5% NCAA III 0 0
219806 Carson-Newman College TN M Masters 1757 605 1995 488 71 11 $51,811,396 $39,468,206 $23,449,853 $9,957 453 $10,325 56.4% NCAA II ACA 0
219833 Christian Brothers University TN M Masters 1296 371 1426 351 84 13 $31,704,414 $47,031,080 $20,909,647 $11,708 253 $12,091 57.1% NCAA II 0 0
232025 Emory and Henry College VA Bach AS 1012 26 1013 284 73 11 $96,614,350 $29,622,886 $10,755,228 $10,596 244 $9,861 66.0% NCAA III ACA UMC
232089 Ferrum College VA Bach DF 1451 1438 499 48 15 $49,199,012 $34,918,688 $19,506,221 $13,555 544 $13,439 53.0% NCAA III ACA UMC
220215 Freed-Hardeman University TN S Masters 1405 462 1545 340 74 14 $44,396,114 $37,325,146 $17,562,876 $10,289 321 $9,150 55.3% NAIA 0 0
212656 Geneva College PA M Masters 1417 300 1588 312 84 13 $38,063,014 $38,338,267 $25,186,936 $14,772 339 $12,104 52.0% NCAA III 0 0
156745 Georgetown College KY Bach AS 979 283 1061 271 67 9 $42,378,409 $35,529,808 $15,346,000 $13,763 237 $15,165 53.1% NAIA 0 0
203085 Heidelberg University OH Bach AS 1098 132 1145 363 68 13 $43,211,991 $31,623,348 $16,726,862 $13,140 345 $11,880 54.6% NCAA III 0 0
203128 Hiram College OH Bach AS 1235 24 1133 274 69 11 $69,399,237 $34,984,110 $19,272,958 $15,968 304 $12,929 57.3% NCAA III 0 0
162760 Hood College MD L Masters 1359 1006 1729 288 76 11 $83,449,740 $42,664,595 $26,466,957 $15,055 270 $13,462 59.5% NCAA III 0 0
213251 Juniata College PA Bach AS 1615 17 1583 423 88 13 $106,785,783 $49,283,612 $27,522,320 $18,107 390 $16,329 56.1% NCAA III 0 0
157076 Kentucky Wesleyan College KY Bach DF 709 678 230 66 12 $32,630,440 $14,432,594 $7,132,011 $11,023 157 $12,693 40.1% NCAA II 0 UMC
220516 King College TN L Masters 2427 470 2730 188 76 11 $35,638,722 $34,895,423 $25,839,959 $9,183 226 $8,254 66.9% NCAA II ACA 0
213507 Lebanon Valley College PA S Masters 1683 218 1738 413 85 11 $58,365,855 $54,370,628 $35,293,245 $20,319 404 $18,015 49.5% NCAA III 0 UMC
203845 Marietta College OH Bach DF 1371 129 1410 357 74 10 $78,654,296 $44,081,068 $24,672,234 $16,910 394 $13,593 57.4% NCAA III 0 0
220710 Maryville College TN Bach AS 1213 1182 334 71 13 $68,084,457 $29,041,150 $14,862,697 $11,900 313 $10,673 65.7% NCAA III ACA 0
204264 Muskingum University OH M Masters 1724 350 1655 384 71 13 $75,210,000 $35,874,389 $22,124,679 $11,844 404 $10,508 55.6% NCAA III 0 0
215798 Saint Vincent College PA Bach AS 1626 203 1725 449 82 12 $89,758,038 $50,115,120 $24,016,605 $13,328 339 $10,456 65.5% NCAA III 0 0
215947 Seton Hill University PA M Masters 1869 378 1864 330 79 14 $34,243,856 $47,451,239 $31,060,942 $14,494 346 $13,062 56.9% NCAA II 0 0
216357 Thiel College PA Bach AS 1074 1051 280 69 13 $31,127,387 $28,194,139 $14,050,379 $13,497 322 $12,758 52.4% NCAA III 0 0
237312 University of Charleston WV S Masters 1549 562 1967 332 61 15 $40,632,643 $41,546,948 $24,781,796 $13,730 240 $9,136 53.5% NCAA II ACA
234164 Virginia Union University VA Bach AS 1323 392 1676 420 50 14 $31,526,890 $32,779,669 $19,401,079 $11,260 380 $11,084 26.7% NCAA II 0 0
234173 Virginia Wesleyan College VA Bach AS 1501 1447 406 66 13 $57,712,712 $39,282,315 $23,686,303 $15,029 435 $17,162 47.2% NCAA III 0 UMC
216807 Westminster College PA Bach AS 1159 148 1182 278 82 10 $115,107,507 $38,643,504 $18,554,946 $12,921 318 $14,053 56.7% NCAA III 0 0
238078 Wheeling Jesuit University WV M Masters 1187 388 1269 252 74 12 $16,106,296 $36,711,502 $21,847,095 $17,805 268 $12,490 55.1% NCAA II ACA
206507 Wilmington College OH Bach DF 1200 1140 383 68 16 $36,997,412 $24,720,233 $12,452,969 $10,616 286 $12,265 56.5% NCAA III 0 0
Count 30 23 30 30 30 30 30 30 30 30 30 30 30 6 3
75%tile 1641 390 1728 411 78 14 $73,757,309 $42,385,183 $24,754,406 $14,907 393 $13,560 57.4% NAIA=3
Median 1388 283 1472 337 74 13 $49,516,994 $37,018,324 $21,620,048 $13,412 322 $12,378 55.8% NCAAII=8
25%tile 1190 131 1154 281 68 11 $37,263,813 $33,227,224 $16,935,866 $11,452 269 $10,549 53.0% NCAAIII=19
237969 West Virginia Wesleyan College 2013-14 IPEDS DataWV S Masters 1390 121 1478 415 73 13 $44,908,387 $28,406,786 $14,833,460 $10,294 471 $9,252 65.5%
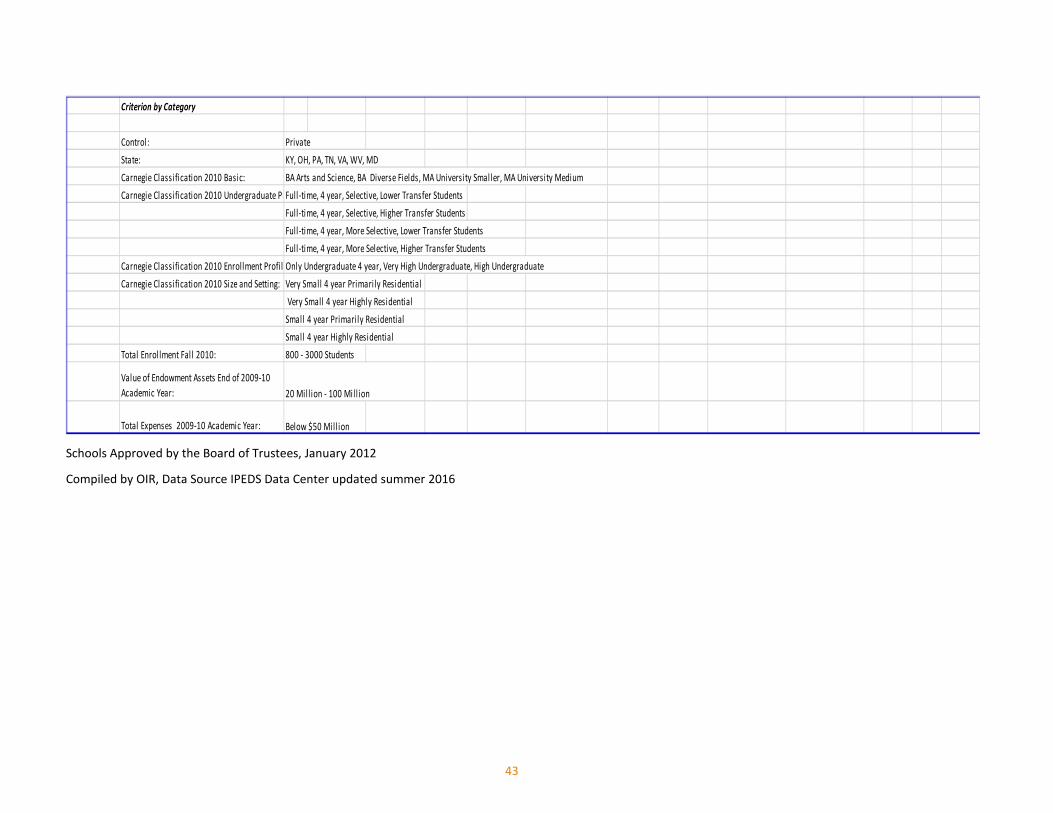
Criteria Based Benchmark Institutions Fall 2011 Updated with 2013-14 IPEDS Data
43
Schools Approved by the Board of Trustees, January 2012
Compiled by OIR, Data Source IPEDS Data Center updated summer 2016
Criterion by Category
Control: Private
State: KY, OH, PA, TN, VA, WV, MD
Carnegie Classification 2010 Basic: BA Arts and Science, BA Diverse Fields, MA University Smaller, MA University Medium
Carnegie Classification 2010 Undergraduate Profile:Full-time, 4 year, Selective, Lower Transfer Students
Full-time, 4 year, Selective, Higher Transfer Students
Full-time, 4 year, More Selective, Lower Transfer Students
Full-time, 4 year, More Selective, Higher Transfer Students
Carnegie Classification 2010 Enrollment Profile: Only Undergraduate 4 year, Very High Undergraduate, High Undergraduate
Carnegie Classification 2010 Size and Setting: Very Small 4 year Primarily Residential
Very Small 4 year Highly Residential
Small 4 year Primarily Residential
Small 4 year Highly Residential
Total Enrollment Fall 2010: 800 - 3000 Students
Value of Endowment Assets End of 2009-10
Academic Year: 20 Mill ion - 100 Mill ion
Total Expenses 2009-10 Academic Year: Below $50 Mill ion