West Virginia University - Calidad del Aire · diesel-hybrid powertrain. ... parallel with the West...
68
West Virginia University Center for Alternative Fuels, Engines & Emissions FINAL REPORT Chassis Dynamometer Emissions Characterization of Buses in Mexico City Presented to: Mexico City Secretariat of Environment (SMA) Contract: GDF-SMA-GEF-SC-027-04 Submitted by: Center for Alternative Fuels, Engines and Emissions Department of Mechanical and Aerospace Engineering West Virginia University March 31, 2005 West Virginia University Center for Alternative Fuels, Engines and Emissions Dept. of Mechanical and Aerospace Engineering P.O. Box 6106 Morgantown WV 26506-6106 Web: http://cafee.wvu.edu/ Phone: (304) 293-3111 ext 2323 Fax: (304) 293-6689
Transcript of West Virginia University - Calidad del Aire · diesel-hybrid powertrain. ... parallel with the West...

West Virginia University Center for Alternative Fuels, Engines & Emissions
FINAL REPORT
Chassis Dynamometer Emissions Characterization of Buses in Mexico City
Presented to:
Mexico City Secretariat of Environment (SMA)
Contract: GDF-SMA-GEF-SC-027-04
Submitted by:
Center for Alternative Fuels, Engines and Emissions
Department of Mechanical and Aerospace Engineering
West Virginia University
March 31, 2005
West Virginia University Center for Alternative Fuels, Engines and Emissions Dept. of Mechanical and Aerospace Engineering P.O. Box 6106 Morgantown WV 26506-6106 Web: http://cafee.wvu.edu/ Phone: (304) 293-3111 ext 2323 Fax: (304) 293-6689

West Virginia University Center for Alternative Fuels, Engines & Emissions
Introduction The objective of this project was to characterize the vehicle emissions from a variety of buses using both current and advanced engine control and aftertreatment technologies and low emission fuels in Mexico City, Mexico. Emissions were measured from nine vehicles including six utilizing diesel engines, two powered by natural gas and one employing a diesel-hybrid powertrain. For the diesel vehicles, emissions measurements were obtained while using standard pump (350 ppm sulfur), medium sulfur (50 ppm) and low-sulfur (15ppm) diesel fuels (Note: post testing fuel analysis revealed that the 50 ppm sulfur diesel actually contained 150 ppm sulfur).
Prior to initiating the test program, a representative driving cycle termed the �Mexico City Schedule� was developed from data obtained from in-use Mexico City transit buses. The schedule was representative of low-speed, high-speed and corridor transit bus operation. Details on the development of this driving schedule were included in a separate report titled �Development of the Mexico City Schedule for Characterization of Emissions and Performance from Transit Buses�.
During testing on five of the vehicles, the �Ride Along� Vehicle Emissions Measurement (RAVEM) system from Engine, Fuel, and Emissions Engineering, Inc. measured emissions in parallel with the West Virginia University laboratory. Data and conclusions from the correlation testing can be found in a separate report titled �Correlation between West Virginia University and Engine, Fuel, and Emissions Engineering, Inc.�s RAVEM Emissions Measurements from Transit Buses.�
Laboratory Description Emissions from the test vehicles were measured by the West Virginia University Transportable Heavy-Duty Vehicle Emissions Laboratory (TransLab). The WVU Transportable Laboratories were constructed to gather emissions data from in-use heavy-duty vehicles. Detailed information pertaining to the design and operation of the laboratories can be found in technical papers [1, 2, 3]. The laboratory was a fully functional heavy-duty chassis dynamometer with constant volume sampling (CVS) capability that can be physically transported to a bus operations site to conduct emissions testing.
Dynamometer The chassis dynamometer used for this research was mounted on a semi-trailer, with removable wheels, that can be lowered to the ground by hydraulic jacks. The vehicle to be tested was then driven onto the dynamometer rolls via ramps. In most chassis dynamometers the power is taken from a set of rolls upon which the vehicle is secured and driven. Large diameter rolls are not practical for a mobile unit. When small diameter rolls are used, tire slippage proves a problem by corrupting data and overheating tires. The WVU Transportable Chassis Dynamometer withdrew power by coupling directly to the vehicle drive axle via driveshafts connected to hub adapter installed in place of the outer drive wheels (Figure 1). The vehicle was supported on free-spinning rolls which served to link the driven wheels and maintain the same speed on both sides of the vehicle. The dynamometer components, which were largely symmetrical on each side of the vehicle, consisted of power absorbers and sets of selectable flywheels. Different combinations of flywheels in the flywheel set were engaged to allow simulation of inertial loads representative of desired vehicle weight (Figure 2). The vehicle was driven through a speed-time cycle by a driver receiving a prompt on a screen while vehicle speed and load were recorded by encoders and

West Virginia University Center for Alternative Fuels, Engines & Emissions
strain gage torque transducers. The road load applied to the vehicle was determined by performing on-road coast downs for each vehicle. Part of the applied load was dissipated through parasitic losses of the rotating components, and the remaining load was applied by the eddy current absorbers in closed loop control. Parasitic losses were determined using a coast down procedure performed prior to mounting the vehicle to the dynamometer.
Figure 1: Hub adapters connect the vehicle's drive axle to the power absorber unit
Figure 2: Flywheels were used to simulate vehicle inertia
Regulated Emissions Sampling Equipment Most environmental agencies worldwide have identified particulate matter (PM), oxides of nitrogen, (NOX) hydrocarbons (HC) and carbon monoxide (CO) as species that must be regulated and quantified. Additionally, in this program, carbon dioxide (CO2) was sampled since this species is a well-established indicator of engine fuel consumption and is also a major greenhouse gas. The exhaust from the test vehicle was ducted into a total exhaust,

West Virginia University Center for Alternative Fuels, Engines & Emissions
critical flow venturi-constant volume sampler (CFV-CVS) and mixed with HEPA filtered ambient air in the primary dilution tunnel. The primary dilution tunnel measured 18 inches (45cm) in diameter 20 feet (6.1m) in length. The flow rate of diluted exhaust was controlled and measured precisely by a critical flow venturi (CFV) system. Gaseous samples were drawn from the dilution tunnel ten diameters downstream of the exhaust injection zone to allow thorough mixing in the turbulent region of the dilution tunnel. The diluted exhaust was sampled and analyzed in accordance with the procedures outlined in the CFR 40 Part 86 Subpart N [4]. The diluted exhaust was analyzed using non-dispersive infrared (NDIR) detectors for CO and CO2, and using chemiluminescent detection for NOX. HC emissions were analyzed using a heated flame ionization detector (HFID). The gaseous data were available as continuous concentrations throughout the test, and the product of concentration and dilution tunnel flow were integrated to yield emissions in units of grams per mile (g/mile). In the case of CO, the laboratory operated two separate analyzers calibrated for different ranges. The lower ranged CO analyzer was set to capture the low-level CO emissions which occur during a majority of testing on diesel vehicles while the higher ranged CO analyzer was set to capture the spikes which occur during transient operation. PM was collected using 70-mm fluorocarbon coated glass fiber filter media and were determined gravimetrically. Fuel efficiencies were determined using a carbon balance, fuel properties and exhaust emissions data. The laboratory is shown in Figure 3.
Figure 3: WVU Transportable Laboratory testing the ALLISON hybrid-electric bus
Non-Regulated Species Sampling The non-regulated species measured in this program included nitrous oxide (N2O) and aldehydes. The aldehydes were quantified under a separate agreement by Environment Canada, and so only N2O emissions are discussed in this report. For each test, an integrated bag sample was collected by a heated sampling system and subsequently analyzed using an Innova 1302 photoacoustic analyzer. The 1302 sample train consisted of a heated stainless steel sample line, a heated head sample pump, a flow controller and a heated enclosure housing a 10-liter Tedlar® sample bag. Both the sampling line and bag enclosure were heated to 150° F to prevent condensation. Following collection, a sample was drawn from the Tedlar bag through the 1302 analyzer to determine N2O and CO2 levels. CO2 data measured using the Innova 1302 were compared with the CO2 data from the emissions laboratory�s NDIR analyzer to confirm that the 1302 analyzer was functioning properly and

West Virginia University Center for Alternative Fuels, Engines & Emissions
to check agreement between the 1302 instrument and the laboratory. The Innova 1302 system is shown in Figure 4.
Figure 4: Innova 1302 Photoacoustic analyzer and sampling system.
Vehicles and Fuel Table 1 shows the matrix of vehicles tested in this program. The original test plan called for ten vehicles to be tested however, on of the subject buses could no be tested due to engine malfunctions that could not be repaired in time for the tests to be accomplished. Engine control system problems were encountered during tests of the Ankai CNG bus which caused the vehicle to shut down intermittently thus preventing any successful testing on that vehicle. The buses were tested at a weight representing 70% of the full passenger load. In the case of the ALLISON hybrid bus, testing was conducted at two different weights (46,438 lbs., 35,000 lbs.) but only the results from testing at 35,000 lbs. are presented in this report. The reported test weight of 35,000 lbs. represents only 50% passenger loading for the ALLISON. WVU test procedures for determining testing weight require that the vehicle�s curb weight and passenger loading be combined to determine an appropriate inertial flywheel setting. The ALLISON hybrid being tested in this program had a chassis that included additional equipment designed for the U.S. market that would not be included on any Mexico City models. The 35,000 lb. test weight was determined by estimating the weight of the additional equipment (wheel chair lifts, etc.) and subtracting it from the curb weight prior to calculating testing weight. State of charge corrections were not required for this vehicle since the control system was load following and net battery state of charge change did not exceed 1% of total energy expended over the test cycles.

West Virginia University Center for Alternative Fuels, Engines & Emissions
Table 1: Vehicles tested in this program
Ref. Name Vehicle Transmission
Test Weight (lbs)
Curb Weight (lbs)
Passenger Capacity
Odometer Reading (miles) Engine Emissions Controls
ALLISON 2004 ALLISON Hybrid 35000 29000 113 36846 2002 Cummins ISB-230 CRT Particulate Filter & Catalyst Module
Ankai 2004 Ankai 5 Speed Auto 32150 22700 90 1055 2004 Cummins B5.9-230G
Fleetguard Catalytic Converter Model #3927832
BUSSCAR 2004 BUSSCAR 7 Speed Manual 33025 23425 91 693 2004 Cummins BG-230
Donaldson Catalytic Converter Model #M110857
FAW 2004 Allied Motors 4 Speed Auto 48025 33175 140 553 2004 Cummins CG280
Fleetguard Catalytic Converter Model #3928277
MB10 2004 Marcopolo 5 Speed Manual 26996 17800 87 13749 2004 Mercedes-Benz OM924LA None
RTP1 2002 Marcopolo 5 Speed Auto 30070 21100 85 100142 2002 Mercedes-Benz OM906LA Johnson-Matthey
RTP3 2002 Marcopolo 5 Speed Auto 30220 21250 85 89333 2002 Mercedes-Benz OM906LA None
SCANIA15 2003 SCANIA 4 Speed Auto 50040 35400 139 19819 2003 SCANIA DSC9-260 Oxidation Catalyst
SCANIA18 2004 SCANIA 4 Speed Auto 57025 40075 161 998 2004 SCANIA DC9-300 None
VOLVO12 2004 VOLVO 5 Speed Auto 32050 22500 91 4282 2004 VOLVO VE D7C-300 None
West Virginia University Center for Alternative Fuels, Engines & Emissions
Three different diesel fuels were used during the testing including a pump number 2 diesel designated D2, a low sulfur diesel fuel designated D2S50, and an ultra-low sulfur diesel fuel designated D2S15. In order to test on fuels different than the fuel in the tank when the vehicle was received, the fuel supply and return hoses were routed to fifty-five gallon drums external to the vehicle and a sufficient quantity of fuel was flushed through the vehicle fuel system and into a waste drum to prevent cross-contamination. Fuel properties of each of the diesel fuels are listed in Table 2. These properties were determined from samples analyzed by Saybolt LP (Carson, Ca).
Table 2 - Selected properties of diesel fuels used during testing
D2S15 D2S50 D2 CNG
Heating Value (BTU/lb) 18576 18577 18302 22745
% Carbon (by weight) 86.97 86.5 86.31 74.04
Cetane Number 41.5 57.3 49.7 n/a
Density (g/ml) 0.8515 0.8454 0.8376 0.7317 kg/m3
% Aromatics (by volume) 29.4 14.3 25.0 n/a
% Hydrogen Content (by weight) 12.93 13.83 13.44 23.70
Total Sulfur (ppm) 4.3 152.8 355.3 n/a
Analysis of the diesel fuels was not finished until after completion of the testing program when it was discovered that the 50 ppm sulfur diesel actually contained 152.8 ppm sulfur. WVU believes that the fuel may have been contaminated by the drums that the fuel was stored in at STE. The drums had previously contained lubricating oil which typically has high sulfur content. Fractional analysis was performed on the CNG fuel used by the natural gas vehicles and is presented in Table 3. The CNG fuel had a lower heating value of 1037 BTU/scf and a density of 20.7 grams per standard cubic foot.
Table 3 - Fractional analysis of natural gas fuel
Component % Molar Fraction
Methane 92.633
Ethane 5.568
Propane 0.301
I-Butane 0.052
N-Butane 0.048
I-Pentane 0.021
N-Pentane 0.017
Nitrogen 0.634
Carbon Dioxide 0.629
Oxygen 0.022
Hexanes+ 0.074

West Virginia University Center for Alternative Fuels, Engines & Emissions
State of Charge Correction The research agenda provided for state of charge (SOC) correction, if necessary, on the ALLISON hybrid bus. Guidance for SOC correction is given by SAE J2711 [5]. In the execution of this program, SOC was determined for the ALLISON bus through an amp-hr measurement reported by ALLISON engineers and battery system voltage of 600 volts. It was determined that the highest SOC correction was approximately 0.25% and, therefore, according to SAE J2711, no SOC correction was necessary.
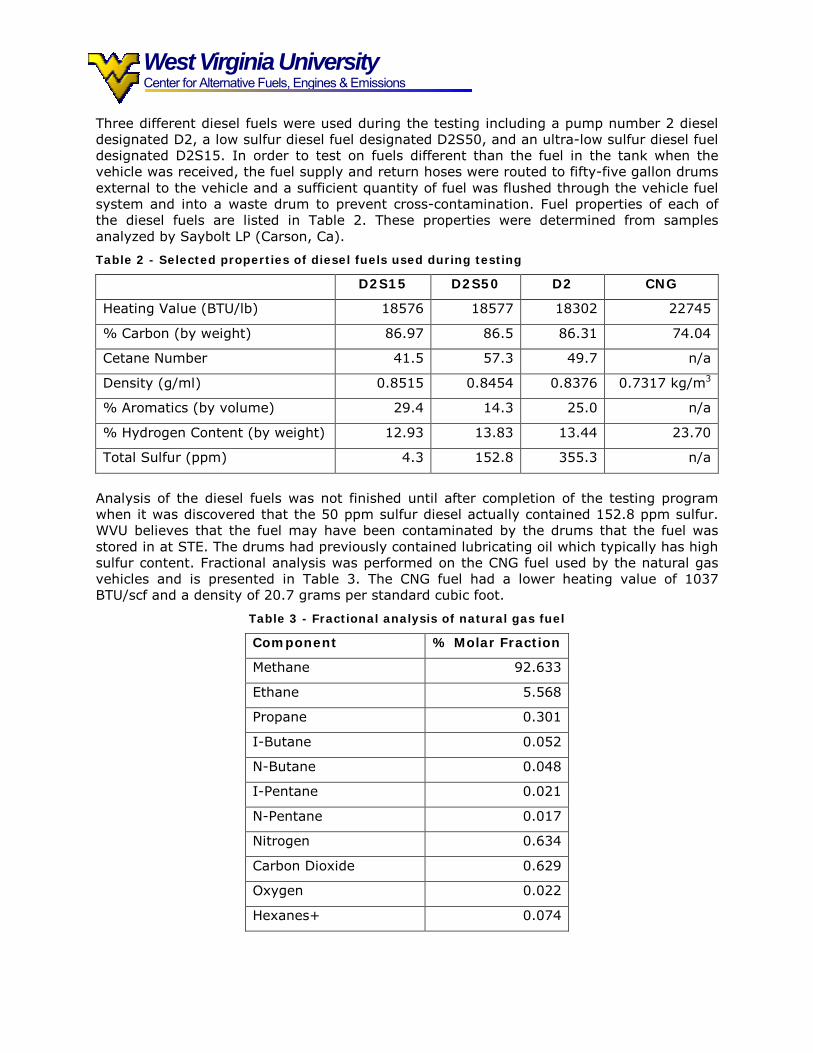
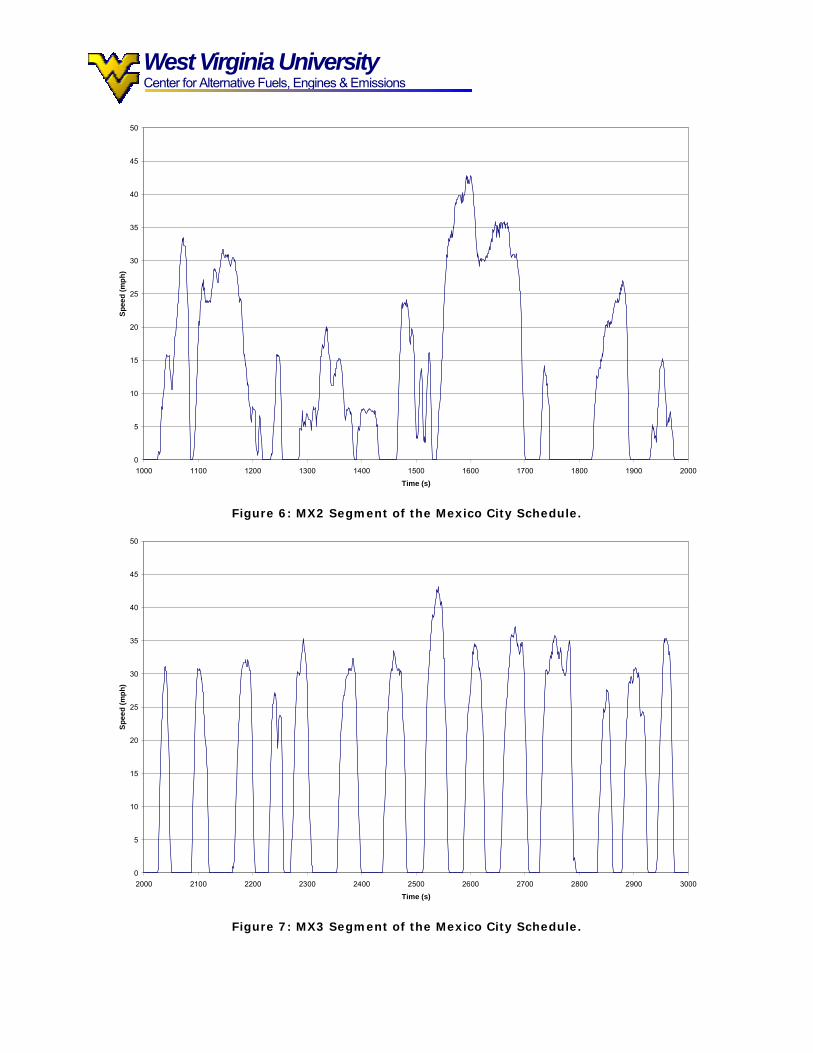
Driving Schedule Development Three driving cycles representative of transit bus operation in Mexico City were developed for this program. WVU instrumented several buses operating on different bus routes with global positioning system (GPS) data-loggers and gathered speed-time data from over 50 hours of operation. This data was then filtered to produce an array of microtrips which were then randomly combined to form test cycles. WVU selected three cycles, each with a duration of 1000 seconds, which best represented the speed-time characteristics of selected sections of the overall data set. Segment MX1 (Figure 5) represented low-speed operation, MX2 (Figure 6) represented medium-speed operation and MX3 (Figure 7) represented transit bus behavior when utilizing specific �bus only� traffic lanes, associated with Bus Rapid Transit (BRT). The three cycles were combined to form the Mexico City Schedule (MCS - Figure 8). More detailed information about development of the Mexico City Schedule can be found in a separate report to the Mexico City Secretariat of Environment titled �Development of the Mexico City Schedule for Characterization of Emissions and Performance from Transit Buses�.
0
5
10
15
20
25
30
35
40
45
50
0 100 200 300 400 500 600 700 800 900 1000Time (s)
Spee
d (m
ph)
Figure 5: MX1 Segment of the Mexico City Schedule.
West Virginia University Center for Alternative Fuels, Engines & Emissions
0
5
10
15
20
25
30
35
40
45
50
1000 1100 1200 1300 1400 1500 1600 1700 1800 1900 2000Time (s)
Spee
d (m
ph)
Figure 6: MX2 Segment of the Mexico City Schedule.
0
5
10
15
20
25
30
35
40
45
50
2000 2100 2200 2300 2400 2500 2600 2700 2800 2900 3000Time (s)
Spee
d (m
ph)
Figure 7: MX3 Segment of the Mexico City Schedule.

West Virginia University Center for Alternative Fuels, Engines & Emissions
0
5
10
15
20
25
30
35
40
45
50
0 500 1000 1500 2000 2500 3000Time (s)
Spee
d (m
ph)
Figure 8: Mexico City Schedule (MCS)
0
10
20
30
40
50
60
0 200 400 600 800 1000 1200 1400 1600 1800Time (s)
Spee
d (m
ph)
Figure 9: European Transient Cycle (ETC).

West Virginia University Center for Alternative Fuels, Engines & Emissions
Each vehicle was also evaluated using the European Transient Cycle (ETC) which represents urban, rural and highway driving conditions and has a total duration of 1800 seconds (600 seconds for each segment). The urban driving segment has frequent starts and stops and idling and a maximum speed of 31 mph. The rural segment has a steep acceleration with an average speed of 44.6 mph while the highway segment has an average speed of 54.5 mph. The ETC is shown in Figure 9.
Coast Down Procedures In order to mimic bus operation accurately, those factors that contribute to on-road losses such as wind resistance and tire rolling losses. A vehicle�s motion is governed by the following road load equation.
θµρ sin21
21 3 mgVmgVVAC
dtdVmV D ++=
Equation 1- Road load equation
Where,
dtdVmV
21
vehicle inertial power
3
21 VACDρ
power loss to aerodynamic drag
mgVµ power loss to tire rolling resistance
θsinmgV power loss/gain from elevation changes
m = vehicle mass, V = velocity, ρ = air density, A = frontal area, CD = drag coefficient, µ = tire rolling loss coefficient, g = acceleration due to gravity and θ = road grade
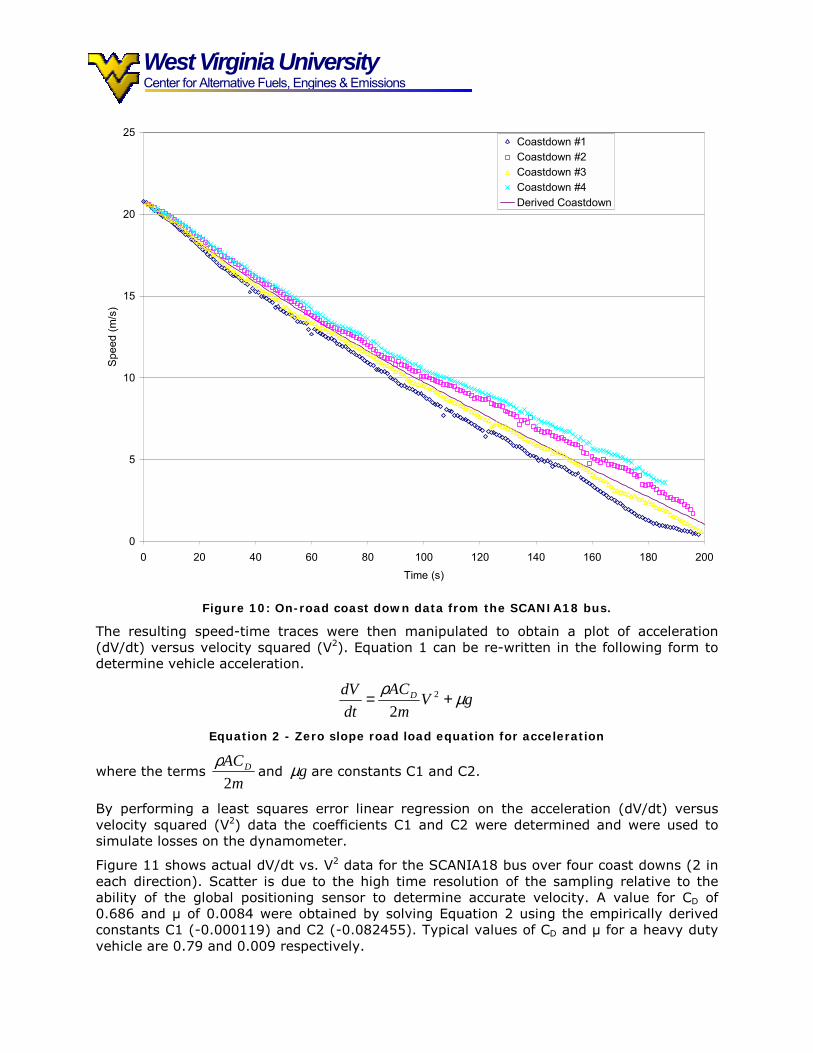
Since the vehicle�s drag coefficient and rolling resistance cannot be determined using static measurements, an empirical method was applied to determine their values. Each vehicle in the test program was driven up to approximately 20 m/s on a near-level road and allowed to coast down to a near stop while data was acquired using global positioning system data loggers. To help eliminate any remaining elevation effects the vehicle was coasted down in both directions. Figure 10 shows actual coast down data for the SCANIA18 bus with the derived coast down curve along the same stretch of roadway.
West Virginia University Center for Alternative Fuels, Engines & Emissions
0
5
10
15
20
25
0 20 40 60 80 100 120 140 160 180 200Time (s)
Spee
d (m
/s)
Coastdown #1Coastdown #2Coastdown #3Coastdown #4Derived Coastdown
Figure 10: On-road coast down data from the SCANIA18 bus.
The resulting speed-time traces were then manipulated to obtain a plot of acceleration (dV/dt) versus velocity squared (V2). Equation 1 can be re-written in the following form to determine vehicle acceleration.
gVm
ACdtdV D µρ += 2
2
Equation 2 - Zero slope road load equation for acceleration
where the terms m
ACD
2ρ
and gµ are constants C1 and C2.
By performing a least squares error linear regression on the acceleration (dV/dt) versus velocity squared (V2) data the coefficients C1 and C2 were determined and were used to simulate losses on the dynamometer.
Figure 11 shows actual dV/dt vs. V2 data for the SCANIA18 bus over four coast downs (2 in each direction). Scatter is due to the high time resolution of the sampling relative to the ability of the global positioning sensor to determine accurate velocity. A value for CD of 0.686 and µ of 0.0084 were obtained by solving Equation 2 using the empirically derived constants C1 (-0.000119) and C2 (-0.082455). Typical values of CD and µ for a heavy duty vehicle are 0.79 and 0.009 respectively.

West Virginia University Center for Alternative Fuels, Engines & Emissions
y = -0.000119x - 0.082455R2 = 0.120705
-0.3
-0.25
-0.2
-0.15
-0.1
-0.05
0
0.05
0.1
0 50 100 150 200 250 300 350 400 450
V2 (m2/s2)
dV/d
t (m
/s2 )
Figure 11: Coast down deceleration data for the SCANIA18 bus (40,075 lb curb weight)
Testing Procedures Background tests are performed both at the beginning and end of each test day. During these tests, the laboratory sampling system was operated in the same fashion as it would be during a normal test but the vehicle was not operated. This allowed the laboratory to determine background particulate levels for use in correcting particulate samples from the vehicles. For this program, the background tests were 1800 seconds in duration.
Once the initial background sample has been taken, the vehicle is exercised at a steady state speed to warm the dynamometer gear train and allow the flywheel differentials to reach 100OF. After the dynamometer warm-up, emissions were measured while the vehicle was exercised through the MX1 portion of the MCS which allowed technicians to ensure that laboratory instrumentation was operating properly (While this data was recorded, it was not used in comparisons in this report). The vehicle and laboratory were then allowed to soak for 20 minutes prior to initiating reportable testing. After each test, a 20-minute soak period was observed. If the specified soak period was exceeded, another warm up / soak sequence was initiated before performing the next reportable test.
Gaseous samples from the dilution tunnel were continuously analyzed and recorded during the testing process. Additionally, an integrated gas sample was collected in a Tedlar bag for post test analysis. To obtain emissions results from the test, Equation 3 was applied using

West Virginia University Center for Alternative Fuels, Engines & Emissions
610
11
−−××
=DF
EEVE
backgroundconcEmix
mass
ρ
Equation 3 - Mass emissions calculation
where
massE Total mass in grams of emission
mixV Total volume of dilute exhaust throughout the test
Eρ Density of the emission of interest
concE Concentration in parts per million (ppm) of the emission in the dilute exhaust stream
backgroundE Concentration in ppm of the emission in the dilution air (background)
DF Dilution factor
In the case of oxides of nitrogen, the final result is multiplied by a humidity correction factor (KH). The results of these calculations were then divided by the distance traveled to obtain emissions results in grams per mile (g/mile). To present continuous emissions on a grams per second basis as they are in Appendix C, Equation 3 is used to convert each instantaneous concentration from a parts per million concentration to a mass and that mass is integrated over that time period (in this case, one second) to get a grams per second value.
Quality Assurance As part of the Quality Assurance Program, the WVU researchers performed redundant measurements of NOX, PM and CO2. In the case of NOX, two separate analyzers were used. Figure 12 shows that there was outstanding agreement between these two analyzers. PM was measured using the research grade filter method, as well as using a Tapered Element Oscillating Microbalance (TEOM) for a approximately half of the runs.

West Virginia University Center for Alternative Fuels, Engines & Emissions
y = 1.0002xR2 = 0.9999
0
50
100
150
200
250
0 50 100 150 200 250Primary NOX Analyzer (grams)
Seco
ndar
y N
OX
Ana
lyze
r (gr
ams)
Figure 12: Comparison of Oxides of Nitrogen measurements from parallel analyzers.
TEOM data have been compared with PM filter data in several previous studies. An Australian study found the TEOM to report 16% less mass than a PM filter, on average [5]. Gilbert et al. [7] examined this relationship as the sampling temperature and flow rate of the TEOM were adjusted. Kelley and Morgan [8] found that the TEOM reported 20 to 25% less mass than the filter. Other workers, including Moosmuller et al. [9], have confirmed that the TEOM measures less mass than a filter. Figure 13 shows that the TEOM and filter methods in this survey correlated well, with the TEOM yielded about 76% of the filter mass which compares well to results reported by Kelly and Morgan.

West Virginia University Center for Alternative Fuels, Engines & Emissions
y = 0.7595xR2 = 0.9772
0
2
4
6
8
10
12
14
0 2 4 6 8 10 12 14 16 18PM from Filter (grams)
PM fr
om T
EOM
(gra
ms)
Figure 13: Comparison of particulate matter emissions between filter media and a TEOM device.
The primary CO2 measurement method by a research grade infrared analyzer, and could be found both by integration of data recorded continuously during the test by the analysis of batch samples collected in bags. The Innova photoacoustic analyzer used to measure N2O was also used on a substantial fraction of the runs to measure CO2. Figure 14 compares photoacoustic and integrated continuous infrared CO2, and confirms good agreement for the measurements. Good agreements on CO2 results between the Innova and laboratory gives a measure of confidence in the N2O data measured using the Innova 1302.

West Virginia University Center for Alternative Fuels, Engines & Emissions
y = 1.0111xR2 = 0.9649
10000
12000
14000
16000
18000
20000
22000
24000
26000
28000
30000
10000 12000 14000 16000 18000 20000 22000 24000 26000 28000 30000CO2 from Infrared Analyzer (grams)
CO
2 fom
130
2 Ph
otoa
cous
tic A
naly
zer (
gram
s)
Figure 14: Comparison of carbon dioxide measurements between photoacoustic and infrared analyzers.
Additional confidence checks for the WVU measurements are described in the report titled �Correlation between West Virginia University and Engine, Fuel, and Emissions Engineering, Inc.�s RAVEM Emissions Measurements from Transit Buses.�.

West Virginia University Center for Alternative Fuels, Engines & Emissions
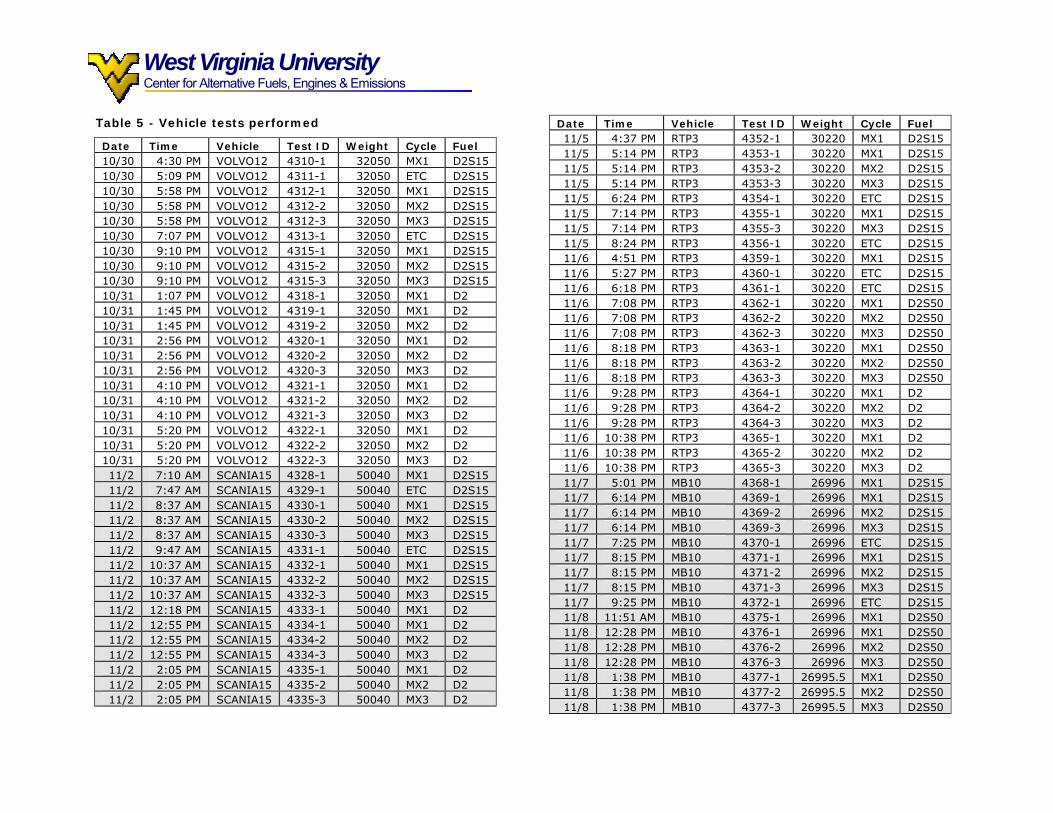
Results and Discussion Table 4 presents a summary of the tests performed during this program while Table 5 lists the dates, times, vehicles, weights, test cycles and fuels for those tests. Vehicle and fuel information can be cross referenced to Table 1 and Table 2 presented earlier in the report. Full emissions and fuel economy data are contained in Appendix A. It is recognized that the statistical significance of the results and conclusion could have been strengthened had more repeat tests been conducted; however, funding limitations restricted the number of repeat tests that could be performed.
In reporting emissions data, integrated continuous data is normally used with the integrated bag data being used as a check. In the case of CO, integrated bag data is used for the final CO result for a combination of factors. CO �spikes� during transient operation but a majority of each test, measurement levels are less than 10% that of the spikes. When operating in the lowest 5% of their range, CO analyzers do not perform as accurately. WVU employs two CO analyzers operating in different ranges. The higher ranged analyzer is able to measure all of the transient spikes while the lower range CO analyzer, which goes off scale during continuous measurement, is able to more accurately measure the integrated bag data.
Table 4 - Summary of tests performed during this program
Cycle Fuel ALLISON BUSSCAR FAW MB10 RTP1 RTP3 SCANIA15 SCANIA18 VOLVO12 Total
ETC CNG 2 2
D2S15 2 2 2 4 2 1 2 15
ETC Total 2 2 2 2 4 2 1 2 17
MX1 CNG 4 3 7
D2 2 2 3 5 12
D2S15 3 3 3 4 3 3 3 22
D2S50 3 2 2 3 10
MX1 Total 3 4 3 8 5 8 6 6 8 51
MX2 CNG 2 2 4
D2 2 2 2 4 10
D2S15 2 2 1 1 2 3 2 13
D2S50 2 2 2 2 8
MX2 Total 2 2 2 6 3 5 4 5 6 35
MX3 CNG 2 2 4
D2 2 2 2 3 9
D2S15 2 2 1 2 2 2 2 13
D2S50 2 2 2 2 8
MX3 Total 2 2 2 6 3 6 4 4 5 34
Grand Total 9 10 7 22 13 23 16 16 21 137
West Virginia University Center for Alternative Fuels, Engines & Emissions
Table 5 - Vehicle tests performed
Date Time Vehicle Test ID Weight Cycle Fuel 10/30 4:30 PM VOLVO12 4310-1 32050 MX1 D2S15 10/30 5:09 PM VOLVO12 4311-1 32050 ETC D2S15 10/30 5:58 PM VOLVO12 4312-1 32050 MX1 D2S15 10/30 5:58 PM VOLVO12 4312-2 32050 MX2 D2S15 10/30 5:58 PM VOLVO12 4312-3 32050 MX3 D2S15 10/30 7:07 PM VOLVO12 4313-1 32050 ETC D2S15 10/30 9:10 PM VOLVO12 4315-1 32050 MX1 D2S15 10/30 9:10 PM VOLVO12 4315-2 32050 MX2 D2S15 10/30 9:10 PM VOLVO12 4315-3 32050 MX3 D2S15 10/31 1:07 PM VOLVO12 4318-1 32050 MX1 D2 10/31 1:45 PM VOLVO12 4319-1 32050 MX1 D2 10/31 1:45 PM VOLVO12 4319-2 32050 MX2 D2 10/31 2:56 PM VOLVO12 4320-1 32050 MX1 D2 10/31 2:56 PM VOLVO12 4320-2 32050 MX2 D2 10/31 2:56 PM VOLVO12 4320-3 32050 MX3 D2 10/31 4:10 PM VOLVO12 4321-1 32050 MX1 D2 10/31 4:10 PM VOLVO12 4321-2 32050 MX2 D2 10/31 4:10 PM VOLVO12 4321-3 32050 MX3 D2 10/31 5:20 PM VOLVO12 4322-1 32050 MX1 D2 10/31 5:20 PM VOLVO12 4322-2 32050 MX2 D2 10/31 5:20 PM VOLVO12 4322-3 32050 MX3 D2 11/2 7:10 AM SCANIA15 4328-1 50040 MX1 D2S15 11/2 7:47 AM SCANIA15 4329-1 50040 ETC D2S15 11/2 8:37 AM SCANIA15 4330-1 50040 MX1 D2S15 11/2 8:37 AM SCANIA15 4330-2 50040 MX2 D2S15 11/2 8:37 AM SCANIA15 4330-3 50040 MX3 D2S15 11/2 9:47 AM SCANIA15 4331-1 50040 ETC D2S15 11/2 10:37 AM SCANIA15 4332-1 50040 MX1 D2S15 11/2 10:37 AM SCANIA15 4332-2 50040 MX2 D2S15 11/2 10:37 AM SCANIA15 4332-3 50040 MX3 D2S15 11/2 12:18 PM SCANIA15 4333-1 50040 MX1 D2 11/2 12:55 PM SCANIA15 4334-1 50040 MX1 D2 11/2 12:55 PM SCANIA15 4334-2 50040 MX2 D2 11/2 12:55 PM SCANIA15 4334-3 50040 MX3 D2 11/2 2:05 PM SCANIA15 4335-1 50040 MX1 D2 11/2 2:05 PM SCANIA15 4335-2 50040 MX2 D2 11/2 2:05 PM SCANIA15 4335-3 50040 MX3 D2
Date Time Vehicle Test ID Weight Cycle Fuel 11/5 4:37 PM RTP3 4352-1 30220 MX1 D2S15 11/5 5:14 PM RTP3 4353-1 30220 MX1 D2S15 11/5 5:14 PM RTP3 4353-2 30220 MX2 D2S15 11/5 5:14 PM RTP3 4353-3 30220 MX3 D2S15 11/5 6:24 PM RTP3 4354-1 30220 ETC D2S15 11/5 7:14 PM RTP3 4355-1 30220 MX1 D2S15 11/5 7:14 PM RTP3 4355-3 30220 MX3 D2S15 11/5 8:24 PM RTP3 4356-1 30220 ETC D2S15 11/6 4:51 PM RTP3 4359-1 30220 MX1 D2S15 11/6 5:27 PM RTP3 4360-1 30220 ETC D2S15 11/6 6:18 PM RTP3 4361-1 30220 ETC D2S15 11/6 7:08 PM RTP3 4362-1 30220 MX1 D2S50 11/6 7:08 PM RTP3 4362-2 30220 MX2 D2S50 11/6 7:08 PM RTP3 4362-3 30220 MX3 D2S50 11/6 8:18 PM RTP3 4363-1 30220 MX1 D2S50 11/6 8:18 PM RTP3 4363-2 30220 MX2 D2S50 11/6 8:18 PM RTP3 4363-3 30220 MX3 D2S50 11/6 9:28 PM RTP3 4364-1 30220 MX1 D2 11/6 9:28 PM RTP3 4364-2 30220 MX2 D2 11/6 9:28 PM RTP3 4364-3 30220 MX3 D2 11/6 10:38 PM RTP3 4365-1 30220 MX1 D2 11/6 10:38 PM RTP3 4365-2 30220 MX2 D2 11/6 10:38 PM RTP3 4365-3 30220 MX3 D2 11/7 5:01 PM MB10 4368-1 26996 MX1 D2S15 11/7 6:14 PM MB10 4369-1 26996 MX1 D2S15 11/7 6:14 PM MB10 4369-2 26996 MX2 D2S15 11/7 6:14 PM MB10 4369-3 26996 MX3 D2S15 11/7 7:25 PM MB10 4370-1 26996 ETC D2S15 11/7 8:15 PM MB10 4371-1 26996 MX1 D2S15 11/7 8:15 PM MB10 4371-2 26996 MX2 D2S15 11/7 8:15 PM MB10 4371-3 26996 MX3 D2S15 11/7 9:25 PM MB10 4372-1 26996 ETC D2S15 11/8 11:51 AM MB10 4375-1 26996 MX1 D2S50 11/8 12:28 PM MB10 4376-1 26996 MX1 D2S50 11/8 12:28 PM MB10 4376-2 26996 MX2 D2S50 11/8 12:28 PM MB10 4376-3 26996 MX3 D2S50 11/8 1:38 PM MB10 4377-1 26995.5 MX1 D2S50 11/8 1:38 PM MB10 4377-2 26995.5 MX2 D2S50 11/8 1:38 PM MB10 4377-3 26995.5 MX3 D2S50
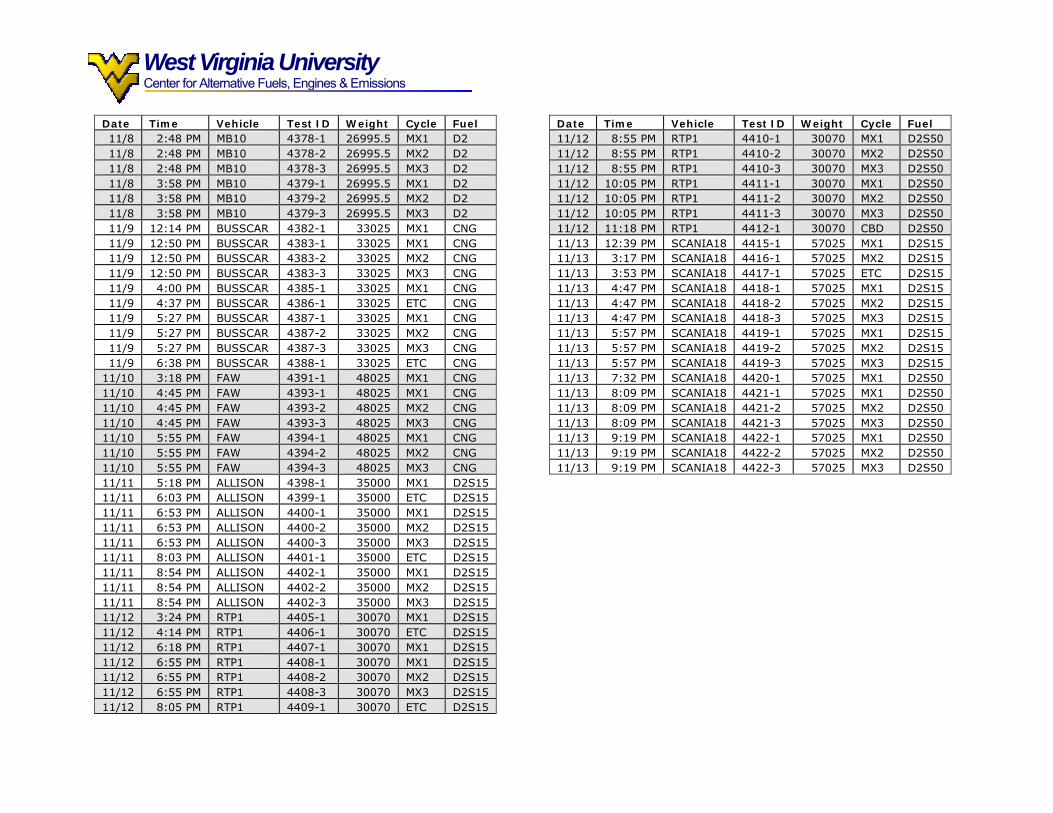
West Virginia University Center for Alternative Fuels, Engines & Emissions
Date Time Vehicle Test ID Weight Cycle Fuel 11/8 2:48 PM MB10 4378-1 26995.5 MX1 D2 11/8 2:48 PM MB10 4378-2 26995.5 MX2 D2 11/8 2:48 PM MB10 4378-3 26995.5 MX3 D2 11/8 3:58 PM MB10 4379-1 26995.5 MX1 D2 11/8 3:58 PM MB10 4379-2 26995.5 MX2 D2 11/8 3:58 PM MB10 4379-3 26995.5 MX3 D2 11/9 12:14 PM BUSSCAR 4382-1 33025 MX1 CNG 11/9 12:50 PM BUSSCAR 4383-1 33025 MX1 CNG 11/9 12:50 PM BUSSCAR 4383-2 33025 MX2 CNG 11/9 12:50 PM BUSSCAR 4383-3 33025 MX3 CNG 11/9 4:00 PM BUSSCAR 4385-1 33025 MX1 CNG 11/9 4:37 PM BUSSCAR 4386-1 33025 ETC CNG 11/9 5:27 PM BUSSCAR 4387-1 33025 MX1 CNG 11/9 5:27 PM BUSSCAR 4387-2 33025 MX2 CNG 11/9 5:27 PM BUSSCAR 4387-3 33025 MX3 CNG 11/9 6:38 PM BUSSCAR 4388-1 33025 ETC CNG
11/10 3:18 PM FAW 4391-1 48025 MX1 CNG 11/10 4:45 PM FAW 4393-1 48025 MX1 CNG 11/10 4:45 PM FAW 4393-2 48025 MX2 CNG 11/10 4:45 PM FAW 4393-3 48025 MX3 CNG 11/10 5:55 PM FAW 4394-1 48025 MX1 CNG 11/10 5:55 PM FAW 4394-2 48025 MX2 CNG 11/10 5:55 PM FAW 4394-3 48025 MX3 CNG 11/11 5:18 PM ALLISON 4398-1 35000 MX1 D2S15 11/11 6:03 PM ALLISON 4399-1 35000 ETC D2S15 11/11 6:53 PM ALLISON 4400-1 35000 MX1 D2S15 11/11 6:53 PM ALLISON 4400-2 35000 MX2 D2S15 11/11 6:53 PM ALLISON 4400-3 35000 MX3 D2S15 11/11 8:03 PM ALLISON 4401-1 35000 ETC D2S15 11/11 8:54 PM ALLISON 4402-1 35000 MX1 D2S15 11/11 8:54 PM ALLISON 4402-2 35000 MX2 D2S15 11/11 8:54 PM ALLISON 4402-3 35000 MX3 D2S15 11/12 3:24 PM RTP1 4405-1 30070 MX1 D2S15 11/12 4:14 PM RTP1 4406-1 30070 ETC D2S15 11/12 6:18 PM RTP1 4407-1 30070 MX1 D2S15 11/12 6:55 PM RTP1 4408-1 30070 MX1 D2S15 11/12 6:55 PM RTP1 4408-2 30070 MX2 D2S15 11/12 6:55 PM RTP1 4408-3 30070 MX3 D2S15 11/12 8:05 PM RTP1 4409-1 30070 ETC D2S15
Date Time Vehicle Test ID Weight Cycle Fuel 11/12 8:55 PM RTP1 4410-1 30070 MX1 D2S50 11/12 8:55 PM RTP1 4410-2 30070 MX2 D2S50 11/12 8:55 PM RTP1 4410-3 30070 MX3 D2S50 11/12 10:05 PM RTP1 4411-1 30070 MX1 D2S50 11/12 10:05 PM RTP1 4411-2 30070 MX2 D2S50 11/12 10:05 PM RTP1 4411-3 30070 MX3 D2S50 11/12 11:18 PM RTP1 4412-1 30070 CBD D2S50 11/13 12:39 PM SCANIA18 4415-1 57025 MX1 D2S15 11/13 3:17 PM SCANIA18 4416-1 57025 MX2 D2S15 11/13 3:53 PM SCANIA18 4417-1 57025 ETC D2S15 11/13 4:47 PM SCANIA18 4418-1 57025 MX1 D2S15 11/13 4:47 PM SCANIA18 4418-2 57025 MX2 D2S15 11/13 4:47 PM SCANIA18 4418-3 57025 MX3 D2S15 11/13 5:57 PM SCANIA18 4419-1 57025 MX1 D2S15 11/13 5:57 PM SCANIA18 4419-2 57025 MX2 D2S15 11/13 5:57 PM SCANIA18 4419-3 57025 MX3 D2S15 11/13 7:32 PM SCANIA18 4420-1 57025 MX1 D2S50 11/13 8:09 PM SCANIA18 4421-1 57025 MX1 D2S50 11/13 8:09 PM SCANIA18 4421-2 57025 MX2 D2S50 11/13 8:09 PM SCANIA18 4421-3 57025 MX3 D2S50 11/13 9:19 PM SCANIA18 4422-1 57025 MX1 D2S50 11/13 9:19 PM SCANIA18 4422-2 57025 MX2 D2S50 11/13 9:19 PM SCANIA18 4422-3 57025 MX3 D2S50
West Virginia University Center for Alternative Fuels, Engines & Emissions
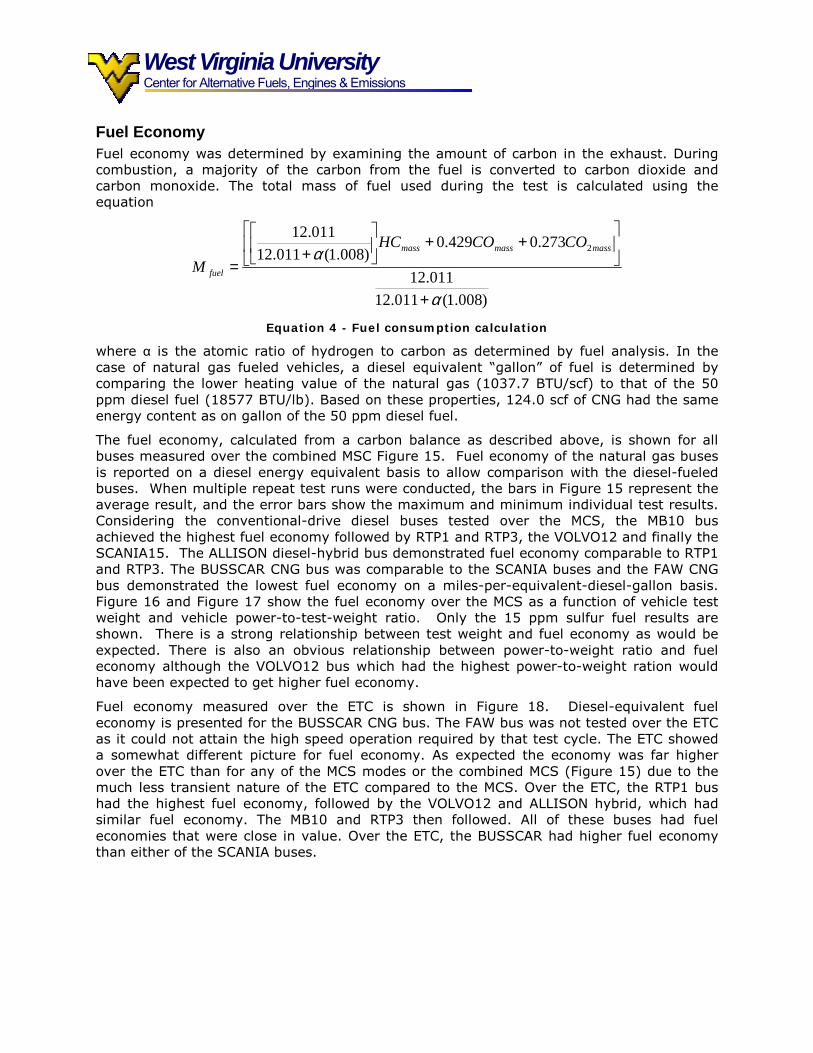
Fuel Economy Fuel economy was determined by examining the amount of carbon in the exhaust. During combustion, a majority of the carbon from the fuel is converted to carbon dioxide and carbon monoxide. The total mass of fuel used during the test is calculated using the equation
)008.1(011.12011.12
273.0429.0)008.1(011.12
011.122
α
α
+
++
+
=massmassmass
fuel
COCOHCM
Equation 4 - Fuel consumption calculation
where α is the atomic ratio of hydrogen to carbon as determined by fuel analysis. In the case of natural gas fueled vehicles, a diesel equivalent �gallon� of fuel is determined by comparing the lower heating value of the natural gas (1037.7 BTU/scf) to that of the 50 ppm diesel fuel (18577 BTU/lb). Based on these properties, 124.0 scf of CNG had the same energy content as on gallon of the 50 ppm diesel fuel.
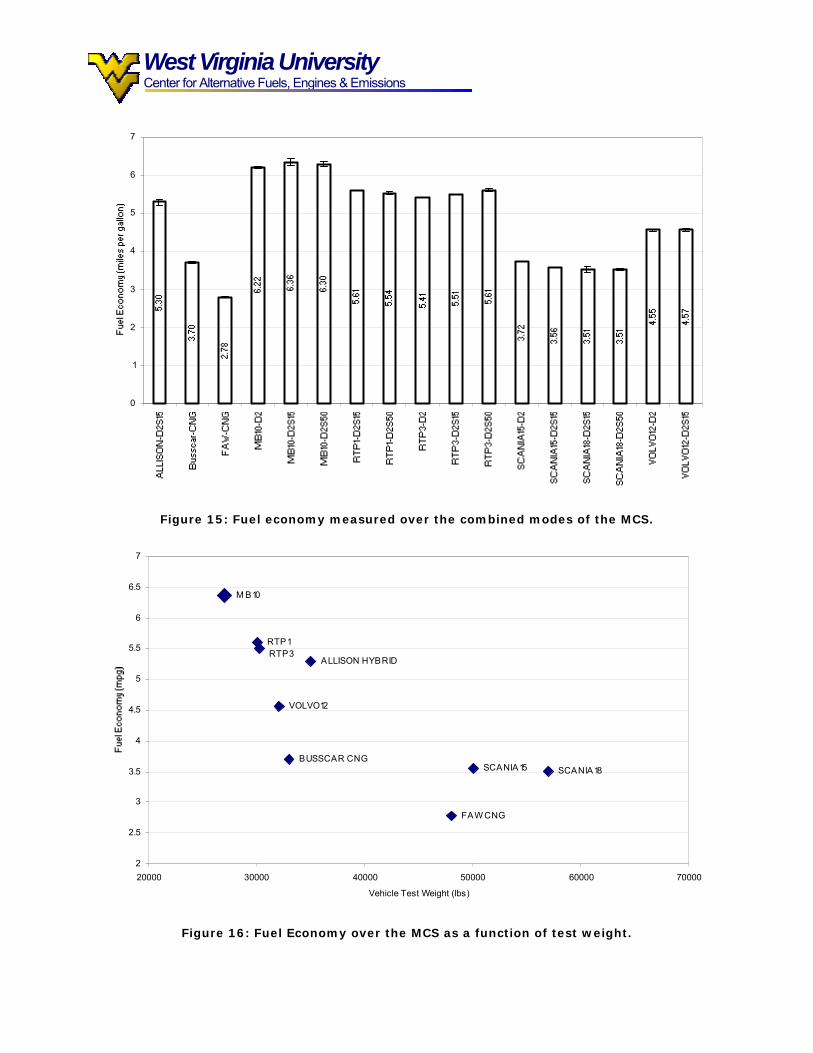
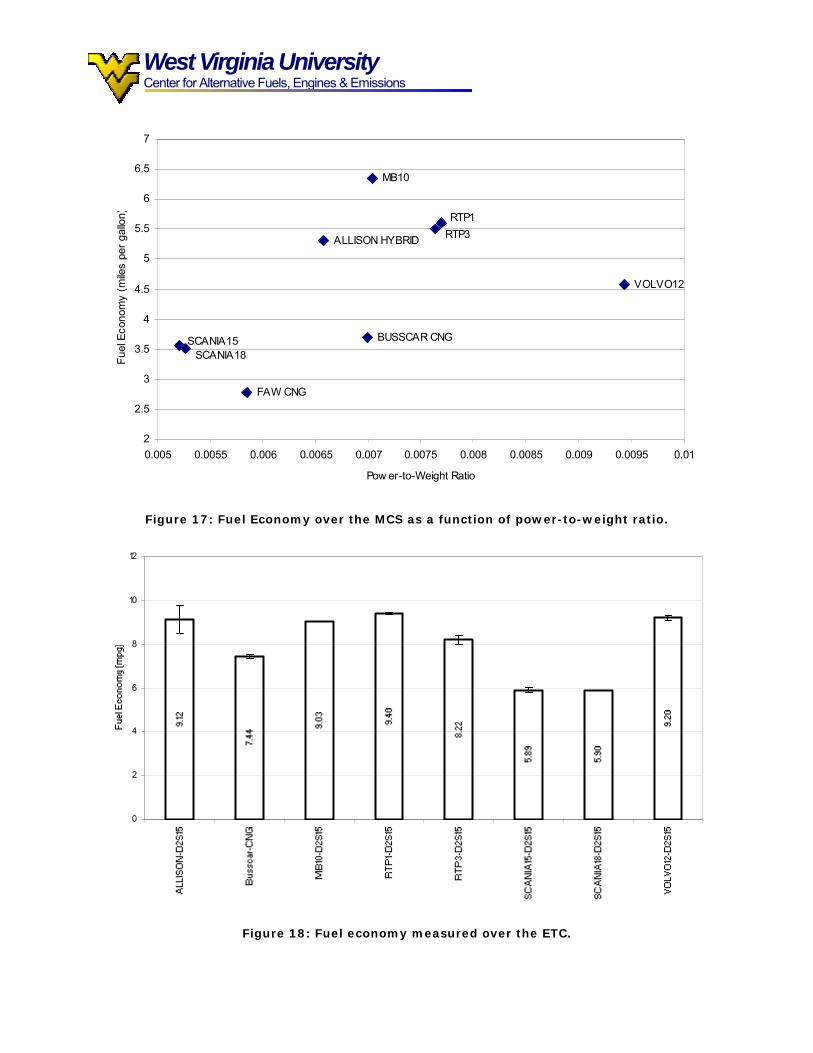
The fuel economy, calculated from a carbon balance as described above, is shown for all buses measured over the combined MSC Figure 15. Fuel economy of the natural gas buses is reported on a diesel energy equivalent basis to allow comparison with the diesel-fueled buses. When multiple repeat test runs were conducted, the bars in Figure 15 represent the average result, and the error bars show the maximum and minimum individual test results. Considering the conventional-drive diesel buses tested over the MCS, the MB10 bus achieved the highest fuel economy followed by RTP1 and RTP3, the VOLVO12 and finally the SCANIA15. The ALLISON diesel-hybrid bus demonstrated fuel economy comparable to RTP1 and RTP3. The BUSSCAR CNG bus was comparable to the SCANIA buses and the FAW CNG bus demonstrated the lowest fuel economy on a miles-per-equivalent-diesel-gallon basis. Figure 16 and Figure 17 show the fuel economy over the MCS as a function of vehicle test weight and vehicle power-to-test-weight ratio. Only the 15 ppm sulfur fuel results are shown. There is a strong relationship between test weight and fuel economy as would be expected. There is also an obvious relationship between power-to-weight ratio and fuel economy although the VOLVO12 bus which had the highest power-to-weight ration would have been expected to get higher fuel economy.
Fuel economy measured over the ETC is shown in Figure 18. Diesel-equivalent fuel economy is presented for the BUSSCAR CNG bus. The FAW bus was not tested over the ETC as it could not attain the high speed operation required by that test cycle. The ETC showed a somewhat different picture for fuel economy. As expected the economy was far higher over the ETC than for any of the MCS modes or the combined MCS (Figure 15) due to the much less transient nature of the ETC compared to the MCS. Over the ETC, the RTP1 bus had the highest fuel economy, followed by the VOLVO12 and ALLISON hybrid, which had similar fuel economy. The MB10 and RTP3 then followed. All of these buses had fuel economies that were close in value. Over the ETC, the BUSSCAR had higher fuel economy than either of the SCANIA buses.
West Virginia University Center for Alternative Fuels, Engines & Emissions
0
1
2
3
4
5
6
7
Figure 15: Fuel economy measured over the combined modes of the MCS.
FAW CNG
BUSSCAR CNG
M B10
RTP1RTP3
ALLISON HYBRID
VOLVO12
SCANIA15 SCANIA18
2
2.5
3
3.5
4
4.5
5
5.5
6
6.5
7
20000 30000 40000 50000 60000 70000
Vehicle Test Weight (lbs)
Figure 16: Fuel Economy over the MCS as a function of test weight.
West Virginia University Center for Alternative Fuels, Engines & Emissions
MB10
ALLISON HYBRID
VOLVO12
RTP1RTP3
SCANIA18SCANIA15 BUSSCAR CNG
FAW CNG
2
2.5
3
3.5
4
4.5
5
5.5
6
6.5
7
0.005 0.0055 0.006 0.0065 0.007 0.0075 0.008 0.0085 0.009 0.0095 0.01
Pow er-to-Weight Ratio
Fuel
Eco
nom
y (m
iles
per g
allo
n)
Figure 17: Fuel Economy over the MCS as a function of power-to-weight ratio.
0
2
4
6
8
10
12
Figure 18: Fuel economy measured over the ETC.

West Virginia University Center for Alternative Fuels, Engines & Emissions
The buses were tested at different weights (representative of real use) and had different passenger loadings associated with those weights. It is also useful to consider fuel economy in units of passenger-miles/gallon shown in Figure 19 for the MCS and Figure 20 for the ETC. On a passenger-miles per gallon basis the ALLISON hybrid bus has the highest fuel economy followed by the SCANIA. Even though the SCANIA buses had comparatively poor fuel economy compared to other buses they may prove to be more economical to operate when passenger capacity is considered. The MB10 bus also exhibited good fuel economy on a passenger-miles per gallon basis. Considering the diesel-fueled buses, the VOLVO12 bus had the lowest fuel economy when passenger capacity is considered and were comparable to the CNG buses. Over the ETC, the ALLISON hybrid bus also exhibited the highest per passenger fuel economy followed by the SCANIA18 bus. The MB10, RTP1, RTP3 and VOLVO12 buses demonstrated average per passenger fuel economy over the ETC and the BUSSCAR CNG bus exhibited the lowest per passenger fuel economy.
0
50
100
150
200
250
300
350
400
450
Figure 19: Fuel economy measured over the MCS on a passenger-mile per gallon basis.

West Virginia University Center for Alternative Fuels, Engines & Emissions
0
100
200
300
400
500
600
700
800
900
Figure 20: Fuel economy measured over the ETC on a passenger-mile per gallon basis
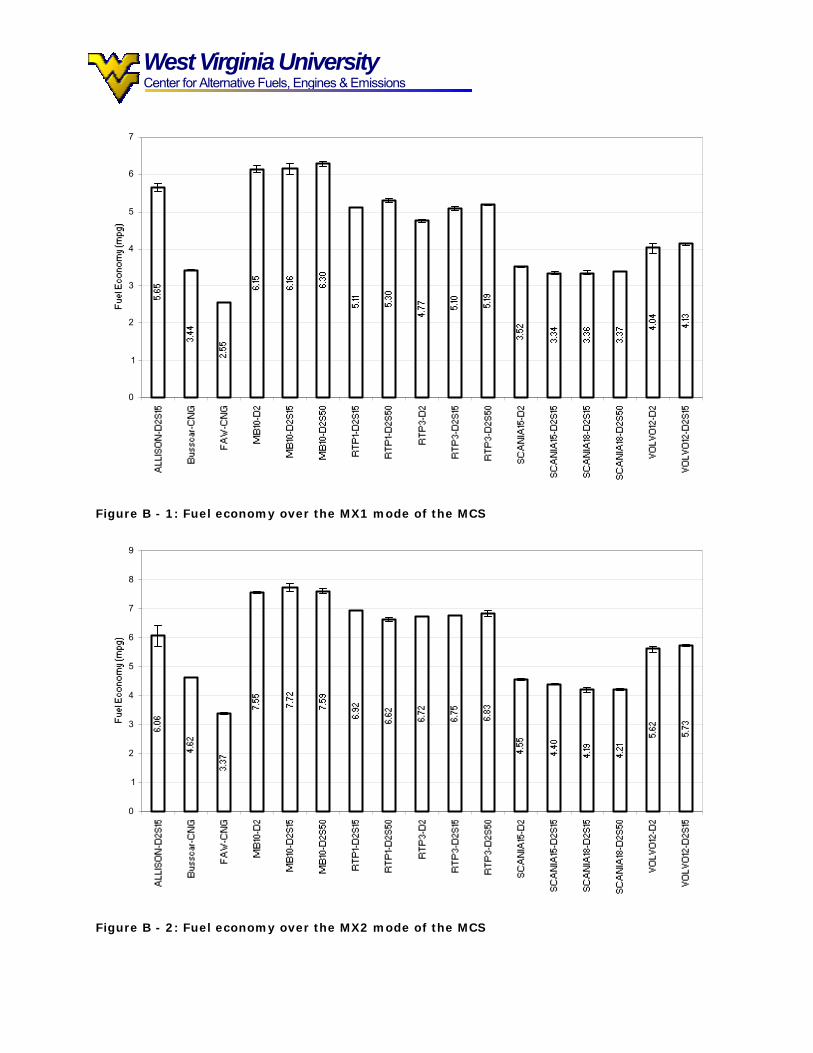
Fuel economy results measured over the individual MX1, MX2 and MX3 mode are provided in Appendix B. Over the MX1, poor diesel energy-equivalent fuel economy (in distance specific units) was observed from the two natural gas buses. The FAW bus had the lower economy of the two CNG buses and also had the lowest economy of all buses tested. Although CO and HC emissions levels were high for these buses (as shown in the emissions section below), they were not sufficiently high to explain the low fuel economy. The highest fuel economy was returned by the MB10 bus, and there was very little difference in fuel economy between the 15 ppm (sulfur level) fuel, the 150 ppm fuel and the D2 fuel. The ALLISON hybrid bus yielded the best fuel economy after the MB10 bus. The RTP1 and RTP3 buses showed the next best fuel economy and the values for these two buses were similar. Bus RTP3 showed slightly poorer economy on D2 than the two lower sulfur fuels. The VOLVO12 was next best with little influence of fuel type on the economy. The SCANIA15 and SCANIA18 buses had similar fuel economy. Their economy was the lowest of the diesel buses, and was similar (on an energy-equivalent basis) to the BUSSCAR CNG fuel economy. However, the SCANIA buses were both heavy buses, with extended length.
Fuel economy results for the MX2 were similar to those for the MX1, except that the ALLISON bus now had a lower fuel economy than the RTP1 and RTP3 buses. Fuel economy was higher on the MX2 mode than the MX1 mode, which would be expected for the higher speed cycle. The MB10 bus also showed less of an advantage over RTP1 and RTP3 buses that were 2 years older, compared to their fuel economy over the MX1 mode.
The MX3 was the highest speed mode in the MCS. The MX3 showed lower overall fuel economy than both the MX1 and MX2 due to the highly transient nature of the MX3. The MB10 and the older RTP buses now had similar fuel economy and were highest. The ALLISON hybrid was next, followed by the VOLVO12. The two SCANIA buses were similar in fuel economy and were lowest of the diesel buses. The BUSSCAR CNG bus had fuel

West Virginia University Center for Alternative Fuels, Engines & Emissions
economy similar to the SCANIA diesel buses, while the FAW CNG bus had the lowest fuel economy of all. The FAW bus exhibited problems during testing, including engine overheating and inability to adequately follow the driver�s trace.
Figure 21 shows a different picture of fuel economy when the units of ton-miles per gallon are used for comparison (where a ton is a short ton of 2,000lb). Only ETC data are shown in this figure. Highest fuel economy is offered in these units by the SCANIA18 and the ALLISON hybrid buses. There is far lower fuel economy difference between the buses than when units of mile/gallon are used.
0
2
4
6
8
10
12
Figure 21: Fuel economy over the ETC on a ton-miles per gallon basis.

West Virginia University Center for Alternative Fuels, Engines & Emissions
NOX Emissions Emissions of NOX are important for both natural gas and diesel fueled buses, because the overall lean burn conditions favor NOX formation. For at least one run for each vehicle/fuel combination, the primary NOX analyzer was in �NOX mode� (where both NO and NO2 are measured) while the secondary NOX analyzer was in �NO only mode.�
Diesel buses without PM filtration aftertreatment tend to produce far less NO2 than NO, 3% to 15% as NO2 depending on engine design and operating conditions and typically 2% to 5% averaged over a transient test cycle. This is evident for most of the diesel buses, including the SCANIA15 bus which was equipped with an oxidation catalyst. The older bus, RTP-1, and the ALLISON hybrid bus, both equipped with catalyzed diesel particulate filters, showed substantial NO2 content. Passive diesel particulate filters capture and oxidize particulate matter in the exhaust stream. Under idle or low power operation, particulate matter is collected on the wall flow filter and is subsequently burned �oxidized� when the exhaust gas temperatures exceed 250-300°C. Passive particulate filters commonly employ a precious metal catalyst upstream of the filter or a catalyst coating on the filter itself to lower the temperature necessary to oxidize the collected particulate matter. The coating promotes the oxidation of NO in the exhaust stream to produce NO2. The NO2 promotes combustion of the collected particulate matter at a significantly lower temperature (>250°C) than in air (>500°C) this allowing for continuous regeneration of the filter system under typical diesel engine exhaust temperatures. NOX emissions from vehicles equipped with catalyzed particulate filters and other aftertreatment devices may consist of 30% to 40% NO2.
Figure 22 shows the distance specific NOX emissions measured over the combined modes of the MCS along with the averaged NO emissions from runs when the second NOX analyzer was in NO mode. Plots of NOX emissions measured over the individual MX1, MX2 and MX3 modes are provided in Appendix B. The FAW CNG bus exhibited the highest average NOX emissions over the MCS at over 30 g/mile. The MB10 bus produced the lowest NOX emissions, at around 11 g/mile, with the ALLISON bus only slightly higher. NOX emissions measured over the ETC are shown in Figure 23. The SCANIA buses were the highest emitters of NOX while the ALLISON and the MB10 buses demonstrated the lowest NOX emissions The ALLISON and RTP1 buses emitted over 50% of the NOX as NO2 due to the presence of catalyzed particulate filters. The BUSSCAR natural gas bus emitted about one fourth of the NOX emissions as NO2, and the levels of NO2 were a small fraction of the total NOX for the remaining buses. The FAW bus was unable to complete an emissions test on the ETC.
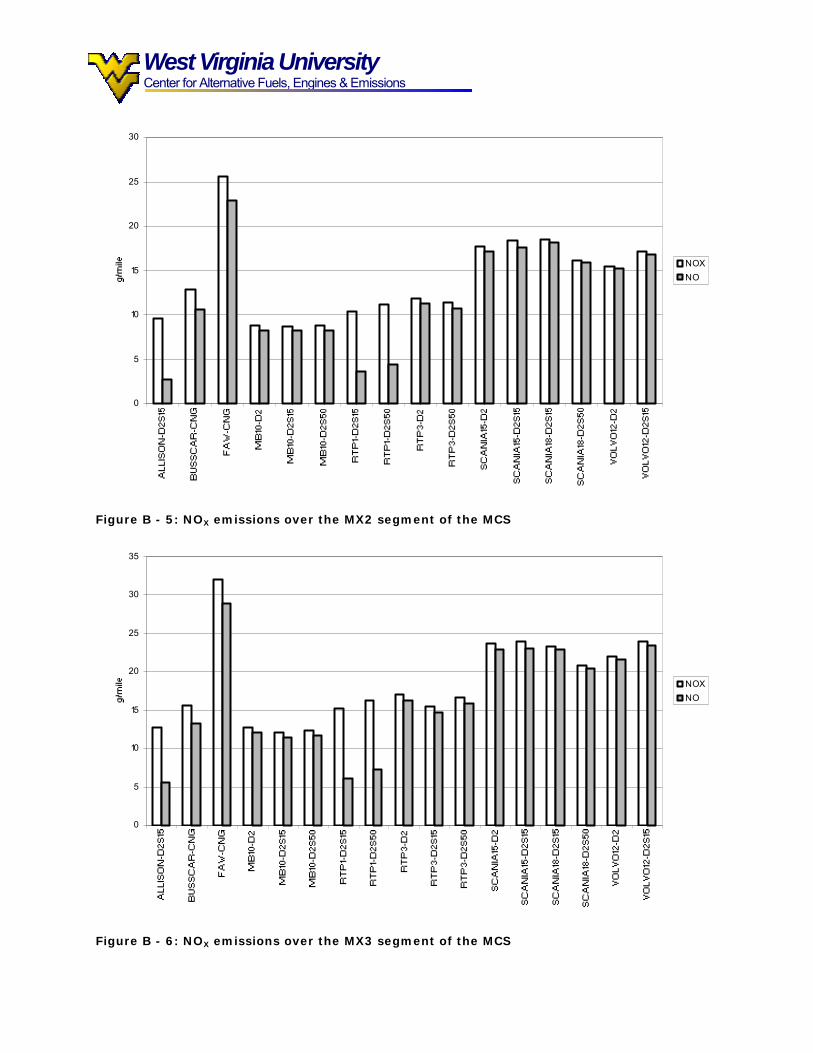
Plots of NOX emissions measured over the individual MX1, MX2 and MX3 modes are provided in Appendix B. The FAW CNG bus exhibited the highest distance specific NOX emissions over the MX1 mode at over 35 g/mile. The SCANIA and VOLVO buses fell between 20 and 30 g/mile. The BUSSCAR produced slightly less than 20 g/mile and the ALLISON and MB10 buses produced the lowest NOX emissions at approximately 10 g/mile. Over the MX2, the FAW CNG bus was again the highest distance-specific emitter.

West Virginia University Center for Alternative Fuels, Engines & Emissions
0
5
10
15
20
25
30
35
NOXNO
Figure 22: Distance-specific NOX emissions over the combined modes of the MCS
0
2
4
6
8
10
12
14NOX
NO
Figure 23: Distance-specific NOX emissions over the ETC

West Virginia University Center for Alternative Fuels, Engines & Emissions
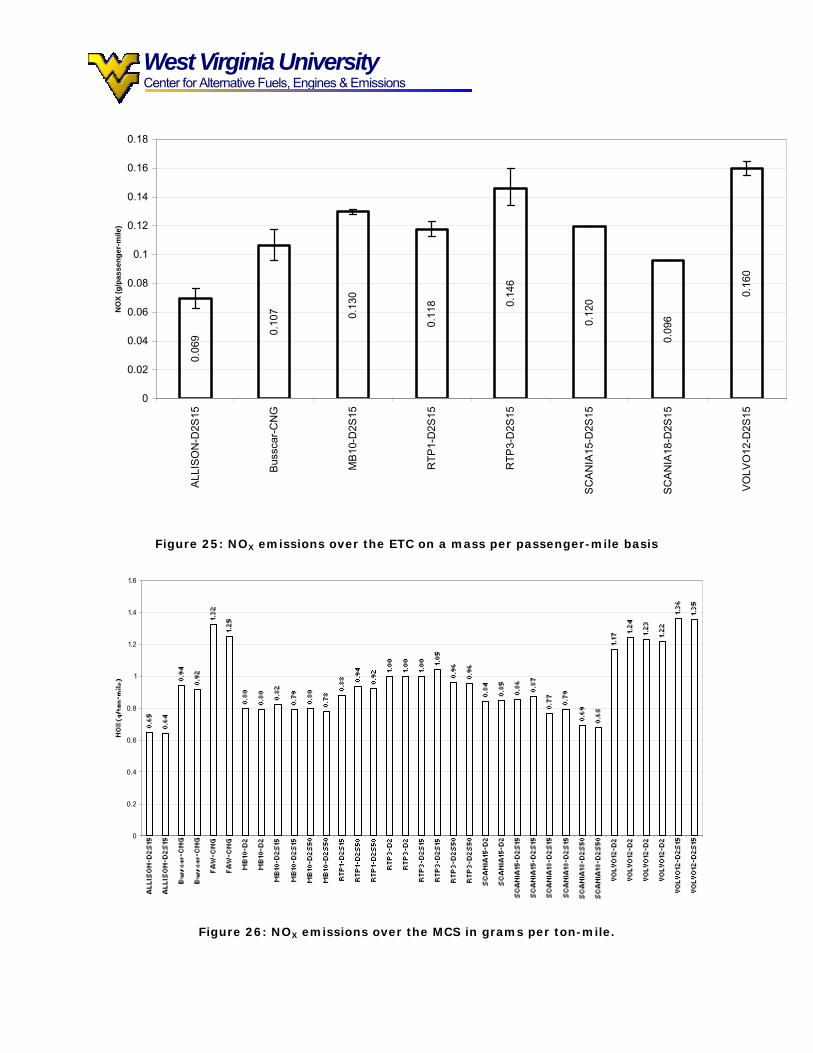
Figure 24 and Figure 25 show NOX emissions on a g/passenger-mile basis for the MSC and ETC respectively. Over the MCS, the ALLISON, MB10 and SCANIA18 exhibit the lowest NOX emissions. The VOLVO12 diesel bus and the FAW CNG bus exhibit the highest NOX emissions. NOX emissions from the RTP1, RPT3, SCANIA15 buses and the BUSSCAR CNG bus were similar to one another and composed the middle range of the group. Over the ETC, the ALLISON and SCANIA18 buses exhibited low NOX emissions while the VOLVO12 once again exhibited the highest emissions. The FAW bus was not tested over the ETC.
Figure 26 and Figure 27 show NOX data expressed in alternate units of grams/ton-mile over the MCS and ETC. Distance-specific units favor lighter buses, the weight-specific data favors heavier buses. This is because a percentage increase in bus weight does not typically produce the same percentage increase in NOX, but rather a lower percentage increase. The large SCANIA buses produced lower weight-specific emissions, although the lowest distance-specific emissions came from the ALLISON bus. The MB10, VOLVO and RTP3 buses produced similar NOX emissions in units of g/ton-mile
0
0.05
0.1
0.15
0.2
0.25
0.3
0.35
0.4
Figure 24: NOX emissions over the MCS on a mass per passenger-mile basis
West Virginia University Center for Alternative Fuels, Engines & Emissions
0.06
9 0.10
7 0.13
0
0.11
8 0.14
6
0.12
0
0.09
6
0.16
0
0
0.02
0.04
0.06
0.08
0.1
0.12
0.14
0.16
0.18
ALLI
SON
-D2S
15
Buss
car-C
NG
MB1
0-D
2S15
RTP
1-D
2S15
RTP
3-D
2S15
SCAN
IA15
-D2S
15
SCAN
IA18
-D2S
15
VOLV
O12
-D2S
15
NO
X (g
/pas
seng
er-m
ile)
Figure 25: NOX emissions over the ETC on a mass per passenger-mile basis
0
0.2
0.4
0.6
0.8
1
1.2
1.4
1.6
Figure 26: NOX emissions over the MCS in grams per ton-mile.

West Virginia University Center for Alternative Fuels, Engines & Emissions
0
0.1
0.2
0.3
0.4
0.5
0.6
0.7
Figure 27: NOX emissions over the ETC in grams per ton-mile.
.
Particulate Emissions Particulate emissions are also of great concern, especially in some geographic regions. Variability in PM measurement is higher than for NOX measurement because filter weights can be difficult to quantify if the mass of PM on the filter is low and if background PM levels vary. Furthermore, for diesel-fueled vehicles, the PM emissions may be highly sensitive to driving style, which may vary slightly from run to run.
West Virginia University Center for Alternative Fuels, Engines & Emissions
0
0.5
1
1.5
2
2.5
3
Figure 28: Particulate Emissions measured over the combined modes of the MCS
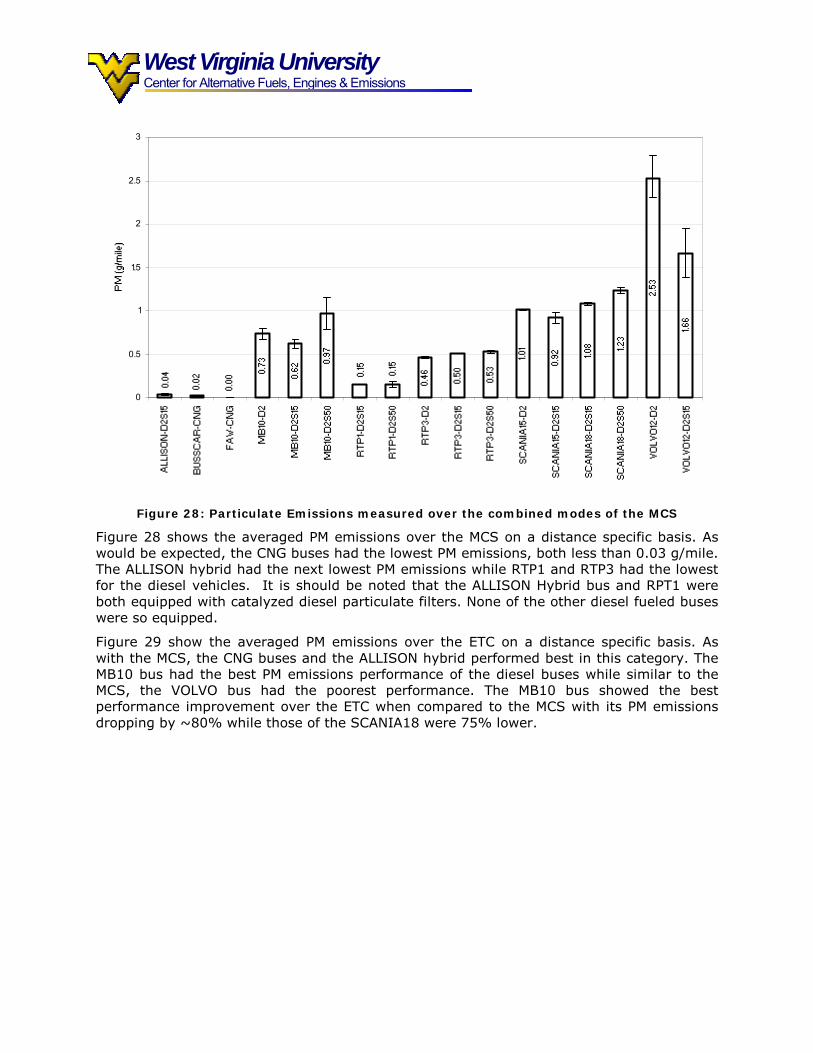
Figure 28 shows the averaged PM emissions over the MCS on a distance specific basis. As would be expected, the CNG buses had the lowest PM emissions, both less than 0.03 g/mile. The ALLISON hybrid had the next lowest PM emissions while RTP1 and RTP3 had the lowest for the diesel vehicles. It is should be noted that the ALLISON Hybrid bus and RPT1 were both equipped with catalyzed diesel particulate filters. None of the other diesel fueled buses were so equipped.
Figure 29 show the averaged PM emissions over the ETC on a distance specific basis. As with the MCS, the CNG buses and the ALLISON hybrid performed best in this category. The MB10 bus had the best PM emissions performance of the diesel buses while similar to the MCS, the VOLVO bus had the poorest performance. The MB10 bus showed the best performance improvement over the ETC when compared to the MCS with its PM emissions dropping by ~80% while those of the SCANIA18 were 75% lower.

West Virginia University Center for Alternative Fuels, Engines & Emissions
0
0.1
0.2
0.3
0.4
0.5
0.6
0.7
0.8
0.9
1
Figure 29: Particulate emissions measured over the ETC
Figure 28 shows no clear trend on the effect of reduced sulfur fuel on PM emissions. This conclusion is consistent with the fact that only a few percent of sulfur in the fuel is converted to sulfate (which is counted as PM mass). Sulfate contribution may become significant for very high sulfur fuels, but the sulfur levels for all three fuels used in this study were low by historical standards. Low sulfur diesel does not reduce PM emissions substantially. It reduces the sulfuric acid / sulfate mass in the PM, but that is a small fraction of overall PM mass. Its benefit is to allow the use of catalyzed PM filters on the exhaust. This is important, because these catalyzed filters will generally not function well without the low sulfur diesel.
Particulate results are plotted for the MX1, MX2 and MX3 modes of the MCS in Appendix B. Conclusions on PM production are substantially similar for the MX2 mode and the MX3 mode. Interestingly, the RTP1 bus produced substantially higher distance specific PM emissions on the MX3 mode than on the MX1 and MX2 modes, although these emissions were still below the level of all the buses except the ALLISON hybrid and the natural gas fueled buses. Interestingly the RTP 1 bus produced substantially higher PM emissions on the MX3 mode than on MX1 and MX2 modes (RPT 1 bus with CRT showed changes in emission of approximately 90% from the RPT3 bus without CRT for the MX1 and MX2 cycles, these change decreases by approximately ½ for the MX3 and ETC cycles.
Figure 30 and Figure 31 show PM emissions on a per passenger-mile basis. As with performance on a distance-specific basis, the CNG and ALLISON hybrid buses had the best performance while the VOLVO again performed the worst of all the buses. The SCANIA buses, when examined on a per passenger-mile basis, compare more favorably to the other diesel buses than on a distance-specific emissions due to their larger passenger capacity.

West Virginia University Center for Alternative Fuels, Engines & Emissions
0
0.005
0.01
0.015
0.02
0.025
0.03
0.035
0.04
0.045
0.05
Figure 30: PM emissions over the MCS on a mass per passenger-mile basis
0
0.002
0.004
0.006
0.008
0.01
0.012
0.014
0.016
Figure 31: PM emissions over the ETC on a mass per passenger-mile basis
West Virginia University Center for Alternative Fuels, Engines & Emissions
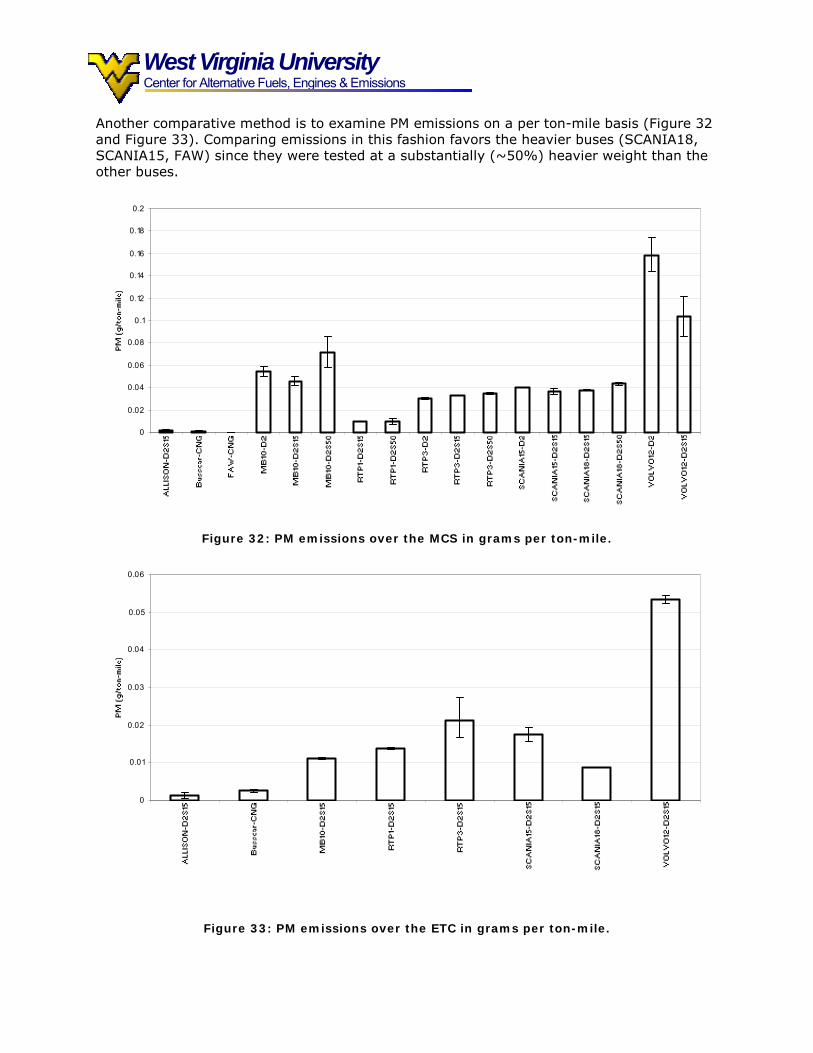
Another comparative method is to examine PM emissions on a per ton-mile basis (Figure 32 and Figure 33). Comparing emissions in this fashion favors the heavier buses (SCANIA18, SCANIA15, FAW) since they were tested at a substantially (~50%) heavier weight than the other buses.
0
0.02
0.04
0.06
0.08
0.1
0.12
0.14
0.16
0.18
0.2
Figure 32: PM emissions over the MCS in grams per ton-mile.
0
0.01
0.02
0.03
0.04
0.05
0.06
Figure 33: PM emissions over the ETC in grams per ton-mile.
West Virginia University Center for Alternative Fuels, Engines & Emissions
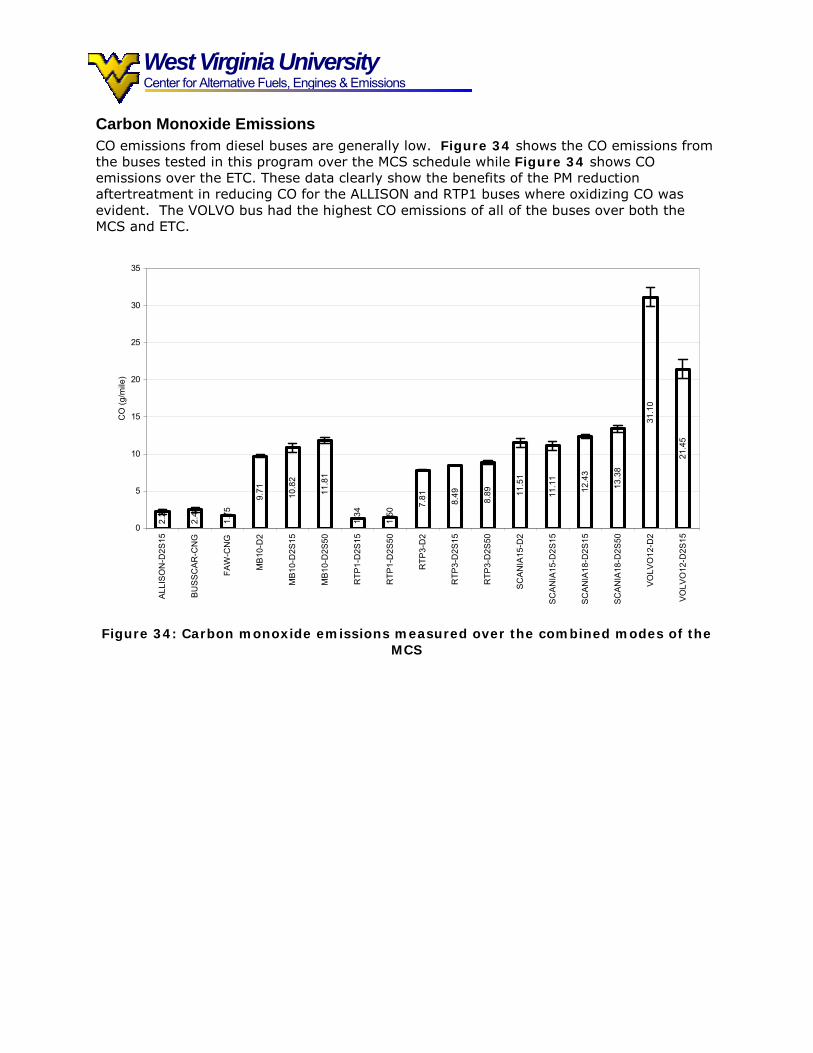
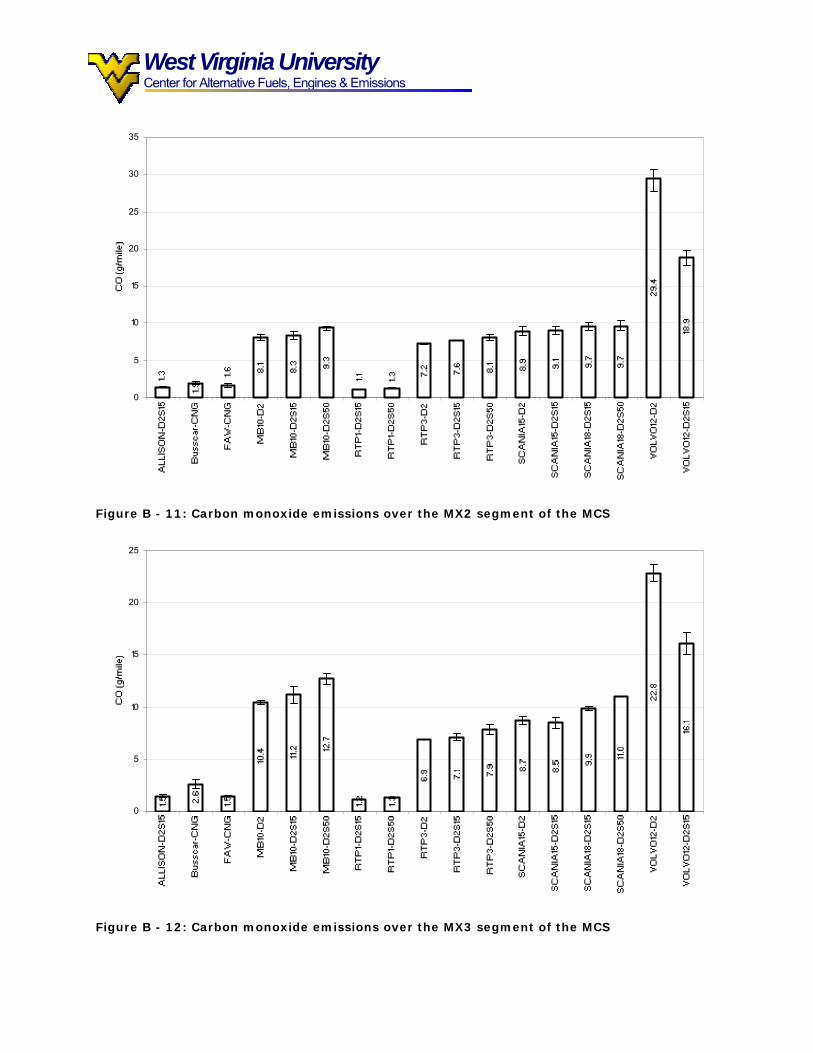
Carbon Monoxide Emissions CO emissions from diesel buses are generally low. Figure 34 shows the CO emissions from the buses tested in this program over the MCS schedule while Figure 34 shows CO emissions over the ETC. These data clearly show the benefits of the PM reduction aftertreatment in reducing CO for the ALLISON and RTP1 buses where oxidizing CO was evident. The VOLVO bus had the highest CO emissions of all of the buses over both the MCS and ETC.
2.21
2.48
1.75
9.71 10.8
2
11.8
1
1.34
1.50
7.81 8.49 8.89 11
.51
11.1
1
12.4
3
13.3
8
31.1
0
21.4
5
0
5
10
15
20
25
30
35
ALLI
SON
-D2S
15
BUSS
CAR
-CN
G
FAW
-CN
G
MB1
0-D
2
MB1
0-D
2S15
MB1
0-D
2S50
RTP
1-D
2S15
RTP
1-D
2S50
RTP
3-D
2
RTP
3-D
2S15
RTP
3-D
2S50
SCAN
IA15
-D2
SCAN
IA15
-D2S
15
SCAN
IA18
-D2S
15
SCAN
IA18
-D2S
50
VOLV
O12
-D2
VOLV
O12
-D2S
15
CO
(g/m
ile)
Figure 34: Carbon monoxide emissions measured over the combined modes of the MCS
West Virginia University Center for Alternative Fuels, Engines & Emissions
2.18 2.
70
2.63
2.13
8.24
0.470.
62
0.66
0
2
4
6
8
10
12
ALLI
SON
-D2S
15
BUSS
CAR
-CN
G
MB1
0-D
2S15
RTP
1-D
2S15
RTP
3-D
2S15
SCAN
IA15
-D2S
15
SCAN
IA18
-D2S
15
VOLV
O12
-D2S
15
CO
(g/m
ile)
Figure 35: Carbon monoxide emissions over the ETC
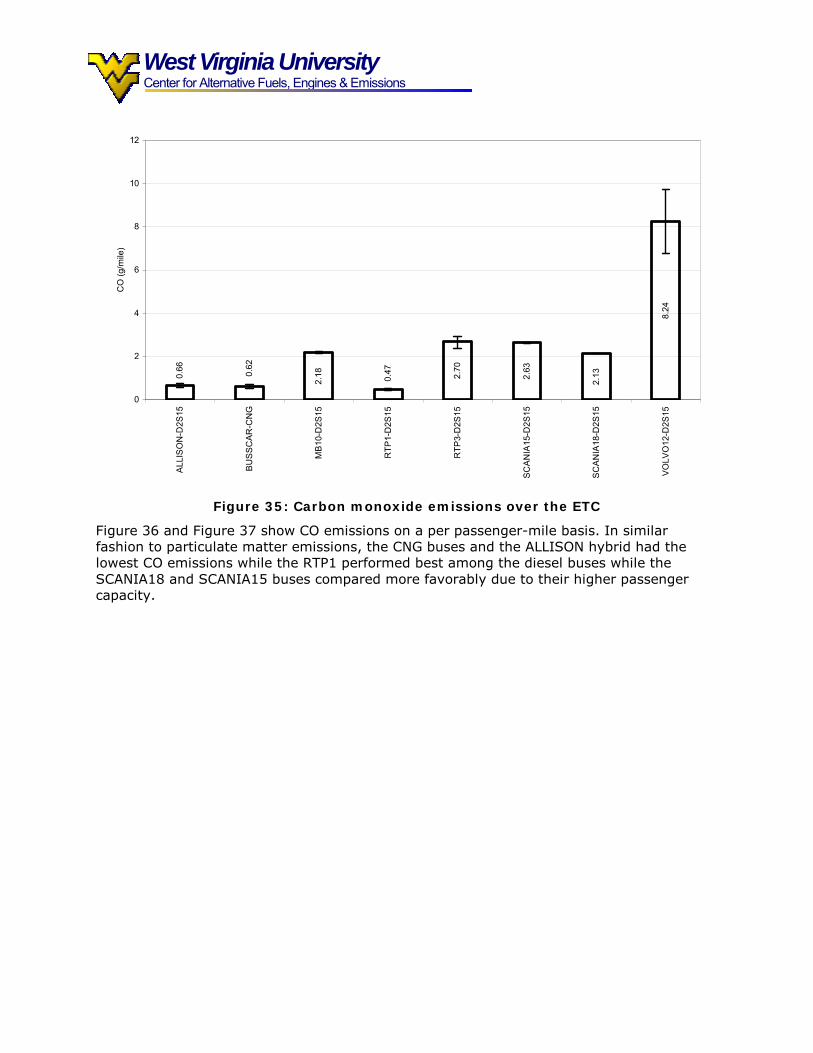
Figure 36 and Figure 37 show CO emissions on a per passenger-mile basis. In similar fashion to particulate matter emissions, the CNG buses and the ALLISON hybrid had the lowest CO emissions while the RTP1 performed best among the diesel buses while the SCANIA18 and SCANIA15 buses compared more favorably due to their higher passenger capacity.

West Virginia University Center for Alternative Fuels, Engines & Emissions
0
0.1
0.2
0.3
0.4
0.5
0.6
Figure 36: Carbon monoxide emissions over the MCS on a mass per passenger-mile basis
0
0.02
0.04
0.06
0.08
0.1
0.12
0.14
0.16
Figure 37: Carbon monoxide emissions over the ETC on a mass per passenger-mile basis
West Virginia University Center for Alternative Fuels, Engines & Emissions
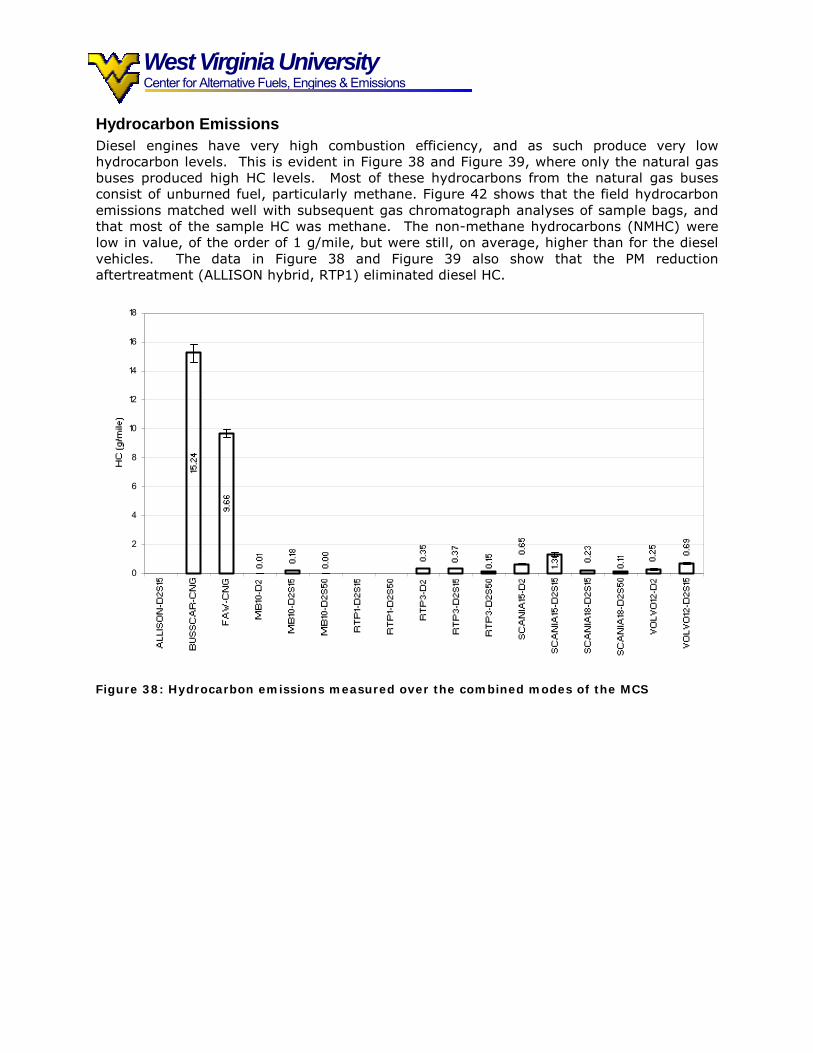
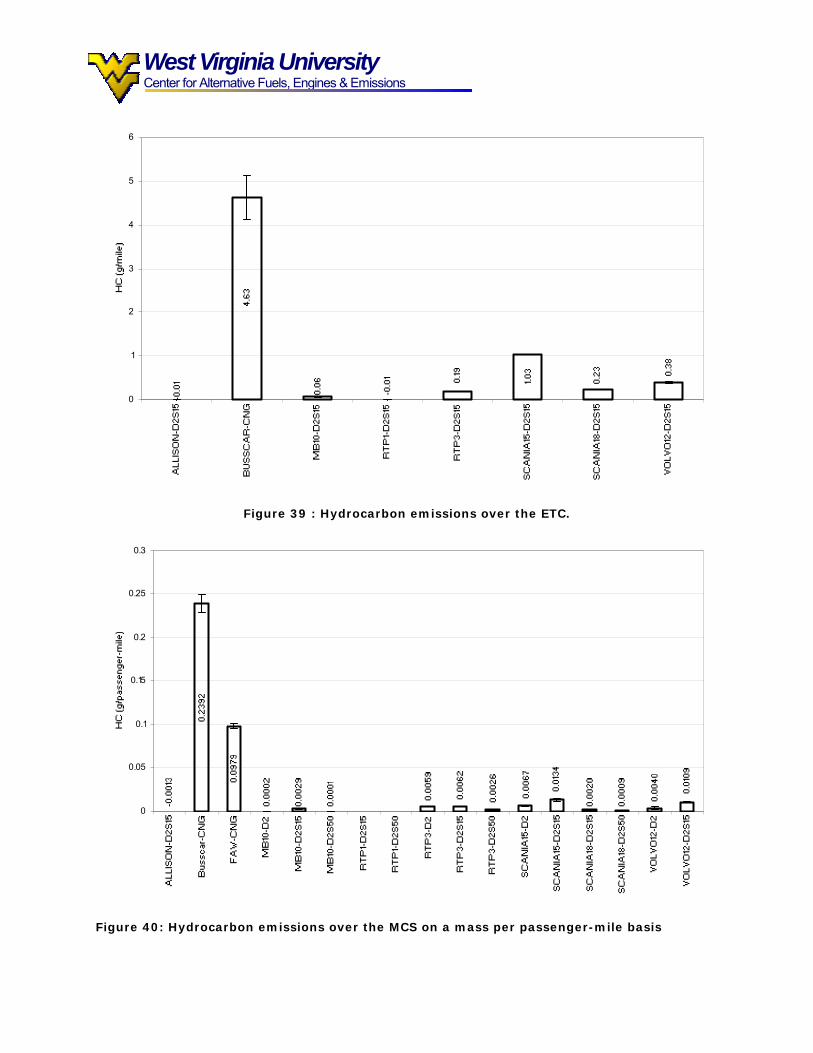
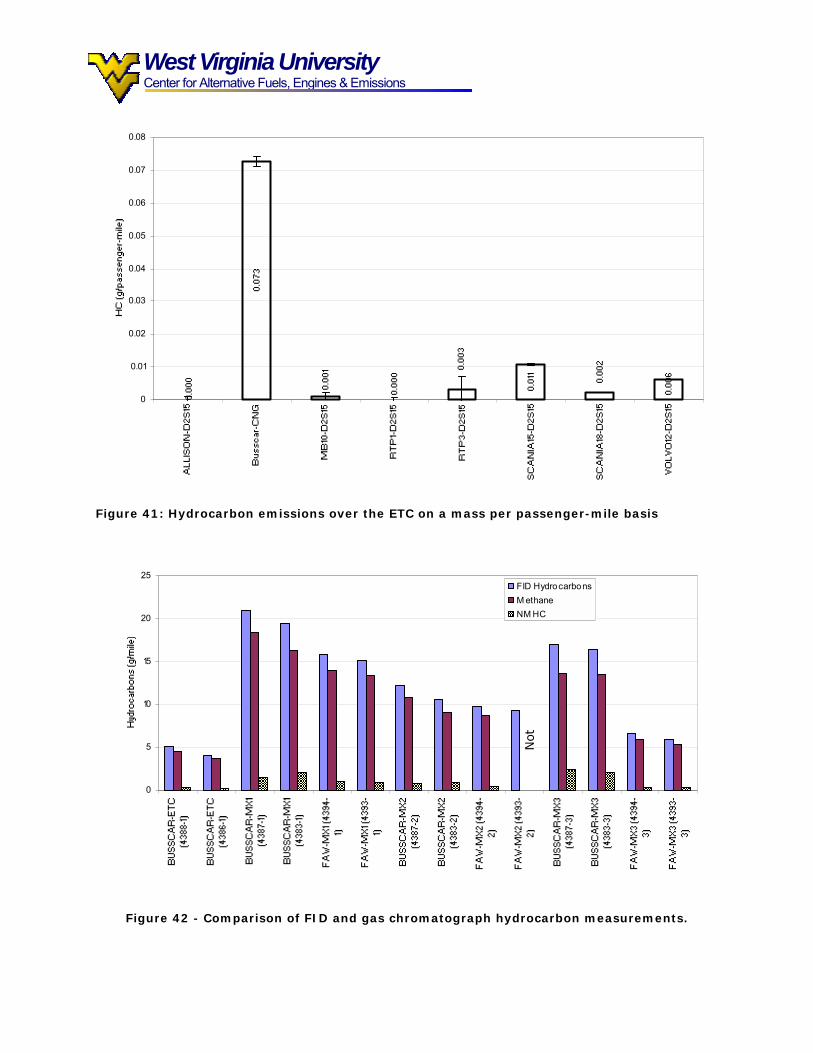
Hydrocarbon Emissions Diesel engines have very high combustion efficiency, and as such produce very low hydrocarbon levels. This is evident in Figure 38 and Figure 39, where only the natural gas buses produced high HC levels. Most of these hydrocarbons from the natural gas buses consist of unburned fuel, particularly methane. Figure 42 shows that the field hydrocarbon emissions matched well with subsequent gas chromatograph analyses of sample bags, and that most of the sample HC was methane. The non-methane hydrocarbons (NMHC) were low in value, of the order of 1 g/mile, but were still, on average, higher than for the diesel vehicles. The data in Figure 38 and Figure 39 also show that the PM reduction aftertreatment (ALLISON hybrid, RTP1) eliminated diesel HC.
0
2
4
6
8
10
12
14
16
18
Figure 38: Hydrocarbon emissions measured over the combined modes of the MCS
West Virginia University Center for Alternative Fuels, Engines & Emissions
0
1
2
3
4
5
6
Figure 39 : Hydrocarbon emissions over the ETC.
0
0.05
0.1
0.15
0.2
0.25
0.3
Figure 40: Hydrocarbon emissions over the MCS on a mass per passenger-mile basis
West Virginia University Center for Alternative Fuels, Engines & Emissions
0
0.01
0.02
0.03
0.04
0.05
0.06
0.07
0.08
Figure 41: Hydrocarbon emissions over the ETC on a mass per passenger-mile basis
0
5
10
15
20
25FID HydrocarbonsM ethaneNM HC
Not
Figure 42 - Comparison of FID and gas chromatograph hydrocarbon measurements.

West Virginia University Center for Alternative Fuels, Engines & Emissions
Nitrous Oxide (N2O) emissions
0
0.2
0.4
0.6
0.8
1
1.2
1.4
1.6
1.8
Figure 43: N2O emissions over both the ETC and MCS
Figure 43 presents the emissions of nitrous oxide (N2O) from the tested fleet. Data were available for limited number of runs because the INNOVA analyzer, which is not normally used during WVU emissions measurements, malfunctioned. From the available data, the SCANIA15 bus produced the highest emissions while the average N2O emissions from all of the vehicles were more than an order of magnitude lower than the total NOX emissions.
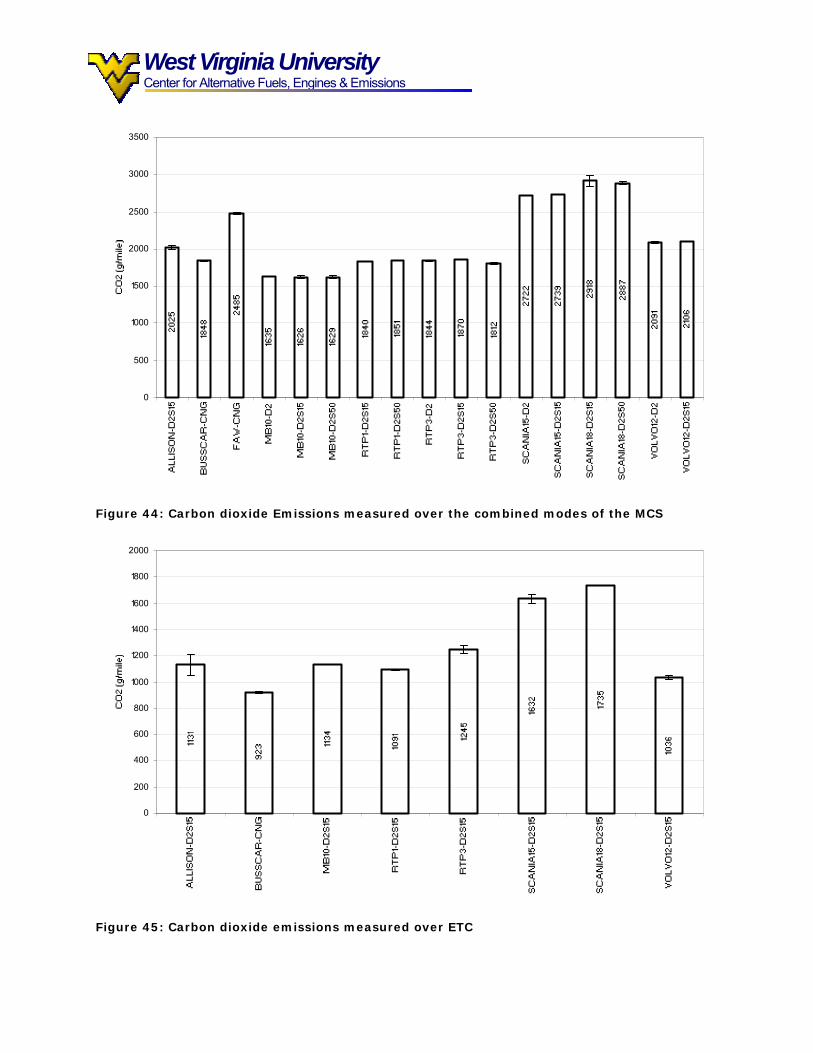
Carbon Dioxide Emissions Emissions of CO2, a non-regulated species, are presented in Figure 44 through Figure 47, and closely reflect the fuel economy data presented above.
West Virginia University Center for Alternative Fuels, Engines & Emissions
0
500
1000
1500
2000
2500
3000
3500
Figure 44: Carbon dioxide Emissions measured over the combined modes of the MCS
0
200
400
600
800
1000
1200
1400
1600
1800
2000
Figure 45: Carbon dioxide emissions measured over ETC

West Virginia University Center for Alternative Fuels, Engines & Emissions
0
5
10
15
20
25
30
35
Figure 46: Carbon dioxide emissions over the MCS on a mass per passenger-mile basis
14.3
14.5
18.6
18.3 20
.9
16.8
15.4 16.3
0
5
10
15
20
25
ALLI
SON
-D2S
15
Buss
car-C
NG
MB1
0-D
2S15
RTP
1-D
2S15
RTP
3-D
2S15
SCAN
IA15
-D2S
15
SCAN
IA18
-D2S
15
VOLV
O12
-D2S
15
CO
2 (g
/pas
seng
er-m
ile)
Figure 47: Carbon dioxide emissions over the ETC on a mass per passenger-mile basis
West Virginia University Center for Alternative Fuels, Engines & Emissions
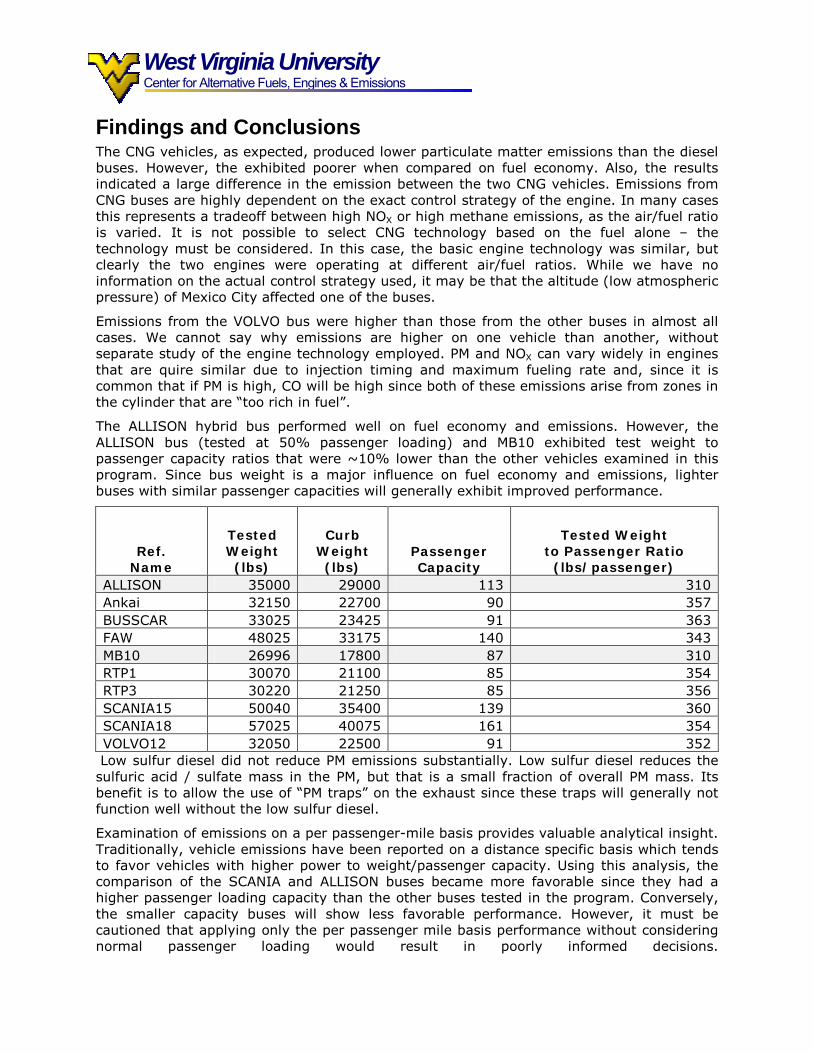
Findings and Conclusions The CNG vehicles, as expected, produced lower particulate matter emissions than the diesel buses. However, the exhibited poorer when compared on fuel economy. Also, the results indicated a large difference in the emission between the two CNG vehicles. Emissions from CNG buses are highly dependent on the exact control strategy of the engine. In many cases this represents a tradeoff between high NOX or high methane emissions, as the air/fuel ratio is varied. It is not possible to select CNG technology based on the fuel alone � the technology must be considered. In this case, the basic engine technology was similar, but clearly the two engines were operating at different air/fuel ratios. While we have no information on the actual control strategy used, it may be that the altitude (low atmospheric pressure) of Mexico City affected one of the buses.
Emissions from the VOLVO bus were higher than those from the other buses in almost all cases. We cannot say why emissions are higher on one vehicle than another, without separate study of the engine technology employed. PM and NOX can vary widely in engines that are quire similar due to injection timing and maximum fueling rate and, since it is common that if PM is high, CO will be high since both of these emissions arise from zones in the cylinder that are �too rich in fuel�.
The ALLISON hybrid bus performed well on fuel economy and emissions. However, the ALLISON bus (tested at 50% passenger loading) and MB10 exhibited test weight to passenger capacity ratios that were ~10% lower than the other vehicles examined in this program. Since bus weight is a major influence on fuel economy and emissions, lighter buses with similar passenger capacities will generally exhibit improved performance.
Ref. Name
Tested Weight (lbs)
Curb Weight (lbs)
Passenger Capacity
Tested Weight to Passenger Ratio
(lbs/passenger) ALLISON 35000 29000 113 310Ankai 32150 22700 90 357BUSSCAR 33025 23425 91 363FAW 48025 33175 140 343MB10 26996 17800 87 310RTP1 30070 21100 85 354RTP3 30220 21250 85 356SCANIA15 50040 35400 139 360SCANIA18 57025 40075 161 354VOLVO12 32050 22500 91 352
Low sulfur diesel did not reduce PM emissions substantially. Low sulfur diesel reduces the sulfuric acid / sulfate mass in the PM, but that is a small fraction of overall PM mass. Its benefit is to allow the use of �PM traps� on the exhaust since these traps will generally not function well without the low sulfur diesel.
Examination of emissions on a per passenger-mile basis provides valuable analytical insight. Traditionally, vehicle emissions have been reported on a distance specific basis which tends to favor vehicles with higher power to weight/passenger capacity. Using this analysis, the comparison of the SCANIA and ALLISON buses became more favorable since they had a higher passenger loading capacity than the other buses tested in the program. Conversely, the smaller capacity buses will show less favorable performance. However, it must be cautioned that applying only the per passenger mile basis performance without considering normal passenger loading would result in poorly informed decisions.
West Virginia University Center for Alternative Fuels, Engines & Emissions
References
1. Clark, N., Gautam, M., Bata, R. and Lyons, D., �Design and Operation of a New Transportable Laboratory for Emissions Testing of Heavy-Duty Trucks and Buses,� Int. Journal of Vehicle Design: Heavy Vehicle Systems, Vol. 2 Nos. 3/4., pp285-299, 1995.
2. Wang, W., Bata, R., Lyons, D., Clark, N., Palmer, M., Gautam, M., Howell, A., Rapp, B., �Transient Response in a Dynamometer Power Absorption System,� SAE Paper 920252, 1992.
3. Gautam, M., Clark, N., Lyons, D., Long, T. Jr., Howell, A., Loth, J., Palmer, G.M., Wang, W., G., and Bata, R., �Design Overview of a Heavy Duty Mobile Vehicle Emissions Testing Laboratory�, ASME DE � Vol. 40, Advanced Automotive Technologies, pp. 199-207, ASME Winter Annual Meeting, Atlanta, GA, Dec. 1-6, 1991.
4. US Code of Federal Regulations, Volume 40, Part 86, Subpart N.
5. SAE J2711
6. Proposed Diesel Vehicle Emissions �In-Service Emissions Performance - Phase 2: Vehicle Testing - Appendices,� NEPC, November 2000
7. Gilbert, M.,S. and Clark, N., N., �Measurement of Particulate Matter from Diesel Engine Exhaust Using a Tapered Element Oscillating Microbalance,� Int J Engine Research, 2001, Vol.2, No. 4, 277-287.
8. Kelly, N. A. and Morgan, C. �An Evaluation of the Tapered Element Oscillating Microbalance Method for Measuring Diesel Particulate Emissions,� ISSN 1047-3289 J. Air & Waste Manage. Assoc. 52:1362-1377.
9. Moosmuller, H., Arnott, W.P., Rogers, C.F., Bowen, J.L., Gillies, J.A., Pierson, W.R., Collins, J.F., Durbin, T.D., Norbeck, J.M., �Time-Resolved 11 Characterization of Diesel Particulate Emissions. 1. Instruments for Particle Mass Measurements,� Environ. Sci. Technol. 2001, 35, 781-7.
West Virginia University Center for Alternative Fuels, Engines & Emissions
Appendix A: Tabulated Emissions and Fuel Economy Data

West Virginia University Center for Alternative Fuels, Engines & Emissions
Table A- 1: Emissions and fuel economy from tests over the MX1 segment of the MCS
Vehicle Test ID
TestingWeight
(lbf) CO
g/mile CO2
g/mile NOX
g/mile NOX2
g/mile FIDHC(1) g/mile
PM g/mile
TEOM g/mile
Fuel Economy
(mile/gal) MX-VOLVO12-D2S15-MCS 4312-1 32050 37.6 2286.1 26.6 26.7 0.71 3.06 4.11 MX-VOLVO12-D2S15-MCS 4315-1 32050 33.2 2271.0 26.1 25.0 0.88 1.82 1.41 4.15 MX-VOLVO12-D2-MCS 4319-1 32050 48.2 2399.6 23.7 23.8 0.44 3.44 2.65 3.90 MX-VOLVO12-D2-MCS 4320-1 32050 48.9 2262.6 23.2 23.3 0.31 3.26 2.92 4.13 MX-VOLVO12-D2-MCS 4321-1 32050 47.3 2266.9 23.2 22.5 0.18 3.21 2.44 4.12 MX-VOLVO12-D2-MCS 4322-1 32050 50.9 2321.9 23.1 22.4 0.08 3.52 4.02 MX-SCANIA15-D2S15-MCS 4330-1 50040 20.1 2884.2 24.7 25.0 3.04 1.58 1.14 3.30 MX-SCANIA15-D2S15-MCS 4332-1 50040 18.5 2820.8 24.7 23.5 1.77 1.39 1.15 3.38 MX-SCANIA15-D2-MCS 4334-1 50040 22.1 2828.1 23.7 23.7 0.70 1.61 1.34 3.50 MX-SCANIA15-D2-MCS 4335-1 50040 19.9 2806.2 23.6 22.7 0.63 1.58 1.35 3.53 MX-RTP3-D2S15-MCS 4353-1 30220 11.9 2011.0 17.4 17.5 0.58 0.50 0.39 5.05 MX-RTP3-D2S15-MCS 4355-1 30220 12.0 1971.1 16.5 15.5 0.50 0.61 0.05 5.16 MX-RTP3-D2S50-MCS 4362-1 30220 12.0 1936.3 16.2 16.4 0.18 0.65 0.55 5.18 MX-RTP3-D2S50-MCS 4363-1 30220 12.5 1928.2 16.3 15.4 0.17 0.62 0.52 5.20 MX-RTP3-D2-MCS 4364-1 30220 10.4 2069.2 17.8 17.9 0.57 0.47 0.42 4.80 MX-RTP3-D2-MCS 4365-1 30220 11.9 2099.4 18.6 17.4 0.54 0.65 0.54 4.73 MX-MB10-D2S15-MCS 4369-1 26996 15.3 1682.4 12.9 13.0 0.35 0.65 0.50 6.01 MX-MB10-D2S15-MCS 4371-1 26996 14.4 1601.9 11.9 11.1 0.37 0.57 0.49 6.32 MX-MB10-D2S50-MCS 4376-1 26996 15.7 1601.5 11.2 11.3 0.12 0.87 0.96 6.23 MX-MB10-D2S50-MCS 4377-1 26996 14.1 1572.2 10.8 9.9 0.82 0.78 6.36 MX-MB10-D2-MCS 4378-1 26996 12.0 1636.1 11.2 11.1 0.09 1.37 1.54 6.06 MX-MB10-D2-MCS 4379-1 26996 12.1 1588.4 10.9 10.0 0.73 0.50 6.24 MX-BUSSCAR-CNG-MCS 4383-1 33025 3.7 1972.2 19.8 19.7 16.29/2.15 0.01 3.43 MX-BUSSCAR-CNG-MCS 4387-1 33025 2.9 1954.9 19.0 12.8 18.32/1.56 0.01 0.01 3.45 MX-FAW-CNG-MCS 4393-1 48025 2.4 2678.7 36.1 36.1 13.39/0.94 0.01 2.56 MX-FAW-CNG-MCS 4394-1 48025 2.4 2682.6 35.1 28.2 13.90/1.07 0.02 2.55 MX-ALLISON-D2S15-MCS 4400-1 35000 6.7 1773.4 8.6 8.6 0.10 0.09 5.76 MX-ALLISON-D2S15-MCS 4402-1 35000 3.6 1843.7 11.5 1.9 0.04 0.03 5.55 MX-RTP1-D2S15-MCS 4408-1 30070 2.0 2005.5 15.4 5.3 0.08 0.05 5.11 MX-RTP1-D2S50-MCS 4410-1 30070 2.3 1889.7 14.9 14.8 0.15 5.36 MX-RTP1-D2S50-MCS 4411-1 30070 2.3 1927.4 14.8 5.2 0.05 0.04 5.25 MX-SCANIA18-D2S15-MCS 4418-1 57025 21.5 2963.7 28.3 28.3 0.24 1.68 1.35 3.42 MX-SCANIA18-D2S15-MCS 4419-1 57025 21.0 3075.3 28.9 28.2 0.21 1.54 1.37 3.30 MX-SCANIA18-D2S50-MCS 4421-1 57025 24.3 2968.7 23.6 23.4 0.17 1.91 1.55 3.37 MX-SCANIA18-D2S50-MCS 4422-1 57025 23.0 2973.7 23.5 22.9 0.05 1.81 1.55 3.37
West Virginia University Center for Alternative Fuels, Engines & Emissions
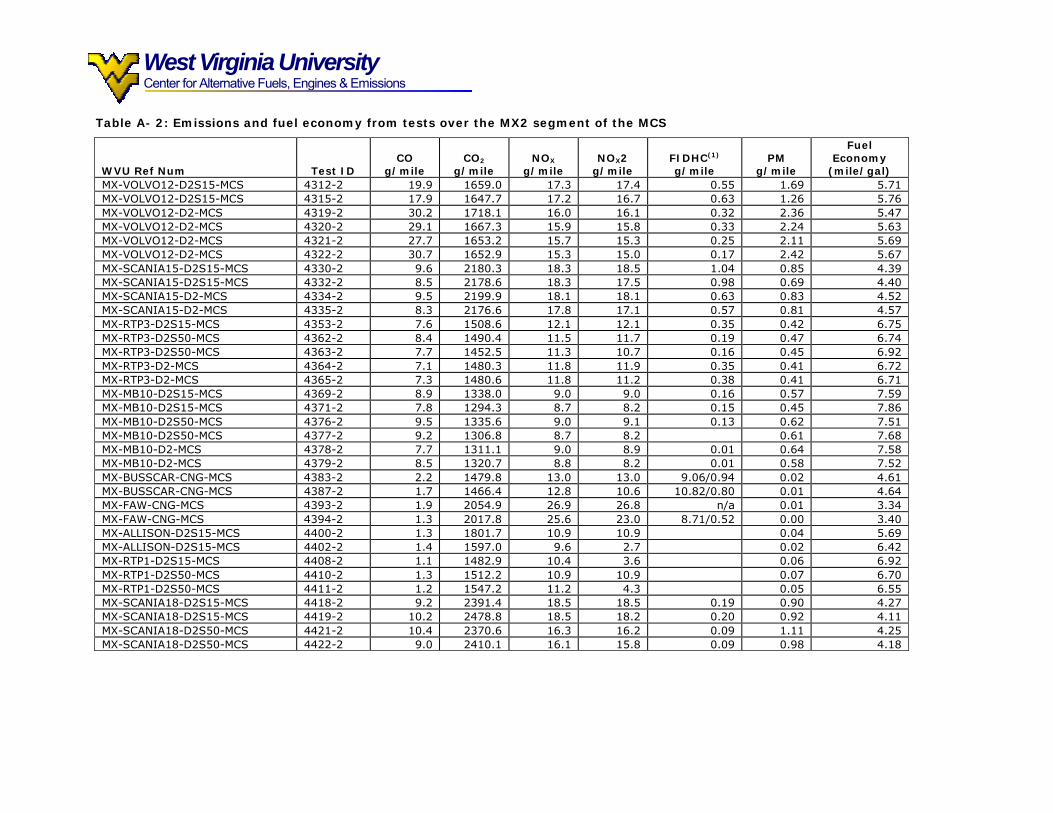
Table A- 2: Emissions and fuel economy from tests over the MX2 segment of the MCS
WVU Ref Num Test ID CO
g/mile CO2
g/mile NOX
g/mile NOX2
g/mile FIDHC(1) g/mile
PM g/mile
Fuel Economy
(mile/gal) MX-VOLVO12-D2S15-MCS 4312-2 19.9 1659.0 17.3 17.4 0.55 1.69 5.71 MX-VOLVO12-D2S15-MCS 4315-2 17.9 1647.7 17.2 16.7 0.63 1.26 5.76 MX-VOLVO12-D2-MCS 4319-2 30.2 1718.1 16.0 16.1 0.32 2.36 5.47 MX-VOLVO12-D2-MCS 4320-2 29.1 1667.3 15.9 15.8 0.33 2.24 5.63 MX-VOLVO12-D2-MCS 4321-2 27.7 1653.2 15.7 15.3 0.25 2.11 5.69 MX-VOLVO12-D2-MCS 4322-2 30.7 1652.9 15.3 15.0 0.17 2.42 5.67 MX-SCANIA15-D2S15-MCS 4330-2 9.6 2180.3 18.3 18.5 1.04 0.85 4.39 MX-SCANIA15-D2S15-MCS 4332-2 8.5 2178.6 18.3 17.5 0.98 0.69 4.40 MX-SCANIA15-D2-MCS 4334-2 9.5 2199.9 18.1 18.1 0.63 0.83 4.52 MX-SCANIA15-D2-MCS 4335-2 8.3 2176.6 17.8 17.1 0.57 0.81 4.57 MX-RTP3-D2S15-MCS 4353-2 7.6 1508.6 12.1 12.1 0.35 0.42 6.75 MX-RTP3-D2S50-MCS 4362-2 8.4 1490.4 11.5 11.7 0.19 0.47 6.74 MX-RTP3-D2S50-MCS 4363-2 7.7 1452.5 11.3 10.7 0.16 0.45 6.92 MX-RTP3-D2-MCS 4364-2 7.1 1480.3 11.8 11.9 0.35 0.41 6.72 MX-RTP3-D2-MCS 4365-2 7.3 1480.6 11.8 11.2 0.38 0.41 6.71 MX-MB10-D2S15-MCS 4369-2 8.9 1338.0 9.0 9.0 0.16 0.57 7.59 MX-MB10-D2S15-MCS 4371-2 7.8 1294.3 8.7 8.2 0.15 0.45 7.86 MX-MB10-D2S50-MCS 4376-2 9.5 1335.6 9.0 9.1 0.13 0.62 7.51 MX-MB10-D2S50-MCS 4377-2 9.2 1306.8 8.7 8.2 0.61 7.68 MX-MB10-D2-MCS 4378-2 7.7 1311.1 9.0 8.9 0.01 0.64 7.58 MX-MB10-D2-MCS 4379-2 8.5 1320.7 8.8 8.2 0.01 0.58 7.52 MX-BUSSCAR-CNG-MCS 4383-2 2.2 1479.8 13.0 13.0 9.06/0.94 0.02 4.61 MX-BUSSCAR-CNG-MCS 4387-2 1.7 1466.4 12.8 10.6 10.82/0.80 0.01 4.64 MX-FAW-CNG-MCS 4393-2 1.9 2054.9 26.9 26.8 n/a 0.01 3.34 MX-FAW-CNG-MCS 4394-2 1.3 2017.8 25.6 23.0 8.71/0.52 0.00 3.40 MX-ALLISON-D2S15-MCS 4400-2 1.3 1801.7 10.9 10.9 0.04 5.69 MX-ALLISON-D2S15-MCS 4402-2 1.4 1597.0 9.6 2.7 0.02 6.42 MX-RTP1-D2S15-MCS 4408-2 1.1 1482.9 10.4 3.6 0.06 6.92 MX-RTP1-D2S50-MCS 4410-2 1.3 1512.2 10.9 10.9 0.07 6.70 MX-RTP1-D2S50-MCS 4411-2 1.2 1547.2 11.2 4.3 0.05 6.55 MX-SCANIA18-D2S15-MCS 4418-2 9.2 2391.4 18.5 18.5 0.19 0.90 4.27 MX-SCANIA18-D2S15-MCS 4419-2 10.2 2478.8 18.5 18.2 0.20 0.92 4.11 MX-SCANIA18-D2S50-MCS 4421-2 10.4 2370.6 16.3 16.2 0.09 1.11 4.25 MX-SCANIA18-D2S50-MCS 4422-2 9.0 2410.1 16.1 15.8 0.09 0.98 4.18
West Virginia University Center for Alternative Fuels, Engines & Emissions
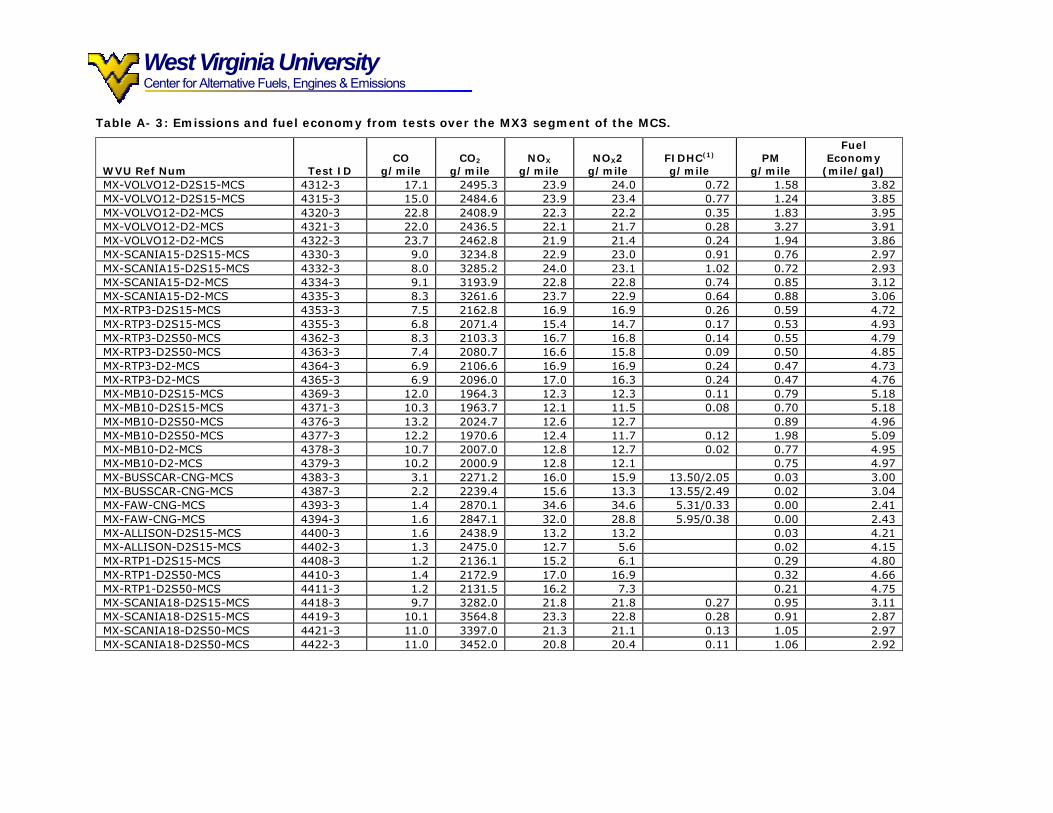
Table A- 3: Emissions and fuel economy from tests over the MX3 segment of the MCS.
WVU Ref Num Test ID CO
g/mile CO2
g/mile NOX
g/mile NOX2
g/mile FIDHC(1) g/mile
PM g/mile
Fuel Economy
(mile/gal) MX-VOLVO12-D2S15-MCS 4312-3 17.1 2495.3 23.9 24.0 0.72 1.58 3.82 MX-VOLVO12-D2S15-MCS 4315-3 15.0 2484.6 23.9 23.4 0.77 1.24 3.85 MX-VOLVO12-D2-MCS 4320-3 22.8 2408.9 22.3 22.2 0.35 1.83 3.95 MX-VOLVO12-D2-MCS 4321-3 22.0 2436.5 22.1 21.7 0.28 3.27 3.91 MX-VOLVO12-D2-MCS 4322-3 23.7 2462.8 21.9 21.4 0.24 1.94 3.86 MX-SCANIA15-D2S15-MCS 4330-3 9.0 3234.8 22.9 23.0 0.91 0.76 2.97 MX-SCANIA15-D2S15-MCS 4332-3 8.0 3285.2 24.0 23.1 1.02 0.72 2.93 MX-SCANIA15-D2-MCS 4334-3 9.1 3193.9 22.8 22.8 0.74 0.85 3.12 MX-SCANIA15-D2-MCS 4335-3 8.3 3261.6 23.7 22.9 0.64 0.88 3.06 MX-RTP3-D2S15-MCS 4353-3 7.5 2162.8 16.9 16.9 0.26 0.59 4.72 MX-RTP3-D2S15-MCS 4355-3 6.8 2071.4 15.4 14.7 0.17 0.53 4.93 MX-RTP3-D2S50-MCS 4362-3 8.3 2103.3 16.7 16.8 0.14 0.55 4.79 MX-RTP3-D2S50-MCS 4363-3 7.4 2080.7 16.6 15.8 0.09 0.50 4.85 MX-RTP3-D2-MCS 4364-3 6.9 2106.6 16.9 16.9 0.24 0.47 4.73 MX-RTP3-D2-MCS 4365-3 6.9 2096.0 17.0 16.3 0.24 0.47 4.76 MX-MB10-D2S15-MCS 4369-3 12.0 1964.3 12.3 12.3 0.11 0.79 5.18 MX-MB10-D2S15-MCS 4371-3 10.3 1963.7 12.1 11.5 0.08 0.70 5.18 MX-MB10-D2S50-MCS 4376-3 13.2 2024.7 12.6 12.7 0.89 4.96 MX-MB10-D2S50-MCS 4377-3 12.2 1970.6 12.4 11.7 0.12 1.98 5.09 MX-MB10-D2-MCS 4378-3 10.7 2007.0 12.8 12.7 0.02 0.77 4.95 MX-MB10-D2-MCS 4379-3 10.2 2000.9 12.8 12.1 0.75 4.97 MX-BUSSCAR-CNG-MCS 4383-3 3.1 2271.2 16.0 15.9 13.50/2.05 0.03 3.00 MX-BUSSCAR-CNG-MCS 4387-3 2.2 2239.4 15.6 13.3 13.55/2.49 0.02 3.04 MX-FAW-CNG-MCS 4393-3 1.4 2870.1 34.6 34.6 5.31/0.33 0.00 2.41 MX-FAW-CNG-MCS 4394-3 1.6 2847.1 32.0 28.8 5.95/0.38 0.00 2.43 MX-ALLISON-D2S15-MCS 4400-3 1.6 2438.9 13.2 13.2 0.03 4.21 MX-ALLISON-D2S15-MCS 4402-3 1.3 2475.0 12.7 5.6 0.02 4.15 MX-RTP1-D2S15-MCS 4408-3 1.2 2136.1 15.2 6.1 0.29 4.80 MX-RTP1-D2S50-MCS 4410-3 1.4 2172.9 17.0 16.9 0.32 4.66 MX-RTP1-D2S50-MCS 4411-3 1.2 2131.5 16.2 7.3 0.21 4.75 MX-SCANIA18-D2S15-MCS 4418-3 9.7 3282.0 21.8 21.8 0.27 0.95 3.11 MX-SCANIA18-D2S15-MCS 4419-3 10.1 3564.8 23.3 22.8 0.28 0.91 2.87 MX-SCANIA18-D2S50-MCS 4421-3 11.0 3397.0 21.3 21.1 0.13 1.05 2.97 MX-SCANIA18-D2S50-MCS 4422-3 11.0 3452.0 20.8 20.4 0.11 1.06 2.92

West Virginia University Center for Alternative Fuels, Engines & Emissions
Table A- 4: Emissions and fuel economy from ETC tests
WVU Ref Num Test ID CO
g/mile CO2
g/mile NOX
g/mile NOX2
g/mile FIDHC(1) g/mile
PM g/mile
TEOM g/mile
Fuel Economy
(mile/gal) MX-VOLVO12-D2S15-ETC 4311-1 6.78 1050.07 10.5 10.5 0.41 0.87 0.69 9.09 MX-VOLVO12-D2S15-ETC 4313-1 9.70 1021.85 9.9 9.7 0.36 0.84 9.30 MX-SCANIA15-D2S15-ETC 4329-1 2.65 1663.66 11.7 11.7 1.03 0.48 0.31 5.78 MX-SCANIA15-D2S15-ETC 4331-1 2.60 1599.48 11.6 11.0 1.02 0.39 0.27 6.01 MX-RTP3-D2S15-ETC 4354-1 2.87 1247.35 8.8 8.8 0.19 0.41 0.30 8.20 MX-RTP3-D2S15-ETC 4356-1 2.39 1220.47 8.0 7.6 0.18 0.29 0.22 8.38 MX-RTP3-D2S15-ETC 4360-1 2.92 1281.33 9.5 9.5 0.19 0.32 0.23 7.98 MX-RTP3-D2S15-ETC 4361-1 2.61 1229.26 8.5 8.2 0.19 0.25 0.19 8.32 MX-MB10-D2S15-ETC 4370-1 2.24 1132.85 8.0 8.0 0.06 0.15 0.12 9.03 MX-MB10-D2S15-ETC 4372-1 2.11 1135.03 7.8 7.4 0.05 0.15 0.12 9.02 MX-BUSSCAR-CNG-ETC 4386-1 0.53 915.43 7.5 7.5 3.67/0.25 0.04 0.03 7.51 MX-BUSSCAR-CNG-ETC 4388-1 0.72 930.41 6.1 5.4 4.56/0.31 0.05 0.03 7.37 MX-ALLISON-D2S15-ETC 4399-1 0.74 1210.16 6.0 6.1 0.00 0.03 0.02 8.48 MX-ALLISON-D2S15-ETC 4401-1 0.58 1051.14 4.9 2.3 0.01 0.01 9.76 MX-RTP1-D2S15-ETC 4406-1 0.42 1084.99 7.3 7.3 0.21 0.12 9.46 MX-RTP1-D2S15-ETC 4409-1 0.51 1097.79 6.7 3.4 0.20 0.11 9.35 MX-SCANIA18-D2S15-ETC 4417-1 2.13 1735.08 10.8 10.6 0.23 0.25 0.18 5.90

West Virginia University Center for Alternative Fuels, Engines & Emissions
Appendix B: Additional Figures
West Virginia University Center for Alternative Fuels, Engines & Emissions
0
1
2
3
4
5
6
7
Figure B - 1: Fuel economy over the MX1 mode of the MCS
0
1
2
3
4
5
6
7
8
9
Figure B - 2: Fuel economy over the MX2 mode of the MCS

West Virginia University Center for Alternative Fuels, Engines & Emissions
0
1
2
3
4
5
6
Figure B - 3: Fuel economy over the MX3 mode of the MCS
0
5
10
15
20
25
30
35
40
NOXNO
Figure B - 4: NOX emissions over the MX1 segment of the MCS
West Virginia University Center for Alternative Fuels, Engines & Emissions
0
5
10
15
20
25
30
NOXNO
Figure B - 5: NOX emissions over the MX2 segment of the MCS
0
5
10
15
20
25
30
35
NOXNO
Figure B - 6: NOX emissions over the MX3 segment of the MCS

West Virginia University Center for Alternative Fuels, Engines & Emissions
0
0.5
1
1.5
2
2.5
3
3.5
4
Figure B - 7: Particulate emissions over the MX1 segment of the MCS
0
0.5
1
1.5
2
2.5
3
Figure B - 8: Particulate emissions over the MX2 segment of the MCS

West Virginia University Center for Alternative Fuels, Engines & Emissions
0
0.5
1
1.5
2
2.5
3
3.5
Figure B - 9: Particulate emissions over the MX3 segment of the MCS
0
10
20
30
40
50
60
Figure B - 10: Carbon monoxide emissions over the MX1 segment of the MCS
West Virginia University Center for Alternative Fuels, Engines & Emissions
0
5
10
15
20
25
30
35
Figure B - 11: Carbon monoxide emissions over the MX2 segment of the MCS
0
5
10
15
20
25
Figure B - 12: Carbon monoxide emissions over the MX3 segment of the MCS

West Virginia University Center for Alternative Fuels, Engines & Emissions
0
5
10
15
20
25
Figure B - 13: Hydrocarbon emissions over the MX1 segment of the MCS
0
2
4
6
8
10
12
14
Figure B - 14: Hydrocarbon emissions over the MX2 segment of the MCS
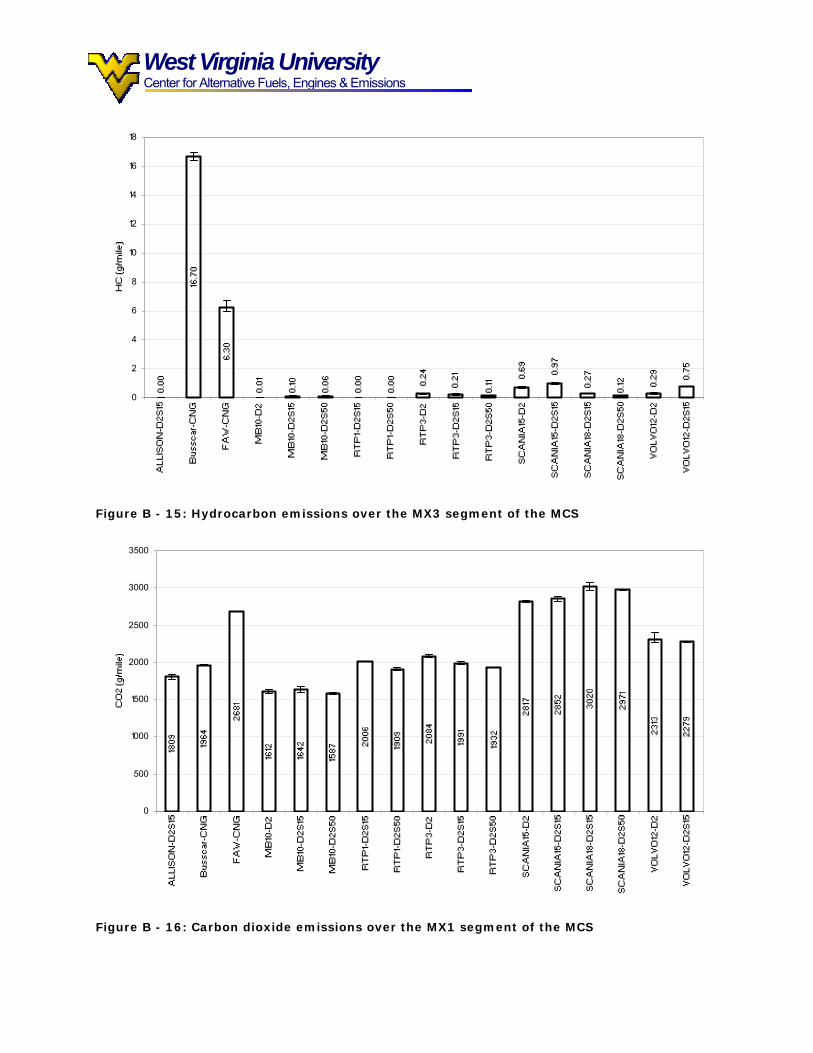
West Virginia University Center for Alternative Fuels, Engines & Emissions
0
2
4
6
8
10
12
14
16
18
Figure B - 15: Hydrocarbon emissions over the MX3 segment of the MCS
0
500
1000
1500
2000
2500
3000
3500
Figure B - 16: Carbon dioxide emissions over the MX1 segment of the MCS

West Virginia University Center for Alternative Fuels, Engines & Emissions
0
500
1000
1500
2000
2500
3000
Figure B - 17: Carbon dioxide emissions over the MX2 segment of the MCS
0
500
1000
1500
2000
2500
3000
3500
4000
Figure B - 18: Carbon dioxide emissions over the MX3 segment of the MCS
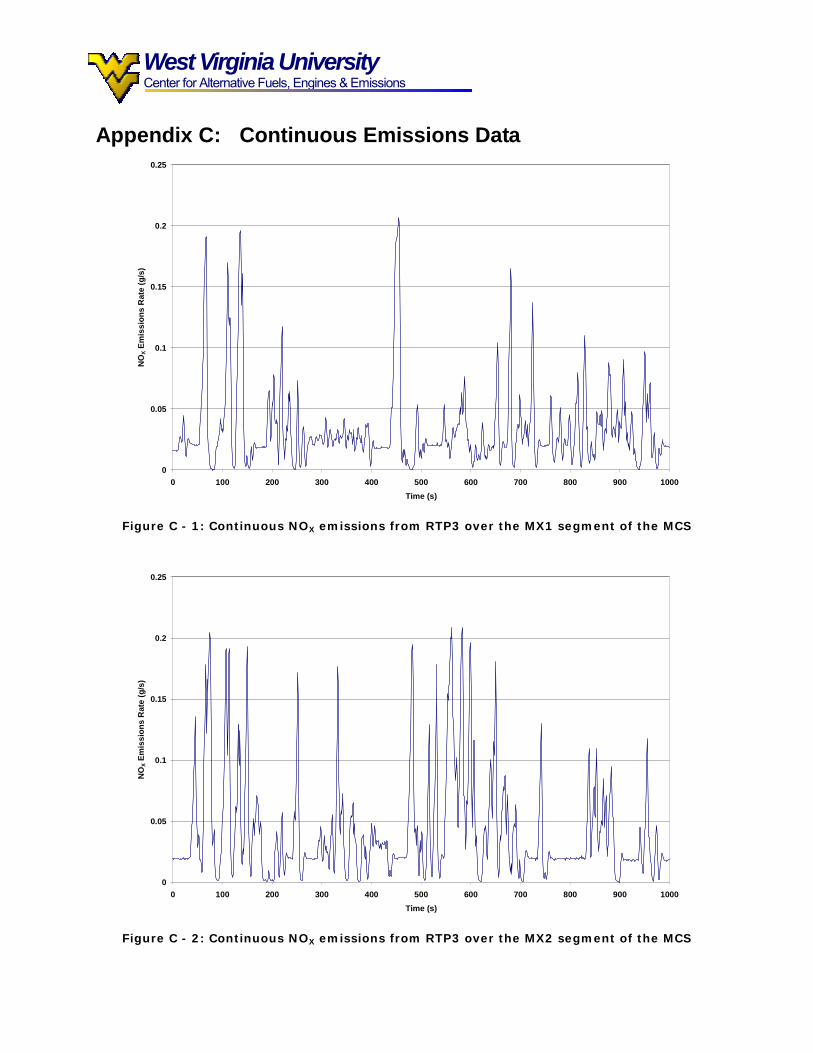
West Virginia University Center for Alternative Fuels, Engines & Emissions
Appendix C: Continuous Emissions Data
0
0.05
0.1
0.15
0.2
0.25
0 100 200 300 400 500 600 700 800 900 1000Time (s)
NO
X Em
issi
ons
Rat
e (g
/s)
Figure C - 1: Continuous NOX emissions from RTP3 over the MX1 segment of the MCS
0
0.05
0.1
0.15
0.2
0.25
0 100 200 300 400 500 600 700 800 900 1000Time (s)
NO
X Em
issi
ons
Rat
e (g
/s)
Figure C - 2: Continuous NOX emissions from RTP3 over the MX2 segment of the MCS
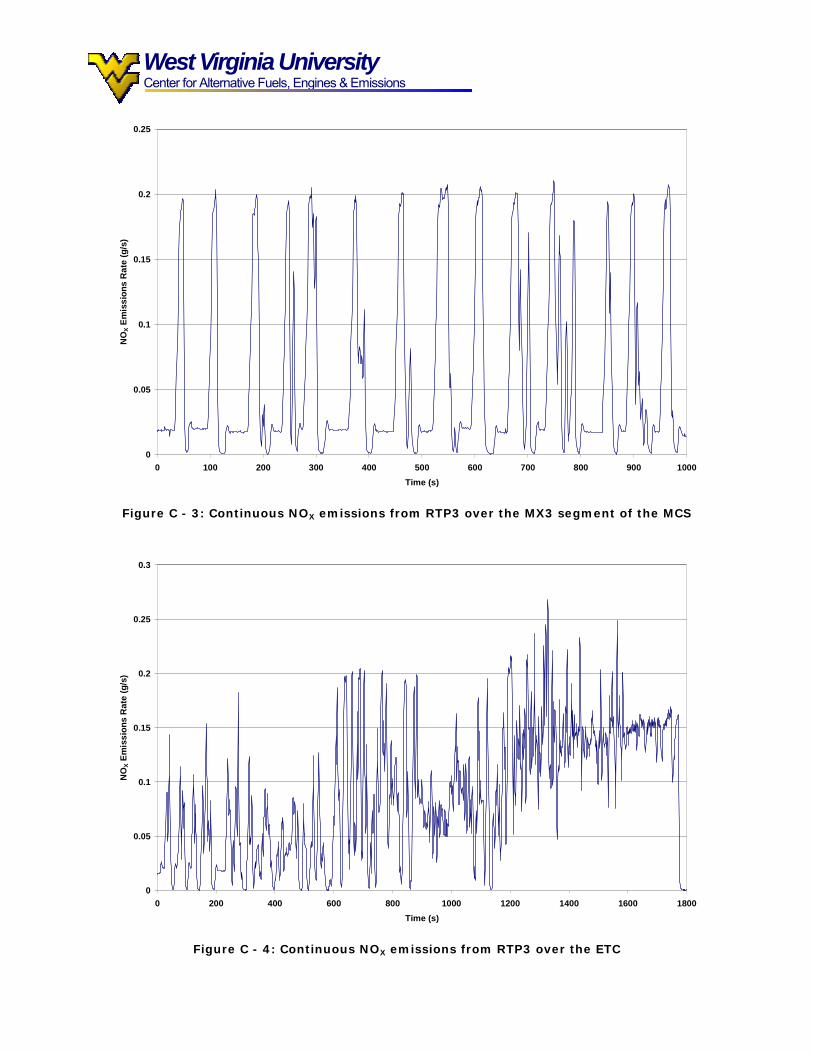
West Virginia University Center for Alternative Fuels, Engines & Emissions
0
0.05
0.1
0.15
0.2
0.25
0 100 200 300 400 500 600 700 800 900 1000Time (s)
NO
X Em
issi
ons
Rat
e (g
/s)
Figure C - 3: Continuous NOX emissions from RTP3 over the MX3 segment of the MCS
0
0.05
0.1
0.15
0.2
0.25
0.3
0 200 400 600 800 1000 1200 1400 1600 1800Time (s)
NO
X Em
issi
ons
Rat
e (g
/s)
Figure C - 4: Continuous NOX emissions from RTP3 over the ETC

West Virginia University Center for Alternative Fuels, Engines & Emissions
0.0000
0.0500
0.1000
0.1500
0.2000
0.2500
0.3000
0 200 400 600 800 1000 1200 1400 1600 1800Time (s)
NOX
Emis
sion
s Ra
te (g
/s)
Figure C - 5: Continuous NOX emissions from the ALLISON Hybrid over the ETC
0.0000
0.0500
0.1000
0.1500
0.2000
0.2500
0.3000
0 200 400 600 800 1000 1200 1400 1600 1800Time (s)
NOX
Emis
sion
s Ra
te (g
/s)
Figure C - 6: Continuous NOX emissions from the BUSSCAR CNG over the ETC
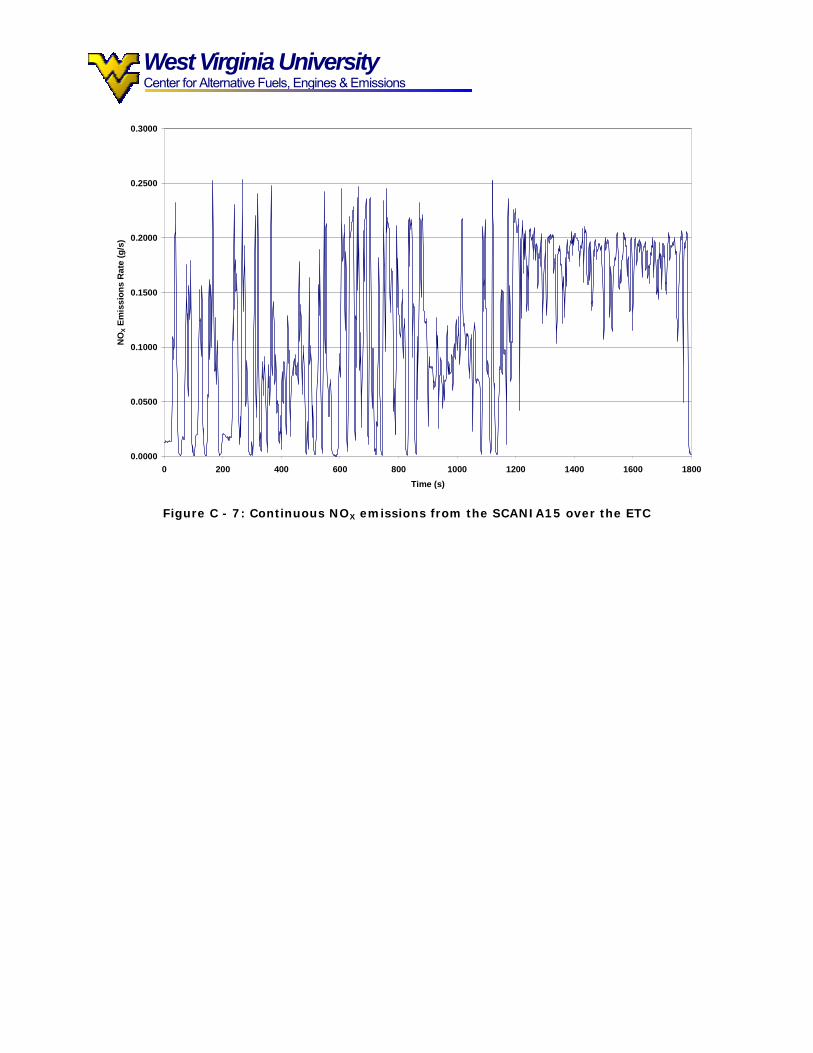
West Virginia University Center for Alternative Fuels, Engines & Emissions
0.0000
0.0500
0.1000
0.1500
0.2000
0.2500
0.3000
0 200 400 600 800 1000 1200 1400 1600 1800Time (s)
NOX
Emis
sion
s Ra
te (g
/s)
Figure C - 7: Continuous NOX emissions from the SCANIA15 over the ETC
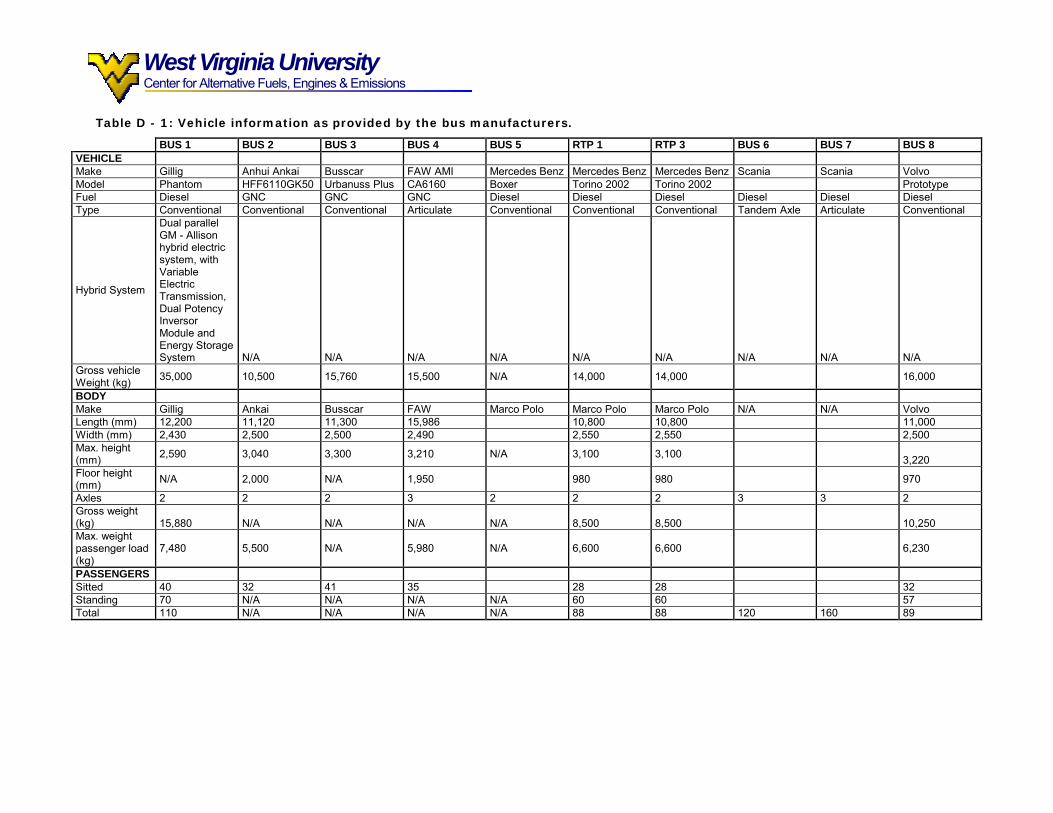
West Virginia University Center for Alternative Fuels, Engines & Emissions
Table D - 1: Vehicle information as provided by the bus manufacturers.
BUS 1 BUS 2 BUS 3 BUS 4 BUS 5 RTP 1 RTP 3 BUS 6 BUS 7 BUS 8 VEHICLE Make Gillig Anhui Ankai Busscar FAW AMI Mercedes Benz Mercedes Benz Mercedes Benz Scania Scania Volvo Model Phantom HFF6110GK50 Urbanuss Plus CA6160 Boxer Torino 2002 Torino 2002 Prototype Fuel Diesel GNC GNC GNC Diesel Diesel Diesel Diesel Diesel Diesel Type Conventional Conventional Conventional Articulate Conventional Conventional Conventional Tandem Axle Articulate Conventional
Hybrid System
Dual parallel GM - Allison hybrid electric system, with Variable Electric Transmission, Dual Potency Inversor Module and Energy Storage System N/A N/A N/A N/A N/A N/A N/A N/A N/A
Gross vehicle Weight (kg) 35,000 10,500 15,760 15,500 N/A 14,000 14,000 16,000
BODY Make Gillig Ankai Busscar FAW Marco Polo Marco Polo Marco Polo N/A N/A Volvo Length (mm) 12,200 11,120 11,300 15,986 10,800 10,800 11,000 Width (mm) 2,430 2,500 2,500 2,490 2,550 2,550 2,500 Max. height (mm) 2,590 3,040 3,300 3,210 N/A 3,100 3,100 3,220 Floor height (mm) N/A 2,000 N/A 1,950 980 980 970
Axles 2 2 2 3 2 2 2 3 3 2 Gross weight (kg) 15,880 N/A N/A N/A N/A 8,500 8,500 10,250 Max. weight passenger load (kg)
7,480 5,500 N/A 5,980 N/A 6,600 6,600 6,230
PASSENGERS Sitted 40 32 41 35 28 28 32 Standing 70 N/A N/A N/A N/A 60 60 57 Total 110 N/A N/A N/A N/A 88 88 120 160 89
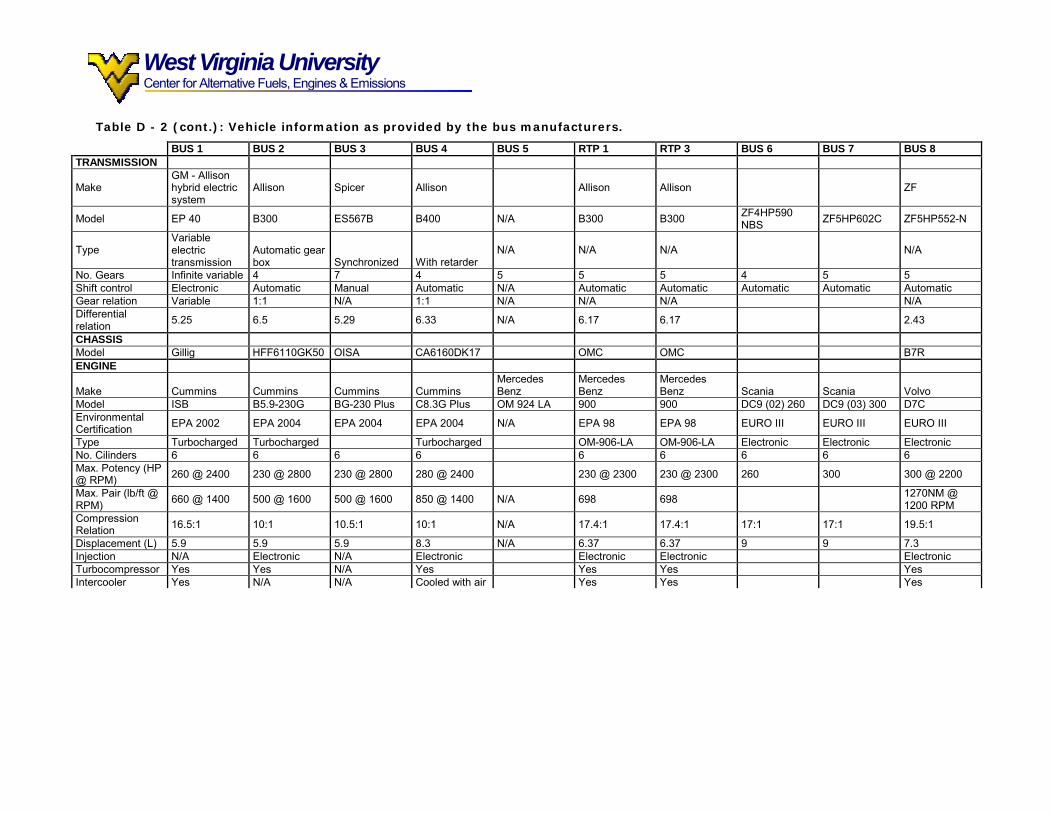
West Virginia University Center for Alternative Fuels, Engines & Emissions
Table D - 2 (cont.): Vehicle information as provided by the bus manufacturers.
BUS 1 BUS 2 BUS 3 BUS 4 BUS 5 RTP 1 RTP 3 BUS 6 BUS 7 BUS 8 TRANSMISSION
Make GM - Allison hybrid electric system
Allison Spicer Allison Allison Allison ZF
Model EP 40 B300 ES567B B400 N/A B300 B300 ZF4HP590 NBS ZF5HP602C ZF5HP552-N
Type Variable electric transmission
Automatic gear box Synchronized With retarder
N/A N/A N/A
N/A
No. Gears Infinite variable 4 7 4 5 5 5 4 5 5 Shift control Electronic Automatic Manual Automatic N/A Automatic Automatic Automatic Automatic Automatic Gear relation Variable 1:1 N/A 1:1 N/A N/A N/A N/A Differential relation 5.25 6.5 5.29 6.33 N/A 6.17 6.17 2.43
CHASSIS Model Gillig HFF6110GK50 OISA CA6160DK17 OMC OMC B7R ENGINE
Make Cummins Cummins Cummins Cummins Mercedes Benz
Mercedes Benz
Mercedes Benz Scania Scania Volvo
Model ISB B5.9-230G BG-230 Plus C8.3G Plus OM 924 LA 900 900 DC9 (02) 260 DC9 (03) 300 D7C Environmental Certification EPA 2002 EPA 2004 EPA 2004 EPA 2004 N/A EPA 98 EPA 98 EURO III EURO III EURO III
Type Turbocharged Turbocharged Turbocharged OM-906-LA OM-906-LA Electronic Electronic Electronic No. Cilinders 6 6 6 6 6 6 6 6 6 Max. Potency (HP @ RPM) 260 @ 2400 230 @ 2800 230 @ 2800 280 @ 2400 230 @ 2300 230 @ 2300 260 300 300 @ 2200
Max. Pair (lb/ft @ RPM) 660 @ 1400 500 @ 1600 500 @ 1600 850 @ 1400 N/A 698 698 1270NM @
1200 RPM Compression Relation 16.5:1 10:1 10.5:1 10:1 N/A 17.4:1 17.4:1 17:1 17:1 19.5:1
Displacement (L) 5.9 5.9 5.9 8.3 N/A 6.37 6.37 9 9 7.3 Injection N/A Electronic N/A Electronic Electronic Electronic Electronic Turbocompressor Yes Yes N/A Yes Yes Yes Yes Intercooler Yes N/A N/A Cooled with air Yes Yes Yes

West Virginia University Center for Alternative Fuels, Engines & Emissions
BUS 1 BUS 2 BUS 3 BUS 4 BUS 5 RTP 1 RTP 3 BUS 6 BUS 7 BUS 8
Location In front of cooling packet
Rear Rear Front In front of radiator
In front of radiator
Rear Rear
FUEL TANK(S)
Capacity (L) 378.5
80 L x 6 + 50 L x 2 (580 L water @ 3000 psi)
80 L x 6 (480 L water @ 3600 psi)
90 L x 6 (540 L water @ 3000 psi)
N/A 208 208 400 400 300
WHEELS Number 6 6 6 10 6 6 6
Size 11.0 R 22.5 10.00 R 20 11 R 22.5 11 R 20 11 R 22.5 11 R 22.5 295 / 80 R 22.5
EMISSIONS CONTROL Yes/No Yes Yes Yes Yes N/A Yes No N/A
Type Continuosly Regenerating Technology
Catalytic Converter
Catalytic Converter
Catalytic Converter
N/A Continuosly Regenerating Technology
N/A
Make Johnson Matthey Fleetguard Donaldson Fleetguard N/A Johnson
Matthey N/A
Model CRT Filter System 3927832 M110857 3928277 N/A CRT Filter
System N/A