City of Virginia Beach - Comprehensive Sea Level Rise and ...
West Virginia Comprehensive Analysis of Summative Assessments (CASA)

West Virginia Comprehensive Analysis of Summative Assessments (CASA)
January 2017

www.EducationAlliance.org 3
Table of Contents
Executive Summary .....................................................................................4
Introduction and Overview of State Assessments ...................................6
Procedures Used to Identify Key Criteria ...................................................7
Analysis .......................................................................................................13
Findings .......................................................................................................42
Appendices .................................................................................................51
Table of Contents
West Virginia Comprehensive Analysis of Summative Assessments (CASA)4
The Comprehensive Analysis of Summative Assessments (CASA) project is based on the premise that a valid and reliable student learning assessment is a critical component of an effective state education system. To that end, considerable discussion has taken place in West Virginia over the
past years as to whether the state should continue to use the Smarter Balanced Assessment Consortium (SBAC) test or move to a new assessment system. In 2016, the Education Alliance conducted a project to determine the qualities of state assessments that West Virginians value, develop a set of key criteria based on those (and additional technical) qualities, and evaluate various publicly available assessments against the key criteria. The purpose of the project was to provide decision makers with objective informa-tion and a set of criteria and an analytical framework that can be used to evaluate potential state assess-ments.
A two-phased approach was conducted for the project — Phase I: the identification of the key assess-ment criteria valued by West Virginia stakeholders; and Phase II: the analysis of available assessments’ strengths and weaknesses based on those criteria. Phase I of the project included three methods of information gathering: (1) an electronic survey, (2) a series of focus group discussions, and (3) convening a stakeholder group. After stakeholder information was summarized, the second phase of the project focused on conducting independent research on features and qualities of various national assessments currently being marketed and used by states to satisfy federal requirements under the Elementary and Secondary Education Act (ESEA), evaluating how each of these assessments rates against the key criteria developed in Phase I of the project, and presenting additional information West Virginia decision makers should consider when evaluating the state’s assessment options. The results of the research and analysis are presented in this report.
The West Virginia Key Assessment Criteria that were developed fell into four categories:
• Content Qualities — measures state standards (alignment), measures student growth, measures college readiness
• Structure Qualities — test length; test questions, both multiple-choice and constructed-response items; testing mode, i.e., online with paper option; and availability of accommodations
• Results and Reporting Qualities — results can be returned with a short turnaround time; reports are readable and usable by parents and students; the results have benefits/ramifications for students; and results can be compared across years, districts, or states
• Test Quality — provides valid and reliable information and meets technical/psychometric standards (i.e., meets federal peer review requirements)
The project reviewed six different national assessments against the West Virginia key assessment criteria. These six assessments were presented to give West Virginia policymakers an overview of some of the more commonly used national assessments. This includes the type of assessments available in the market, their various attributes, and how each stacks up against the key criteria. The six assessments fell into three categories: college entrance exams (SAT and ACT), national consortium developed assessments (PARCC and SBAC), and next-generation assessments tied to college readiness reporting scales (eMPower and ACT Aspire). As summarized in this report, each assessment has its strengths and weaknesses with respect to how it rates versus the key criteria.
As is the case in all assessment procurements, there are some conflicts that need to be resolved be-tween different West Virginia key assessment criteria when making an actual product selection. Conflicts between the desire for an assessment of high-quality, an assessment that can be given in a short amount
Executive Summary

www.EducationAlliance.org 5
Executive Summ
ary
of time, and an assessment that minimizes cost will need to be reconciled by policymakers. Decisions on administration mode and the nature and amount of teacher professional development will also need to be made. As stated in the report, it is important to remember that no single assessment can satisfy the needs and purposes of all users of the data. A system of assessments is required to do this.
Regardless of which summative assessment is used by West Virginia, these are the key findings that come from the stakeholder input and the analysis:
1. Student Motivation:a. Student motivation in testing is critical to accurate assessment results and a successful
assessment system must be tied to outcomes and benefits that are clear to students. b. When considering student motivation, it is strongly recommended that students be includ-
ed in the dialogue. Data from student focus groups conducted for this study indicate that not all students are motivated by the same strategies (e.g., school-level rewards, course grades, college entrance). A comprehensive approach is needed.
2. Results & Reports: a. Simple and understandable reports should be provided to educators and families in a timely
fashion. Ideally, these reports should be received before the end of the school year.b. Professional development is needed to clarify the difference between assessments of learn-
ing (e.g., state assessment) and assessments for learning (e.g., formative or other assessments). Some stakeholders’ understanding/expectations of the state summative assessment reports do not align with its purpose or capabilities.
3. Trade-offs: a. Peer states are taking diverse approaches to tackling the assessment issue. No one test
meets all of the key criteria. There are trade-offs to be made and policymakers should be armed with information on the strengths and weaknesses of all testing options.
b. Tests are evolving and will continue to change to meet the expectations of consumers. Attention to these ongoing changes should also include continued dialogue to ensure the system meets the needs of West Virginia students.
4. Systemic Implications: a. There is a general sense among educators of “over-testing” and a resulting decrease of
student learning time. Some of this perception may be driven by additional local testing require-ments. A local audit of testing practices may be needed to ensure a streamlined system and avoid unnecessary and duplicative testing that reduces student learning time.
b. Given the current state budget dilemma, cost is a factor that deserves important consider-ation. As described in the report, testing costs go beyond the initial price of the test and include other factors such as training educators for the test, design of reports, and changes to interrelat-ed systems. However, cost should not be the single driving or determining factor in decision-mak-ing. West Virginia students deserve a holistic approach to this critical choice regarding the state assessment.
c. Many West Virginia educators and families expressed concerns with the current test and/or testing practices but are also exhausted with change. Therefore, any change made to West Virginia’s assessment system should be made deliberatively and with an eye towards easing the burden that flux and inconsistency put on teachers, students, and families.
This report is organized into four main parts — an overview of state assessments, a description of the procedures used to select the key assessment criteria, the approach used to analyze the data collected as part of this project, and the findings. An extensive set of appendices are on The Education Alliance’s website at www.educationalliance.org/casa

West Virginia Comprehensive Analysis of Summative Assessments (CASA)6
Project OversightIn July 2016, The Education Alliance (the Alliance) selected the Assessment Solutions Group (ASG) to
conduct a special project to assist West Virginia in a Comprehensive Analysis of Summative Assessments (CASA), and to summarize the information in a report for the state. Over the past seven years, ASG has advised and assisted a number of states in determining the best approach to use in selecting an assess-ment. ASG has evaluated the pros and cons of using various approaches, such as a consortium test, an off-the-shelf test, or a custom-developed test, as well as the costs for these different approaches. More details on ASG are provided in Appendix A.
The Education Alliance does not endorse ACT, PARCC, SAT, SBAC, or any other assessment. Throughout its 33-year history, The Education Alliance has served as an independent voice, earnest advocate, and statewide participant that advances policies and practices to improve student achievement. As in all of its policy priorities, the Alliance approached this assessment study with no pre-conceived recommendation or determined agenda other than to provide solid, reliable, and research-based information and recom-mendations to policymakers and the public.
Project PurposeThe Education Alliance’s Comprehensive Analysis of Summative
Assessments (CASA) project is based on the premise that a valid and reliable student learning assessment is a critical component of an effective state education system. Considerable discussion has taken place in West Virginia over the past years as to wheth-er or not the state should continue to use the Smarter Balanced Assessment Consortium (SBAC) test or move to a new assessment system. This report does not issue a specific recommendation re-garding a preferred state test, but rather provides objective data and analysis of various tests’ strengths and weaknesses to inform the state’s decision making.
The purpose of the CASA project was to identify key assessment criteria that are most valued by West Virginia stakeholders, analyze how available assessments compare based on those criteria, and provide West Virginia decision makers an analytical framework with which to evaluate potential state assessments. ASG was involved in both phases of the project — Phase I: the identification of the key assessment criteria valued by West Virginia stakehold-ers, and Phase II: the analysis of available assessments’ strengths and weaknesses based on those criteria. Phase I of the project included three methods of information gathering: (1) an electronic survey, (2) a series of focus group discussions, and (3) convening a stakeholder group. After stakeholder information was summarized, ASG conducted independent research on features and qualities of various national assessments currently being marketed and used by states to satisfy federal requirements under the Elementary and Secondary Education Act (ESEA), evaluating how each of these as-sessments rates against the key criteria developed, and presenting additional information West Virginia decision makers should con-sider when evaluating the state’s assessment options. The results of the research and analysis are presented in this report.
Introduction and Overview of State Assessments

www.EducationAlliance.org 7
Introduction &
Procedures
The project team gathered most of the data from West Virginia stakeholders for this study using three different approaches:
1. Conduct a survey of over 1,700 West Virginia stakeholders on their attitudes regarding state assessments, as well as features and components of assessments believed to be important;2. Convene a series of eight focus group meetings with different West Virginia groups involved in education and/or testing; and3. Gather data from a large stakeholder meeting, which was held in West Virginia on August 22, 2016, on key criteria related to assessments.
SurveyA survey was conducted with over 1,700 West Virginia stakeholders responding. The survey questions
were developed by the project team, based on work it has completed with other states, and reviewed and edited by The Education Alliance in order to make sure the survey questions reflected current assessment issues in the state. The occupations of the stakeholders responding to the survey are shown in the table below.
State Respondents to West Virginia Assessment SurveyPlease identify your role as it relates to the West Virginia education system
Answer OptionsResponse Percent
Response Count
Administrator (i.e., Principal, Director, Superintendent) 11.0% 192Teacher 57.7% 1,005State Legislator 0.6% 10Parent/Community Member 7.8% 136Board of Education Member (State or Local) 1.2% 21Business Leader 2.3% 40Student 5.3% 93Other 14.1% 245
Responded to Survey 1,742
A majority of respondents were teachers, but other stakeholder groups (parents, students, business leaders, education administrators, state legislators, etc.) had a significant number of individuals complet-ing the survey as well.
Primary survey questions covered the following areas:• Purposes of assessment
• Assessment administration mode (computer versus paper and pencil)
• Item (question) types used on assessments (multiple-choice, constructed response)
• Importance of comparability of results across schools in West Virginia and across the nation
Procedures Used to Identify Key Criteria

West Virginia Comprehensive Analysis of Summative Assessments (CASA)8
• Test length (testing time)
• Test results (reporting criteria)
• Test accommodations for students with disabilities and English language learners
• Users and uses of state assessments
The final survey question asked the respondent to rank the importance of the top three criteria listed in the survey regardless of question.
The survey asked respondents to rate the importance of various assessment criteria or aspects on a 5-point Likert scale. The two tails of the Likert scales were “very low importance” and “very high impor-tance” or “strongly disagree” and “strongly agree.” Each survey question included a follow-up question asking the respondent to rate the top one, two, or more criteria in terms of importance. For example, shown in the table below are the survey questions, Likert scales, and most important criteria related to the question “purpose of assessments.”
West Virginia Assessment Survey
PURPOSES OF ASSESSMENT
Answer OptionsVery Low
ImportanceLow
Importance NeutralHigh
ImportanceVery High
ImportanceRating
AverageMeasures the content that WV teachers are teaching (aligned to WV standards) 62 111 278 516 413 3.80
Measures if students are prepared for college 60 136 301 577 303 3.67
Measures if students are prepared for careers 57 136 285 546 351 3.73
Motivates students to try hard (used for scholarship eligibility) 110 144 307 495 320 3.56
Motivates students to try hard (used for grades) 178 214 333 405 242 3.23
Measures the performance of students at the lowest and highest levels of per-formance for accountability purposes
183 206 407 382 197 3.15
West Virginia Assessment SurveyWhich item from the previous question is the MOST important to you? (select one)
Answer Options Response Percent Response CountMeasures the content that WV teachers are teaching (aligned to WV standards) 32.3% 428
Measures if students are prepared for college 18.1% 240Measures if students are prepared for careers 17.0% 225Motivates students to try hard (used for scholarship eligibility) 6.6% 87Motivates students to try hard (used for grades) 9.9% 132Measures the performance of students at the lowest and highest levels of performance for accountability purposes 10.2% 135
Other 6.0% 80103
answered question 1,327skipped question 415
Other (please specify)

www.EducationAlliance.org 9
Procedures Usedto Identify Key Criteria
Through these survey questions, as well as the other data-gathering methods mentioned in this report, the project team was able to identify the key criteria West Virginians value in a state assessment. (The full survey questions and the results can be found at www.educationalliance.org/casa)
Focus Group MeetingsOn August 22, 2016, a series of focus group meetings were held to gather additional information from
constituents across the state. The agenda for these meetings included in-depth discussions with the following groups: classroom teachers and principals (Elementary School, Middle School, and High School), teacher organizations, County Superintendents, legislators, West Virginia Department of Education staff members, parents who represent grade levels of students tested by the state assessment, and County and State Board of Education members.
In addition to these groups, two informal student focus groups (Middle and High school students) were conducted. The focus groups were organized and scheduled by The Education Alliance. During each focus group, information was gathered on the following topics:
QUESTIONS/TOPICS FOR FOCUS GROUPS1. What should be the primary purpose for the state assessment in West Virginia?2. West Virginia, like many states, is struggling with tension between adopting an assessment that measures college readiness versus an assessment that measures high school achievement. How do you suggest that West Virginia navigate this issue? 3. What are the opportunities that the state should recognize as it considers its state assess-ment? 4. What are the challenges or barriers that could impact the assessment? 5. What advice would you give policymakers who are responsible for determining the structure of the state assessment? 6. Closing comments
The discussions were very open and cordial, and a great deal of information was recorded by ASG. A compilation of the input received from the focus groups is presented in Appendix B.
Stakeholders Convening MeetingOn the evening of August 22, 2016, a meeting with stakeholders was held with about 75 people attend-
ing. Table conversations focused on three main topics which were selected based on the survey results as important ones on which to obtain additional information. These are the topics and questions that were asked of the stakeholders:
1. What is the primary purpose of assessment? How much information can one assessment provide?
2. What are the trade-offs between assessment quality, length, and cost?
3. What advice would you give policymakers in selecting a high school assessment? Will one high school test accomplish all objectives?
A compilation of the information that was gathered at the stakeholders meeting is provided in Appendix C.
Process of Deriving Key Themes and Assessment Criteria from the Data GatheredOnce all of the surveys were completed and focus group and stakeholder meetings held, the project
team collected the data and synthesized it to develop a preliminary listing of the key criteria West Virgin-ians value in an assessment. The survey data responses themselves were already ranked in importance, by design. The final survey question asked the respondents to rate the top three survey criteria so these two data-gathering aspects of the survey gave the team the opportunity to rank the various assessment responses both specifically by survey question and generally in terms of overall importance in the survey.

West Virginia Comprehensive Analysis of Summative Assessments (CASA)10
As noted above, during the stakeholder meeting, a stakeholder at each table was asked to record the table’s responses to the three questions posed. The project team took the notes from the focus group and stakeholder meetings, combined them with the results from the survey, added some important technical assessment benchmarks, and developed a preliminary list of key criteria. This list was shared with the Alliance who then provided input to the criteria based on its knowledge of what is currently happening in the state. The process was repeated once more until everyone agreed that the best set of key assessment criteria had been developed.
Key Assessment CriteriaAfter reviewing the data from the survey, focus group, and stakeholder meetings, and augmenting that
information with important general technical assessment requirements, the West Virginia key assessment criteria were derived. As it turned out, the key criteria mentioned by survey respondents, focus groups, and stakeholder meeting attendees were very similar. Using all three sources of information allowed for a more complete and richer feel for the importance of various assessment qualities among West Virginians.
WEST VIRGINIA KEY ASSESSMENT CRITERIA
ContentMeasures state standards (alignment)Measures student growthMeasures college readiness
StructureTest lengthItem types include multiple-choice items AND constructed-response items (test
questions)Testing mode — available online with paper option Offers/allows accommodations
Results and ReportingShort turnaround time for receipt of resultsParent/Student readability/usabilityTest results have benefits/ramifications for students Results can be compared across years, districts, or states
Test QualityProvides valid and reliable information (meets federal peer review requirements)Meets technical/psychometric standards
The West Virginia key assessment criteria were organized into four main categories — content, structure, results and reporting, and test quality. In order to make an assessment evaluation meaningful and man-ageable, the team decided to limit the number of groups and key criteria to three or four. The team felt that state assessments can be adequately evaluated using these key criteria by individuals with proper technical credentials serving on a state assessment evaluation/selection committee. The key assessment criteria and a brief description of each are outlined in the table below.

www.EducationAlliance.org 11
Procedures Usedto Identify Key Criteria
Key Assessment Criteria and Description
Key Assessment Criteria DescriptionCONTENT
Measures State Standards
Determines the degree to which the student has mastered the West Virginia content standards.The assessment must be closely aligned to state standards in both breadth and depth (the criteria required to pass peer review).
Measures Student GrowthThe assessment can determine the growth in student learning from one year to the next (or, depending on the testing instrument, growth within a school year).
Measures College Readiness The assessment is accepted by higher education institutions as an accurate measure of college readiness.
STRUCTURE
Test LengthWest Virginians overwhelmingly expressed a desire that the length of each subject area (Math, ELA) assessment be short (<2 hours) versus medium (2-3 hours) or long (4 hours or more).
Test Includes Multiple-Choice and Constructed-Response Item (question) Types
Multiple-choice questions are easy to administer and score but may not do as good a job measuring student critical thinking skills as constructed-response item types. West Virginians expressed a preference that both types of items be included on the state assessment.
Testing Mode — Online and Paper and Pencil
Respondents noted that the assessment should be available in both online and pencil and paper modes. Some expressed concerns with the lack of tech-nology readiness of some schools and/or the inability of younger students (grades 3 and 4) to use the technology (i.e., use computers to respond to test items or write responses).
Test Offers/Allows AccommodationsThe state assessment should offer all the necessary supports so that stu-dents with disabilities and English language learners can be assessed fairly and appropriately.
RESULTS AND REPORTING
Turnaround Time for Receipt of ResultsResults should be returned quickly to schools (~3 weeks) versus medium (4-7 weeks) or long (8 weeks or longer) in order to have maximum benefit for administrators and teachers to act upon.
Parent/Student Readability and Usability
Many expressed concerns that current test score reports are difficult to inter-pret and/or do not provide information about what the parent/student should do in light of the results.
Test Results Have Ramifications/Benefits for Students
The state assessment should motivate the student to perform to his/her utmost ability. A concern of most stakeholders is that students are not mo-tivated to perform well on the state assessment because a good score does not benefit him/her. End-of-course exams (EOCs) have the potential benefit of effectively engaging every student. Other assessments (SAT, ACT, etc.) motivate students that are college bound.
Results Can be Compared Across Years, Districts, or States
An assessment needs to ensure comparability. That is, state and district results can be compared against future and prior results in order to measure progress across the state of West Virginia. If possible, it is also desirable to compare West Virginia scores with scores from other states.
TEST QUALITYValidity and Reliability Test scores must be valid for their intended use and must provide results
that are reliable, thus permitting comparisons from year to year and grade to grade.
Meets Technical and Psychometric Standards
The assessment should adhere to technical requirements in order to be psycho-metrically sound and provide effective measurement of student achievement.
West Virginia Comprehensive Analysis of Summative Assessments (CASA)12
Discussion of Other Issues Identified in the Focus Group and Stakeholder Meetings ASG gathered considerable additional information during the focus group and stakeholder meetings
based on the conversations that took place and the various comments made by attendees. Several other issues came up that were not listed as key criteria for the state to consider, but are presented here as part of the official record as they may be important to West Virginia stakeholders when evaluating an assessment. The following issues were mentioned (in no particular order):
• Assessment literacy of stakeholders and possible misconceptions of various aspects of assessments, such as technical characteristics
• Need for more teacher professional development
• Use of multiple measures to get the variety of information that may be needed (interim or benchmark assessments, formative assessments, end-of-course tests, etc.)
• The conflict between amount of time it takes to administer and score items that assess higher-order skills and the need for high quality items like constructed-response type items and performance tasks
• Benefits of continuity in an assessment system and costs of switching to a new assessment system
• Issues related to the sometimes conflicting issues of quality, cost, and test length

www.EducationAlliance.org 13
Analysis
Background States are required to give annual assessments in English Language Arts (ELA)/Reading and Mathemat-
ics in grades 3-8 and high school, as specified in the Elementary and Secondary Education Act (ESEA). The No Child Left Behind Act (NCLB), a subsequent version of ESEA, had many new requirements for state assessments, accountability, and reporting. A significant increase in testing occurred as a result of NCLB and the total amount of statewide assessment in the U.S. has increased dramatically since 2001. In some states that pioneered statewide assessment programs, a more than 500% increase in the size of the state assessment program took place. The amount of change in other states has been comparable, with many adding statewide assessments as a state accountability policy lever for the first time in their states’ history in addition to expanding assessments to meet federal requirements. In addition, most districts began testing students during the months prior to statewide testing to identify those students in need of additional support in order to pass (i.e., achieve at the proficiency level for) the statewide summative assessments.
The latest reauthorization of ESEA, the Every Student Succeeds Act (ESSA) which was passed by Con-gress in December 2015, continues many of the federal requirements for testing but also provides states with more flexibility on what assessments they may use. Currently, states are using a variety of approach-es for their assessment systems, which may include a combination of the following:
Assessments from state consortia (PARCC or SBAC)
Off-the-shelf assessments (e.g., ACT Aspire, eMPower, various commercial norm-referenced tests, etc.)
A hybrid of an off-the-shelf assessment augmented with state-specific content
Custom tests developed by vendors working for individual states
CCR (college- and career-ready) tests or CEE (college entrance exams) (i.e., ACT or SAT)
EOC (end-of-course) tests at the high school level
In addition, some states are using interim or benchmark assessments or formative approaches to supplement their summative assessment. Many states are reviewing and evaluating the assessment ap-proaches they are currently using, and some may be making changes to their programs in coming years.
Purposes and Uses/Users of State Assessments There are many different purposes of assessments and users of state assessment information (such
as students and parents, educators, policymakers, and the general public). There are also different uses of results at the state, district, school, classroom, and student levels. It is critical that the purposes for assessment have been clearly defined and agreed upon. Some of the possible purposes of assessment information include to:
• Guide individual student learning
• Determine extent of student learning — in the classroom, school, and district levels
• Review and improve the instructional program
• Evaluate the educational program
• Hold students, educators, or the educational system accountable for performance
• Certify learning
• Predict future performance
• Monitor growth and progress in achievement
• Determine college and career readiness
Analysis

West Virginia Comprehensive Analysis of Summative Assessments (CASA)14
In general, there are two basic types of assessment:1. Assessments for learning — These are assessment processes that occur during daily instruction or as
periodic events and help teachers adjust instruction and students adjust their learning as instruction and learning are occurring (formative in nature).
2. Assessments of learning — These are assessments which occur at the conclusion of instruction (sum-mative in nature); these may be at the end of a unit of instruction, a marking period, semester, or at the end of a school year.
Both assessment types are important but are different from each other. Used together, they provide a balanced approach to assessment. This report provides a table in Appendix D that summarizes the different types of users and uses for the two basic types of assessment. Overall, the emphasis is either on approaches that focus on learning in the classroom or on summative tests that measure what has been learned at the conclusion of instruction.
It is important to recognize that one single assessment cannot meet all of the purposes of all stake-holders equally and effectively. Some assessment purposes are mutually exclusive with other purposes. For example, a school accountability (summative) test may not provide much information to guide indi-vidual student learning. This means that a system of assessments is needed to meet all the different purposes and multiple measures may be needed to provide the variety of information needed.
Procedures Used to Analyze Existing Assessments The project team conducted independent research regarding the various national assessments present-
ed in this report. This research consisted of reading website materials related to the entity’s assessment, contacting the vendors to obtain additional information, reviewing independent studies (where available) on various quality aspects of assessments, and holding discussions with noted industry personnel on the various assessments presented in this report. Additionally, the project team referred to the state assess-ment survey information ASG gathers each year in order to get a national view of the current state of the industry, as well as recent assessment trends of potential interest to West Virginia stakeholders. Finally, as part of the project, ASG conducted a review of the literature (see Appendix E) and researched informa-tion from recent studies that have been done to evaluate and/or critique the quality of assessments, in particular, state assessments.
Among the studies that are viewed as being important were those from CCSSO, Fordham, HumRRO, and AERA/APA/NCME. Two of the studies (Fordham and HumRRO) evaluated the quality of some of the new assessments that are being used in many states — PARCC, SBAC, and ACT Aspire, as well as the Massachusetts Comprehensive Assessment System (MCAS). The MCAS was included in the study as it represents what is widely believed to be one of the better state assessments in use. The criteria used to evaluate the assessments in the studies are (1) alignment to standards, (2) cognitive demands of test items, and (3) best practices in testing and technical quality. Details of the findings from this study are presented in Appendix F.
In addition, two CCSSO documents recommended that states use the following six criteria when eval-uating an assessment for possible procurement: (1) alignment to standards, (2) use of high-quality test items, (3) technical quality (validity, reliability, etc.), (4) accessibility and fairness, (5) useful and timely reports, and (6) best practice in test administration. The full list of criteria and principles for states to con-sider are provided in Appendix G.
It should be noted that the West Virginia key assessment criteria listed in the previous section incorpo-rate aspects for most if not all of the principles listed in these papers with, perhaps, the exception of test administration criteria. Test administration criteria apply to the methods and practices by which a test vendor may create items, design test forms, administer the assessment system, manage the program, produce reports, etc. These criteria are important and should be included in any RFP a state may issue to procure an assessment. Assessment experts that are familiar with these criteria should be used to assist West Virginia in developing its RFP.

www.EducationAlliance.org 15
AnalysisResults of AnalysisThe resulting data is organized around four key areas of analysis: national trends in state assessments,
peer states’ assessments, West Virginia criteria alignment, and a cost analysis.
Recent Trend Analysis ASG speaks with state assessment directors to conduct an annual survey of state assessment pro-
grams. It has been doing this since 2011, and several trends have been noted as state assessments have evolved. Some of the important trends are highlighted below.
The biggest trend over the past 5 years is the move to online assessment (OLA). This trend has grown steadily over the years:
• In 2011, less than 1/3 of states’ summative assessments were administered online.• In 2015, at least half of the states successfully moved to OLAs.• In 2016, the large majority of states and students were tested using computer-based assess-ments.
The next biggest change noted in ASG’s survey data is the rise and decline of the assessment consortia:
• In 2011, over 40 states were members of either SBAC or PARCC (or both).• In 2016, 21 states and the District of Columbia (DC) tested using a consortium assessment.• By post-2016, it is likely that a few more states will exit a consortium.• PARCC membership is down to only 6 states and DC (about 3.7 million students) for 2015-16. The loss of large states like Massachusetts and Ohio is a concern to the viability of the consor-tium. Beginning in 2016, PARCC is now offering unbundled content to user states.• SBAC membership has been somewhat more stable with 15 states testing in 2015-16, but Cali-fornia comprises about 40% of the consortium’s approximately 8-9 million tested students.
A very recent trend has been for states to replace the grade 11 standards-based assessments with a CCR or College Entrance Exam. Note that ESSA openly permits use of a CEE as its high school accountability exam.
• Roughly 8 states did this in 2015-16, and several more are considering it. • Competition for market share in the CEE area is heating up to take advantage of this trend.
In 2015-16, 10 states implemented new summative assessment programs, for example: • Nevada will still be implementing the SBAC assessment but with a new vendor (DRC) and new computerized testing system.• Another 5 states will be implementing new programs after 2016.• Several states (Indiana, North Carolina, North Dakota, Wyoming, and many others) have com-mittees or task forces of stakeholders looking at their assessment programs.
Finally, one more trend seen in the data is that the use of EOC tests in high school continues to grow:
• 16 states use EOC tests to fulfill ESEA high school testing requirements.• Many other states are using EOC tests in Civics, History, Government, etc. • EOC tests have gained favor over the years as they are used to assess the specific content stu-dents have learned in their classes. Most students are motivated to do well on EOC tests as their exam scores are used to determine final course grades. In addition, some states use passage of EOC tests as part of a student’s graduation requirement.

West Virginia Comprehensive Analysis of Summative Assessments (CASA)16
West Virginia Peer States AnalysisThe key factors selected to determine peer states were student population of between 200,000 and
400,000, a mix of urban and rural districts (>50% rural), and/or proximity to West Virginia. When these criteria were applied to the analysis, Hawaii, Idaho, Kentucky, Maine, Nebraska, Nevada, New Hampshire, and New Mexico emerged as peer states.
Not all states meet all the criteria but it was felt that this list provided a useful group of states for com-parison purposes. The table on page 17 provides summary information on the peer states’ assessment systems. The information is presented in the framework of some of the key criteria developed to evaluate assessments previously discussed in this report. Note the use of college entrance exams either in place of or in addition to the grade 11 standards-based assessment in several peer states. This is a trend that we have been seeing in several states — replacing the consortium assessment used in high school with either the ACT or SAT. In the table, Maine and New Hampshire made this change in 2015-16. Maine also moved away from the SBAC assessment at grades 3-8. Kentucky is planning to move away from the ACT Quality Core tests at high school to a different test in 2017-18.
The data show the diversity of assessment approaches West Virginia peer states are employing to meet their assessment needs. Five states test at least grades 3-8 using a consortium assessment while three use either a custom-developed test or an off-the-shelf test that is augmented with custom state content. Most states supplement the grade 3-8 standards-based assessment with other assessments such as end-of-course tests or CEE exams. Finally, most SBAC states take advantage of the interim assessments and Digital Library of formative tools available from SBAC with the additional membership fee.

www.EducationAlliance.org 17
Analysis
Source: ASG 2016-17 State Assessment Survey
West Virginia Peer States Assessment Program SummaryCONTENT MEASURES STRUCTURE REPORTING
State/Key Criteria
State Standards
Other Content
College Readiness Test Length
Multiple Item Types
CBT & PPT Options
Score Turnaround
Time Comments
West Virginia
SBAC for ELA and Math
Grades 3-8, 11
SBAC for Interim and Formative
ACT WorkKeys 6 - 9 hours MC, CR, ECR, TEI CBT
3 weeks for scores; ISRs
in August
HawaiiSBAC for ELA
and Math Grades 3-8
EOC tests in High School;
SBAC for Interim and Formative
ACT for Grade 11 ; Aspire optional for grades 9-10
6 - 9 hours MC, CR, ECR, TEI CBT 2 - 3 weeks
Idaho SBAC for Grades 3-8
SBAC for Interim and Formative
SAT or Accu-placer 6 - 9 hours MC, CR,
ECR, TEI CBT 2 - 3 weeksReading indicator
test for grades K-3.
Kentucky
Custom test based on CCSS with NRT
component Grades 3-8
EOCs for HS ACT for Grade 11 WorkKeys
4+ hours with Writing
MC, CR, ECR PPT 10-11 Weeks
Phasing out ACT tests. Kentucky has a history of
utilizing a rich as-sessment system.
Maine
eMPower with Aug-
mentation Grades 3-8
SAT for Grade 11 6 - 7 hours
MC, CR, Writing Prompt
CBTTBD - Stan-dard Setting in 2015-16
Maine uses a sep-arate vendor for
reporting to maxi-mize the utility of the assessment
information.
NebraskaCustom test for grades
3-8, 11
Item bank for formative assessment
State test 60 - 90 min-utes
MC, TEI and text based
analysis
PPT and CBT
Preliminary results in 1 month; final results in 3
months
Teachers develop some test items.
Nevada SBAC for Grades 3-8
EOC tests in High School
ACT for Grade 11 6 - 9 hours MC, CR,
ECR, TEI CBT TBD - New Vendor
EOCs in HS are a graduation requirement.
New Hampshire
SBAC for ELA and Math
SBAC for Interim and Formative
SAT for Grade 11 6 - 9 hours MC, CR,
ECR, TEI CBT 3 Months
New Mexico
PARCC for ELA and
Math Grades 3-11
PARCC assess-ment includes EOCs in High
School
PSAT for Grade 10 8 - 10 hours MC, CR,
PT, TEI CBT 6 - 8 weeks
State has devel-oped many EOCs. Interim assess-ment system for
grades K-2.

West Virginia Comprehensive Analysis of Summative Assessments (CASA)18
Identifying the National Assessments for AnalysisTo give the reader a sense of some of the different summative and college- and career-readiness (CCR)
assessment products in the marketplace, we present information on six major national tests states are currently using to fulfill accountability requirements under ESSA. Two assessments are college entrance exams (ACT and SAT), two are assessment systems1 (PARCC and SBAC) developed by consortia of states based on College Ready/Common Core State Standards, and two are assessment systems1 developed by test vendors with reporting scales that are tied to college entrance examination tests (ACT Aspire, devel-oped by ACT/Pearson, tied to the ACT College Ready standards; and eMPower, developed by Measured Progress, tied to the SAT College Ready/Common Core State Standards). There are other tests available in the market as well but these six provide a good feel for the types and nature of tests available and are among the more obvious choices for West Virginia to consider along with custom designing its own assessment system.
On the following pages, this report provides a summary of each of the six assessments and thoughts about how they relate to the West Virginia key assessment criteria. Additional detailed information on the structure and content of each assessment is provided in Appendix H. Note that all factual information on each of the six assessments was obtained from the company websites and, in some cases, follow-up information requests from company representatives. The final write-ups were shared with each company to ensure accuracy.
It is also worth mentioning that ACT, SAT, PARCC, and SBAC assessments have a significant amount of test support, training, teacher professional development, and student tutoring aids available. This report does not delve into this additional information, but is focused primarily on the specific characteristics of the summative assessments.
Overview of Six Major National Assessments and Key Criteria1. The SAT
Overview/ContentFounded in 1900, The College Board was created to expand access to higher education. Today, the
membership association is made up of over 6,000 of the world’s educational institutions and is dedicated to promoting excellence and equity in education. The SAT was the first widely used college entrance exam and was taken by 1.7 million students in the 2016 class. The College Board publishes many other tests including the Advanced Placement Exams (AP tests), SAT subject area exams, the PSAT 10, and PSAT 8/9.
In the past few years, the College Board decided to redesign its suite of assessments to tie the exams to both college readiness and the Common Core State Standards, and turn the SAT into an achievement test rather than an aptitude test. The new SAT assessments were offered for the first time in 2016 in grades 8/9-11. A full alignment study of the SAT has not yet been completed. Two Common Core states, Delaware and Connecticut, and one state with standards almost identical to the Common Core, Maine, have com-missioned independent alignment studies of the SAT and their state standards. We expect these studies will become publicly available soon after completion (likely in early 2017).
The College Board/SAT has partnered with Measured Progress (MP) to align the reporting scale of the SAT with that of MP’s eMPower grades 3-8 assessment system and provide a reporting link across all grades. This would allow a state to measure student growth from year to year, as well as a student’s readi-ness for college.
StructureThe SAT consists of exams in reading, writing and language, mathematics, and an optional essay. The
test is administered in a single day (the SAT is currently administered only in paper and pencil mode), either during a school day or on a Saturday. The test takes 3 hours without the essay portion and an addi-tional 50 minutes if the student takes the optional essay exam.
1 In this case, assessment system refers to a suite of exams that are reported on the same scale and administered in grades 3-8 and potentially high school.

www.EducationAlliance.org 19
Analysis
The table below provides information on the structure of the SAT, its tests, item types, administration mode, and other information of interest to West Virginia stakeholders.
Note — subscores provide additional information on student performance within the subject area. For example, the SAT reading and writing subscores consist of Expression of Ideas, Standard English Conven-tions, Words in Context, and Command of Evidence. The subscores are used to highlight the student’s strengths in these areas and give colleges information related to the skills and knowledge needed for college and career.
AccommodationsThe accommodations policy for the SAT tends to be somewhat different from that of most states. Many
in the testing industry have complained that there are not enough test supports available for students requiring them, especially accommodations that permit reporting of scores to colleges. A complaint has been filed with the Office of Civil Rights. Current computer-delivered summative assessments tend to have far greater built-in supports than are available to students taking the SAT.
The College Board announced in December 2016 that it is revising its accommodations policy and will allow English language learners and students with disabilities to use the same accommodations on the SAT as they use for their state tests, provided the accommodation is noted in the student’s IEP or other system. The College Board will also include a word for word glossary and translated instructions in several foreign languages. It will be important to see how this new policy works in practice.
ReportingSAT scores are generally available about 30 days after the date of testing. Scores are sent to colleges
and students within a day of each other. High school administrators will receive scores a bit before col-leges or students.
Since scores on the SAT are a key determinant in students gaining admission to the college of their choice, students considering college are highly motivated to perform well on the exam. To this end, a significant amount of student preparatory materials and coaching are available. Many have complained that students from higher socioeconomic backgrounds are advantaged by “pay for” test prep. In response to this, the College Board formed a partnership with Khan Academy to provide free SAT test preparation for students. Such free test preparation is available to any student who registers and who takes any of the College Board tests (e.g., the PSAT or SAT).
The SAT provides total scores, section scores, and seven subscores (+2 shared cross scores). If the stu-dent took an essay, skill-level scores are provided. Score information includes a variety of features, such as norming groups, CCR benchmarks, and percentiles. The College Board provides users, such as parents and students, with interpretation guides. It also provides additional support, for free, to help students prepare for the test and identify areas of weakness.
Subject Area # of Questions Time Required Subscores Item Types
Reading52 MC
2 short, 3 long passages
65 minutes 2 +2 shared Passages, MC
Writing and Lan-guage
444 passages
35 minutes 2 +2 shared Passages, MC
Mathematics 45 MC, 13 CR 80 minutes 3 MC, CR
Essay (optional) 1 50 minutes 3- each scored on a 1-4 scale Essay
Administration Mode: Paper and Pencil with Computerized version being tested in March 2017Partners: ETS for co-development and administration
West Virginia Comprehensive Analysis of Summative Assessments (CASA)20
Test QualityThe SAT has a long-established history of quality. Best practices in test development, scoring, and
reporting have been in existence for the SAT for many decades. Both the College Board and ETS (its test vendor) have very experienced professional staff assigned to the SAT and use quality procedures. The psy-chometrics used for the SAT are strong, with many steps taken to ensure the validity and reliability of the SAT. Tests are thoroughly evaluated for bias, sensitivity, measurement requirements, score comparability, and accuracy of results. In addition, the SAT is one of the most researched assessments in existence.
The new SAT has suffered some recent criticism that alleges some of the longer mathematics passages place too great an emphasis on reading skills and therefore penalize English learners. The College Board has responded that it will investigate this allegation and make changes to test questions in the future, if necessary.
2. The ACT
Overview/ContentThe ACT is the leading college admissions test in the United States today with more than 2.1 million
students taking the exam in 2016. ACT test scores are accepted by all four-year U.S. colleges and universi-ties. The ACT is an achievement test; questions are directly related to what students have learned in high school courses.
The ACT is written to the ACT College and Career Readiness standards. These standards are based on a comprehensive survey conducted periodically by ACT to determine what content is typically taught to high school students across the country and then developing College and Career Ready (CCR) standards based on desired achievement in the content areas. While these standards are similar to the Common Core State Standards, they are not identical. Thus, states may find that the alignment of the ACT to their stan-dards is not perfect. In the past, some states have chosen to augment the ACT with their own test items to get a better alignment with their state standards.
ACT developed ACT Aspire, an assessment system for grades 3 to early high school. ACT Aspire, LLC was formed by ACT and its partner, Pearson, to deliver ACT Aspire. ACT Aspire has aligned its reporting scale to that of the ACT and using both assessments provides a reporting link across all grades. This would allow a state to measure student growth from year to year, as well as a student’s readiness for college.
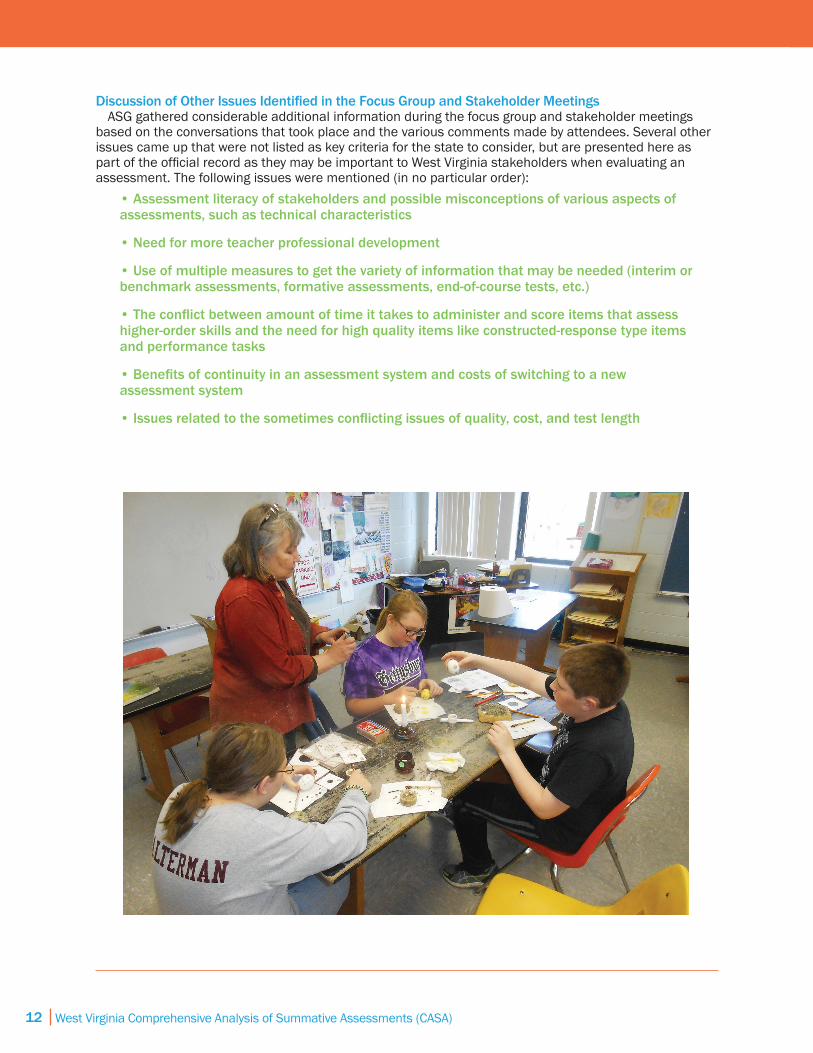
StructureThe ACT consists of exams in English, reading, mathematics, and science, with an optional writing
assessment. The test is administered both via paper and pencil and more recently computer, although most students still take the exam in paper and pencil mode. The test takes 2 hours and 45 minutes to complete and another 40 minutes if the writing exam is administered.
The table below provides information on the structure of the ACT, its tests, item types, administration mode, and other information of interest to West Virginia stakeholders.
Subject Area # of Questions Time Required Subscores Item TypesEnglish 75 45 minutes 3 MC (5 Passages)Reading 40 35 minutes 3 MC (3 Passages)
Mathematics 60 60 minutes 8 MCScience 40 35 minutes 3 MC
Essay (optional) 1 40 minutes 4 Essay
Administration Mode: Both Paper and Pencil and Computer Based Testing available.Partners: Pearson for administration and scoring.

www.EducationAlliance.org 21
Analysis
AccommodationsThe accommodations policy for the ACT tends to be different from that of most states and in the past,
many in the industry have complained that there are not enough test supports available for students re-quiring them. As is the case with the College Board/SAT, a complaint has also been filed with the Office of Civil Rights. Current computer delivered summative assessments tend to have far greater built in supports than are available to students taking the ACT.
ACT has started to take steps to address the accommodations issue and recently announced (Novem-ber 2016) that it will offer its first accommodations that result in college-reportable scores for English language learners. The accommodations include more time to take the test (up to time-and-a-half), use of an approved word-to-word bilingual glossary, testing in a non-distracting environment, and providing test instructions in the student’s native language.
ReportingTest scores are viewable online about 2 weeks after the test date. For students taking the writing part of
the test, essay scores are released in 5-8 weeks. Since scores on the ACT are a key determinant in students gaining admission to the college of their
choice, students are highly motivated to perform well on the exam. To this end, a significant amount of student preparatory materials and coaching are available. ACT provides some free test preparation resources including a test prep booklet that includes a full length practice test and test taking strategies. Other test preparation resources are offered at a fee, with some free for low-income students.
The ACT provides a Total Composite score and total scores in each of the four content areas. The score range for the individual tests and composite score is 1-36. If the student took the optional writing test, the student will receive a 2-12 writing score and four writing domain scores. All scores are accompanied by U.S. and state ranks. ACT also provides college readiness benchmarks so students are able to gauge their readiness for first-year college courses. Reporting categories are also presented for each subject test. Although the score reports are detailed, they should be fairly easy for students and parents to read and understand. ACT provides a variety of information on its website to assist users in interpreting the score reports. With the focus of the reports on measuring a student’s college or career readiness, the data have a great deal of utility and usability.
Test QualityACT invests significant resources in the quality of its flagship assessment. ACT staff have considerable
experience in test development, scoring, and reporting, and the processes used for the test are viewed as professionally sound. The ACT has been shown to be valid and reliable. ACT has conducted numerous va-lidity studies over the years, primarily focusing on the test’s ability to predict college performance. The ACT meets most requirements for quality assessments, except possibly for use of a variety of different item types, its alignment to CCSS or some state standards, and accommodations offered (noted above).
3. PARCC
Overview/ContentThe Partnership for Assessment of Readiness for College and Careers (PARCC) assessment was created
by a consortium of states under a $185 million 2010 U.S. Department of Education grant. The purpose of the exam is to assess student mastery of the Common Core State Standards and determine if students are on track to be college and career ready. The consortium organization developed new item types to measure the breadth of the common core standards and the assessment has received high marks for its technical quality. Old state tests tended to measure only lower-level skills while the PARCC assessment measures both lower- and higher-level skills.
The PARCC assessment is made up of two categories of tools:• Annual year-end tests in English language arts/literacy, and mathematics tests in grades 3-8 and high school (grades 9-11). High school tests are essentially end-of-course exams.• Instructional tools that teachers may use at their discretion during the school year, including formative tasks for grades K-2 and high school, diagnostic tools, speaking and listening tools, and performance-based modules.

West Virginia Comprehensive Analysis of Summative Assessments (CASA)22
The PARCC assessment system has two tracks for mathematics in high school, end-of-course tests in Algebra I, Geometry, and Algebra II for track one and Integrated Math I, II, and III for track two. The PARCC tests use the same scale to report results for all their tests. PARCC reports growth using student growth percentiles.
The consortium and member states are working with universities and colleges to gain acceptance of PARCC scores for placement into college-level coursework. Many institutions of higher learning accept PARCC scores for these purposes.
The consortium management entity consists of over 25 individuals that keep current on test develop-ment issues, high quality item types, and other assessment issues in order to develop new versions of the test and keep it up to date.
StructureThe PARCC assessments in mathematics and ELA are fixed-form assessments delivered primarily via
computer (90% in 2015-2016 versus 10% paper and pencil). Fixed-form assessments mean that all stu-dents take the same exam versus computer adaptive testing (CAT) where students see different test items depending on whether they have answered previous test questions correctly or not.
The table below provides information on the structure of the PARCC assessment, its tests, item types, administration mode, and other information of interest to West Virginia stakeholders.
The PARCC management structure will undergo changes beginning in 2018-19. The consortium will move to a content licensing model and each state will have the freedom to procure the content it desires and have control over the administration of the test in the state. Participating states will make agree-ments with both the content licensing entity and test vendor to administer the assessment. It is also likely that test vendors, on behalf of states, will negotiate content agreements with the licensing entity.
As of December 2016, participating states pay a $1 per student fee to the management organization.
AccommodationsThe consortium has worked with its test delivery vendor, Pearson, to make sure that numerous test
supports are provided, within the platform, for students needing accommodations to take the exam. The PARCC tests are compatible with the APIP standard and can make use of a student personal needs profile (an online record of the test supports required for each student).
For more information on PARCC accommodations and to download the PARCC accommodations manual go to http://www.parcconline.org/assessments/accessibility/manual
ReportingResults for PARCC take a while to be returned. Some of this is due to the “newness” of the test. In 2014-
2015, states had to complete the standard-setting process (determining levels of achievement for student scores reported on the PARCC scale) before results could be released. For the 2015-2016 school year, the PARCC website noted that results were currently being returned to schools on October 13. For 2017
Subject Area # of Questions Time Required Subscores Item Types
ELA Literacy26-34 TECR/MC*
3 Essay270 minutes G3-5
300 minutes G6-11Passages, MC
TECR***, Essay
Mathematics23-29 MC*, 4 CR
6-7 TEI, 3-4 Problems240 minutes G3-8
270 minutes G9-11MC, CR, TEI,**
Problems
* grade dependent *** technology enhanced constructed response** technology enhanced item
Administration Mode: primarily computer based testing (90%) with paper and pencil available if needed.Partners: Pearson for administration.

www.EducationAlliance.org 23
Analysis
reporting, PARCC plans to begin returning individual student results to districts in 3 weeks.Different PARCC states use the exam in different ways. In some states the exam is low stakes. However,
Maryland, New Jersey and New Mexico have recently, or will soon begin, to use the results for making high school graduation determinations. Additionally, in future years, to the extent that the consortium contin-ues to be successful in getting colleges and universities to accept PARCC scores for course placement (and perhaps admission), test results could become more meaningful for students. PARCC test results can be compared across those states using the exam, within a state, and across years.
Student scale scores fall into one of five categories of performance, which are called achievement lev-els. Students performing at Levels 4 and 5 are considered on track to demonstrating the knowledge and skills necessary for college and career readiness.
The PARCC website shows examples of a variety of score reports that provide PARCC results to students and parents. The reports contain a lot of detail on student performance, including performance levels; scaled scores; school, district, and state averages for comparison purposes; and information based on to-tal scores that show if the student meets expectations. However, data are not provided for subscores that can be used for additional diagnostic or instructional purposes. Parent Guides are provided by PARCC to help interpret score reports. The score reports are easy to interpret and provide much useful information. The level of detail is at a fairly high level and focuses primarily on student performance related to college and career readiness.
Test Quality PARCC is viewed by experts in the field as a high-quality assessment. It is one of the new next-gener-
ation tests designed to assess the Common Core State Standards and uses innovative approaches and item types to measure the standards. The psychometric procedures used with PARCC are technically sound. The test provides comparable data across states, districts, and schools. Independent evaluations of PARCC have found it to be one of the higher quality assessments available to states. Its coverage of ELA and mathematics content is comprehensive. Initial studies of its reliability and validity have been positive,

West Virginia Comprehensive Analysis of Summative Assessments (CASA)24
although more research is needed in this area. One complaint is that PARCC is a very long test, which has received much negative feedback from schools and districts.
4. SBAC
Overview/ContentThe SBAC exam was developed by a consortium of states under a $175 million grant from the U.S.
Department of Education, also in 2010. The purpose of the exam is to assess student mastery of the Common Core State Standards and determine if students are on track to be college and career ready. Similar to PARCC, the SBAC assessment is meant to assess a broad range of student abilities and also student critical-thinking skills. Similar to the PARCC assessment, the SBAC test has received high marks for quality.
The consortium and member states are working with universities and colleges to gain acceptance of SBAC scores for college admission and placement into college-level coursework. Over 220 universities and colleges have agreed to use results of the high school summative assessments as evidence of stu-dent readiness for entry-level, credit-bearing courses.
The consortium management entity is a public agency with over 30 individuals that keep up to date on test development issues, high quality item types and other assessment issues in order to develop new versions of the test and keep it current.
StructureThe SBAC assessment system is composed of year-end assessments in ELA and mathematics, optional
interim assessments, and a Digital Library of formative tools. The Digital Library is an online collection of high-quality instructional and professional learning resources contributed by educators for educators. These resources are aligned with the intent of the CCSS and help educators implement the formative assessment process to improve teaching and learning.
The SBAC summative assessment is a computer adaptive test (CAT) delivered almost entirely online. CAT assessments adjust the items a student sees on the test based on whether the student has an-swered previous items correctly or incorrectly. Since the same scale is used to present results, students answering questions of differing difficulty can still be placed on the same scale. Typically, CAT tests can measure a student’s ability in less time than a fixed form test, and a CAT does a better job of determining how students at the far ends of the scale (both high and low) are performing.
The SBAC assessment is delivered in two sections, the CAT portion (comprised mostly of machine-scored items) and the performance task portion (comprised mostly of human-scored items).
The table below provides information on the structure of the SBAC assessment, its tests, item types, administration mode, and other information of interest to West Virginia stakeholders.
Subject Area # of Questions Time Required Subscores Item Types
ELA Literacy38-42 MC*
2-3 CR, 1 Essay210 minutes G3-8240 minutes G11
47-9 Passages, MC
CR, Essay
Mathematics31-34 MC*
1 PT (4-6 items)
120 minutes G3-5180 minutes G6-8210 minutes G11
4MC, CR, TEI**
Problem
* grade dependent ** technology enhanced item
Administration Mode: primarily computer based testing (99%) with paper and pencil available if needed.Partners: States acquire content from SBAC and select their own vendors to administer the assessment. Note that the assessment is an untimed test and students may finish at their own pace. The time requirements in the table are published by SBAC and meant to serve as guidance for consortium members.

www.EducationAlliance.org 25
Analysis
AccommodationsSimilar to the PARCC assessment, the SBAC exam provides numerous test supports within the test
delivery system for students requiring them. Additionally, SBAC’s language supports are particularly strong providing the actual exam, instructions, and a glossary of terms in 10 foreign languages. SBAC provides a paper and pencil test option (as part of the $6.20 per student membership fee) although no state uses this option to test a major portion of its student population. Students requiring a paper test accommoda-tion may receive the paper version of the SBAC assessment based on the local schools’ determination.
For more information on SBAC’s list of accommodations and accommodations policies go to https://portal.smarterbalanced.org/library/en/usability-accessibility-and-accommodations-guidelines.pdf
ReportingAgain, similar to PARCC, the release of test results for the 2014-2015 was delayed as member states
had to complete the standard-setting process to identify the scale and the various proficiency levels. Test results came back much faster for the 2015-2016 testing year, 3 weeks in many cases, although a few states reported significant delays in receiving reports.
Student scale scores fall into one of four categories of performance called achievement levels. SBAC re-ports scores on four achievement levels, with levels 3 and 4 being considered on track to demonstrating the knowledge and skills necessary for college and career readiness. SBAC also provides student perfor-mance results on a vertical scale to better view progress toward college and career readiness.
The SBAC exam tends to be low stakes (generally a passing grade is not required for advancement or acceptance to college or university). For many students, the results do not have much meaning, especially high schoolers. However, in future years, to the extent that the consortium continues to be successful in getting colleges and universities to accept SBAC scores for admission and course placement, test results could become more meaningful for high school students. SBAC test results can be compared across those states using the exam, within a state, and across years.
Score reports for SBAC are issued by each state’s test vendor. Although they may have some variation, typically the score reports include an overall scaled score, a standard error of measurement, and perfor-mance level results. Vertical scale information and a choice of growth measures are also available report-ing options. At grade 11, a focus of the reports is on college readiness for attending schools in the state. For example, in California the score reports include these results along with data by reporting subcate-gory or skill level (4 for ELA and 3 for Mathematics) and whether these subscores met proficiency-level standards. No detailed subscore data are provided except whether the student is above, at, or below the standard on 4 skill areas in ELA and 3 in math. Some users are unhappy that SBAC does not provide more detailed information in its reports. Overall, the score reports are readable and their usability sufficient for parents and students to understand.
Test Quality SBAC assessments have been rated as having high quality in their technical characteristics, content cov-
ered, and the test administration procedures (i.e., use of a CAT). Best practice procedures were used in the design, development, and field testing of SBAC test items, as well as in the psychometric procedures used to calibrate the test items and create scaled scores. The test exhibits adequate validity and reliabil-ity, but its validity needs to be studied more. The test was evaluated as having strong technical quality in the independent studies conducted in 2015-16 by Fordham and HumRRO.
5. Measured Progress — eMPower
Overview/ContentThe eMPower assessment program, developed by non-profit Measured Progress, consists of tests in
mathematics and ELA for grades 3-8. The assessments are based on a combination of college-ready stan-dards and the Common Core State Standards, and were developed in response to concerns around the length of the tests of the two main consortia test providers (PARCC and SBAC). The idea behind eMPower was to develop a higher quality test, using newly developed items and item types, that can be used to determine student achievement in about half the time as the two consortium-based exams.
eMPower is aligned with the SAT suite of assessments including PSAT 8/9, PSAT 10 and SAT. Since the

West Virginia Comprehensive Analysis of Summative Assessments (CASA)26
score scale is linked to the score scale of the SAT suite of tests (200-1600 reporting scale), eMPower provides a predictive link to a student’s score on the SAT.
eMPower Assessments are made up of all new items developed to assess college- and career-readiness standards including the CCSS. Items are based on the same college readiness research at the foundation of the SAT suite of assessments.
The eMPower Assessments have vertical scales for each subject area. Educators can assess growth over time within a grade and from one year to the next. During the year, the scale scores show progress to-ward end-of-year performance expectations. The vertical scale allows for measurement of growth related to the college- and career-readiness standards from grades 3-8. At grade 8, eMPower assessment scales are linked to College Board’s PSAT/SAT scale and score reports provide eMPower scaled scores and ac-cess to comparable scaled scores from the PSAT/SAT scale.
Measured Progress has not commissioned any independent alignment studies between eMPower and the Common Core State Standards; however, Maine is using the eMPower assessment for its state ac-countability test and will be commissioning an alignment study to its standards in the near future.
StructureThe eMPower assessment system consists of three testing opportunities in ELA and mathematics each
year, including a spring summative test. The system of assessments provides opportunities to measure growth throughout the year and year-to-year.
eMPower is offered in three different structures, all delivered either online or pencil and paper:•eMPower Assessments (machine scored MC, EBSR and MS items only)
•eMPower Plus Assessments (adds constructed-response items and writing prompts)
•eMPower Augmented Assessments (adds state-specific content)
Each eMPower Assessment is divided into two sessions. The table below provides information on the structure of the eMPower+ assessment, its tests, item
types, administration mode, and other information of interest to West Virginia stakeholders.
Subject Area # of Questions Time Required Subscores Item Types
Reading (Grades 3-8)
24 MC, 4 EBSR5CR
100 minutes 4 Passage, CR, MC/MS
Writing & Language
31 MC, 4 EBSR, 1 Essay
90 minutes 3 MC, EBSR, Essay
MathematicsGrades 3-5Grades 6-8
41-46 MC, 5 CR44-48 MC, 5 CR
90 minutes90 minutes
79
MC/MS, CRMC/MS, CR
EBSR = evidence-based selected response MS = multi-selectNote CRs add 20 minutes of testing time to eMPower reading and 30 minutes to eMPower math
Administration Mode: Computer based and pencil and paper available.Partners: College Board for linking scores to the SAT suite of assessments.
www.EducationAlliance.org 27
Analysis
AccommodationsThe online version of eMPower offers a number of test supports to students requiring accommodations.
These include magnification, text-to-speech, reverse contrast, alternative text and background covers, answer masking, line reader tool, and a feature to turn off all universal tools. eMPower paper and pencil based accommodations include large print, Braille, and mathematics translated forms in Spanish. In addi-tion, print materials are accessible to students through text-to-speech accommodation through the online testing platform.
ReportingMeasured Progress reports two primary scores for each content area assessment: an overall scale
score on the growth scale for each subject area and grade level-specific performance benchmarks indi-cating whether students are making progress toward academic readiness for success in high school and beyond. Total scores for reading, writing and language, and mathematics are reported as scaled scores on the vertical scales.
Measured Progress will set expectations for four performance levels (well below, approaching, meeting, or exceeding the grade-level college and career content standards) for the eMPower suite of assessments. In addition, Measured Progress will take advantage of the psychometric and content links between the eMPower scales and the PSAT/SAT scales to make sure that the proficient performance levels for the 8th grade eMPower reading, writing and language, and mathematics scales are comparable to the college and career readiness performance expectations on the PSAT scales.
eMPower reports can be turned around in a few weeks. Reports for eMPower Plus take another week or two to be returned due to the human scoring of the constructed-response items.
eMPower, similar to other grade 3-8 assessments, is a low-stakes test. Therefore, student motivation is a concern. However, students on the college track may be very interested in seeing how their scores align with the SAT college scale.

West Virginia Comprehensive Analysis of Summative Assessments (CASA)28
Score reports for eMPower are in the process of being designed. Measured Progress is convening focus groups to provide input on the design of the report. Static reports will be available for individual students, school summaries, and district summaries. Results will be reported on a vertical scale. Four performance levels will be reported. For each test, an overall scaled score, and a grade-level specific performance level will be reported. A draft mockup of an individual student report was provided by the vendor; it looks clear and readable for students and parents.
Test QualityBased on the amount of information provided to date for eMPower, the overall quality of the assessment
appears to be adequate, primarily because it is based on the SAT, which is viewed as a high quality test. In addition, Measured Progress is known to deliver quality in its state assessment services, so this test should meet most expectations for technical and psychometric quality. However, more evidence is needed to confirm the quality of eMPower, possibly from the peer review of Maine’s new assessment program.
ACT AspireOverview/Content
ACT Aspire is a longitudinal, vertically scaled, college- and career-readiness assessment system that connects student growth from the elementary grades through early high school (3-9/10). This vertically aligned system of summative and periodic assessments is built upon the same psychometric and re-search foundations as ACT Explore, ACT Plan, and the ACT® test and is anchored to the scoring system of the ACT and aligned with the ACT College Ready Standards. Student outcomes are aligned to the Do-main and Cluster reporting cate-gories of the Common Core State Standards and the exam has the capability of predicting outcomes on the ACT.
While the ACT College Ready Standards are similar to the Com-mon Core State Standards, they are not identical and some states have expressed concern over align-ment issues.
ACT Aspire provides an alter-native to the PARCC and SBAC assessment systems and offers as-sessments in summative, interim, and classroom formats. Reporting categories are also aligned to the CCSS. ACT Aspire is a joint venture between ACT and Pearson.
In 2015-16, ACT Explore and Plan were replaced by ACT Aspire. Using Aspire for the lower grades and the ACT for grade 11 allows a state to measure both college readiness and student growth.
StructureACT Aspire consists of assessments in summative, interim, and classroom formats with content areas
of English, mathematics, reading, science, and writing for grades 3-8 and early high school (grades 9-10).

www.EducationAlliance.org 29
Analysis
The assessment system makes use of multiple item types, including multiple choice, constructed re-sponse, and technology-enhanced items (TEI). ACT Aspire can be administered both online and via paper and pencil.
The table below provides information on the structure of ACT Aspire, its tests, item types, administration mode, and other information of interest to West Virginia stakeholders.
AccommodationsSimilar to other tests built using online test delivery systems, ACT Aspire can link to a student’s personal
needs profile and supports a number of accommodations including:• Conformance with the Accessible Portable Item Protocol (APIP) Standards
• Audio supports, such as text-to-speech and verbal descriptions of graphics
• Second-language supports, including Spanish translations of tests and support materials
• Visual supports, such as various color contrast settings, screen magnification, and line readers
• Motor supports, such as navigational aids and (for some components) speech-to-text
• Cognitive and engagement supports, such as answer masking
• American Sign Language (ASL)
• Braille and tactile graphics
• Large type paper-and-pencil
Subject Area # of Questions Time Required Subscores Item Types
English G3-821-35 MC; 2-4 TEI
6-12 FT40-45 minutes 3 MC, TEI
English early HS48-50 MC; 0-2 TEI
9-10 FT45 minutes 3 MC, TEI
Reading18-21 MC, 0-3 TEI
3 CR, 5-8 FT65 minutes 4 MC, TEI, CR
Writing 1 Essay 30 minutes 4 Essay
Mathematics G3-7
17-25 MC, 1-7 TEI4 CR, 3-9 FT
65-75 minutes* up to 8* MC, TEI, CR
Math G8-Early HS29-30 MC, 3-4 TEI
5 CR, 5-8 FT75 minutes up to 8* MC, TEI, CR
Science22-30 MC, 3-4 TEI
5-6 CR, 5-8 FT60 minutes 3 MC, TEI, CR
* grade dependentFT= Field Test items
Administration Mode: Computer based and pencil and paper available.Partners: Pearson for administration. Aspire is a joint venture of Pearson and ACT.

West Virginia Comprehensive Analysis of Summative Assessments (CASA)30
ReportingACT Aspire reports are available 45 days after all testing materials have been returned to the company.
ACT Aspire is a low-stakes test so students may not be as motivated to perform as they would for a col-lege entrance or end-of-course exam. However, given that the ACT Aspire score scale is linked to the ACT college readiness assessment scale, students in high school grades may have more incentive to do their best in order to gain a preliminary determination of how they might score on the actual ACT. ACT Aspire results can be compared against years, districts, or states. However, not many states use Aspire statewide (Alabama and Arkansas Grades 3-8, 10; Wyoming and Wisconsin Grades 9-10 and Hawaii Grades 8-10 optional) so states may have to compare results against independent school districts that use the assess-ment.
On the ACT Aspire website, a useful document is available to users to help them better understand the test results. It is provided by ACT. This document is valuable to parents and students to learn more about what the scores mean, how to interpret benchmarks, and for getting more details from the skill scores that are reported. Information is also provided to students and their parents on preparing for high school, college, and beyond. A section of the document specifically addresses college readiness and improvement ideas. This document can aid users tremendously in making the ACT Aspire scores more understandable.
Test Quality The overall quality of the ACT Aspire appears to be strong, since it is based on the foundations of the
ACT, which is a high quality test. Both ACT and Pearson use test development and psychometric process-es that are viewed as best practices in the industry. However, there is some concern in states that the test does not align fully with Common Core State Standards or state standards. Not much information has been provided to determine the amount of alignment there is. In addition, ACT Aspire is supposed to provide information on college readiness for students in lower grades, such as 3-8, but this has not been validated by independent studies. More validity evidence is needed in this area. ACT has created a web-based tool that enables educators to map ACT Aspire reporting categories to the CCSS. ACT has also developed alignment documents to the CCSS and other sets of state standards. These documents are available to states upon request.
Analysis Based on West Virginia Key CriteriaWhat should the West Virginia state assessment look like? What are the key criteria decision makers
should use in evaluating the different assessment options? As noted in the previous chapter, stakeholder feedback was used to identify these assessment criteria. This section outlines the key assessment criteria of importance to West Virginians, provides information on various assessment options, and describes how these various assessment options line up against the West Virginia key assessment criteria. The criteria include
• Content qualities — measures state standards (alignment), measures student growth, measures college readiness
• Structure qualities — Test length; test questions both multiple choice and constructed response items; testing mode, i.e., online with paper option; and availability of Accommodations
• Results and Reporting Qualities — Short turnaround time for receipt of results; Parent/Student readability/usability of reports; the results have benefits/ramifications for students; and results can be compared across years, districts, or states
• Test Quality — Provides valid and reliable information and meets technical/psychometric standards (i.e., meets federal peer review requirements)
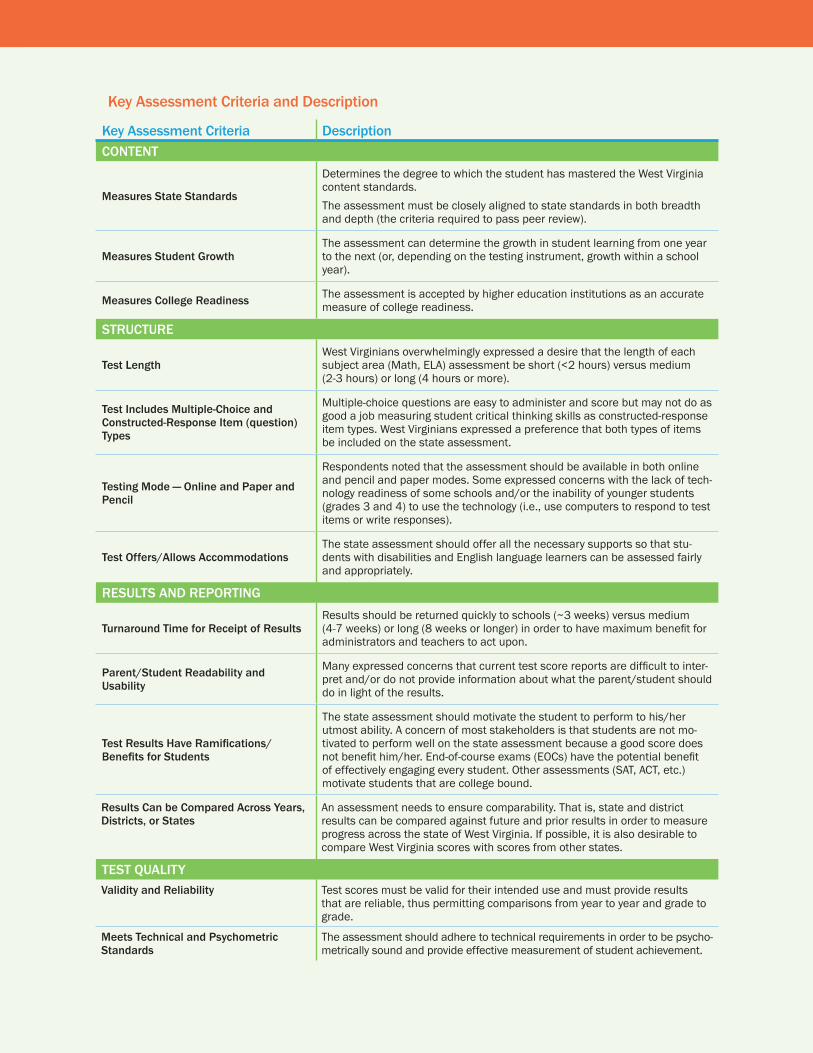
www.EducationAlliance.org 31
Key Assessment Criteria and Description
Key Assessment Criteria DescriptionCONTENT
Measures State Standards
Determines the degree to which the student has mastered the West Virginia content standards.The assessment must be closely aligned to state standards in both breadth and depth (the criteria required to pass peer review).
Measures Student GrowthThe assessment can determine the growth in student learning from one year to the next (or, depending on the testing instrument, growth within a school year).
Measures College Readiness The assessment is accepted by higher education institutions as an accurate measure of college readiness.
STRUCTURE
Test LengthWest Virginians overwhelmingly expressed a desire that the length of each subject area (Math, ELA) assessment be short (<2 hours) versus medium (2-3 hours) or long (4 hours or more).
Test Includes Multiple-Choice and Constructed-Response Item (question) Types
Multiple-choice questions are easy to administer and score but may not do as good a job measuring student critical thinking skills as constructed-response item types. West Virginians expressed a preference that both types of items be included on the state assessment.
Testing Mode — Online and Paper and Pencil
Respondents noted that the assessment should be available in both online and pencil and paper modes. Some expressed concerns with the lack of tech-nology readiness of some schools and/or the inability of younger students (grades 3 and 4) to use the technology (i.e., use computers to respond to test items or write responses).
Test Offers/Allows AccommodationsThe state assessment should offer all the necessary supports so that stu-dents with disabilities and English language learners can be assessed fairly and appropriately.
RESULTS AND REPORTING
Turnaround Time for Receipt of ResultsResults should be returned quickly to schools (~3 weeks) versus medium (4-7 weeks) or long (8 weeks or longer) in order to have maximum benefit for administrators and teachers to act upon.
Parent/Student Readability and Usability
Many expressed concerns that current test score reports are difficult to inter-pret and/or do not provide information about what the parent/student should do in light of the results.
Test Results Have Ramifications/Benefits for Students
The state assessment should motivate the student to perform to his/her utmost ability. A concern of most stakeholders is that students are not mo-tivated to perform well on the state assessment because a good score does not benefit him/her. End-of-course exams (EOCs) have the potential benefit of effectively engaging every student. Other assessments (SAT, ACT, etc.) motivate students that are college bound.
Results Can be Compared Across Years, Districts, or States
An assessment needs to ensure comparability. That is, state and district results can be compared against future and prior results in order to measure progress across the state of West Virginia. If possible, it is also desirable to compare West Virginia scores with scores from other states.
TEST QUALITYValidity and Reliability Test scores must be valid for their intended use and must provide results
that are reliable, thus permitting comparisons from year to year and grade to grade.
Meets Technical and Psychometric Standards
The assessment should adhere to technical requirements in order to be psycho-metrically sound and provide effective measurement of student achievement.

West Virginia Comprehensive Analysis of Summative Assessments (CASA)32
Test/Key Criteria SAT ACT PARCC SBAC eMPowerPlus AspireCONTENT
Measures State StandardsNote 1
Measures Student Growth * *
Measures College Readiness
STRUCTURE
Test Length (2 hr. per subject)Note 2
Offers Accommodations
Multiple Item TypesNote 3
Available on Paper and ComputerNote 4
RESULTS AND REPORTING
Score Turnaround Time
Report Readability/Usability
TBD
Test Will Motivate StudentsNote 7
Results Can Be Compared Across Years, Districts StatesNote 5
TEST QUALITYMeets Federal Peer Review RequirementsNote 6
TBD TBD
Meets Technical Standards for Quality
Detailed information on each of the six national assessments was presented in the previous section. The table below summarizes the information and presents the extent to which each assessment meets the West Virginia key assessment criteria. Note that the ratings shown are the opinion of the authors and have not been confirmed by any of the vendors for these assessments.

www.EducationAlliance.org 33
Analysis/Assessm
ent Ratings
Test/Key Criteria SAT ACT PARCC SBAC eMPowerPlus AspireCONTENT
Measures State StandardsNote 1
Measures Student Growth * *
Measures College Readiness
STRUCTURE
Test Length (2 hr. per subject)Note 2
Offers Accommodations
Multiple Item TypesNote 3
Available on Paper and ComputerNote 4
RESULTS AND REPORTING
Score Turnaround Time
Report Readability/Usability
TBD
Test Will Motivate StudentsNote 7
Results Can Be Compared Across Years, Districts StatesNote 5
TEST QUALITYMeets Federal Peer Review RequirementsNote 6
TBD TBD
Meets Technical Standards for Quality
Note 1 — SAT and eMPower are designed specifically to measure the CCSS; ACT and Aspire are designed to measure ACT college-ready standardsAlignment ratings are based on the base product offerings. PARCC and SBAC will supplement their assessments with up to 15% local/state content although no states have made this request. SAT and ACT will add local content as a separate testing module. When done, this can be an expensive process. *SAT and ACT are not designed to measure growth across years. However, if used in combination with an assessment system that aligns its scale to that of the SAT or ACT, a growth measure can be obtained. Additionally, growth can be measured for students taking the SAT or ACT multiple times during high school.Note 2 — eMPower requires a total testing time of 4 hours, 2.5 in ELA and 1.5 in mathematics. Aspire requires a total testing time of 3 hours 35 minutes, 2 hours 20 minutes in ELA and 1hour 15 minutes in mathematics. SBAC testing time totals 5.5 hours in the lower grades and 7.5 hours in the later grades (ELA 3.5-4 hours, Math 2-3.5 hours). PARCC testing time totals 8.5 hours in the lower grades and 9.5 hours in the later grades (ELA 4.5-5 hours, Math 4-4.5 hours). Note 3 — PARCC and SBAC include all item types (MC, CR, TEI, and PT). SAT and ACT include MC and CR. Basic eMPower includes machine scorable items only (MC, EBSR, and MS). Other item types are available for augmented versions of the assessment. Aspire includes MC, CR, and TEI.Note 4 — SBAC encourages computer-only assessments. There are issues with comparability between a CAT and fixed form exam. However, a fixed form of SBAC is available upon request. The SAT will have its first computer-based assessment trial during spring 2017.Note 5 — Comparability across states is based on the number of states using the assessment statewide. eMPower has one statewide user and Aspire has two. Aspire does have district users in many states which can be somewhat useful.Note 6 — SAT, ACT, PARCC and SBAC have all been certified for use in state accountability systems by USED so it is the opinion of the authors that these as-sessments are highly likely to pass peer review. ACT Aspire and eMPower have not yet been peer reviewed. Note 7 — SAT and ACT will motivate those students seeking entry to college or university. PARCC will motivate students if the EOC tests in high school are used to make grade and/or graduation decisions. eMPower and ACT Aspire may motivate high school students on the college track to get an early indicator of how their scores might predict performance on the SAT or ACT.
Fully Meets Mostly MeetsSomewhat
MeetsMinimally
Meets Does Not Meet
As can be seen in the table, some of the assessments are strong in some areas relative to the West Virginia key assessment criteria and not as strong in others. The PARCC and SBAC assessments are strong in content and test quality but are weak in test length and average in reporting. The SAT and ACT are strong in test quality, reporting, and student motivation but not as strong in accommodations, cost, and measuring student growth. The eMPower and ACT Aspire assessments generally satisfy the criteria necessary in a next-generation assess-ment without being overly strong or overly weak in terms of the West Virginia key assessment criteria. It is up to West Virginia policymakers to decide how to rate and rank each of the key criteria and these dif-ferent assessments.
LEGEND
West Virginia Comprehensive Analysis of Summative Assessments (CASA)34
Implications/Discussion of Key Criteria, Issues, and Themes as Related to Summative Assessments
In this section, we address the following questions. What are some of the key implications of the West Virginia key assessment criteria that policymakers will need to consider when selecting an assessment? What are the conflicts in the key criteria? How can they be resolved?
As mentioned earlier in this report, no one assessment can meet all of the various purposes of assessment or the needs of all users of assessments. For example, a summative assessment is, by its nature, a test of learning, rather than an assess-ment for learning. As such, a summative assessment is given towards the end of a school term in order to determine what a student has learned. At this point in the school year, it is usually too late to get score information returned in a timely enough fashion so it can be used to improve instruction and student learning in that term. Interim assessment and formative assessment practices are better instruments to use if the desire is to improve student learning within the term.
There are many other trade-offs and considerations implicit in the West Virginia key assessment criteria. As with all summative assessment, there are important trade-offs between assessment quality, assessment length (time to take the exam), and as-sessment cost. In general, higher quality assessments cost more and take more time to administer than lower quality assessments. This is because different item types and a sound, aligned assessment are required to fully assess West Virginia’s con-tent standards and student critical thinking capabilities. Constructed-response type items, where students provide evidence of their thinking abilities by producing short responses or writing essays, are generally human scored. Human scoring is more expensive than machine scoring of multiple-choice type questions. While machine scoring of essays (or artificial intelligence, AI, scoring) is improving, it is not appropri-ate for all types of written responses and is still more expensive than machine scoring of multiple-choice items.
West Virginians expressed a desire for a high-quality assessment, as well as the use of multiple item types in the assessment, but also expressed a strong desire for a relatively short (<2 hours) test. Policymakers will need to reconcile these conflicting elements in the key criteria when selecting an assessment. Using a single assess-ment to measure student mastery of state standards, student growth, and college readiness also implies a somewhat longer test be used in order to accurately make all these measurements. Meeting all of the key assessment criteria content specifica-tions implies some trade-off between assessment test length and quality.
Many West Virginia stakeholders expressed support for a multiple-measures approach to assessment, including the use of, perhaps, formative and interim/bench-mark assessment and/or end-of-course assessments. This approach presents the most holistic assessment system but will incur additional costs and assessment time involved in administering interim or end-of-course exams. Yet another element in the quality assessment equation is teacher professional development. The more instruc-tors know about the assessment process and how to best use the data derived from the assessment system (i.e., assessment literacy), the better able they will be to use that information to improve instruction and student learning. A strong professional learning program should be a part of an assessment system, but such a program has its costs.
In recent years, most states have moved to online assessment. Online assessment is generally less expensive than pencil and paper assessment but a state can pay more for its assessment system if signif-icant portions of the population are testing using both modes. Additionally, if districts do not have a high device-to-student ratio, online test windows need to be expanded and this can cause test security issues (e.g., increased potential for cheating) as well as impact classroom schedules and student learning. Some also worry that online testing can impact student results unfairly for those not used to using a computer or taking tests via computer. Policymakers will need to determine the best testing mode for West Virginia after consideration of these factors.

www.EducationAlliance.org 35
Analysis
Many West Virginians mentioned issues in the reporting and understanding of the test results data. Teachers also expressed a concern that the item analysis detail they used to receive prior to the move to the SBAC assessment is no longer available. Quality test information and its implications must be easily understood by teachers, parents, and students alike. Better, more actionable data generally result from better tests that fully assess state standards and student learning. Again a better test will generally be a longer, more expensive test. Notwithstanding this, several states that ASG works with have opted to contract with a third-party vendor to report assessment results and make better use of their assessment data. This is an option for West Virginia policymakers to consider.
Finally, policymakers must consider the impact of a loss of continuity in the assessment system when making the assessment selection. One of the values of assessment is having a consistent instrument to

West Virginia Comprehensive Analysis of Summative Assessments (CASA)36
measure against and to be able to report progress or annual trends in the results. Changing the assess-ment system means new training and professional development is required, as well as increasing the dif-ficulty in comparing test results from one year to the next. Policymakers must consider the hard and soft costs of changing assessment systems when thinking about the right test for West Virginia’s students.
The above discussion focused on some of the more obvious potential conflicts that might arise as poli-cymakers use the West Virginia key assessment criteria to help select the state’s assessment system. It is important to note that these conflicts are not particular to West Virginia but occur in making assessment determinations in all states. Technical assessment experts can be used to help West Virginia policymak-ers sort through the various issues when the assessment evaluation process is being completed.
Assessment CostsThe costs of state assessments have become a topic of concern in recent years. This is due to the
increased use of assessments at both the state and district level under NCLB, as well as the strapped nature of school budgets in general and after the 2008 recession in particular. Many believe the dollars being spent on testing could be better used elsewhere in the education system. Additionally, the assess-ments local districts are using to monitor student progress and prepare students for the state summative assessments are not necessarily of high quality or well aligned with the state summative assessment or the content standards they measure.
While the increasing use of assessments has resulted in a larger portion of state and local budgets being dedicated to testing, the overall spending on assessment as a portion of total student education-al spending is well under 1%. Several industry experts (Darling-Hammond & Adamson2, Topol, Olson, & Roeber3) have written that the implementation of better/higher quality assessments and better coordina-tion of state and district assessment programs could add significant value to state and local assessment systems while, at the same time, saving money. The use of balanced assessment systems, consisting of coordinated formative, interim/benchmark, and summative assessments, is an approach states are frequently mentioning when asked how they envision their future assessment systems.
With that said, what factors influence the cost of state assessments? What are states currently paying for their assessment systems?
When procured on an individual state basis (versus on a consortium basis), a typical assessment con-sists of about a 50/50 split of fixed and variable cost elements. Fixed assessment costs consist largely of the labor needed to develop assessment items, manage the program, implement the technology aspects of the assessment (test delivery system, scoring and reporting systems, etc.), perform quality assurance activities, and ensure the scoring and technical/psychometric aspects of the program meet the appro-priate industry standards. These costs also include the related travel and meeting time associated with performing and managing the various aspects of the program. Variable cost elements of an assessment program consist of per student platform delivery costs; production, manufacturing, and distribution costs for paper-based testing; receiving, scanning, and editing costs; and, most important, human-scoring costs.
Because assessment costs are split roughly evenly between fixed and variable costs, smaller states like West Virginia will pay a higher price per student (although a lower total amount) for the same assess-ment as a state with a large student population. This is because the larger states are able to spread the fixed assessment costs over a larger student population. One of the advantages of participating in a state assessment consortium (and one of the reasons the assessment consortia were established) is that the fixed costs of the assessment, particularly the assessment development costs, are spread over a much larger number of students. Both general assessment consortia, PARCC and SBAC, have been able to de-velop high quality assessments at reasonable prices because of this economy of scale.
Higher quality assessments generally consist of more human-scored items than lower quality tests containing primarily multiple-choice type items. Scoring costs typically make up 30%-50% of the cost of a high quality assessment. Scoring costs for the consortia assessments comprise about 50%-65% of total
2 Darling-Hammond, L., and Adamson, F., Beyond the Bubble Test: How Performance Assessments Support 21st Century Learning, Jossey-Bass, 2014
3 Topol, B., Olson, J., and Roeber, E. Getting to Higher-Quality Assessments: Evaluating Costs, Benefits, and Investment Strategies. Stan-ford Center for Opportunity Policy in Education, March 2012.
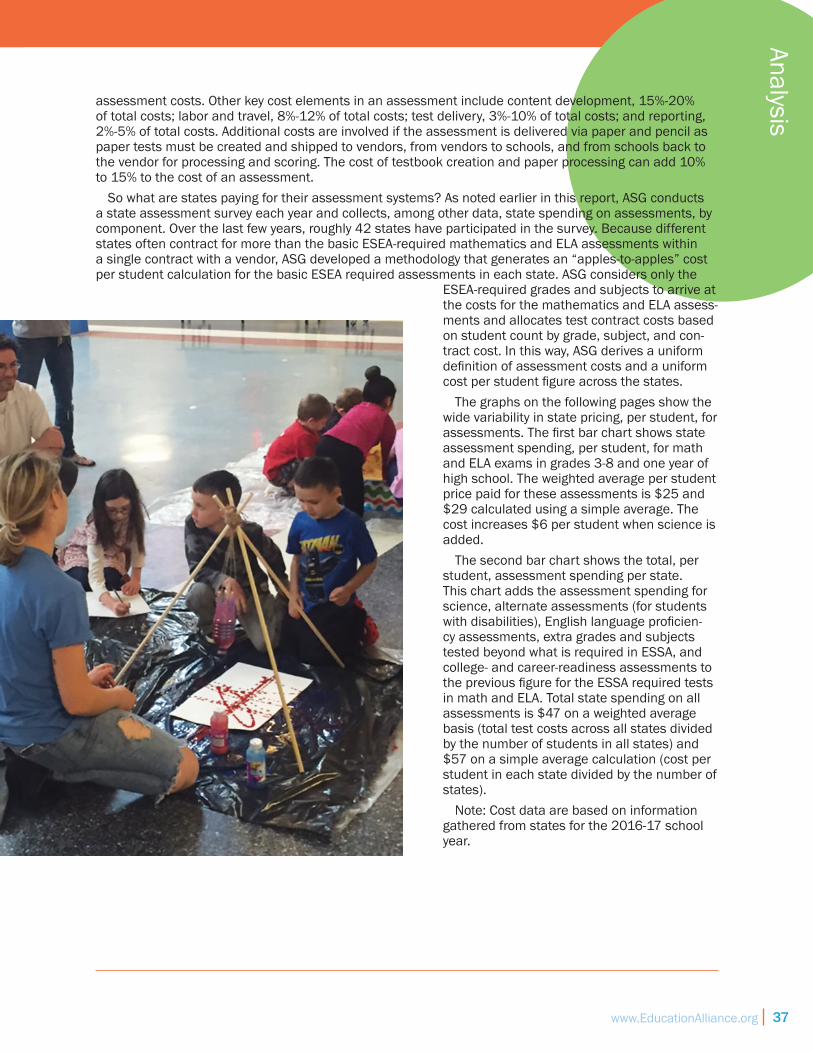
www.EducationAlliance.org 37
Analysis
assessment costs. Other key cost elements in an assessment include content development, 15%-20% of total costs; labor and travel, 8%-12% of total costs; test delivery, 3%-10% of total costs; and reporting, 2%-5% of total costs. Additional costs are involved if the assessment is delivered via paper and pencil as paper tests must be created and shipped to vendors, from vendors to schools, and from schools back to the vendor for processing and scoring. The cost of testbook creation and paper processing can add 10% to 15% to the cost of an assessment.
So what are states paying for their assessment systems? As noted earlier in this report, ASG conducts a state assessment survey each year and collects, among other data, state spending on assessments, by component. Over the last few years, roughly 42 states have participated in the survey. Because different states often contract for more than the basic ESEA-required mathematics and ELA assessments within a single contract with a vendor, ASG developed a methodology that generates an “apples-to-apples” cost per student calculation for the basic ESEA required assessments in each state. ASG considers only the
ESEA-required grades and subjects to arrive at the costs for the mathematics and ELA assess-ments and allocates test contract costs based on student count by grade, subject, and con-tract cost. In this way, ASG derives a uniform definition of assessment costs and a uniform cost per student figure across the states.
The graphs on the following pages show the wide variability in state pricing, per student, for assessments. The first bar chart shows state assessment spending, per student, for math and ELA exams in grades 3-8 and one year of high school. The weighted average per student price paid for these assessments is $25 and $29 calculated using a simple average. The cost increases $6 per student when science is added.
The second bar chart shows the total, per student, assessment spending per state. This chart adds the assessment spending for science, alternate assessments (for students with disabilities), English language proficien-cy assessments, extra grades and subjects tested beyond what is required in ESSA, and college- and career-readiness assessments to the previous figure for the ESSA required tests in math and ELA. Total state spending on all assessments is $47 on a weighted average basis (total test costs across all states divided by the number of students in all states) and $57 on a simple average calculation (cost per student in each state divided by the number of states).
Note: Cost data are based on information gathered from states for the 2016-17 school year.

West Virginia Comprehensive Analysis of Summative Assessments (CASA)38
Cost per Student — Math, ELA & Writing
$-
$25.00
$50.00
$75.00
$100.00
$125.00
$150.00
Alab
ama
Alas
ka
Arka
nsas
Calif
orni
a
Colo
rado
Conn
ectic
ut
Dela
war
e
Dist
ritct
of C
olum
bia
Flor
ida
Haw
aii
Idah
o
Indi
ana
Iow
a
Kent
ucky
Mai
ne
Mar
ylan
d
Mas
sach
uset
ts
Mic
higa
n
Min
neso
ta
Miss
issip
pi
Miss
ouri
Nebr
aska
Neva
da
New
Ham
pshi
re
New
Jers
ey
New
Mex
ico
New
Yor
k
Nort
h Ca
rolin
a
Nort
h Da
kota
Ohi
o
Okl
ahom
a
Ore
gon
Penn
sylv
ania
Rhod
e Isl
and
Sout
h Ca
rolin
a
Sout
h Da
kota
Utah
Verm
ont
Was
hing
ton
Wes
t Virg
inia
Wisc
onsin
Wyo
min
g
Cost per Student - Math, ELA & Writing
Weighted Average Simple Average

www.EducationAlliance.org 39
Analysis
$-
$25.00
$50.00
$75.00
$100.00
$125.00
$150.00
$175.00
$200.00
Alab
ama
Alas
ka
Arka
nsas
Calif
orni
a
Colo
rado
Conn
ectic
ut
Dela
war
e
Dist
ritct
of C
olum
bia
Flor
ida
Haw
aii
Idah
o
Indi
ana
Iow
a
Kent
ucky
Mai
ne
Mar
ylan
d
Mas
sach
uset
ts
Mic
higa
n
Min
neso
ta
Miss
issip
pi
Miss
ouri
Nebr
aska
Neva
da
New
Ham
pshi
re
New
Jers
ey
New
Mex
ico
New
Yor
k
Nort
h Ca
rolin
a
Nort
h Da
kota
Ohi
o
Okl
ahom
a
Ore
gon
Penn
sylv
ania
Rhod
e Isl
and
Sout
h Ca
rolin
a
Sout
h Da
kota
Utah
Verm
ont
Was
hing
ton
Wes
t Virg
inia
Wisc
onsin
Wyo
min
g
Cost per Student - All Assessment Spending
Weighted Average Simple Average
Cost per Student — All Assessment Spending

West Virginia Comprehensive Analysis of Summative Assessments (CASA)40
Costs for Assessment Products of InterestThe table below shows the current list prices for the six national assessments reviewed in this report.
The prices for the PARCC and SBAC assessments are firm at the amounts shown in the table, but pricing for the other assessments may be discounted based on volume of students to be tested. ACT Aspire dis-counts are shown in the notes to the table.
In determining the right assessment to use in West Virginia, price along with the other key criteria must be factored into the equation. The pricing in this table should be evaluated against the quality of the assessment being procured, as well as the costs and quality implications of developing a custom or hybrid state assessment solution.
Test/Feature SAT ACT PARCC SBAC eMPower+ AspireBase Assessment (grade 11 only) $45.00 $42.50
Base Assessment with Writing $57.00 $58.50 included
Computer Based same ave-$23.97 $22.30 $22.00 $25.00
Paper Based ~ + $11 ~ + $11 $28.00 $31.00
Grades 3-8 $19.95 $22.30 $22.00 same
High School $29.95 $22.30 same
SAT Notes - Pricing is for Grade 11 in math and ELA; computer based assessment tryout in Spring 2017.
ACT Notes - Pricing is for Grade 11 in math, ELA and science.
PARCC Notes - The avarage PARCC state pays $23.97 for the assessment in math and ELA, plus a $1 membership fee.
PARCC changing structure in 2018-19 to be more of a content provider. Pricing for content and content packages TBD.
SBAC Notes - Pricing consists of a $6.20 per student fee for content and management (membership) services plus rough-ly $16.10 per student for test administration. SBAC Digital Library, interim assessment and other tools costs an additional $5.20.
eMPower+ Notes - eMPower includes math and reading with CR items. Interim assessments available at additional cost.
Aspire Notes - Aspire consists of tests in math, ELA and science. Discounts available for testing at 4 or more grades ($1), testing 400-1000 students ($1) and testing > 1,000 students ($2).
Note - ELA consists of reading and writing.
Assessment Price Per Student

www.EducationAlliance.org 41
Analysis
Overall, the prices for the PARCC, SBAC, eMPower, and Aspire assessments are all quite reasonable. The price range of $22 to $25 for the online version of these assessments all fall below the average price states pay today for their summative tests. Considering the quality of these assessments (PARCC and SBAC have received very positive reviews for quality; Aspire, while rated somewhat below PARCC and SBAC, has also received positive reviews; eMPower is new and has not yet been reviewed), they each rep-resent good value for states. The bar has been raised with respect to creating affordable, higher quality assessments to measure what students know and can do.
West Virginia could issue an RFP for a custom-designed assessment solution and develop an exam aligned to its standards and specific to the needs of its students. The costs of custom developing a high quality assessment for West Virginia will doubtless be higher than the prices shown above due to the relatively small size of the state student population. The anticipated cost for such an assessment can be accurately determined, before going to RFP, once the state has defined its assessment design.
Potentially cheaper solutions could be obtained by West Virginia purchasing an off-the-shelf assessment and possibly augmenting the test with some items that test student critical-thinking skills. Again, the cost of this solution can be determined once the state settles on the design of the assessment system it wants to implement.

West Virginia Comprehensive Analysis of Summative Assessments (CASA)42
Through this analysis, six different national assessments were presented and reviewed against the West Virginia key assessment criteria. These six assessments were presented to give West Virginia policymakers an overview of some of the more commonly used national assessments and the type
of assessments available in the market, their various attributes, and how each stacks up against the key criteria. As was shown, each assessment has its strengths and weaknesses with respect to how it rates versus the key criteria.
As is the case in all assessment procurements, there are some conflicts that need to be resolved be-tween different assessment criteria when making the actual product selection. Conflicts between the de-sire for an assessment of high-quality, an assessment that can be given in a short amount of time, and an assessment that minimizes cost will need to be reconciled by policymakers. As has been stated previously in this report, but bears repeating, it is important to remember that no single assessment can satisfy the needs and purposes of all users of the data. A system of assessments is required to do this.
Regardless of which Summative Assessment is used by West Virginia, there are key findings that come from the stakeholder input and the analysis:
Findings
1. Student Motivation:a. Student motivation in testing is critical to accurate assess-ment results and a successful assessment system must be tied to outcomes and benefits that are clear to students.
b. When considering student motivation, it is strongly recom-mended that students be included in the dialogue. Data from student focus groups conducted for this study indicate that not all students are motivated by the same strategies (e.g., school-level rewards, course grades, college entrance). A com-prehensive approach is needed.
2. Results & Reports: a. Simple and understandable reports should be provided to educators and families in a more timely fashion. Ideally, these reports should be received before the end of the school year.
b. Professional development is needed to clarify the difference between assessments of learning (e.g., state assessment) and assessments for learning (e.g., formative or other assessments). Some stakeholders’ understanding/expectations of the state assessment reports do not align with its purpose or capabilities.
www.EducationAlliance.org 43
Findings
3. Trade-offs: a. Peer states are taking diverse approaches to tackling the as-sessment issue. No one test meets all of the key criteria. There are trade-offs to be made and policymakers should be armed with information on the strengths and weaknesses of all testing options.
b. Tests are evolving and will continue to change to meet the expectations of consumers. Attention to these ongoing changes should also include continued dialogue to ensure the system meets the needs of West Virginia students.
4. Systemic Implications: a. There is a general sense among educators of “over-testing” and a resulting decrease of student learning time. Some of this perception may be driven by additional local testing require-ments. A local audit of testing practices may be needed to en-sure a streamlined system and avoid unnecessary and duplica-tive testing that reduces student learning time.
b. Given the current state budget dilemma, cost is a factor that deserves important consideration. As described in the report, testing costs go beyond the initial price of the test and include other factors such as training educators for the test, design of reports, and changes to interrelated systems. However, cost should not be the single driving or determining factor in deci-sion-making. West Virginia students deserve a holistic approach to this critical choice regarding the state assessment.
c. Many West Virginia educators and families expressed con-cerns with the current test and/or testing practices but are also exhausted with change. Therefore, any change made to West Virginia’s assessment system should be made deliberatively and with an eye towards easing the burden that flux and inconsisten-cy put on teachers, students, and families.

West Virginia Comprehensive Analysis of Summative Assessments (CASA)44
www.educationalliance.org/casa