West Park Place Elementary School - ed
26
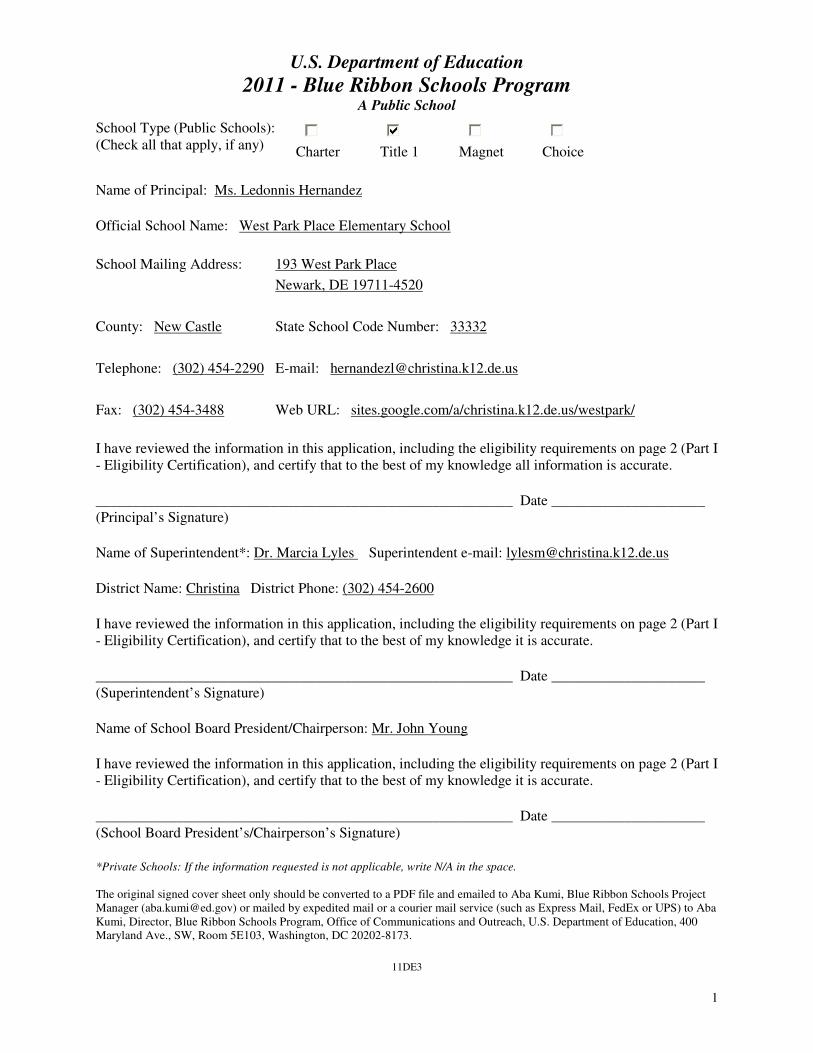
1 U.S. Department of Education 2011 - Blue Ribbon Schools Program A Public School School Type (Public Schools): (Check all that apply, if any) Charter Title 1 Magnet Choice Name of Principal: Ms. Ledonnis Hernandez Official School Name: West Park Place Elementary School School Mailing Address: 193 West Park Place Newark, DE 19711-4520 County: New Castle State School Code Number: 33332 Telephone: (302) 454-2290 E-mail: [email protected] Fax: (302) 454-3488 Web URL: sites.google.com/a/christina.k12.de.us/westpark/ I have reviewed the information in this application, including the eligibility requirements on page 2 (Part I - Eligibility Certification), and certify that to the best of my knowledge all information is accurate. _________________________________________________________ Date _____________________ (Principal’s Signature) Name of Superintendent*: Dr. Marcia Lyles Superintendent e-mail: [email protected] District Name: Christina District Phone: (302) 454-2600 I have reviewed the information in this application, including the eligibility requirements on page 2 (Part I - Eligibility Certification), and certify that to the best of my knowledge it is accurate. _________________________________________________________ Date _____________________ (Superintendent’s Signature) Name of School Board President/Chairperson: Mr. John Young I have reviewed the information in this application, including the eligibility requirements on page 2 (Part I - Eligibility Certification), and certify that to the best of my knowledge it is accurate. _________________________________________________________ Date _____________________ (School Board President’s/Chairperson’s Signature) *Private Schools: If the information requested is not applicable, write N/A in the space. The original signed cover sheet only should be converted to a PDF file and emailed to Aba Kumi, Blue Ribbon Schools Project Manager ([email protected]) or mailed by expedited mail or a courier mail service (such as Express Mail, FedEx or UPS) to Aba Kumi, Director, Blue Ribbon Schools Program, Office of Communications and Outreach, U.S. Department of Education, 400 Maryland Ave., SW, Room 5E103, Washington, DC 20202-8173. 11DE3
Transcript of West Park Place Elementary School - ed
1
U.S. Department of Education
2011 - Blue Ribbon Schools Program
A Public School
School Type (Public Schools):
(Check all that apply, if any) Charter
Title 1
Magnet
Choice
Name of Principal: Ms. Ledonnis Hernandez
Official School Name: West Park Place Elementary School
School Mailing Address: 193 West Park Place
Newark, DE 19711-4520
County: New Castle State School Code Number: 33332
Telephone: (302) 454-2290 E-mail: [email protected]
Fax: (302) 454-3488 Web URL: sites.google.com/a/christina.k12.de.us/westpark/
I have reviewed the information in this application, including the eligibility requirements on page 2 (Part I
- Eligibility Certification), and certify that to the best of my knowledge all information is accurate.
_________________________________________________________ Date _____________________
(Principal’s Signature)
Name of Superintendent*: Dr. Marcia Lyles Superintendent e-mail: [email protected]
District Name: Christina District Phone: (302) 454-2600
I have reviewed the information in this application, including the eligibility requirements on page 2 (Part I
- Eligibility Certification), and certify that to the best of my knowledge it is accurate.
_________________________________________________________ Date _____________________
(Superintendent’s Signature)
Name of School Board President/Chairperson: Mr. John Young
I have reviewed the information in this application, including the eligibility requirements on page 2 (Part I
- Eligibility Certification), and certify that to the best of my knowledge it is accurate.
_________________________________________________________ Date _____________________
(School Board President’s/Chairperson’s Signature)
*Private Schools: If the information requested is not applicable, write N/A in the space.
The original signed cover sheet only should be converted to a PDF file and emailed to Aba Kumi, Blue Ribbon Schools Project
Manager ([email protected]) or mailed by expedited mail or a courier mail service (such as Express Mail, FedEx or UPS) to Aba
Kumi, Director, Blue Ribbon Schools Program, Office of Communications and Outreach, U.S. Department of Education, 400
Maryland Ave., SW, Room 5E103, Washington, DC 20202-8173.
11DE3
2
PART I - ELIGIBILITY CERTIFICATION 11DE3
The signatures on the first page of this application certify that each of the statements below concerning
the school’s eligibility and compliance with U.S. Department of Education, Office for Civil Rights (OCR)
requirements is true and correct.
1. The school has some configuration that includes one or more of grades K-12. (Schools on the
same campus with one principal, even K-12 schools, must apply as an entire school.)
2. The school has made adequate yearly progress each year for the past two years and has not been
identified by the state as "persistently dangerous" within the last two years.
3. To meet final eligibility, the school must meet the state's Adequate Yearly Progress (AYP)
requirement in the 2010-2011 school year. AYP must be certified by the state and all appeals
resolved at least two weeks before the awards ceremony for the school to receive the award.
4. If the school includes grades 7 or higher, the school must have foreign language as a part of its
curriculum and a significant number of students in grades 7 and higher must take the course.
5. The school has been in existence for five full years, that is, from at least September 2005.
6. The nominated school has not received the Blue Ribbon Schools award in the past five years:
2006, 2007, 2008, 2009 or 2010.
7. The nominated school or district is not refusing OCR access to information necessary to
investigate a civil rights complaint or to conduct a district-wide compliance review.
8. OCR has not issued a violation letter of findings to the school district concluding that the
nominated school or the district as a whole has violated one or more of the civil rights statutes. A
violation letter of findings will not be considered outstanding if OCR has accepted a corrective
action plan from the district to remedy the violation.
9. The U.S. Department of Justice does not have a pending suit alleging that the nominated school
or the school district as a whole has violated one or more of the civil rights statutes or the
Constitution’s equal protection clause.
10. There are no findings of violations of the Individuals with Disabilities Education Act in a U.S.
Department of Education monitoring report that apply to the school or school district in question;
or if there are such findings, the state or district has corrected, or agreed to correct, the findings.
3
PART II - DEMOGRAPHIC DATA 11DE3
All data are the most recent year available.
DISTRICT
1. Number of schools in the district: 18 Elementary schools
(per district designation) 4 Middle/Junior high schools
4 High schools
3 K-12 schools
29 Total schools in district
2. District per-pupil expenditure: 10937
SCHOOL (To be completed by all schools)
3. Category that best describes the area where the school is located: Suburban
4. Number of years the principal has been in her/his position at this school: 1
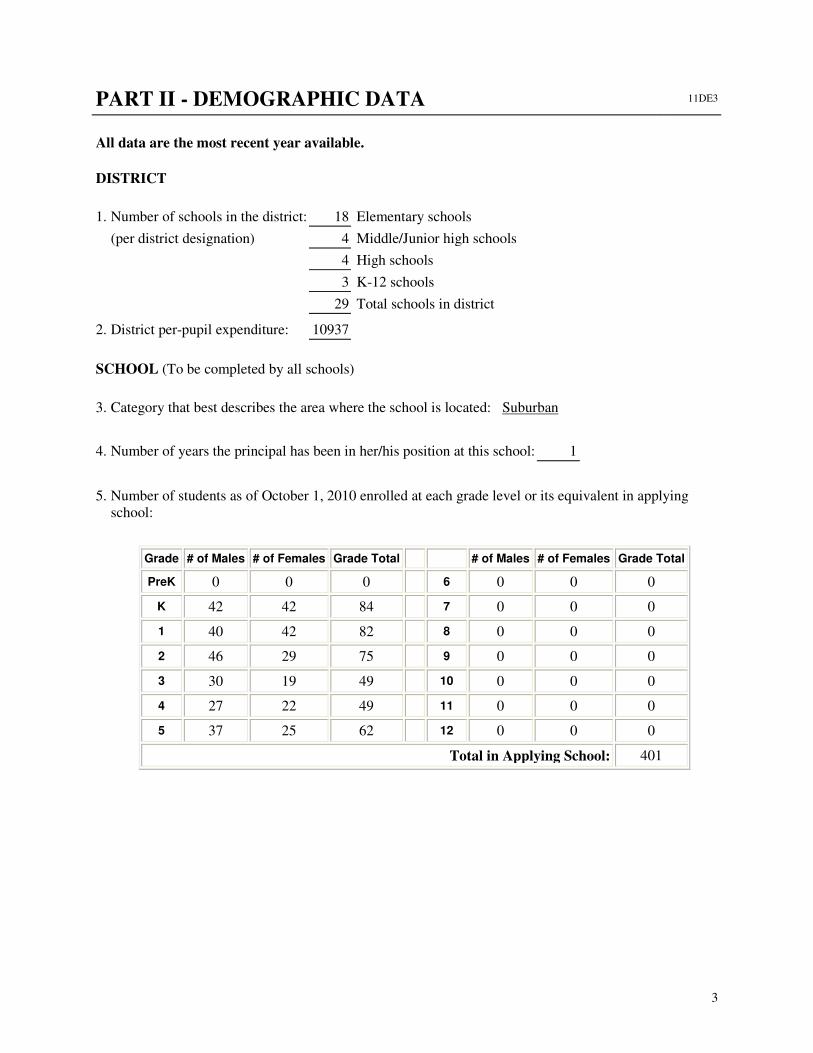
5. Number of students as of October 1, 2010 enrolled at each grade level or its equivalent in applying
school:
Grade # of Males # of Females Grade Total
# of Males # of Females Grade Total
PreK 0 0 0 6 0 0 0
K 42 42 84 7 0 0 0
1 40 42 82 8 0 0 0
2 46 29 75 9 0 0 0
3 30 19 49 10 0 0 0
4 27 22 49 11 0 0 0
5 37 25 62 12 0 0 0
Total in Applying School: 401
4
11DE3
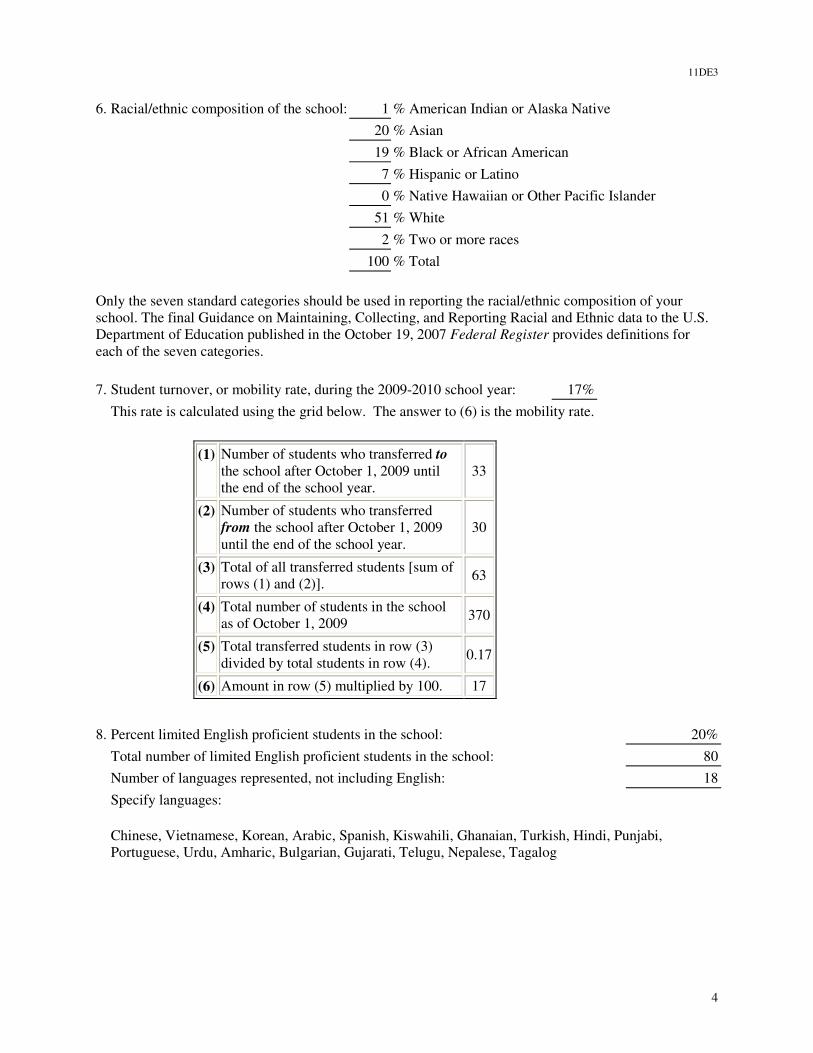
6. Racial/ethnic composition of the school: 1 % American Indian or Alaska Native
20 % Asian
19 % Black or African American
7 % Hispanic or Latino
0 % Native Hawaiian or Other Pacific Islander
51 % White
2 % Two or more races
100 % Total
Only the seven standard categories should be used in reporting the racial/ethnic composition of your
school. The final Guidance on Maintaining, Collecting, and Reporting Racial and Ethnic data to the U.S.
Department of Education published in the October 19, 2007 Federal Register provides definitions for
each of the seven categories.
7. Student turnover, or mobility rate, during the 2009-2010 school year: 17%
This rate is calculated using the grid below. The answer to (6) is the mobility rate.
(1) Number of students who transferred to
the school after October 1, 2009 until
the end of the school year.
33
(2) Number of students who transferred
from the school after October 1, 2009
until the end of the school year.
30
(3) Total of all transferred students [sum of
rows (1) and (2)]. 63
(4) Total number of students in the school
as of October 1, 2009 370
(5) Total transferred students in row (3)
divided by total students in row (4). 0.17
(6) Amount in row (5) multiplied by 100. 17
8. Percent limited English proficient students in the school: 20%
Total number of limited English proficient students in the school: 80
Number of languages represented, not including English: 18
Specify languages:
Chinese, Vietnamese, Korean, Arabic, Spanish, Kiswahili, Ghanaian, Turkish, Hindi, Punjabi,
Portuguese, Urdu, Amharic, Bulgarian, Gujarati, Telugu, Nepalese, Tagalog
5
11DE3
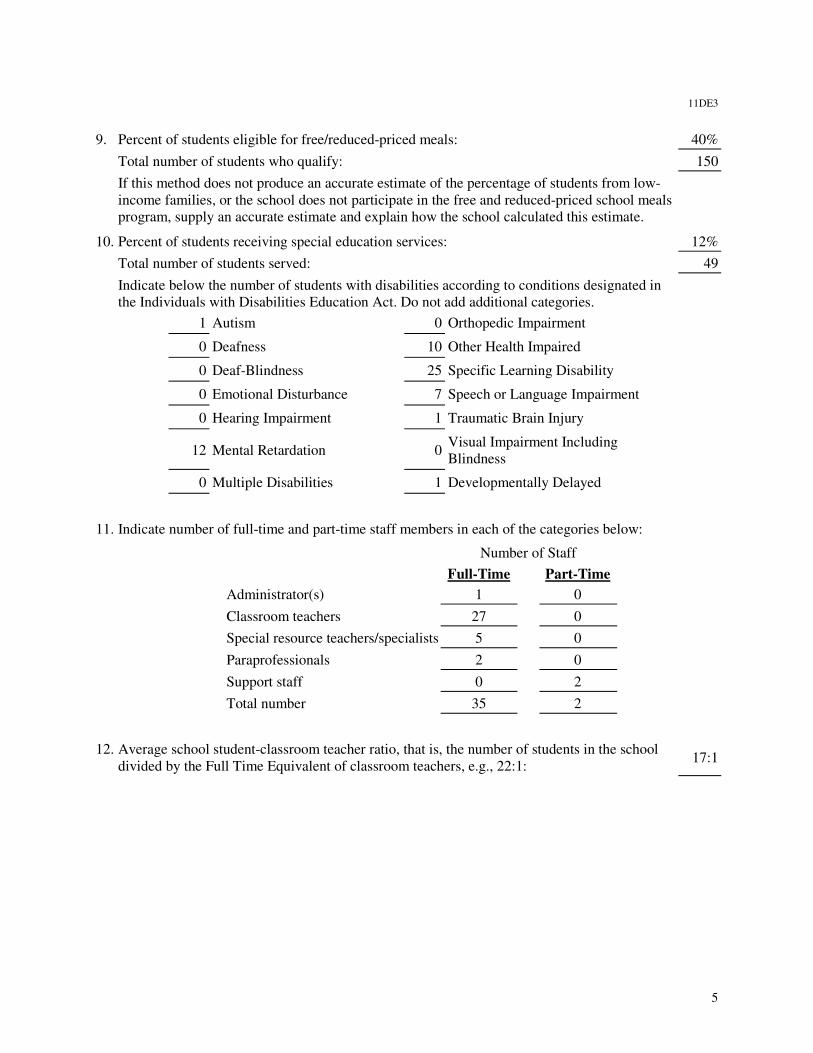
9. Percent of students eligible for free/reduced-priced meals: 40%
Total number of students who qualify: 150
If this method does not produce an accurate estimate of the percentage of students from low-
income families, or the school does not participate in the free and reduced-priced school meals
program, supply an accurate estimate and explain how the school calculated this estimate.
10. Percent of students receiving special education services: 12%
Total number of students served: 49
Indicate below the number of students with disabilities according to conditions designated in
the Individuals with Disabilities Education Act. Do not add additional categories.
1 Autism 0 Orthopedic Impairment
0 Deafness 10 Other Health Impaired
0 Deaf-Blindness 25 Specific Learning Disability
0 Emotional Disturbance 7 Speech or Language Impairment
0 Hearing Impairment 1 Traumatic Brain Injury
12 Mental Retardation 0
Visual Impairment Including
Blindness
0 Multiple Disabilities 1 Developmentally Delayed
11. Indicate number of full-time and part-time staff members in each of the categories below:
Number of Staff
Full-Time
Part-Time
Administrator(s) 1
0
Classroom teachers 27
0
Special resource teachers/specialists 5
0
Paraprofessionals 2
0
Support staff 0
2
Total number 35
2
12. Average school student-classroom teacher ratio, that is, the number of students in the school
divided by the Full Time Equivalent of classroom teachers, e.g., 22:1: 17:1
6
11DE3
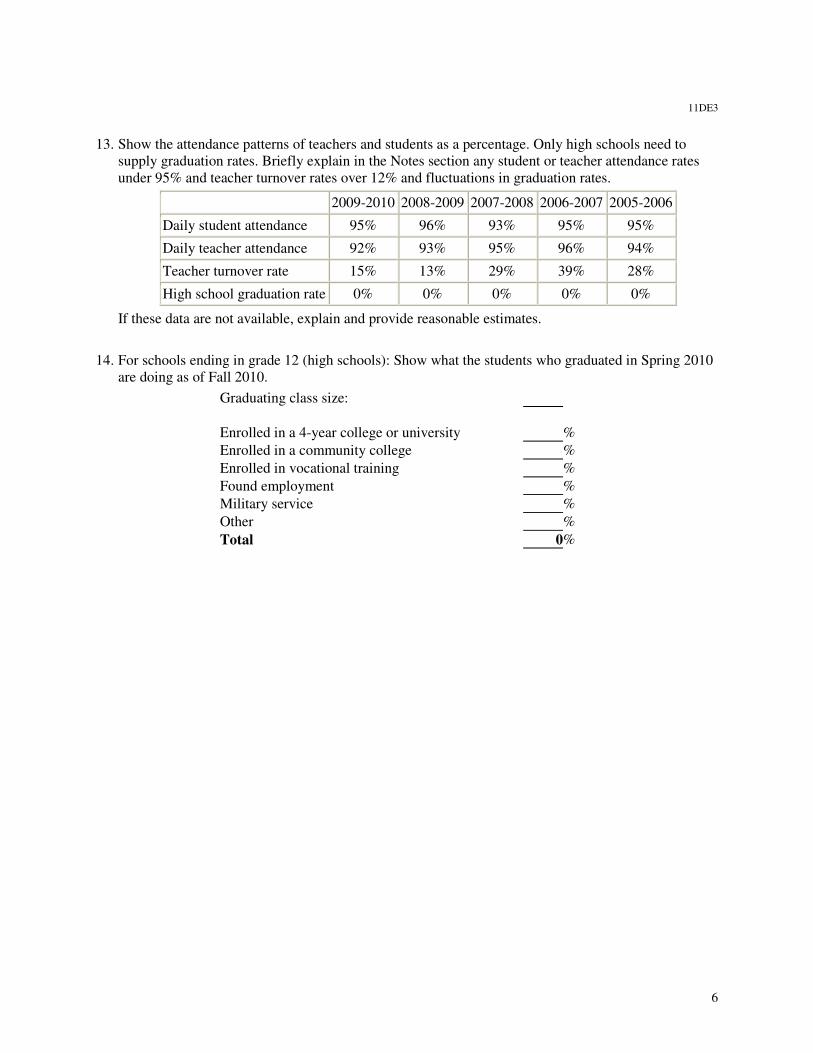
13. Show the attendance patterns of teachers and students as a percentage. Only high schools need to
supply graduation rates. Briefly explain in the Notes section any student or teacher attendance rates
under 95% and teacher turnover rates over 12% and fluctuations in graduation rates.
2009-2010 2008-2009 2007-2008 2006-2007 2005-2006
Daily student attendance 95% 96% 93% 95% 95%
Daily teacher attendance 92% 93% 95% 96% 94%
Teacher turnover rate 15% 13% 29% 39% 28%
High school graduation rate 0% 0% 0% 0% 0%
If these data are not available, explain and provide reasonable estimates.
14. For schools ending in grade 12 (high schools): Show what the students who graduated in Spring 2010
are doing as of Fall 2010.
Graduating class size:
Enrolled in a 4-year college or university %
Enrolled in a community college %
Enrolled in vocational training %
Found employment %
Military service %
Other %
Total 0%
7
PART III - SUMMARY 11DE3
West Park Place Elementary School (West Park) is nestled in a tree lined community of the City of
Newark, Delaware, a suburb of the State of Delaware. We are a community school who first opened our
doors to students in 1954, the year in which the school building was constructed. The school includes a
cafetorium (combination of cafeteria and auditorium), gymnasium, media center, computer lab and 22
classrooms. Our student population is comprised of 0.50% American Indian or Alaska Natives, 20%
Asian, 19% Black, 6% Hispanic, 0.50% Hawaiian or Pacific Islander, 51% White and 2% Multi-racial.
Forty per cent of our students are eligible for free/reduced meals. We are indeed a diverse community of
learners. We operate as a “salad bowl” of diversity which allows us to learn about and from one another
without comprising those characteristics that make us unique.
West Park is an inclusive community of learners in grades kindergarten – 5. We are home to the Christina
School District English as a Second Language (ESL) program for elementary students. We are privileged
to have in our community students from 18 different countries and the United States. Our students speak
18 languages other than English including but not limited to Arabic, Portuguese, Urdu and Kiswahili. In
partnership with the University of Delaware, we teach English language acquisition to English Language
Learners based upon their English proficiency as determined by their Assessing Comprehension and
Communication in English State-to-State for English Language Learners score. Students receive ESL
instruction and support in both the general education environment and in a pull out model.
West Park is also privileged to be the home of two Realistic Educational Alternatives for Children with
Disabilities (REACH) program classrooms. Students in our REACH program receive specialized
instruction and supports in a separate environment, but are included with their non-disabled peers during
resource (physical education, art, music) instruction, lunch and other areas, as appropriate. REACH
students have access to all resources available at West Park.
Driven by our mission and vision, we are a community committed to providing quality instructional
programs for our students. All students are held to the same high expectations for achievement, regardless
of race, gender or socioeconomic status. The Delaware Department of Education has recognized West
Park as a SUPERIOR school since 2003, the inauguration of the Delaware Student Testing Program. Our
instructional program is aligned with the Delaware Prioritized Curriculum; we are phasing in Common
Core Standards as outlined by the Delaware Department of Education; instruction is data driven and
differentiated to meet the needs of diverse learners.
West Park is also a nurturing environment that encourages positive behavior coupled with the daily
application of our universal goals. We are a Positive Behavior Support School (PBS) and have received
recognition as a STAR school for positive behavior by the Delaware Department of Education. Our
universal goals include demonstrating “PREPARED, PRODUCTIVE, and POSITIVE” behavior in all
aspects of school at all times. We encourage responsible behavior for all students, reward positive
behavior, and support those students experiencing behavioral challenges.
We recognize parental involvement as one of our strengths at West Park. To us, parents are our partners
in education. As a result, there are many opportunities for parental involvement. Parents participate on our
School Improvement Team and various committees that support school efforts. We demonstrate our
commitment to parental involvement by maintaining regular communication with parents by email,
internet groups, newsletters, bulletin board postings and news blasts via our telephone messaging system.
We also demonstrate that parents are partners in education by regularly communicating student progress
and by providing opportunities for parents to conference with teachers and our school principal. Another
way we demonstrate our belief that parents are partners in education is by providing opportunities for
parents to volunteer at the school. Parents volunteer in classrooms, during fundraisers, afterschool
programs, and special programs like our annual multi-cultural and health and fitness nights.

8
The Parent Teacher Association (PTA) is an integral part of the West Park family. We work in
collaboration with PTA in order to ensure our school is an environment that meets the needs of all
students. PTA has an extensive and robust history at West Park; PTA membership is strongly encouraged
for parents and teachers alike. The West Park PTA has been instrumental in the implementation of school
programs including 500 Book Challenge, which includes Story Teller Night. Members of the PTA
provide afterschool enrichment which allows our students to participate in programs like Odyssey of the
Mind. They support the school with PBS by reinforcing our universal goals at home, and by stocking and
managing the school store. Additionally, PTA provides financial assistance to families in need support
with financing school trips. The list of the ways in which West Park is supported by PTA is endless.
9
PART IV - INDICATORS OF ACADEMIC SUCCESS 11DE3
1. Assessment Results:
West Park Place Elementary School (West Park) participated in the Delaware State Testing Program,
which tested student in grades 2-5 in reading and math in the spring of every year since 2003. Students in
grades 4 participated in a science and social studies test (covering content addressed in grades k-3) in the
fall of each year. Writing was assessed until 2008 for grades 3-4 and 2009 for grades 5. Each content area
was assessed using multiple choice, short answer and extended response and results were converted to a
scale score. The Delaware Department of Education determined cut scores for the following performance
levels: PL5 (Distinguished), PL4 (Exceeds Standard), PL3 (Meets Standard), PL2 (Approaching
Standard), and PL1 (Well Below Standard) and PL0 (non-scorable, illegible, student refused to take the
test). Delaware State Testing information can be obtained at http://www.doe.k12.de.us/aab.
In 2006, our data revealed that 25% of our special education students met proficiency in reading and 27%
met proficiency in math. In addition, 72% of our African American students met proficiency in reading
and 77% met in math. From this we identified an achievement gap in the performance of special
education and African American students. In order to address these concerns, we have included the
performance of special education students and African American students as part of our school
improvement plans over the years. Specific strategies we implemented to help improve students’
performance include: modifying the service model for special education students as we phased into
inclusion classrooms; establishing PLC’s for collaboration and data discussion; increasing push-in
support and decreasing pull-out support; implementing data driven interventions; establishing SMART
goals for student performance; providing targeted professional development to support teacher instruction
and increasing parent communication and involvement.
Since implementing these strategies, we have seen the performance of our special educations student in
reading increase to a high of 73% meeting proficiency in 2008 and 47% meeting in 2010. In math, special
education students have grown to a high of 56% meeting proficiency in 2008 to 52% meeting in 2010.
The trends in the data indicate that we are making progress in closing the achievement gaps. We
recognize the need to continue to ensure these students are being monitored and provided interventions on
a consistent basis.
In 2008, West Park gained the English Language Learner program and has seen the numbers of the
students in the population grow by 28%. Reading proficiency levels for this subgroup in 2009, the first
year these students were tested on DSTP at West Park, was 47% proficiency. In 2010, the second year of
testing for this subgroup, we saw slight growth to 48% proficiency. In math, our ELL subgroup level of
proficiency was 67% in 2009. There was an insignificant change in proficiency levels for this subgroup in
2010.
In order to address the achievement gaps of the ELL subgroup at West Park, we’ve implemented several
school wide strategies. The number of teachers providing English as a Second Language instruction has
increased; ESL teachers participate in PLCs weekly. Augmenting teachers with specialized skills has
provided increased opportunity for teachers to co-teach with regular educators, instruct smaller student
groups, and push in ESL services into the regular classroom. Regular classroom teachers are provided
ongoing professional development focusing on how to instruct and support ELLs in the regular
classroom. Targeted reading instruction is provided on a daily basis. Regular educators, special educators
and ELL teachers are provided more opportunities to collaborate, analyze data and plan data driven
lessons. Students are progressed monitored regularly; revisions to the instructional programs are made as
needed. Math RtI is implemented in grades 1 – 5 using daily practice problems and universal screening
tools. Additionally, West Park is partnered with the University of Delaware for ESL instruction and math
RtI training.
10
2. Using Assessment Results:
West Park Elementary School uses assessment data in various ways to improve student achievement. The
use of Professional Learning Communities (PLC) began in the fall of 2007. Through collaborative
planning, grade level teams are able to review assessment data to pinpoint areas of need and guide
instruction. Progress Monitoring data is the primary discussion tool that leads teams to implement various
strategies in the classroom such as flexible grouping to specifically address student needs. Part of the PLC
process is to use data from various assessment tools such as Dynamic Indicators of Basic Early Literacy
Skills (DIBELS), spelling inventory, Measures of Academic Progress (MAP), and common assessments
to identify students who need targeted interventions. In conjunction with the Response to Intervention
process, PLC teams review and analyze students to determine if implemented interventions have been
effective or if students need to be referred for further discussion. West Park adopted the Data Wise
framework in the fall of 2008 to help streamline and focus the PLC process. Grade level teams establish
ELA and Math S.M.A.R.T. (Specific, Measureable, Attainable, Relevant, Time bound) goals which are
based on assessment data and are reviewed and updated throughout the year. As teams delved deeper into
data, they recognized the need to examine instruction, and the Learning Walk process began in the fall of
2009. This student driven process of examining student learning helped teams identify the effectiveness
of instructional practices that were being implemented and led to changes in instruction. For example, in
correlation with our school goal relating to math communication, grade level teams were able to create a
more concise way for children to adequately express their mathematical thinking, and the school wide
“PANDA” process (Picture, Answer, Number sentence, Double check, Another way) was adopted.
The School Improvement Team uses assessment data to determine if the school is on track for meeting
School Success Plan goals and objectives. Whole school data is analyzed and reviewed monthly, a plan of
action is developed and the student achievement is monitored. Revisions of the SSP are made as needed
in order to reflect the progress of the school.
3. Communicating Assessment Results:
Driven by our mission, we recognize that clear communication with students, parents, and the community
is vital for our success in meeting our goals. As students, parents and community members enter the
school, they are greeted by our Superior school banners which proudly show our school success over the
past 7 years. Assessment results are shared with students as immediately as possible, for example MAP
results were immediately available and students reviewed their scores and could determine their progress
before leaving their testing session. Delaware Comprehensive Assessment System data is also
immediately available for the fall and winter administrations. Assessment scores are directly sent home to
parents when results become available. Communication also extends to our monthly school newsletter,
The Panda News, which can be e-mailed to families or hard copies taken home. This news letter includes
relevant information about the school including assessment data. Highlighted information from current
events in specific classrooms is also included in Panda News. Information is also shared with parents and
the community at large, at PTA meetings, Open House, parent conferences and Grade Level information
nights. Our school website http://sites.google.com/a/christina.k12.de.us/westpark/, also provides an
avenue to view assessment results. Information is also disseminated to parents through student agendas,
interim reports, trimester report cards; parent response and feedback is encouraged.
Parents have played an active part in the school decision making process through their involvement in
various school committees. Through the PBS (Positive Behavior Support) team, parents participate and
provide input as discipline data is reviewed and discussed and decisions are made based on data analysis.
As part of the School Success Planning team, parents provide their perspective in determining the
instructional needs and developing an action plan for the school based on assessment data results.
Response to Intervention provides another forum for parental involvement. As student progress
monitoring and assessment is analyzed, parents are informed and if referrals are needed, parents provide
more extensive information regarding their child. This information may include learning style inventories,
health related issues, motivation factors, and work habits. All information is compiled and used in
11
determining the appropriate instructional direction for the child.
4. Sharing Lessons Learned:
The successes at West Park have been shared within the school community and beyond. West Park has
been recognized by the School Board at board meetings for various achievements including, “PBS Star
School”,” Superstars in Education” nomination, and as a “Superior School” on state DSTP testing since
2003. The most successful strategy implemented at West Park that has directly affected student
achievement has been the fine tuning of the Professional Learning Communities using protocols, norms,
SMART goals and the Data Wise framework. Each have helped to make PLC teams more productive.
Prior to 2009, we began to implement the Data Wise framework to guide our PLCs. In 2009, members
from our Data Team attended The Data Wise Summer Institute at Harvard University in order to improve
our ability to successfully implement the Data Wise Framework. The team brought back information and
direction that led to a clearer understanding of the framework and how it can be used to improve the
teaching and learning. Specifically, each team engaged in learning walks as part of examining instruction
and looking at student learning. From these walks, instructional changes were made at every grade level.
We served as a model for PLCs and our principal shared our successes and strategies within the district
and state. The district website also featured an article which chronicled our Data Wise experience. The
following summer, Data Team members returned to Harvard University serving as Teaching Fellows
sharing with teachers, administrators and district staff from all around the world, our journey in
implementing the steps of Data Wise at West Park. In the late fall, we also participated in a follow up
conference call with Data Wise participants to discuss their successes and challenges with Data Wise thus
far.
12
PART V - CURRICULUM AND INSTRUCTION 11DE3
1. Curriculum:
The curriculum at West Park Elementary School is currently aligned with the Delaware Prioritized
Standards as we transition to the Common Core State Standards for Teaching and Learning. Teaching
strategies promote higher order thinking skills and is differentiated according to student need based on
data.
Reading/Language Arts –At West Park Elementary the language arts block is a balanced instructional
model that includes teacher guided reading, self-selected independent reading, teacher read-aloud,
phonics/decoding instruction, fluency instruction, and vocabulary instruction with the goal of increasing
comprehension. Teachers consistently utilize: extending thinking strategies, essential questions,
distributed summarization, collaborative pairs, research-based vocabulary strategies, graphic organizers
and written responses. All students receive ninety minutes of reading instruction and forty-five minutes of
writing instruction daily. The core reading curriculum is Houghton Mifflin Harcourt Reading including
Leveled Readers and Soar to Success. Students receiving special education services and ELL students are
mainstreamed into the regular classrooms. During the ninety minute block, the classroom teacher
provides Tier I whole group instruction and small flexible group instruction targeted to student need
determined by rigorous assessments and progress monitoring. Depending on students’ level of services,
ELL students receive pull-out or push-in support by ELL teachers. Special education teachers push in to
the classrooms during the language arts block. Tier II and Tier III instruction is provided during a thirty
minute intervention block that includes push-in and pull-out services provided by special education
teachers, reading specialists, interventionists, ELL teachers, and instructional support personnel. Tier II
and Tier III intervention materials are research based and are determined by student need. Progress
monitoring is administered according to district RtI guidelines and instruction is adjusted according to the
assessment results. An enrichment teacher provides services to identified students during the language
arts and intervention blocks. A Writers’ Workshop approach is used during the writing block.
Mathematics – All students receive sixty minutes of daily mathematics instruction. This instructional time
includes a daily practice problem and whole group instruction. The core mathematics program is Math
Trailblazers. This research-based K-5 mathematics program integrates math, science, and language arts. It
embodies the standards for school mathematics and is based on the ideas that mathematics is best learned
by solving problems in real-world contexts. The students are actively engaged in the TIMS method to
explore mathematical concepts and solve problems with manipulatives. Instruction balances conceptual
understanding with procedural skill. Teachers consistently utilize: extending thinking strategies, essential
questions, distributed summarization, collaborative pairs, research-based vocabulary strategies, graphic
organizers and written responses. Depending on students’ level of services, ELL students receive pull-out
or push-in support by ELL teachers. Special education teachers push in to the classrooms during math
instruction. West Park has been a pilot school for the state’s math RtI model emphasizing high-quality
differentiated instruction.
Science/Social Studies – Students receive forty-five minutes of social studies instruction each day. Units
are divided into three week cycles and science and social studies instruction is alternated between these
cycles. The social studies curriculum consists of standards based lessons designed by district teachers.
The students are exposed to content through simulations, trade books, primary sources, and field
experiences. The teachers are provided with Harcourt Horizons to support these lessons. The units
culminate with students engaging in transfer tasks.
Related Arts Programs – The related arts program include art, music, physical education, and library.
Students in each class have one of the related arts classes each day for 45 minutes. Each related arts uses
an approved curriculum and respective state standards to guide their instructional process. The related arts
program is designed to be developmentally appropriate, highly interactive and expose the students, in
13
depth, into their domains. The related arts curriculum also has strong connections into real-world
experiences.
Students also have an opportunity to learn to learn string instruments or participate in band. Lessons are
provided by highly qualified teachers in addition to the regular music program. String and band lessons
are provided weekly during the regular school day.
2. Reading/English:
(Elementary Schools) Reading: West Park implements the Houghton Mifflin Harcourt reading curriculum
, a program based on current research with a commitment to a strong reading foundation. This program
utilizes Delaware state standards targeted instruction based on diagnostic testing and Tier II and III
instruction for intervention. Combined with strong school leadership and targeted professional
development for teachers, this program has been highly effective. In order to use support staff efficiently,
a school-wide master schedule is developed each year. Each grade level has the same language arts and
intervention block and appropriate staff are aligned to these blocks according to student need. The
language arts block is divided into forty-five minutes of whole group instruction and forty-five minutes of
small flexible group instruction combined with independent centers. This approach differentiates
instruction according to students’ academic needs (phonics, fluency, comprehension) giving them a strong
foundation to develop essential reading skills and strategies. During the flex group time, the teacher meets
with small groups of students (grouped according to skill need) for fifteen to thirty minutes. During this
time the students receive direct instruction on their identified need and application of that skill to reading.
The students are progress monitored weekly or biweekly and instruction is adjusted according to student
progress. Students may be moved between groups as a result of progress monitoring.
As determined by assessments and other factors, at-risk students are provided Tier II and III targeted
instruction during the thirty minute intervention block, using research based programs. The instruction is
delivered by highly qualified staff. These students are progress monitored weekly and this data is
reviewed every six weeks to evaluate their placement. Students in grades two through five, who excel in
reading, receive academic enrichment services delivered by a highly qualified Enrichment teacher.
The success of West Park’s reading program derives, in part, to grade-level Professional Learning
Communities that meet once a week during a double planning period. This time was provided by the
principal through creative use of personnel and scheduling. During this PLC time, grade level teams meet
with all support staff (special education and ELL teachers) working with their students. The teams use
summative and formative state, district, and grade-level assessment results to make instructional decisions
for students to guide instruction during the language arts and intervention blocks. Teams share
accountability for all students’ success and support each other in resolving instructional challenges.
3. Mathematics:
At West Park, Math Trailblazers, a research and standards-based K-5 mathematics program that integrates
math, science and language arts, is used to support math instruction. This curriculum is based on
the belief that students learn best when they are engaged in real world problem-solving. It is endorsed by
the National Science Foundation. Students in grades k - 5 receive 60 minutes of instruction in math daily.
Instruction is provided in both whole group and small groups, using the instrutional team work of both
regular and special educators. Lessons are differentiated to meet the needs of students by incorporating
computer based programs, daily practice problems, manipulatives and Response to Intervetion. We are
partnered with the University of Delaware for math RtI which provides professional development for our
teachers, as well as technical support. Additionally, primary grades use "read it, draw it, solve it" as an
instructional strategy. Elementary grades use Delaware Procedural Fluency as an additional instructional
resource.
14
4. Additional Curriculum Area:
Our science curriculum, Harcourt Horizons, is kit based and directly aligns with state standards. Students
learn important scientific concepts and develop the ability to think critically by actively constructing ideas
through their own inquiries, investigations, and analyses as they explore the natural world. The instruction
helps develop basic skills within the context of learning science through student readings, science
journals, student projects, and the use of mathematics to quantify and communicate results of
investigations and experiments. In the primary grades, students begin their study of science by observing,
measuring and identifying properties as a foundation and move toward seeking evidence, recognizing
patterns and cycles. Finally identifying cause and effect and extending the senses. This is learned by
hands-on experiments that are age appropriate and often in collaborative learning groups. The students
explore, identify and clarify ideas about specific topic. Students conduct observations and investigative
experiments. Collaboratively they discuss their observations and findings to solidify their understanding.
In addition the elementary grades, 3-5, apply transfer tasks where they discuss and apply their new
knowledge to new situations.
5. Instructional Methods:
West Park’s status as the magnet school for the district’s ESL population makes for a more diverse
population. In order to meet the needs of this diverse population instruction must be differentiated. The
English as a Second Language students, who account for 20% of the school’s population, are from more
than 10 countries around the world. Most of these students are not English proficient when they enter
West Park. These students are included or integrated into their appropriate grade level classroom. ESL
instruction and support is provided based on student need, which may include small group instruction. All
teachers and staff at West Park are expected to provide ESL students with instructional experiences that
support their acquisition of crucial English literacy skills.
The key to meeting the needs of this diverse population and all students at West Park is utilizing data to
create small flexible groups to differentiate instruction. Based on assessment data and collaborative
decisions made at PLCs, the appropriate research-based materials and method of instructional delivery are
identified in order to target the instructional needs of all students during the small group instruction. Our
instructional materials include motivating and engaging activities that are explicit and based on the five
components of reading. These include Sidewalks, Stairway to Proficiency, Reading Mastery,
ABeCeDarian, and Soar to Success. We also use web based Earobics and the Rosetta Stone language
program to supplement our instructional program.
Students receive instruction in small flexible groups between fifteen and thirty minutes per day.
Struggling readers receive an extra thirty minutes of explicit and targeted intervention outside of the
English Language Arts block. Those students who exceed grade level expectancies receive enrichment
services.
West Park has been a pilot school for the state’s math RtI model emphasizing high-quality differentiated
instruction, using formative, diagnostic and summative assessment data. Formative assessments are the
cornerstone of this model. Formative assessment is used by teachers and students during instruction as a
means of guiding teaching and learning. It’s often used to adjust instruction in order to improve students’
achievement of intended instructional outcomes. During assessments the teacher’s role is to carefully
observe the strategies that students use and using various questioning techniques to probe student
thinking. Curriculum-based templates guide teachers through the process of identifying learning gaps and
implementing interventions. Math pull-out interventions are provided weekly for those students not
meeting success.
15
6. Professional Development:
West Park’s professional development is guided by our School Success Plan goals and district initiatives.
Each year a core team of grade level leaders along with the administrator develop the plan based on state,
district and school data. This process provides a clear focus and purpose for the professional development
targeting school improvement. Based on these goals and as part of an initiative to develop teacher leaders
in the building, the administrator identified a cohort of teachers (one from each grade level) to attend
‘Data Wise’ training at Harvard University. These teacher leaders returned to the building and worked
together to provide professional development and support for the staff to implement the ‘Data Wise’
improvement process. Through this process grade level teams use PLCs to explore an area of low student
achievement in their data, determine a problem of practice, implement peer observations, and
collaboratively come to a determination of better practice to improve student learning. This process has
encouraged introspection and improvement in instructional strategies.
As part of a district initiative to improve instructional strategies, the lead teachers attended Learning
Focused Strategies professional development. Learning Focused Strategies professional development is
provided during afterschool PLCs in order to improve instructional practice. Ongoing support for LFS
and improving instructional practice is provided by our Instructional Coaches, including our ESL
Instructional Coach. The instructional coach facilitates professional development, conducts demonstration
lessons, informally observes teachers and provides meaningful feedback, and supports teachers with
developing lesson plans that are aligned with state standards. As a result, teachers are using extending
thinking strategies, essential questions, distributed summarization, collaborative pairs, research-based
vocabulary strategies, graphic organizers to improve student learning.
Professional development at West Park is also provided through webinars. This school year alone, our
teachers have participated in webinars for both the Earobics and Rosetta Stone programs. In order to
differentiate the professional development for teachers participate in book studies that are facilitated by
our Instructional Coach. Both Words Their Way and Stairway to Proficiency are book studies we’ve
completed at West Park.
7. School Leadership:
Our school leadership structure includes the principal as sole administrator. While the principal articulates
a shared vision, one of the primary focuses of the principal is to demonstrate instructional leadership by
focusing on student achievement. The principal ensures that our school environment is conducive to
learning, maintains open communication with parents and community and guarantees that instructional
practices are aligned with state standards and meet student needs. The efforts of the principal are
supported by teacher leaders and other school staff. Recognizing that we all impact student achievement,
a collaborative school culture has been established. Distributive leadership principles help to guide us in
our work. All members of the school staff are seen as being important sources of knowledge and
experience.
There is a teacher leader identified for each grade level and resource. Teacher leaders facilitate PLCs,
participate on the leadership team, and participate in the decision making process. Every teacher in the
school participates on at least one committee. The committees are chaired by a teacher who is responsible
for committee outcomes.
These teacher-led committees allow for shared decision-making and input relating to procedures and
academic direction. Teacher leaders are facilitate the RtI process at the school acting as a kind of
gatekeeper. Teachers also lead the Positive Behavior core team, the data team and the Crisis/Response
team.
In addition to lead teachers and committee members, we have teachers who serve as content chairpersons.
There is a content chair for math, English Language Arts, science and social studies. The content chairs
serve as experts in their respective content area. They also are a link between the school and the district as

16
to curriculum initiatives and information. Because of our distributive leadership structure, teachers have a
vested interest and implement strategies to meet the instructional needs of the students. This high level of
teacher leadership supports the building principal in the shared vision of meeting the instructional needs
of all students.
17
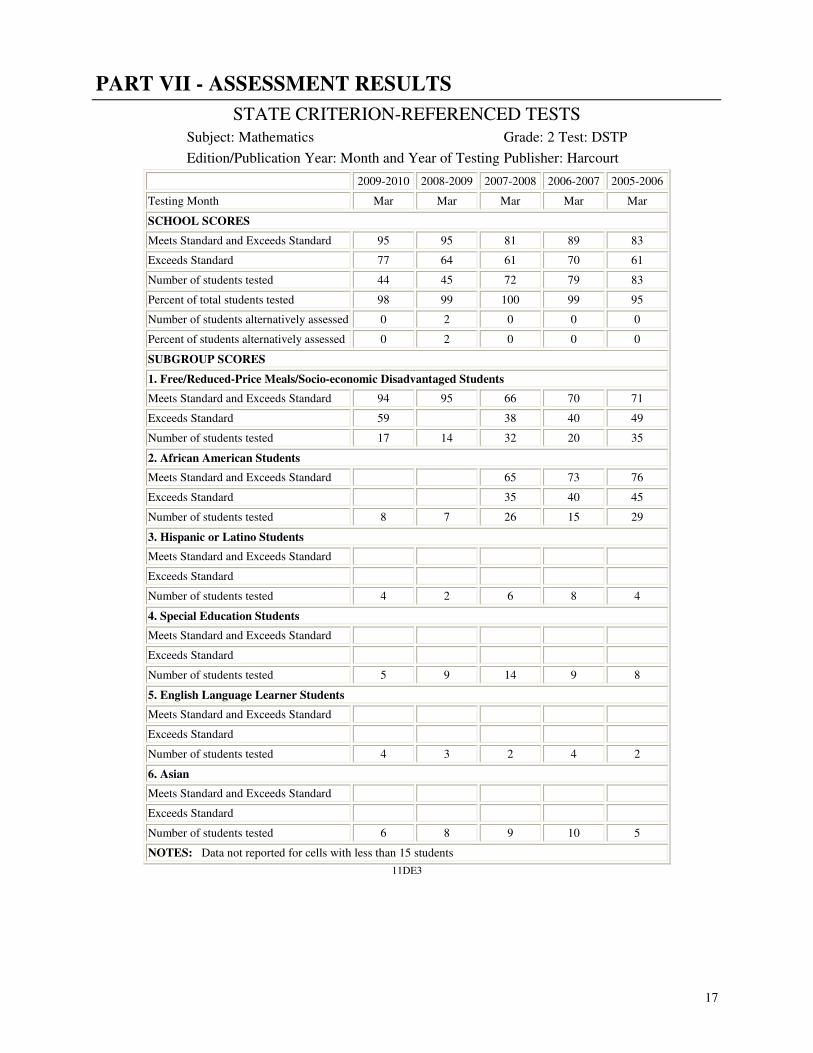
PART VII - ASSESSMENT RESULTS
STATE CRITERION-REFERENCED TESTS
Subject: Mathematics Grade: 2 Test: DSTP
Edition/Publication Year: Month and Year of Testing Publisher: Harcourt
2009-2010 2008-2009 2007-2008 2006-2007 2005-2006
Testing Month Mar Mar Mar Mar Mar
SCHOOL SCORES
Meets Standard and Exceeds Standard 95 95 81 89 83
Exceeds Standard 77 64 61 70 61
Number of students tested 44 45 72 79 83
Percent of total students tested 98 99 100 99 95
Number of students alternatively assessed 0 2 0 0 0
Percent of students alternatively assessed 0 2 0 0 0
SUBGROUP SCORES
1. Free/Reduced-Price Meals/Socio-economic Disadvantaged Students
Meets Standard and Exceeds Standard 94 95 66 70 71
Exceeds Standard 59
38 40 49
Number of students tested 17 14 32 20 35
2. African American Students
Meets Standard and Exceeds Standard
65 73 76
Exceeds Standard
35 40 45
Number of students tested 8 7 26 15 29
3. Hispanic or Latino Students
Meets Standard and Exceeds Standard
Exceeds Standard
Number of students tested 4 2 6 8 4
4. Special Education Students
Meets Standard and Exceeds Standard
Exceeds Standard
Number of students tested 5 9 14 9 8
5. English Language Learner Students
Meets Standard and Exceeds Standard
Exceeds Standard
Number of students tested 4 3 2 4 2
6. Asian
Meets Standard and Exceeds Standard
Exceeds Standard
Number of students tested 6 8 9 10 5
NOTES: Data not reported for cells with less than 15 students
11DE3
18
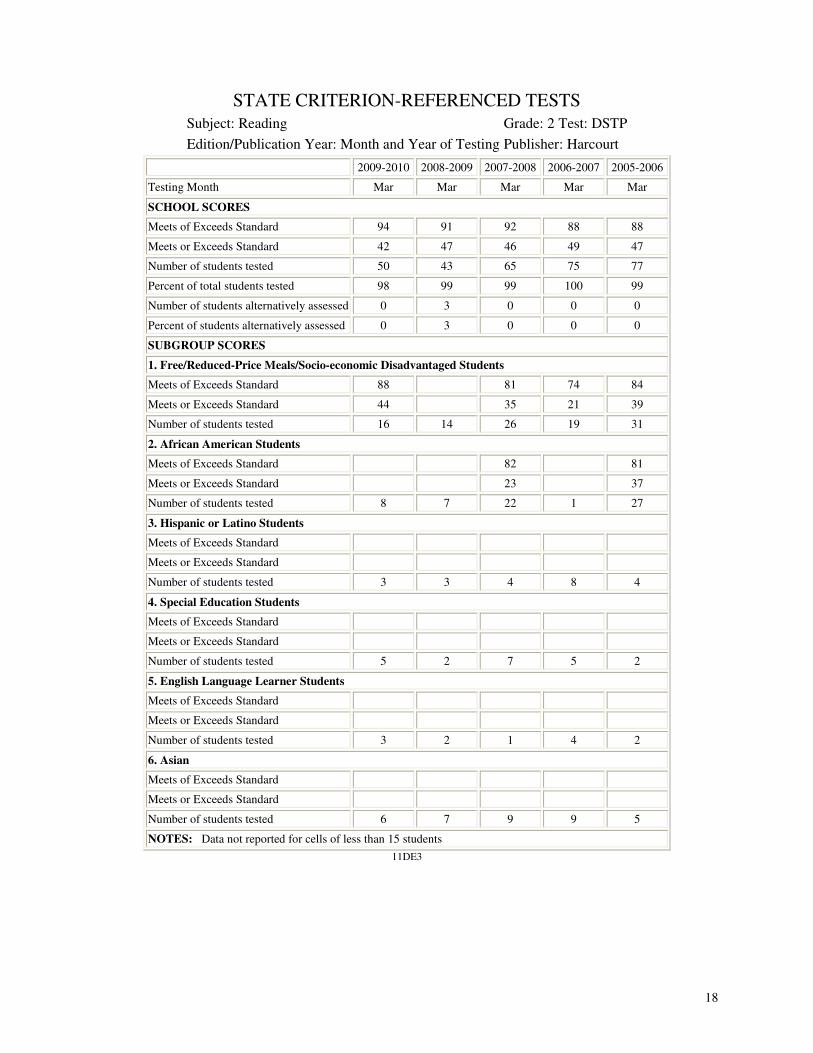
STATE CRITERION-REFERENCED TESTS
Subject: Reading Grade: 2 Test: DSTP
Edition/Publication Year: Month and Year of Testing Publisher: Harcourt
2009-2010 2008-2009 2007-2008 2006-2007 2005-2006
Testing Month Mar Mar Mar Mar Mar
SCHOOL SCORES
Meets of Exceeds Standard 94 91 92 88 88
Meets or Exceeds Standard 42 47 46 49 47
Number of students tested 50 43 65 75 77
Percent of total students tested 98 99 99 100 99
Number of students alternatively assessed 0 3 0 0 0
Percent of students alternatively assessed 0 3 0 0 0
SUBGROUP SCORES
1. Free/Reduced-Price Meals/Socio-economic Disadvantaged Students
Meets of Exceeds Standard 88
81 74 84
Meets or Exceeds Standard 44
35 21 39
Number of students tested 16 14 26 19 31
2. African American Students
Meets of Exceeds Standard
82
81
Meets or Exceeds Standard
23
37
Number of students tested 8 7 22 1 27
3. Hispanic or Latino Students
Meets of Exceeds Standard
Meets or Exceeds Standard
Number of students tested 3 3 4 8 4
4. Special Education Students
Meets of Exceeds Standard
Meets or Exceeds Standard
Number of students tested 5 2 7 5 2
5. English Language Learner Students
Meets of Exceeds Standard
Meets or Exceeds Standard
Number of students tested 3 2 1 4 2
6. Asian
Meets of Exceeds Standard
Meets or Exceeds Standard
Number of students tested 6 7 9 9 5
NOTES: Data not reported for cells of less than 15 students
11DE3
19
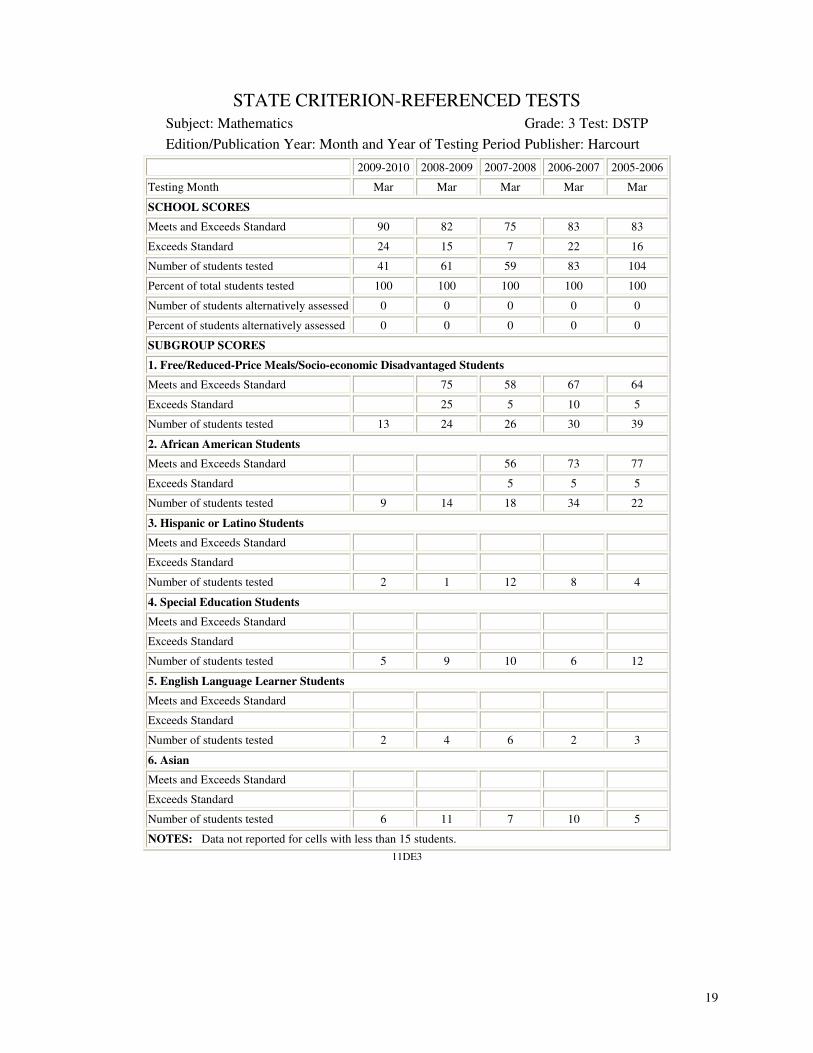
STATE CRITERION-REFERENCED TESTS
Subject: Mathematics Grade: 3 Test: DSTP
Edition/Publication Year: Month and Year of Testing Period Publisher: Harcourt
2009-2010 2008-2009 2007-2008 2006-2007 2005-2006
Testing Month Mar Mar Mar Mar Mar
SCHOOL SCORES
Meets and Exceeds Standard 90 82 75 83 83
Exceeds Standard 24 15 7 22 16
Number of students tested 41 61 59 83 104
Percent of total students tested 100 100 100 100 100
Number of students alternatively assessed 0 0 0 0 0
Percent of students alternatively assessed 0 0 0 0 0
SUBGROUP SCORES
1. Free/Reduced-Price Meals/Socio-economic Disadvantaged Students
Meets and Exceeds Standard
75 58 67 64
Exceeds Standard
25 5 10 5
Number of students tested 13 24 26 30 39
2. African American Students
Meets and Exceeds Standard
56 73 77
Exceeds Standard
5 5 5
Number of students tested 9 14 18 34 22
3. Hispanic or Latino Students
Meets and Exceeds Standard
Exceeds Standard
Number of students tested 2 1 12 8 4
4. Special Education Students
Meets and Exceeds Standard
Exceeds Standard
Number of students tested 5 9 10 6 12
5. English Language Learner Students
Meets and Exceeds Standard
Exceeds Standard
Number of students tested 2 4 6 2 3
6. Asian
Meets and Exceeds Standard
Exceeds Standard
Number of students tested 6 11 7 10 5
NOTES: Data not reported for cells with less than 15 students.
11DE3

20
STATE CRITERION-REFERENCED TESTS
Subject: Reading Grade: 3 Test: DSTP
Edition/Publication Year: Month and Year of Testing Period Publisher: Harcourt
2009-2010 2008-2009 2007-2008 2006-2007 2005-2006
Testing Month Mar Mar Mar Mar Mar
SCHOOL SCORES
Meets and Exceeds Standard 93 89 80 77 88
Exceeds Standard 41 51 71 60 57
Number of students tested 41 57 56 82 98
Percent of total students tested 98 99 99 100 99
Number of students alternatively assessed 0 0 0 0 0
Percent of students alternatively assessed 0 0 0 0 0
SUBGROUP SCORES
1. Free/Reduced-Price Meals/Socio-economic Disadvantaged Students
Meets and Exceeds Standard
82 75 52 56
Exceeds Standard
50 18 24 14
Number of students tested 13 22 24 29 36
2. African American Students
Meets and Exceeds Standard
76 61 43
Exceeds Standard
11 17 48
Number of students tested 9 7 17 33 21
3. Hispanic or Latino Students
Meets and Exceeds Standard
Exceeds Standard
Number of students tested 2 1 12 4 10
4. Special Education Students
Meets and Exceeds Standard
Exceeds Standard
Number of students tested 5 7 7 5 6
5. English Language Learner Students
Meets and Exceeds Standard
Exceeds Standard
Number of students tested 2 2 6 2 3
6. Asian
Meets and Exceeds Standard
Exceeds Standard
Number of students tested 6 9 6 5 5
NOTES: Data not reported for cells of less than 15 students
11DE3

21
STATE CRITERION-REFERENCED TESTS
Subject: Mathematics Grade: 4 Test: DSTP
Edition/Publication Year: Month and Year of Testing Period Publisher: Harcourt
2009-2010 2008-2009 2007-2008 2006-2007 2005-2006
Testing Month Mar Mar Mar Mar Mar
SCHOOL SCORES
Meets and Exceeds Standard 94 84 91 89 86
Exceeds Standard 73 49 58 57 52
Number of students tested 51 43 45 79 63
Percent of total students tested 100 98 99 100 99
Number of students alternatively assessed 0 0 0 0 0
Percent of students alternatively assessed 0 0 0 0 0
SUBGROUP SCORES
1. Free/Reduced-Price Meals/Socio-economic Disadvantaged Students
Meets and Exceeds Standard 95 76
70
Exceeds Standard 68 35
35
Number of students tested 22 17 13 13 20
2. African American Students
Meets and Exceeds Standard
81
Exceeds Standard
38
Number of students tested 11 11 13 12 16
3. Hispanic or Latino Students
Meets and Exceeds Standard
Exceeds Standard
Number of students tested 2 4 1 4 3
4. Special Education Students
Meets and Exceeds Standard
Exceeds Standard
Number of students tested 4 5 4 9 6
5. English Language Learner Students
Meets and Exceeds Standard
Exceeds Standard
Number of students tested 3 1 0 0 0
6. Asian
Meets and Exceeds Standard
Exceeds Standard
Number of students tested 8 7 2 5 4
NOTES: Data not reported for cells of less than 15 students.
11DE3
22
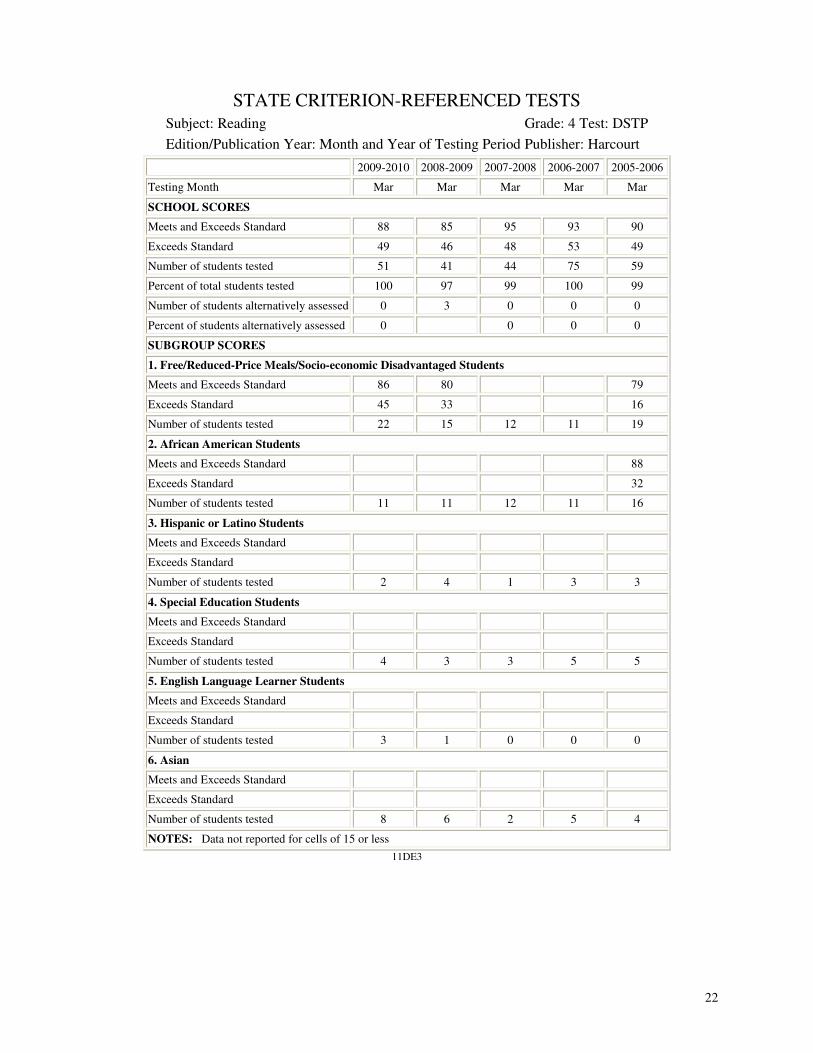
STATE CRITERION-REFERENCED TESTS
Subject: Reading Grade: 4 Test: DSTP
Edition/Publication Year: Month and Year of Testing Period Publisher: Harcourt
2009-2010 2008-2009 2007-2008 2006-2007 2005-2006
Testing Month Mar Mar Mar Mar Mar
SCHOOL SCORES
Meets and Exceeds Standard 88 85 95 93 90
Exceeds Standard 49 46 48 53 49
Number of students tested 51 41 44 75 59
Percent of total students tested 100 97 99 100 99
Number of students alternatively assessed 0 3 0 0 0
Percent of students alternatively assessed 0
0 0 0
SUBGROUP SCORES
1. Free/Reduced-Price Meals/Socio-economic Disadvantaged Students
Meets and Exceeds Standard 86 80
79
Exceeds Standard 45 33
16
Number of students tested 22 15 12 11 19
2. African American Students
Meets and Exceeds Standard
88
Exceeds Standard
32
Number of students tested 11 11 12 11 16
3. Hispanic or Latino Students
Meets and Exceeds Standard
Exceeds Standard
Number of students tested 2 4 1 3 3
4. Special Education Students
Meets and Exceeds Standard
Exceeds Standard
Number of students tested 4 3 3 5 5
5. English Language Learner Students
Meets and Exceeds Standard
Exceeds Standard
Number of students tested 3 1 0 0 0
6. Asian
Meets and Exceeds Standard
Exceeds Standard
Number of students tested 8 6 2 5 4
NOTES: Data not reported for cells of 15 or less
11DE3
23
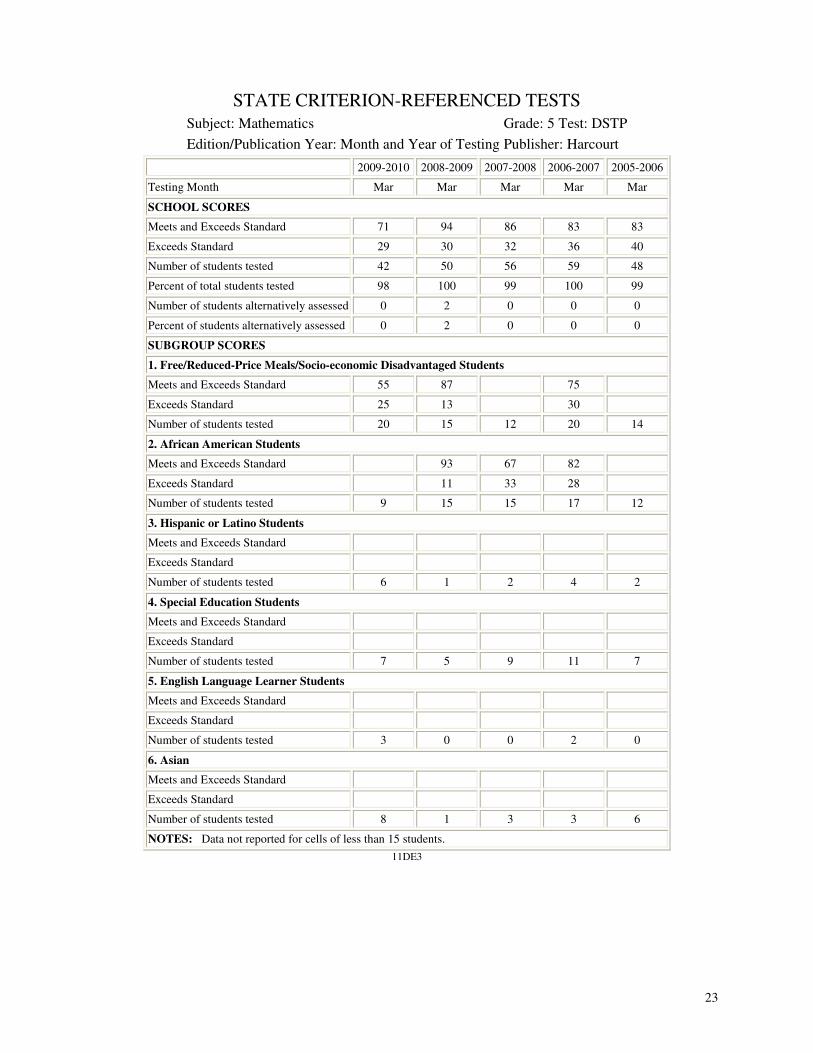
STATE CRITERION-REFERENCED TESTS
Subject: Mathematics Grade: 5 Test: DSTP
Edition/Publication Year: Month and Year of Testing Publisher: Harcourt
2009-2010 2008-2009 2007-2008 2006-2007 2005-2006
Testing Month Mar Mar Mar Mar Mar
SCHOOL SCORES
Meets and Exceeds Standard 71 94 86 83 83
Exceeds Standard 29 30 32 36 40
Number of students tested 42 50 56 59 48
Percent of total students tested 98 100 99 100 99
Number of students alternatively assessed 0 2 0 0 0
Percent of students alternatively assessed 0 2 0 0 0
SUBGROUP SCORES
1. Free/Reduced-Price Meals/Socio-economic Disadvantaged Students
Meets and Exceeds Standard 55 87
75
Exceeds Standard 25 13
30
Number of students tested 20 15 12 20 14
2. African American Students
Meets and Exceeds Standard
93 67 82
Exceeds Standard
11 33 28
Number of students tested 9 15 15 17 12
3. Hispanic or Latino Students
Meets and Exceeds Standard
Exceeds Standard
Number of students tested 6 1 2 4 2
4. Special Education Students
Meets and Exceeds Standard
Exceeds Standard
Number of students tested 7 5 9 11 7
5. English Language Learner Students
Meets and Exceeds Standard
Exceeds Standard
Number of students tested 3 0 0 2 0
6. Asian
Meets and Exceeds Standard
Exceeds Standard
Number of students tested 8 1 3 3 6
NOTES: Data not reported for cells of less than 15 students.
11DE3
24
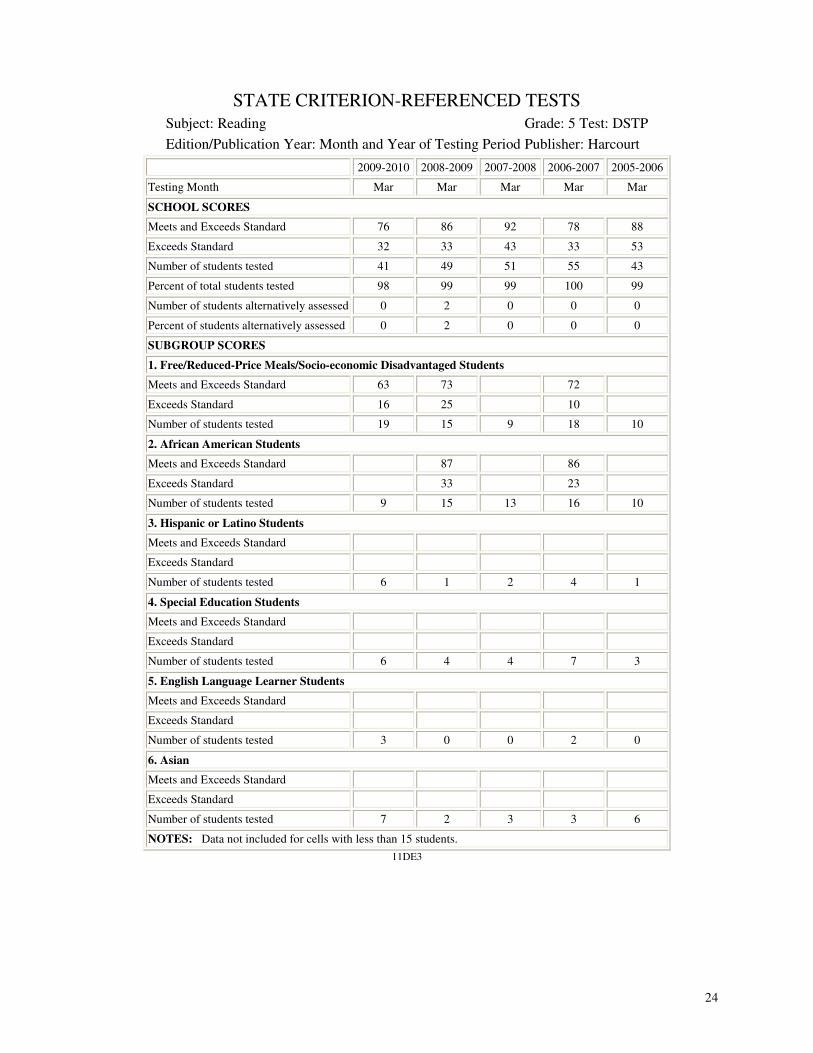
STATE CRITERION-REFERENCED TESTS
Subject: Reading Grade: 5 Test: DSTP
Edition/Publication Year: Month and Year of Testing Period Publisher: Harcourt
2009-2010 2008-2009 2007-2008 2006-2007 2005-2006
Testing Month Mar Mar Mar Mar Mar
SCHOOL SCORES
Meets and Exceeds Standard 76 86 92 78 88
Exceeds Standard 32 33 43 33 53
Number of students tested 41 49 51 55 43
Percent of total students tested 98 99 99 100 99
Number of students alternatively assessed 0 2 0 0 0
Percent of students alternatively assessed 0 2 0 0 0
SUBGROUP SCORES
1. Free/Reduced-Price Meals/Socio-economic Disadvantaged Students
Meets and Exceeds Standard 63 73
72
Exceeds Standard 16 25
10
Number of students tested 19 15 9 18 10
2. African American Students
Meets and Exceeds Standard
87
86
Exceeds Standard
33
23
Number of students tested 9 15 13 16 10
3. Hispanic or Latino Students
Meets and Exceeds Standard
Exceeds Standard
Number of students tested 6 1 2 4 1
4. Special Education Students
Meets and Exceeds Standard
Exceeds Standard
Number of students tested 6 4 4 7 3
5. English Language Learner Students
Meets and Exceeds Standard
Exceeds Standard
Number of students tested 3 0 0 2 0
6. Asian
Meets and Exceeds Standard
Exceeds Standard
Number of students tested 7 2 3 3 6
NOTES: Data not included for cells with less than 15 students.
11DE3
25
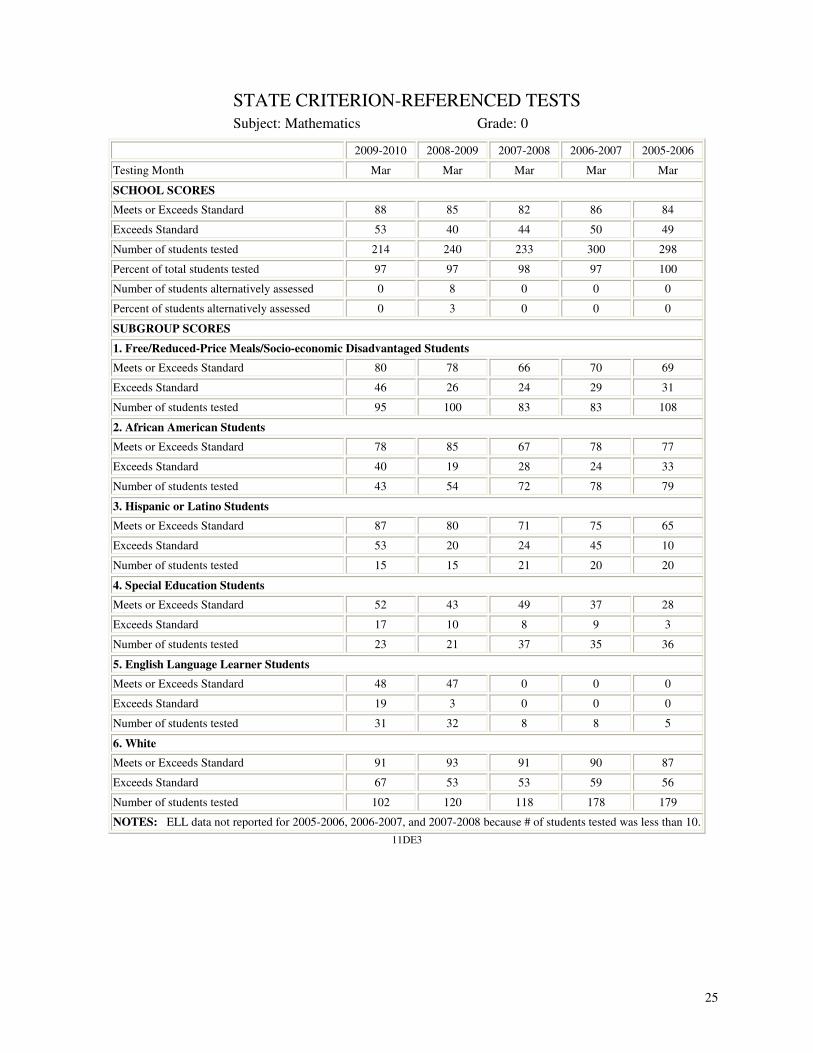
STATE CRITERION-REFERENCED TESTS
Subject: Mathematics Grade: 0
2009-2010 2008-2009 2007-2008 2006-2007 2005-2006
Testing Month Mar Mar Mar Mar Mar
SCHOOL SCORES
Meets or Exceeds Standard 88 85 82 86 84
Exceeds Standard 53 40 44 50 49
Number of students tested 214 240 233 300 298
Percent of total students tested 97 97 98 97 100
Number of students alternatively assessed 0 8 0 0 0
Percent of students alternatively assessed 0 3 0 0 0
SUBGROUP SCORES
1. Free/Reduced-Price Meals/Socio-economic Disadvantaged Students
Meets or Exceeds Standard 80 78 66 70 69
Exceeds Standard 46 26 24 29 31
Number of students tested 95 100 83 83 108
2. African American Students
Meets or Exceeds Standard 78 85 67 78 77
Exceeds Standard 40 19 28 24 33
Number of students tested 43 54 72 78 79
3. Hispanic or Latino Students
Meets or Exceeds Standard 87 80 71 75 65
Exceeds Standard 53 20 24 45 10
Number of students tested 15 15 21 20 20
4. Special Education Students
Meets or Exceeds Standard 52 43 49 37 28
Exceeds Standard 17 10 8 9 3
Number of students tested 23 21 37 35 36
5. English Language Learner Students
Meets or Exceeds Standard 48 47 0 0 0
Exceeds Standard 19 3 0 0 0
Number of students tested 31 32 8 8 5
6. White
Meets or Exceeds Standard 91 93 91 90 87
Exceeds Standard 67 53 53 59 56
Number of students tested 102 120 118 178 179
NOTES: ELL data not reported for 2005-2006, 2006-2007, and 2007-2008 because # of students tested was less than 10.
11DE3
26
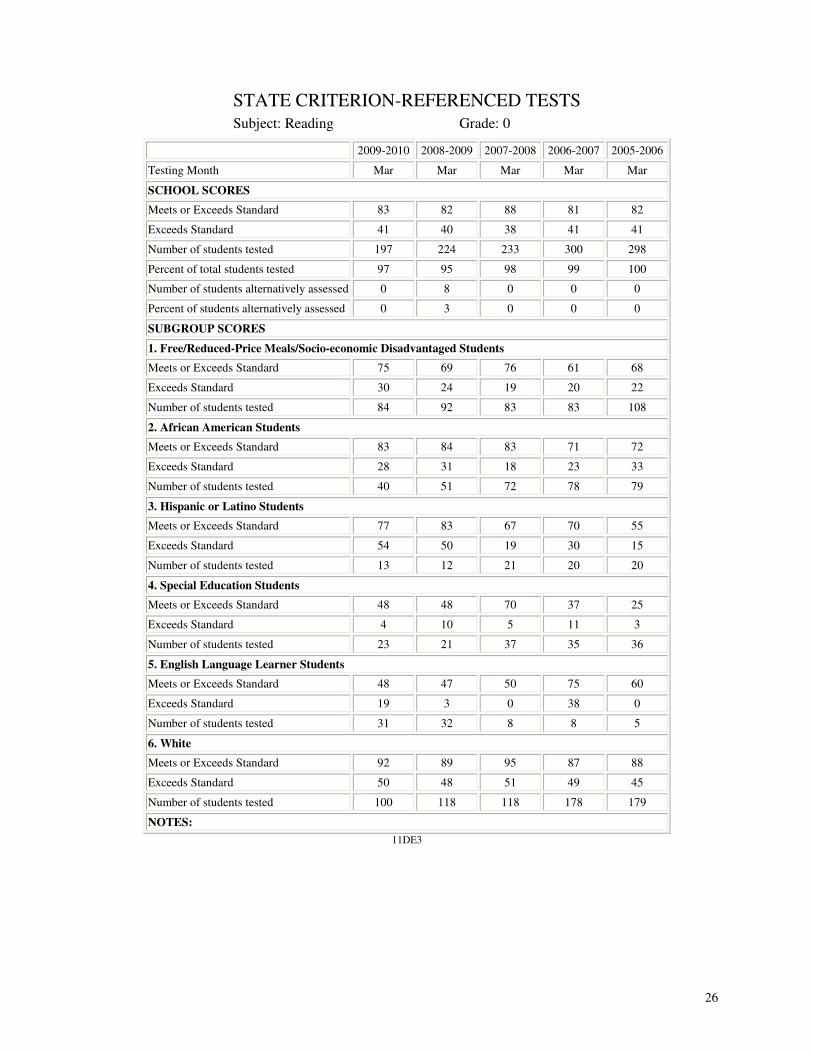
STATE CRITERION-REFERENCED TESTS
Subject: Reading Grade: 0
2009-2010 2008-2009 2007-2008 2006-2007 2005-2006
Testing Month Mar Mar Mar Mar Mar
SCHOOL SCORES
Meets or Exceeds Standard 83 82 88 81 82
Exceeds Standard 41 40 38 41 41
Number of students tested 197 224 233 300 298
Percent of total students tested 97 95 98 99 100
Number of students alternatively assessed 0 8 0 0 0
Percent of students alternatively assessed 0 3 0 0 0
SUBGROUP SCORES
1. Free/Reduced-Price Meals/Socio-economic Disadvantaged Students
Meets or Exceeds Standard 75 69 76 61 68
Exceeds Standard 30 24 19 20 22
Number of students tested 84 92 83 83 108
2. African American Students
Meets or Exceeds Standard 83 84 83 71 72
Exceeds Standard 28 31 18 23 33
Number of students tested 40 51 72 78 79
3. Hispanic or Latino Students
Meets or Exceeds Standard 77 83 67 70 55
Exceeds Standard 54 50 19 30 15
Number of students tested 13 12 21 20 20
4. Special Education Students
Meets or Exceeds Standard 48 48 70 37 25
Exceeds Standard 4 10 5 11 3
Number of students tested 23 21 37 35 36
5. English Language Learner Students
Meets or Exceeds Standard 48 47 50 75 60
Exceeds Standard 19 3 0 38 0
Number of students tested 31 32 8 8 5
6. White
Meets or Exceeds Standard 92 89 95 87 88
Exceeds Standard 50 48 51 49 45
Number of students tested 100 118 118 178 179
NOTES:
11DE3